graduation rate report 2012 - minnesota's private colleges
TRANSCRIPT

Graduation Rate Report November 2017
The 17 members of the Minnesota Private College Council (MPCC) have long been leaders in graduating students on time. This report examines graduation rates for the fall 2010 first-time, full-time cohort, and includes statewide and national comparisons and trends over time. Please note that fall 2010 cohort four- and five-year graduation rates data were not available for Minnesota State universities and thus fall 2009 cohort data were used instead
Highlights
• Our 17 member institutions have a combined four-year graduation rate of 66%.
o This compares to 53% at the University of Minnesota (all campuses), 61% at the University of Minnesota-Twin Cities and 23% at the Minnesota State universities (see pages 3 and 5).
o Our four-year graduation rate is the third highest in the nation, coming in just behind the
graduation rate for nonprofit colleges and universities in D.C. and Rhode Island. And our four-year graduation rate is higher than the public four-year institutions in every state (see pages 6 and 7).
• Our student of color four-year graduation rate of 54% is the highest in the state and higher than the
national average of 45% for nonprofits nationwide (see page 4).
Our students graduate sooner, saving them time and money
With the highest four-year graduation rate in the state, most of our students graduate on time, which means they can stop paying tuition and start working or attend graduate school. When a student takes longer to graduate, there are additional costs to factor in. Looking across sectors, the combined five-year graduation rate at the University of Minnesota is 69%, about the same as the MPCC member institution four-year graduation rate. And the six-year graduation rate for Minnesota State universities is 47%.
When calculating the true cost of earning a bachelor’s degree for most graduates at the University of Minnesota or Minnesota State, you need to account for the one or two additional years of tuition, the loss of a State Grant for those years and the opportunity cost of forgone earnings, which averaged $35,529 for students who graduated with a bachelor’s degree in Minnesota in 2013-14. Using the average net tuition for first-time, full-time students for each sector, the real cost of obtaining a bachelor’s degree from an MPCC member institution can be estimated at $57,808 for the fall 2010 cohort, compared to $66,141 at the University of Minnesota and $95,063 at Minnesota State universities (see page 8).
1
Productivity at Minnesota Private Colleges
With the highest graduation rate in the state, MPCC member institutions are more efficient in producing college graduates, which means our students are able to enter the workforce sooner. This productivity is illustrated by the fact that over 8,000 more first-time students started at public four-year institutions than at MPCC member institutions in fall 2010, but those institutions only produced 500 more graduates four years later (see page 9).
Four-year Completion Rates
The four-year completion rate is another measure that demonstrates the high on-time graduation rates at the MPCC member institutions. Starting with the fall 2010 first-time, full-time cohort and looking at all those who graduated within six years from the institution they started at, 89% of MPCC member institutions’ graduates finished in four years, compared to 74% at the University of Minnesota and 50% at Minnesota State universities (see page 10). Put another way, only 11% of the MPCC graduates from the fall 2010 cohort took more than four years to graduate, compared to 26% at the University of Minnesota and 50% at Minnesota State universities.
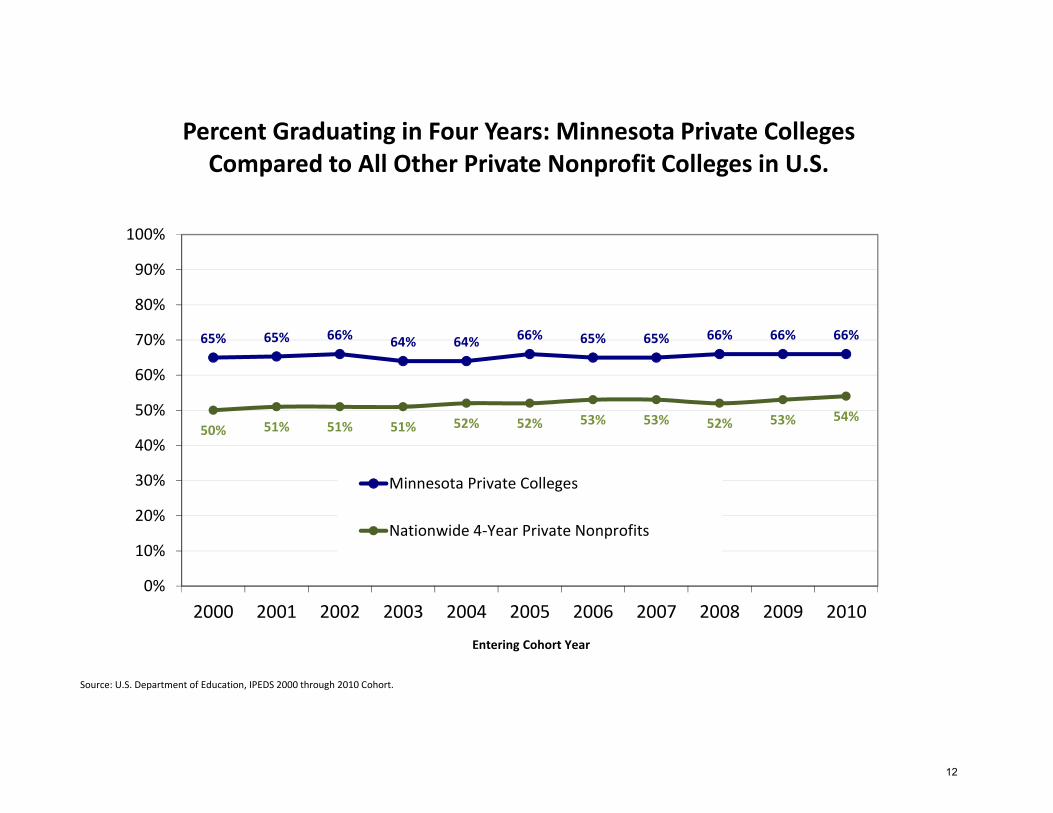
Graduation and Retention Rates, a statewide and national perspective over time
MPCC member institutions’ combined graduation rate of 66% has held steady over the past decade, and has long been the highest graduation rate in the state of Minnesota (see page 11). The four-year graduation rate for the University of Minnesota increased by 23 percentage points compared to the fall 2000 cohort, from 30% to 53%. This increase has been driven by the rising four-year graduation rate at the University of Minnesota-Twin Cities, which rose to 61% for the fall 2010 cohort, up from 37% for the fall 2000 cohort. The four-year graduation rate for Minnesota State universities has held steady over the past decade, at 23% for the fall 2010 cohort, up from 21% for the fall 2000 cohort. MPCC member institutions’ combined graduation rate has consistently been higher than the national average, which was 54% for the fall 2010 cohort (see page 12).
2

66%
53%
61%
23%
42%
54%
35%
75%71%
78%
47%
57%
66%
59%
0%
20%
40%
60%
80%
100%University of
Minnesota - Twin Cities
University of Minnesota
(all campuses)
*Fall 2009 cohort data was used for Minnesota State Universities because fall 2010 cohort data was not available.Source: U.S. Department of Education, IPEDS 2010 Cohort
Percent of Students Completing a Bachelor's Degree(First-time, full-time undergraduates who started a 4-year program in 2010)
Graduation Ratesat Minnesota and US Institutions by Sector
MPCC member
institutions
MN State Universities*
4-year 6-year
NationwidePrivate Nonprofit
Institutions NationwidePublic
Institutions
4-year 6-year 4-year 6-year 4-year 6-year 4-year 6-year4-year 6-year
Other MN Private Nonprofit
Institutions
4-year 6-year
3

54%
46%50%
13%
24%
45%
28%
66% 67%72%
34%
42%
58%53%
0%
20%
40%
60%
80%
100%
University of Minnesota - Twin
CitiesUniversity of Minnesota
(all campuses)
*Fall 2009 cohort data was used for Minnesota State Universities because fall 2010 cohort data was not available.Source: U.S. Department of Education, IPEDS 2010 Cohort
Percent of Students Completing a Bachelor's Degree(First-time, full-time undergraduates who started a 4-year program in 2010)
Student of Color Graduation Ratesat Minnesota and US Institutions by Sector
MPCCmember
institutions
MN State Universities*
4-year 6-year
NationwidePrivate Nonprofit
Institutions NationwidePublic
Institutions
4-year 6-year 4-year 6-year 4-year 6-year 4-year 6-year4-year 6-year
Other MN Private Nonprofit
Institutions
4-year 6-year
4

Grand Total WhiteAll Students of
Color
American Indian/ Alaskan
Native AsianBlack or African
American Hispanic
Native Hawaiian/
Pacific IslanderTwo or More
RacesUnknown
Race/ Ethnicity Non-resident
Bachelor's or equivalent adjusted cohort 8,973 7,053 1,403 33 454 369 340 5 202 224 293
4-year graduation rate 66% 69% 54% 33% 58% 40% 62% 80% 57% 57% 71%5-year graduation rate 74% 76% 63% 42% 68% 49% 72% 80% 66% 63% 76%6-year graduation rate 75% 77% 66% 45% 71% 53% 73% 80% 69% 67% 78%
Bachelor's or equivalent adjusted cohort 8,386 6,741 1,326 60 544 260 198 10 254 40 279
4-year graduation rate 53% 54% 46% 37% 50% 36% 48% 10% 49% 45% 56%5-year graduation rate 69% 70% 62% 48% 68% 55% 59% 50% 63% 60% 73%6-year graduation rate 71% 72% 67% 53% 76% 60% 61% 50% 67% 65% 78%
Bachelor's or equivalent adjusted cohort 8,717 7,442 1,017 36 220 324 219 4 214 108 150
4-year graduation rate 23% 25% 13% 11% 13% 10% 14% 0% 19% 27% 25%5-year graduation rate 41% 43% 27% 19% 30% 21% 32% 25% 29% 48% 47%6-year graduation rate 47% 48% 34% 25% 39% 29% 35% 50% 35% 55% 51%
Bachelor's or equivalent adjusted cohort 1,101 917 132 8 44 27 36 0 17 41 11
4-year graduation rate 42% 45% 24% 13% 32% 15% 22% na 29% 34% 18%5-year graduation rate 55% 58% 40% 13% 52% 33% 33% na 47% 44% 36%6-year graduation rate 57% 59% 42% 13% 52% 37% 36% na 53% 44% 36%
Bachelor's or equivalent adjusted cohort 530 304 100 6 25 36 26 0 7 124 2
4-year graduation rate 20% 26% 15% 0% 32% 6% 12% na 29% 7% 50%5-year graduation rate 25% 31% 20% 17% 32% 17% 12% na 29% 15% 50%6-year graduation rate 26% 32% 22% 17% 36% 19% 12% na 29% 15% 50%
Bachelor's or equivalent adjusted cohort 27,707 22,457 3,978 143 1,287 1,016 819 19 694 537 735
4-year graduation rate 47% 48% 39% 27% 45% 28% 42% 26% 41% 37% 55%5-year graduation rate 60% 62% 52% 36% 60% 40% 54% 53% 53% 47% 68%6-year graduation rate 63% 65% 56% 41% 66% 46% 57% 58% 57% 51% 72%
*Fall 2009 cohort data was used for Minnesota State Universities because fall 2010 cohort data was not available. This also affects the total. Source: U.S. Department of Education, IPEDS 2010 Cohort, 2009 Cohort for Minnesota State universitiesAnalysis: Minnesota Private College Council, August 017Note: Calculation for Students of Color does not include unknown race/ethnicity or nonresidents
Grand Total*
2015-16 Minnesota Postsecondary Graduation Rates by Sector by Race (Class Starting in 2010)*
Minnesota Private Colleges (MPCC)
University of Minnesota
Minnesota State Universities(fall 2009 cohort data)
Other MN Private Nonprofit Colleges (4-Year)
Private For-profit Colleges (4-Year)
5

0%17%
22%23%
27%28%
30%31%31%
33%34%34%
36%36%
37%39%39%40%40%41%
42%43%
44%47%47%48%48%48%49%49%50%50%
53%53%54%54%
55%59%59%60%60%60%
61%61%
63%64%64%64%64%
66%67%67%
0% 10% 20% 30% 40% 50% 60% 70% 80%
WYDEID
NVHI
UTNMAZALAKKS
MTWVNDMSSCKYOKFL
ARMIVASDTNTX
WAGALA
MONCNJWINEOH
ILIA
NYCOIN
NHORVTPACAMEMN
CTMAMD
MPCC Institutions*RI
DC
Private Nonprofit Four-year Graduation Rates by State
Source: U.S. Department of Education, IPEDS, 2010 cohortAnalysis by Minnesota Private College Council
* "MPCC Institutions" includes the 17 privatenonprofits that are members of the Minnesota Private College Council.
"Minnesota" includes an additional 7 private nonprofit institutions.
6

10%13%
16%16%
19%20%
22%22%
24%24%24%
26%26%26%26%26%27%27%28%
29%29%30%30%30%
31%32%32%
35%35%35%35%36%37%
38%41%41%41%42%
43%44%44%44%44%44%
45%46%46%
51%53%
58%62%
66%
0% 10% 20% 30% 40% 50% 60% 70%
AKDC
NMNVID
UTMT
HINDTNLAGAARNEOK
WVWYSDKY
MSTXAL
MEKSWIOH
MOORCORIINMICA
MNILFL
NCMDCT
MANYPAAZSCNJ
WAIAVTVANHDE
MPCC Institutions*
Public Four-year Graduation Rates by State
* "MPCC Institutions" includes the 17 privatenonprofits that are members of the Minnesota Private College Council.
Source: U.S. Department of Education, IPEDS, 2010 cohortAnalysis by Minnesota Private College Council. Fall 2009 cohort data was used for Minnesota State institutions because 2010 cohort data was unavailable.
7

$57,808
$22,820$15,624
$7,792
$4,757$3,624
$35,529$35,529
$35,529
$0
$30,000
$60,000
$90,000
$120,000
Minnesota Private Colleges University of Minnesota MN State Universities*
Comparing College Costs in Minnesota: Length of Time to Graduation and the Opportunity Cost of Lost Earnings
Lost earnings in 6th year of college
Lost earnings in 5th year of college
Net tuition for 6th year
Net tuition for 5th year
Net tuition for 4 years
Total: $57,808
Total: $95,063
Total: $66,141
4-year grad rate 66% 5-year grad rate 69% 6-year grad rate 47%
Sources : IPEDS graduation rate and financial aid data for 2010 first-time full-time cohort, lost earnings of $35,529 based on data from Graduate Employment Outcomes Data from MN DEED for 2013-14 Graduates Second Year After Graduation.*Fall 2009 cohort data was used for Minnesota State Universities because fall 2010 cohort data was not available.Notes: Assumes same net tuition for first four years. Net tuition for fifith and six years based on same data but excludes State Grant due to four year eligibility cap.
When comparing college costs one needs to weigh how long it will likely take to earn a degree.
For the 17 institutions in the Minnesota Private College Council, the 4-year gradrate for first-time full-time students is 66%; this compares to 52% at the U of M system and 23% at Minnesota State universities. This means that our studentsare more likely to graduate on time, stoppaying tuition and start working.
Looking across sectors, our 4-year grad rate is about the same as the 5-year grad rate at the U of M. And for Minnesota State the 6-year grad rate is still below our 4-year grad rate but is the best point of comparison. So in taking longer to graduate, there are additional costs to factor in. These include the one or two additional years of tuition, the loss of State Grant for those years and the opportunity cost of forgone earnings —averaging $35,529 for students who graduated in 2013-14.
In the end the real cost of earning abachelor's degree at a an MPCC member institution is estimated to be less than at the Minnesota public systems.
8

(20,000) (15,000) (10,000) (5,000) - 5,000 10,000
Minnesota Higher Education Pipeline:Number of Students Graduating in Four Years by Sector
Entering First-time Full-time 2010 Cohort* Number Graduating After 4 Years
Minnesota Private Colleges
Minnesota Public 4-Year Institutions 17,103
8,973
Source: U.S. Department of Education, IPEDS fall 2010 Cohort*Note: Fall 2009 cohort data used for Minnesota State because fall 2010 cohort data was unavailable.
5,947
6,465
9

Starting with the fall 2010 first-time, full-time cohort…
Graduated within
four years
Graduated within
6 years
Completion Rate: Share of those graduating who completed in 4 years
MPCC 5,947 / 6,718 = 89%
U of M 4,432 / 5,992 = 74%
MN State* 2,033 / 4,073 = 50% Source: IPEDS graduation rate data.
*Fall 2009 cohort data was used for Minnesota State Universities because fall 2010 cohort data was not available.
10

65% 66%
30%
53%
37%
61%
21% 23%
34%42%
0%
10%
20%
30%
40%
50%
60%
70%
80%
90%
100%
2000 2001 2002 2003 2004 2005 2006 2007 2008 2009 2010Entering Cohort Year
Minnesota Graduation Rate Trends: Percent of Cohort Graduating in Four Years by Sector
Minnesota Private CollegesUniversity of MinnesotaUniversity of Minnesota - Twin Cities Campus OnlyMinnesota State Universities*Other MN Private Nonprofits
Source: U.S. Department of Education, IPEDS 2000 through 2010 Cohort.
MPCC +5 percentage pts
U of M +23 percentage pts
Other MN Nonprofits
+8percentage
MN State Universities+2 percentage pts
U of M-TC +24 perecentage pts
Change since 2000
*IPEDS Fall 2009 cohort data used for fall 2010 for Minnesota State because fall 2010 data was unavailable.
11
65% 65% 66% 64% 64% 66% 65% 65% 66% 66% 66%
50% 51% 51% 51% 52% 52% 53% 53% 52% 53% 54%
0%
10%
20%
30%
40%
50%
60%
70%
80%
90%
100%
2000 2001 2002 2003 2004 2005 2006 2007 2008 2009 2010Entering Cohort Year
Percent Graduating in Four Years: Minnesota Private Colleges Compared to All Other Private Nonprofit Colleges in U.S.
Minnesota Private Colleges
Nationwide 4-Year Private Nonprofits
Source: U.S. Department of Education, IPEDS 2000 through 2010 Cohort.
12