the economic impact of prolonged political instability: a ... 26_the impact of political... · i...
TRANSCRIPT

i
NATSEM Working Paper 14/26
The Economic Impact of Prolonged Political Instability: A Case Study of Fiji
Xiaodong Gong and Maheshwar Rao
September 2014

ii
ABOUT NATSEM
The National Centre for Social and Economic Modelling was established on 1 January 1993,
and supports its activities through research grants, commissioned research and longer term
contracts for model maintenance and development.
NATSEM aims to be a key contributor to social and economic policy debate and analysis by
developing models of the highest quality, undertaking independent and impartial research,
and supplying valued consultancy services.
Policy changes often have to be made without sufficient information about either the
current environment or the consequences of change. NATSEM specialises in analysing data
and producing models so that decision makers have the best possible quantitative
information on which to base their decisions.
NATSEM has an international reputation as a centre of excellence for analysing microdata
and constructing microsimulation models. Such data and models commence with the records
of real (but unidentifiable) Australians. Analysis typically begins by looking at either the
characteristics or the impact of a policy change on an individual household, building up to
the bigger picture by looking at many individual cases through the use of large datasets.
It must be emphasised that NATSEM does not have views on policy. All opinions are the
authors’ own and are not necessarily shared by NATSEM.
© NATSEM-IGPA, University of Canberra 2014
All rights reserved. Apart from fair dealing for the purposes of research or private study, or
criticism or review, as permitted under the Copyright Act 1968, no part of this publication
may be reproduced, stored or transmitted in any form or by any means without the prior
permission in writing of the publisher.
National Centre for Social and Economic Modelling, Institute for Governance and Policy
Analysis (IGPA), University of Canberra ACT 2601 Australia Phone + 61 2 6201 2780
Fax + 61 2 6201 2751
Email [email protected]
Website www.natsem.canberra.edu.au

iii
CONTENTS
About NATSEM ii
Contents iii
Author note iv
General caveat iv
Abstract v
1 Introduction 6
2 Background: Fiji’s Post-Independence Political Instability and Economic Performance 7
3 The Synthetic Control Method 10
4 Data 11
5 Results and Discussion 13
6 Placebo tests 16
7 Robustness Tests 21
8 Conclusions 22
References 23
Appendix 27
iv
AUTHOR NOTE
Xiaodong Gong is an Associate Professor, the Institute of Governance and Policy Analysis
(IGPA), University of Canberra. Maheshwar Rao is an Assistant Professor at IGPA,
University of Canberra. Both authors have equally contributed to the paper. Corresponding
author: Maheshwar Rao, Email: [email protected]
GENERAL CAVEAT
NATSEM research findings are generally based on estimated characteristics of the
population. Such estimates are usually derived from the application of microsimulation
modelling techniques to microdata based on sample surveys.
These estimates may be different from the actual characteristics of the population because
of sampling and nonsampling errors in the microdata and because of the assumptions
underlying the modelling techniques.
The microdata do not contain any information that enables identification of the individuals
or families to which they refer.
The citation for this paper is: Gong, X. and Rao, M. (2014) “The Economic Impact of
Prolonged Political Instability: A Case Study of Fiji”, NATSEM Working Paper 2014/26,
NATSEM-IGPA: Canberra

v
ABSTRACT
It has been long believed that prolonged political instability harms economic growth and
development. This paper contributes to this growing empirical literature by studying the
case in Fiji, which has faced a long period of political instability underpinned by a series of
coups, military administrations and frequent changes in government since 1987. The
impact of political instability on growth is hard to identify empirically because the
counterfactual is unobserved and it is difficult to find valid comparisons. To solve this
problem, we use the recently developed Synthetic Control Method to construct a
counterfactual (or synthetic Fiji) that predicts the growth of a politically stable Fiji. The
difference in per capita growth trajectories of the synthetic and the actual Fiji can thus be
attributed as the impacts of political instability. Our findings show that the political
instability caused by a series of coups since 1987 has indeed led Fiji onto a lower growth
path, and that the accumulated effect is getting larger.
Key Words: political instability, economic growth, Synthetic Control Method, Fiji
JEL Codes: O43, O56
6
1 INTRODUCTION
In this paper, we revisit the impact of political instability on the country’s economic growth,
using Fiji, which has experienced a number of coups and periods of military rule since 1987, as a
case study. Long term, sustained political instability harms economic growth and development
because the uncertainty associated with an unstable political environment may reduce
investment (see for example, Schneider and Frey, 1985; Rodrik, 1989; Barro, 1991a, 1991b; Barro
and Lee, 1994; Fielding, 1999 and Feng, 2001) or cause high levels or volatility of inflation (e.g.,
Cukierman, et al., 1992; Acemoglu et al., 2003; and Aisen and Veiga, 2005, 2006a, 2006b). A vast
literature has devoted to estimate such effects empirically. While most studies do report
significant effects of political instability on economic growth (Barro, 1991a; Alesina, et al., 1996;
Gurgul and Lach, 2013; Aisen and Veiga, 2013), some studies for example, Campo and Nugent
(2002) do not find any significant relationship between the two.
Studies in the early literature (for example Barro 1991a), which often use data of cross-section of
countries, face an identification issue caused by the potential endogeneity of political instability
measures. One of the problems is the unobserved heterogeneity among countries---
characteristics of certain countries that are often unobserved to the researchers may make them
more prone to political instability then others, and/or, lead to slower growth than others. Thus,
direct comparison of these two groups of countries may not identify the impact of political
instability consistently. Another is the simultaneity of economic performance and political
instability.
Various attempts have been made to address this issue in later studies. For example, Alesine et
al. (1996), estimate a simultaneous equation model of economic growth and political stability
with lagged political stability variables as instruments. They find a significant reverse causation
between economic growth and the political stability at least for some measures of political
instability. However, the validity of lagged political instability as instruments is questionable
especially when the effects of certain factors are persistent over time. More recently, Aisen and
Veiga (2013), estimate a dynamic panel data model of economic growth with the Arellano-Bond
estimator, which uses differenced lagged variables as the instruments. One common assumption
of these studies is that the impact of political instability is constant over time (and cross country),
which does not allow for the accumulated effect of sustained periods of political instability.
In this paper, we take the approach of comparative study, and use the Synthetic Control Method
proposed by Abadie and Gardeazabal (2003) and Abadie et al. (2010 and 2014) to overcome the
potential heterogeneity issue and allow the impact of political instability to accumulate over
time.
We use a combination of 13 Commonwealth countries with population less than ten million
persons to construct a ‘synthetic’ Fiji which resembles relevant economic characteristics of Fiji
before the coup period in 1987. The effect of political instability on economic growth is identified
by comparing the subsequent trajectory of post-coup economic growth of the real Fiji with that
of this ‘synthetic’ or counterfactual Fiji. One of the advantages of synthetic control over a single
comparison country is that it maximises comparability. Abadie et al. (2014) show that even only
having two units in the control group substantially improves the “goodness of fit” of the
7
estimated counterfactual compared to a single country. Another advantage is that it allows the
estimation of the accumulated effects of the intervention.
A small number of studies for Fiji can also be found. Gounder (2002) estimated a Solow-type
growth model using times series data from 1968 to 1996. She finds that military coups negatively
affect growth, and this negative impact of the military coups can be larger in non-democratic
regimes. Using a computable general equilibrium (CGE) model, Narayan and Prasad (2006)
simulated the impacts of the 2000 coup on Fijian economy, assuming the coup brought shocks to
a selected number of economic indicators (e.g., visitor arrivals, investment, capital flight,
construction activity, government expenditure, and interest rate that are shocked). Both studies
involve strong and ad hoc assumptions.
To conduct the analysis, we construct an annual country-level panel data set for the period 1970-
2011 for the analysis from three sources: Penn World Table, version 8.0 (Feenstra, et al., 2013) for
per capita GDP1, Barro and Lee (1993, 2013)2 for education attainment, and World Development
Indicators (WDI)3 for other variables.
Our results show that political instability incurred by a series of coups since 1987 has forced Fiji
onto a lower growth path. This is in sharp contrast to the claims that the economy, following the
coups, would be returned to healthy growth (Narsey, 2007). Specifically, our results show that
without the coups, Fiji’s per capita GDP in 2011 could have been 2.3 times larger than what
currently is.
The rest of the paper is organised as follows. The next section (section 2) gives some background
information about Fiji’s turbulent political history in the post-independence period and
summarises its economic performance in this period. Section 3 describes the synthetic control
method. Section 4 provides a description of the data and variables used in the study. In section 5,
we present the results. In the section, we also discuss the significance of the estimates and some
robustness tests. In section 6, we conclude.
2 BACKGROUND: FIJI’S POST-INDEPENDENCE POLITICAL INSTABILITY AND
ECONOMIC PERFORMANCE
Fiji, a former British colony and a small Commonwealth country in the Southwest Pacific Ocean,
gained independence from Great Britain in 1970. Fiji’s post-independence political history seems
to be closely tied to its demography and the associated inter-ethnic tensions, which is further
compounded by the nature of property rights in Fiji. It can be characterised as one that started
with a stable parliamentary democracy and followed by a long period of political instability.
1 Per capita GDP is not given in the Penn Tables. We divide real GDP in PPP 2005 US dollars by population (both available
in Penn Tables) to calculate the per capita GDP in PPP 2005 US dollars.
2 Available at www.barrolee.com. We used education attainment (defined as secondary and tertiary school completions) for
the percentage of population aged 25 years and over. See Barro and Lee (1993, 2013) for the estimation and description
of the dataset.
3 Available at www.databank.worldbank.org.

8
Fiji’s population consists of two major demographic groups. According to 1966 population
census, Fiji’s population comprised of around 42 percent Fijians and 51 percent Indo-Fijians.4 The
indigenous Fijian are mostly communal landowners who currently own around 90 percent of all
the land in Fiji. The majority of the Indo-Fijians are descendants of indentured brought by the
British from India to work in sugar plantations and over the years have become, as a community,
a significant economic and political force in the country. After the abolition of the indenture
system, they remained primarily as independent smallholder canefarmers largely leasing land
from the Fijian communal landowners.
After independence, a parliamentary democracy was established in which the two major
political parties dominated politics in Fiji: the Alliance Party largely drawing their political
support from Fijians; and the National Federation Party, drawing support from the Indo-Fijian
community. The Fijian dominated Alliance Party governed Fiji from 1970-1986, with the National
Federation Party in the opposition. During this period, Fiji did enjoy a period of political stability
and economic growth: constitutional governments were formed by regular elections and the per
capita GDP grew at about 2.3 percent annually (as shown in Figure 1). This growth rate was
good for a young small isolated island economy that broke free from colonial rule to chart its
own future. This period of political stability came to an end in 1987 when an Indo-Fijian
dominated Coalition government took the power for the first time since independence. Since
then, Fiji experienced 4 coups, 4 constitutional reviews (3 constitutions were abrogated), 12 years
of military rule by decree and 6 elections in 13 years.
Over the years, the Indo-Fijians as community have become more significant in terms of
economic and political force. A third major political party, the Fiji Labour Party formed in mid-
1980s, a party that had roots in the union movement and drew support from more diversified
multi-ethnic groups, gained strength. As a result, a Fiji Labour Party/National Federation Party
Coalition won election in April, 1987 for the first time since independence. While the Prime
Minister of this Coalition government was an ethnic Fijian, the majority of the cabinet positions
were held by Indo-Fijians. In May 1987, the military, which mainly consists of indigenous Fijians,
overthrew the government in a coup within a month of taking power. A second coup followed
only four months later, in September, 1987. The military administration established in the
aftermath of the coups held the power until 1991 and re-wrote the constitution in 1990, which
favoured heavily the indigenous Fijians. In 1992, a newly formed Fijian political party came into
power through a constitutional election. The constitution written under the military
administration was not accepted by large sections of the Fiji community, lacked credibility
internationally, and caused further discontent among Fiji’s population. In 1997, the constitution
was re-written again after a constitutional review and an extensive consultative process with
cooperation and participation of all political parties and the wider community. Elections were
held in 1999 under the 1997 constitution and the Fiji Labour Party won the election and with
smaller parties formed a coalition government. But only about a year later, this elected
government, was again overthrown in a military coup in May 2000. An election in 2001 saw
another new Fijian political party returned to power, but was overthrown in a military coup in
4 The demographic structure of Fiji has changed dramatically since the coup of 1987. In 2007 census, the share of the Indo-
Fijian population comprised around 37 percent (both due to falling birth rates and an increase rates migration) and the
Fijian share had risen to 58 percent.

9
December 2006. The military government formed in the aftermath of the coup currently holds
power with elections expected in 2014 under yet another new constitution.
The coups (in 1987 and 2000) disposed governments that were largely Indo-Fijian dominated and
espoused liberal social democratic policies. In each of these coups, the Fiji Military Forces played
prominent roles both during and in the aftermath of the coups. Constitutions were abrogated
and military administrations installed after each coup. They were supported by the indigenous
Fijians for fear that under Indo-Fijian dominated governments, the Fijian interests and welfare,
including land rights and culture would be alienated, even though the land rights and Fijian
interests were protected in the constitutions. For many indigenous Fijians, the coups were “acts
designed to protect Fijian interests and to strengthen the place of Fijians in Fiji” (Robertson and
Sutherland, p. xvii, 2001). It seems that after repeated coups the military has become one of a
political force in its own right---they disposed a constitutionally elected government dominated
by indigenous Fijians in 2006. For more analysis of the coups, see Robertson and Tamanisau
(1988), Robertson and Sutherland (2001), Field et al. (2005), and Fraenkel, et al. (2009).
Figure 1: Average annual percentage growth in per capita GDP
The putsches sowed the seeds of political instability by replacing elected governments by force
rather than through the regular constitutional means of transferring power. The two coups in
1987 damaged the prospects for growth. As probably expected, the economic growth stalled. As
can be seen in Figure 1, per capita GDP grew at annual rate of only by 0.4 percent in the period
of 1987-1999 and declined at an average annual rate of 3.1 percent from 2000 to 2011 between
which Fiji experienced two more coups.
2.3
0.4
-3.1
-4
-3
-2
-1
0
1
2
3
1970-86 1987-99 2000-11
Ave
rage
per
cap
ita
grw
oth
rat
e (%
)
Years

10
3 THE SYNTHETIC CONTROL METHOD
First proposed by Abadie and Gardeazabal (2003) and developed further in Abadie et al (2010),
the Synthetic Control Method has become a popular method that is widely used in comparative
studies to identify the causal impact of certain significant events or interventions on some
outcomes.5 In empirical studies, it is often difficult to find one single unexposed unit that
approximates the exposed unit in the periods prior to the intervention. And a simple comparison
of the evolution of such pairs would not be able to separate the effect of the political instabilities
from those of pre-intervention differences in economic growth determinants. The idea of this
method is to compare the trajectory of post-intervention variables of interest of affected/exposed
unit (e.g., country, firm, or individual) with that of a weighted combination of similar but
unaffected or unexposed units. The latter is a synthetic control of the exposed unit, which plays
the role of a counterfactual. In constructing such a synthetic control, this data-driven procedure
chooses and assigns weights to the control units from a sample based on their similarity to the
exposed unit in terms of the predictors (or covariates) of the variable of interest in the periods
prior to the intervention, such that the trajectory of the synthetic control resembles that of the
exposed unit as close as possible until the intervention. Under assumptions that are similar to
those in the difference-in-differences methods6, the effects of the intervention can be identified.
In fact, this method is an extension of the differences-in-differences approach where the
difference of the pre- and post- intervention outcomes for the units exposed to interventions are
compared to that for the comparable units that are not exposed to the intervention. The salient
features of this method compared to the differences-in-difference methods are that there are
usually only one intervened unit and a number of potential comparison units, and the effects of
the intervention can be variable and accumulative.
Specifically, assuming we observe the outcome variable, per capita GDP, for a panel of
countries over years, in which the first country is Fiji, the country that experienced
political instability since , the year of 1987, and the others are available control
countries (or donor pool). The first years is the pre-intervention period (where no coup
occurred) and ( is the post intervention period. Let be a vector of the
values of real per capita GDP for Fiji during the period, and be a matrix of the values of
that variable for control countries in the donor pool. Suppose is a vector,
where its component ∑ represents the weight of country in synthetic
Fiji. Obviously, each different would generate a different ‘synthetic’ Fiji. Our goal is to find
among them, a , to approximate the per capita GDP path of Fiji in the absence of coups,
calculated as
, such that the path is as close as possible to that of real Fiji until .
Denote as a vector of pre-coup characteristics for Fiji that determine its economic
5 The Synthetic Control Method has found wide applicability in estimating the effects of events and interventions across
many disciplines and areas of interest. Examples include: Liou and Musgrave (2013), the effects of resource income on
democratisation; Mideksa (2013), the economic impact of natural resources; Fowler (2013) and Carey and Horiuchi
(2013), the effect of compulsory voting on voter turnout; Montalvo (2011), the effect of timing of terrorist attacks on
democratic election outcomes; Nannicini and Ricciuti (2010), the effect of autocratic transitions on growth; Billmeier
and Nannicini (2013), the effect of trade liberalisation; Cavallo, et al. (2013) and Coffman and Noy (2011), the effect of
natural disasters; Singhal and Nilakantan (2012), security response on terrorism; and Abadie et al. (2014), the impact of
the 1990 German reunification.
6 A large literature exists using the differences-in-difference methods. See, for example, Card (1990), Card and Kruger
(1994), and a recent literature review by Imbens and Wooldridge (2009).

11
performance (such as endowments in land, labour force, and human capital, economic structure,
and its past performance, etc., see below for details), and as a matrix of the values of
those variables for the countries in the donor pool. Let be some symmetric positive
semi-definite matrix, the nonnegative elements of which reflect the relative importance of those
characteristics. The optimal weights of control countries, is chosen such that the distance
function between the counterfactual Fiji and real Fiji in terms of those pre-coup characteristics is
minimised:
The accumulative effect of political instability at year can be calculated as
where and
are the -th element of and , respectively.
It is clear that depends upon the choice of . While it is possible to choose based on one’s
subjective evaluation of the predictive power of the variables in and , we follow Abadie and
Gardeazabal (2003) and Abadie et al. (2010) to choose through a data driven process, in which
is obtained after assigning weights to linear combinations of and to minimise the mean
squared predictive error (MSPE) of the outcome variable over the pre-coup period. For more
details of the methods, see Abadie and Gardeazabal (2003) and Abadie et al (2010).
4 DATA
We use annual country-level panel data for the period 1970-2011 for the analysis. The variables
include per capita GDP and a number of indicators that are possible predictors or covariates of
GDP, including population size, arable land per capita, openness (ratio of trade over GDP), size
of agriculture relative to the whole economy (ratio between agriculture output and GDP), and
education attainment rates of tertiary and primary schools. These covariates appear in typical
growth equations (such as Barro, 1991a; Sala-I-Martin, 1997; Abadie, 2003; and Mideksa, 2013):
population proxies for labour, investment and education attainment for physical and human
capital stock respectively, agriculture share and trade openness capture the structure of the
economy. The data are drawn from three sources. Per capita GDP is calculated7 from Penn
World Table, version 8.0 (Feenstra, et al., 2013). Education attainment is from Barro and Lee
(1993, 2013)8. Data for the other variables are from World Development Indicators (WDI), The
World Bank.9,10 1970 is a natural choice for the starting year of our study, when Fiji gained
independence from the British. It is also when the data are first available for many of the
7 Per capita GDP is not given in the Penn Tables. We divide real GDP in PPP 2005 US dollars by population (both available
in Penn Tables) to calculate the per capita GDP in PPP 2005 US dollars.
8 Available at www.barrolee.com.
9 Available at www.databank.worldbank.org.
10 For some countries, a few indicators are missing for a few years in the early period. In such cases, the shortened series are
used. For details of the data availability see Table A in the appendix.

12
countries for comparison. The first coup in Fiji occurred in 1987. This gives us 17 years of pre-
intervention data, relatively long for the method to work.
For the synthetic control method to work, it is better for the countries in the control pool to be
similar to Fiji in the pre-intervention period. Since Fiji is a small Commonwealth country, we
choose 33 of the 53 Commonwealth countries that were with a population of less 10 million in
2011 as the potential control pool. However, some key relevant variables are not available for 19
of the smaller countries in African, Caribbean and the Pacific regions. We also excluded one
country---Sierra Leone, which experienced coups in the study period. Thus, we end up with 14
countries in the sample, 13 of those in the donor pool and Fiji as the treated country (The list of
countries is in Table 3 below). Note the countries in the sample are geographically widely
spread, thus any possibility of interference between countries is minimised, which satisfies the
assumption of non-interference between units for the method to work.
Table 1. Comparison of average pre-coup characteristics of actual Fiji and the control
countries
Variables Fiji
(1)
Control countries
(2)
Investment/GDP (%) 20.30 26.93 (5.66)
Population (millions) 0.62 0.91 (0.91)
Agriculture/GDP (%) 22.50 14.04 (9.65)
Trade/GDP (%) 94.30 129.62 (61.91)
Per Capita Arable Land (hectares) 0.14 0.21 (0.24)
Tertiary School Completion (%) 2.30 2.38 (2.89)
Primary School Completion (%) 21.30 22.66 (14.64)
Per Capita GDP (in PPP 2005 $US) 4,125 8,281 (6,777)
Standard deviations are in the parentheses.
In Table 1, we present the average values of characteristics over the period until coup for actual
Fiji, and the mean of 13 countries11 in the donor pool. We can see clearly from Table 1 that
although the values of those characteristics for Fiji is in similar proximity of those for the average
of the 13 countries in the donor pool (that did not experience any coups in 1970-1987), many of
them are substantially different. For example, the average country is larger in population and
arable land, better educated, and richer. Figure 2 compares the per capita GDP of Fiji and the
average per capita GDP for 13 countries in the donor pool. The figure shows that the economy of
the average country grew steadily over most of the whole period between 1970 and 2011, but the
11
First, we take the average value of the pre-coup characteristics for each country in the donor pool (similar to the
calculation of the average values for actual Fiji). The mean is simply the average of these values of the countries in the
donor pool. The standard deviations (in brackets in Table 1) are the variations among the countries in the donor pool
from their pre-coup average values.

13
upward trend of Fiji’s economy was only in the first period. Thus, the simple average of those
countries does not seem to provide a suitable control group for Fiji.
Figure 2: Average per capita GDP of Fiji and average of donor countries (PPP $’000)
5 RESULTS AND DISCUSSION
Table 2 displays the weights of each control country in synthetic Fiji, obtained using the
procedure described above. They indicate that the per capita GDP growth trajectory of Fiji in the
pre-1987 (pre-coup) period is best reproduced by a combination of Belize, Malta, Mauritius and
Trinidad and Tobago. Belize contributes 84.1 percent, Malta 12.3 percent, NZ 2.9 percent and
Trinidad and Tobago 0.06 percent to synthetic Fiji.
In Table 3 we present the pre-coup period characteristics of synthetic Fiji together with those of
actual Fiji, and Belize. The relative weights of each predictor and per capita GDP (components of
) are also presented in the column 4.
0
2
4
6
8
10
12
14
16
18
20
1970 1975 1980 1985 1990 1995 2000 2005 2010
Per
cap
ita
GD
P (
PP
P U
S$'0
00)
Year
Fiji
Control countries

14
Table 2: Weights for each control country in the donor pool
Control Countries Weights
Barbados 0
Botswana 0
Cyprus 0
Lesotho 0
Malta 0.123
Mauritius 0.029
NZ 0
Singapore 0
Trinidad & Tobago 0.006
Belize 0.841
Dominica 0
St Vincent & Grenadines 0
Swaziland 0
Total 1
The large contribution by Belize comes as no surprise as the Belize economy shares many
similarities with Fiji economy in the pre-coup period. For example, per capita GDP for Fiji in
1970 was $US3,052 compared Belize’s US$3,233. In 1986, a year before the coup in Fiji, per capita
GDP for Fiji and Belize was $US4,258 and US$3,987 respectively. Fiji and Belize were also quite
similar in terms of economic structure in the pre-invention period. The average share of
agriculture, industry and service sector in GDP in the pre-intervention period for Fiji were
around 23 percent, 21 percent and 56 percent, respectively. For Belize, these average shares were
around 25 percent, 26 percent and 49 percent. In fact, both countries’ main industries are similar.
For example, sugar, fishing, clothing, wood products, and tourism are the main exporting
products of both countries. The average ratio of investment and GDP in the pre-intervention
period was 20 and 21 percent for Fiji and Belize respectively. Both economies were quite open---
with Belize having greater trade openness (123 percent) compared to Fiji (94 percent).
Results show that the importance of population, primary and tertiary education and per capita
arable land are small or zero, so they do not have substantial power in predicting the per capita
GDP in the pre-coup period. Those predictors that are important in constructing the synthetic Fiji
for example, investment rate, agriculture share and per capita GDP, are fairly similar between
the two Fiji’s.

15
Table 3: Characteristics of Fiji, Synthetic Fiji and Belize in the pre-coup period
Variables Fiji
(1)
Synthetic Fiji
(2)
Belize
(3)
V Weights
(4)
Investment/GDP (%) 20.30 20.60 20.57 0.466
Population (Millions) 0.62 0.19 0.14 0
Agriculture/GDP (%) 22.60 21.90 24.65 0.016
Trade/GDP (%) 94.30 122.60 120.19 0.030
Per Capita Arable Land (hectares) 0.14 0.26 0.30 0.008
Tertiary School Completion (%) 2.30 1.60 1.46 0.001
Primary School Completion (%) 21.30 52.80 57.19 0
Per Capita GDP (in PPP 2005 $US) 4,125 4,110 3,442 0.479
In Figure 3, we plot the per capita GDP trajectory of the actual and synthetic Fiji over the whole
sample period. The trajectory of per capita GDP of the synthetic Fiji mimics fairly closely that of
the actual Fiji until around the first coup in 1987.
Figure 3: Trends in per-capita GDP: Fiji vs. Synthetic Fiji
The impacts of political instability are hence estimated as the differences between the two lines in
Figure 3 from 1987. The gap between the two lines started from 1987 and kept widening ever
since. From 1987 until 2000, when a coup disposed second constitutionally and democratically
elected government since 1987, the gaps were modest. By 1999, the difference was around
US$1,983 in per capita GDP, or about 44 percent of that of the actual Fiji.
With another coup in 2000 and continued political instability in its aftermath, the impact
magnified significantly. By 2011, the impact of the 24 year sustained political instability has
become US$4,565 annually, which is about 1.3 times of Fiji’s per capita GDP in 2011. A back-of-
0123456789
10
1970 1975 1980 1985 1990 1995 2000 2005 2010
Per
cap
ita
GD
P (
PP
P
US
$'0
00)
Year
Fiji
Onset of coups

16
envelop calculation shows that on average, political instability costs about 3.2 percent in terms
GDP per capita every year.12 It is important to note that these results show that the negative
impact of sustained political instability on the economy accumulates over time, and that it could
be a lot worse when it happens repeatedly. This finding implies that without taking these
accumulating effects into account, the effect would be underestimated.
6 PLACEBO TESTS
To establish the significance of the results, we again follow Abadie and Gardeazabal (2003) to
conduct some placebo studies to test whether the gap we found is just a statistical artefact. These
tests are to test how often we obtain results of similar magnitude if we had chosen a country or
time at random. The first placebo test is to apply the synthetic control method to each “non-
coup” country in the donor pool. We can then compare the evolutions of the growth trajectory of
these countries with their synthetic counterparts to assess whether the per capita GDP gaps
observed for Fiji may have been random. In other words, if we find that the gaps for the non-
coup countries are similar in magnitudes to those for Fiji (as shown in Figure 3), then we would
not be able to interpret them as due to political instability.
For example, Figure 4 is equivalent to Figure 2 except that we replace Fiji with Belize as the
‘treated’ country and do the same exercise. Since Belize did not experience political instability
during the period, we expect to find that the per capita GDP trajectory of the synthetic Belize
does not deviate from that of actual Belize in the same fashion as for Fiji for the post-coup period.
12
From 1987 to 2011, Fiji’s real per capita GDP declined from $4,300.4 to $3,395. The average growth rate was about -0.9
per cent annually. The real per capita GDP for the Synthetic Fiji was $7,961.0 in 2011, growing from $5,126 in 1987.
The average growth rate is about 2.3 per cent annually. Thus the difference is about 3.2 per cent.

17
Figure 4: Per capita GDP of Belize and Synthetic Belize
Indeed, the two lines for Belize in Figure 4 are quite similar until around 2000 and after which
positive gaps appear. We show below that this gaps are small (and insignificant) relative to the
gaps for Fiji. Repeating the procedure iteratively for all 14 countries, we calculate all the gaps
between the actual and synthetic counterparts. The procedure cannot always generate a synthetic
counterpart. Sometimes, the trajectory of per capita GDP of certain countries during the pre-coup
period cannot be well reproduced by the weighted combination of other countries. Unusually
large gaps in the pre-coup period would indicate misfit for that country. Of all the 13 countries,
this is the case for one country, Trinidad and Tobago. This could be seen by looking at the pre-
coup mean squared prediction error (MSPE) between the actual and synthetic countries for the
pre-coup period. The smaller of the MSPE, the better the model fits. The pre-coup median MSPE
for all 13 control countries in the donor pool is about 0.97, which is relatively small, showing that
the synthetic control method provides a reasonably good fit for per capita GDP in the pre-coup
period for the majority of countries in the donor pool. For Fiji, it is 0.10. However, for Trinidad
and Tobago, the MSPE is 56, which is the worst among all countries in the sample. It is true that
in most of the years in the pre-coup period, per capita GDP of Trinidad and Tobago was higher
than all the countries in the donor pool. Another characteristics of Trinidad and Tobago that
distinguishes it with other countries in the sample is that it has a large energy sector (oil,
petroleum and gas).
0
1
2
3
4
5
6
7
8
9
10
1970 1975 1980 1985 1990 1995 2000 2005 2010
Per
cap
ita
GD
P (
PP
P $
US
'000)
Year
BelizeSynthetic…

18
Figure 5: Per capita GDP gaps in Fiji and placebo gaps in all countries excluding Trinidad
and Tobago
The result of the placebo test is presented in Figure 5, where we show the per capita GDP gaps
between the actual country and its synthetic counterpart for all countries in the donor pool
excluding countries which has MSPE greater than 15 times the MSPE of Fiji. This cut-off point
eliminates 5 countries in the donor pool. The gaps before the coup period are small for all
countries, especially for Fiji (the bold line), indicating reasonably a good fit. After 1987, the Fiji
line stands out the most, particularly in years after 2000. This confirms that the gaps for Fiji are
unusually large after the coups.
The second test suggested by Abadie, et al. (2010) for assessing the treated country’s gap relative
to the placebo gaps of countries in the donor pool is to examine the distribution of post/pre-
intervention MSPE ratios. Table 4 lists the post/pre-coup MSPE ratios for Fiji and all 13 control
countries. The ratio for Fiji is 81, which is the largest ratio among the control countries. One can
calculate the probability of obtaining a post/pre-coup MSPE ratio as large as Fiji’s if we were to
assign the occurrence of the coup at random to each country in the sample. It is 0.0714 (1/14),
which is significant at the 10 percent level ( which is the highest possible significance can be
achieved using this sample). The placebo tests conducted above supports the finding that the
negative impacts on the trajectory of Fiji’s per capita GDP post-1987 are attributed to the political
instability as the results of military coups, rather than due to other factors. Note that the ratio for
Belize is 31.2, which is significantly smaller than Fiji’s, and not unusual in the sample.
-10
-8
-6
-4
-2
0
2
4
6
8
10
12
14
1970 1975 1980 1985 1990 1995 2000 2005 2010
Per
cap
ita
GD
P (
PP
P U
S$'0
00)
Year
Fiji

19
Table 4: Post/pre-coup MSPE ratios
Countries Ratios
Barbados 52.9
Botswana 72.1
Cyprus 3.7
Lesotho 26.3
Malta 2.2
Mauritius 32.3
NZ 15.2
Fiji 81.0
Singapore 17.4
Trinidad & Tobago 4.5
Belize 31.2
Dominica 21.3
St Vincent & Grenadines 14.1
Swaziland 40.4
Another placebo study we conduct is the ‘in-time’ placebo test, in which we change the start of
the coup period arbitrarily and test whether the procedure produces the same results. We first
choose 1978 as if it were the year of a hypothetical coup in Fiji and estimate the model. Now we
fit the econometric model underlying the synthetic control method to the data in the 1970-197713
period and use the model to predict the growth path of per capita GDP in the (hypothetical) post
intervention period 1978-1986. The purpose is to find out if there are any identifiable treatment
effects of the hypothetical event in Fiji.
13 For in-time placebo test, the data for the predictors is required for the (pre-intervention) 1970-1977 period. Data for a few
countries is not available for the whole 1970-1977 period. In such cases, the data available for the closest year is used as
the average of the 1970-1977 period. For instance, for Belize, the data for agriculture share of GDP is available from
1979. In this case, the 1979 value for the agriculture share of GDP is used as the average of the 1970-1977 period for the
in-time placebo test.
20
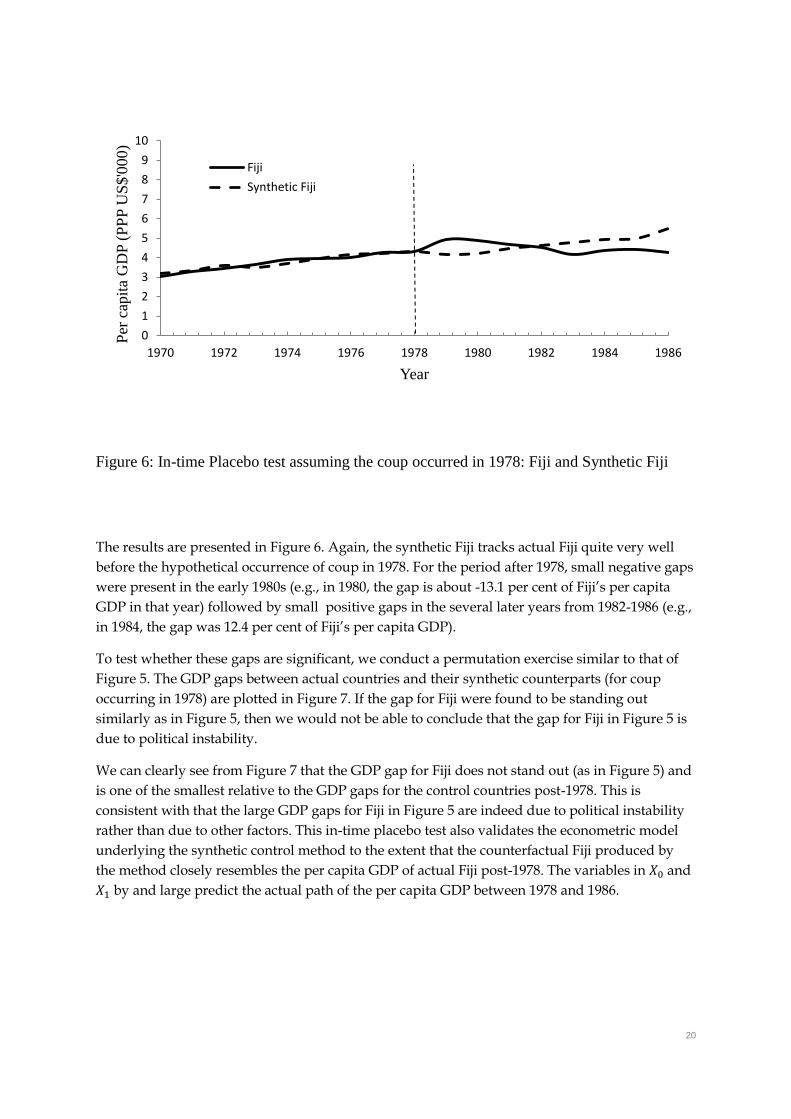
Figure 6: In-time Placebo test assuming the coup occurred in 1978: Fiji and Synthetic Fiji
The results are presented in Figure 6. Again, the synthetic Fiji tracks actual Fiji quite very well
before the hypothetical occurrence of coup in 1978. For the period after 1978, small negative gaps
were present in the early 1980s (e.g., in 1980, the gap is about -13.1 per cent of Fiji’s per capita
GDP in that year) followed by small positive gaps in the several later years from 1982-1986 (e.g.,
in 1984, the gap was 12.4 per cent of Fiji’s per capita GDP).
To test whether these gaps are significant, we conduct a permutation exercise similar to that of
Figure 5. The GDP gaps between actual countries and their synthetic counterparts (for coup
occurring in 1978) are plotted in Figure 7. If the gap for Fiji were found to be standing out
similarly as in Figure 5, then we would not be able to conclude that the gap for Fiji in Figure 5 is
due to political instability.
We can clearly see from Figure 7 that the GDP gap for Fiji does not stand out (as in Figure 5) and
is one of the smallest relative to the GDP gaps for the control countries post-1978. This is
consistent with that the large GDP gaps for Fiji in Figure 5 are indeed due to political instability
rather than due to other factors. This in-time placebo test also validates the econometric model
underlying the synthetic control method to the extent that the counterfactual Fiji produced by
the method closely resembles the per capita GDP of actual Fiji post-1978. The variables in and
by and large predict the actual path of the per capita GDP between 1978 and 1986.
0
1
2
3
4
5
6
7
8
9
10
1970 1972 1974 1976 1978 1980 1982 1984 1986
Per
cap
ita
GD
P (
PP
P U
S$'0
00)
Year
Fiji
Synthetic Fiji

21
Figure 7. Per capita GDP gaps for Fiji and all countries for a hypothetic 1977 coup in Fiji
7 ROBUSTNESS TESTS
Finally, the ‘optimal’ country weights ( ) assigned to synthetic Fiji obviously depend upon the
composition of the donor pool. We want to know how sensitive is our main results to changes in
. Following Abadie et al. (2014), we conduct a robustness test by investigating the effects on
our key findings if we were to exclude a country that had a positive weight in constructing
synthetic Fiji.
We re-estimate synthetic Fiji by leaving out each of the four countries with positive weights. The
results are depicted as grey lines in Figure 8. The dark solid and dark dashed lines are for actual
Fiji and the original synthetic Fiji (base model) respectively reproduced from Figure 3. The other
lines are for the synthetic Fijis constructed leaving one of the four countries out, respectively.
Figure 8 shows that the lines for all the synthetic Fijis are quite close to each other and the gaps
between the actual Fiji and each of them are substantial. We also present the size of the gaps in
2011 between actual and a particular synthetic Fiji in Table 5.
-5
-3
-1
1
3
5
7
9
1970 1972 1974 1976 1978 1980 1982 1984 1986
Per
cap
ita
GD
P (
PP
P $
US
'000)
Year
FijiControl countries

22
Figure 8: Leave-one-out distribution of the Synthetic control for Fiji
The results show that the deviations between various synthetic Fijis are minimal and the
economic cost of political instability remain substantial in terms of loss in per capita GDP. These
findings again confirm that our model is robust to exclusion of any particular country in
constructing synthetic Fiji.
Table 5: The size of the per capita GDP of Synthetic Fiji relative to actual Fiji
Synthetic Fiji Number of times the actual per capita
GDP of Fiji in 2011.
Base Model 2.3
Leave Out Belize 2.1
Leave Out Malta 2.2
Leave Out Mauritius 2.1
Leave Out Trinidad and Tobago 2.2
8 CONCLUSIONS
Prolonged political instability in a small island economy, with limited resources can have
profound negative impacts on business confidence, investment in capital and savings - the key
elements determining the growth path of an economy. In this paper, we revisited and quantify
0
1
2
3
4
5
6
7
8
9
10
11
12
1970 1975 1980 1985 1990 1995 2000 2005 2010
Per
cap
ita
GD
P (
PP
P $
US
'000)
Year
Fiji
Synthetic Fiji
Synthetic Fiji (leave-one-out)

23
the impact of political instability on economic performance, using Fiji as a case study. We use the
Synthetic Control method to isolate this impact, which allows for the effect to be varying over
time.
In particular, we constructed a synthetic Fiji from a pool of 13 small Commonwealth countries in
terms of their population size. The GDP path of the constructed Synthetic Fiji mimics that of
actual Fiji fairly closely until 1987, when the first coup occurred. We found significant and
increasing gaps between the growth path predicted by synthetic Fiji and actual Fiji over 1987-
2011.We find that per capita GDP of Fiji could have been 43 per cent higher in 1999 and 130 per
cent higher in 2011 in the absence of political instability than they actually were in these years.
On average, the prolonged political instability could have costed Fiji’s economic growth at the
rate of 3.2 per cent annually. These results indicate that the adverse impact of political instability
is significant and is accumulative. These findings are confirmed by a series of placebo and
robustness tests.
REFERENCES
Abadie, A. and J. Gardeazabal. (2003), “The Economic Costs of Conflict: A Case Study of
the Basque Country”, American Economic Review, 93(1), 113-132.
Abadie, A., A. Diamond, and J. Hainmueller. (2010), “Synthetic Control Methods for
Comparative Case Studies: Estimating the Effect of California’s Tobacco Control Program”
Journal of the American Statistical Association: Applications and Case Studies, 105(490),
493-505.
Abadie, A. A. Diamond, and J. Hainmueller. (2014), “Comparative Politics and Synthetic
Control Methods”, American Journal of Political Science (forthcoming).
Acemoglu, D. S. Johnson, J. Robinson, and Y. Thaicharoen. (2003), “Institutional Causes,
Macroeconomic Symptoms: Volatility, Crises and Growth”, Journal of Monetary Economics,
50, 49–123.
Aisen, A. and F. Veiga. (2005), “The Political Economy of Seigniorage,” IMF Working
Paper 05/175,Washington: International Monetary Fund.
_________. (2006a), “Does Political Instability Lead to Higher Inflation? A Panel Data
Analysis”, Journal of Money, Credit and Banking, 38(5), 1379–90.
_________. (2006b), “Political Instability and Inflation Volatility”, IMF Working Paper
06/212, Washington: International Monetary Fund.
_________. (2013), “How does political instability affect growth?”, European Journal of
Political Economy, 29, 151-167, http://dx.doi.org/10.1016/j.ejpoleco.2012.11.001,
downloaded on 7 May, 2014.
Alesina, A. S. Ozler, N. Roubini, and P. Swagel. (1996)., “Political instability and economic
growth”, Journal of Economic Growth, 1(2), 189-211.

24
Barro, R. (1991a), “Economic Growth in a Cross Section of Countries”, The Quarterly
Journal of Economics, 106 (2), 407-443.
Barro, R. (1991b), “A cross country study of growth, saving and government”, In: Bernheim,
S. (Eds.), National Saving and Economic Performance, NBER, Cambridge, MA.
Barro, R. and J. Lee. (1993), “International Comparisons of Educational Attainment”,
Journal of Monetary Economics, 32, 363-394.
Barro, R. and J. Lee. (1994), “Sources of Economic Growth”, Carnegie-Rochester
Conference Series on Public Policy, 40, 1-46.
Barro, R. and J. Lee. (2013), “A New Data Set of Educational Attainment in the World,
1950-2010”, Journal of Development Economics, 104, 184-198.
Billmeier, A. and T. Nannicini. (2013), “Assessing Economic Liberalisation Episodes: A
Synthetic Control Approach”, The Review of Economics and Statistics, 95 (3), 983-1001.
Campo, N. F. and J. B. Nugent. (2002), “Who is afraid of political instability?”, Journal of
Development Economics, 67 (1), 157-172.
Card, D. (1990), "The Impact of the Mariel Boatlift on the Miami Labor Market", Industrial and
Labor Relations Review, 43 (2), 245-257.
Card, D. and A. B. Krueger. (1994), "Minimum Wages and Employment: A Case Study of the Fast-
Food Industry in New Jersey and Pennsylvania", American Economic Review, 84 (4), 772-793.
Carey, J. M. and Y. Horiuchi. (2014), “Compulsory Voting and Income Inequality”, Paper presented
at the Annual Workshop on the Frontiers of Statistical Analysis and Formal Theory of Political
Science, Tokyo, Japan, January 4-5.
Cavallo, E, S. Galiani, I. Noy. and J. Pantano. (2013), “Catastrophic Natural Disasters and Economic
Growth”, Review of Economics and Statistics, 95 (5), 1549-1561.
Coffman, M. and I. Noy. (2012), “Hurricane Iniki: measuring the long-term economic impact of a
natural disaster using synthetic control”, Environment and Development Economics, 17 (2), 187-205.
Cukierman, A. S. and G. Tabellini. (1992), “Seignioriage and Political Instability,” American
Economic Review, 82(3), 537–55.
Feenstra, R., I. Robert, and M. Timmer. (2013), “The Next Generation of the Penn World
Table”, www.ggdc.net/pwt.
Field, M, T. Baba. and U. Nabobo-Baba. (2005), Speight of Violence: Inside Fiji’s 2000
Coup, Pandanus Books, Research School of Pacific and Asian Studies, Australian National
University, Canberra, Australia.
Fielding, D. (1999), “Economic Consequences of the Intifada: investment and political
instability in Israel, University of Leicester, memo.

25
Feng, Y. (2001), “Political Freedom, Political Instability, and Policy Uncertainty: A Study of
Political Institutions and Private Investment in Developing Countries”, International Studies
Quarterly, 45 (2), 271-294.
Fowler, A. (2013), “Electoral and Policy Consequences of Voter Turnout: Evidence from
Compulsory Voting in Australia”, International Quarterly Journal of Political Science, 8 (2),
159-182.
Fraenkel, J, S. Firth. and B. V. Lal. (2009), The 2006 Miltary Takeover in Fiji: A Coup to
End All Coups?, ANU E Press, Australian National University, Canberra, Australia,
Available at: http://epress.anu.edu.edu/coup_coup_citation.html.
Gounder, R. (2002), “Political and Economic Freedom, Fiscal Policy, and Growth Nexus:
Some Empirical Results for Fiji”, Contemporary Economic Policy, 20 (3), 234-245.
Gurgul, H. and L. Lach. (2013), “ Political instability and economic growth: Evidence from
two decades of transistion in CEE, Communist and Post-Communist Studies, 46 (2), 189-202.
Imbens, G. W. and J. M. Wooldridge. (2009), "Recent Developments in the Econometrics of
Program Evaluation", Journal of Economic Literature, 47 (1), 5-86.
Narayan, P. K. and B. G. Prasad. (2007), “The Long-run Impact of Coups on Fiji’s Economy:
Evidence from a Computable General Equilibrium Model”, Journal of International
Development, 19 (2), 149-160.
Liou, Y. and P. Musgrave. (2013), “Refining the Oil Curse: Country-Level Evidence from
Exogenous Variations in Resource Income”, Comparative Political Studies, 20 (10), 1-27.
Mideksa, T. K, (2013), “The economic impact of natural disasters”, Journal of Environment
Economics and Management, 65 (2), 277-289.
Montalvo, J. G. (2011), “Voting after the bombings: a natural experiment on the effect of
terrorist attacks on democratic elections”, The Review of Economics and Statistics, 94 (4),
1146-1154.
Nannicini, T. and R. Ricciuti. (2010), “Autocratic Transitions and Growth”, CESifo Working
Paper No. 2967, www.CESifo-group.org/wp, downloaded May 10, 2014.
Narsey, W. (2007), “Costly coups: no catching up in GDP”, The Fiji Times, Suva, Fiji, 11
December.
Robertson, R. and A. Tamanisau. (1988), Fiji: Shattered Coups, Pluto Press, Australia.
Robertson, R. and W. Sutherland. (2001), Government by the Gun: the unfinished business of
Fiji’s 2000 coup, Pluto Press, Australia.
Rodrik, D. (1989), “Policy Uncertainty and Private Investment in Developing Countries”,
NBER Working Paper No. 2999, NBER, Cambridge, MA.
Sala-I-Martin, X. X. (2001), “I Just Ran Two Million Regressions”, American Economic
Review, 87 (2), 178-183.

26
Schneider, F., and B. Frey. (1985), “Economic and political determinants of foreign direct
investment”, World Development, 13 (2), 161–175.
Singhal, S. and R. Nilakantan. (2012), “Naxalite Insurgency and the Economic Benefits of a
Unique Robust Security Response”, Households in Conflict Network (HiCN) Working Paper
127, University of Southern California, Los Angeles.

27
APPENDIX
Table A. Data availability: the first available year by indicator and country
Investment/
GDP
Agriculture/
GDP
Trade/GDP Education
attainment
Barbados 1970 1970 1970 1970
Malta 1970 1970 1970 1970
Fiji 1970 1970 1970 1970
Swaziland 1970 1970 1970 1970
Cyprus 1975 1975 1975 1970
Lesotho 1970 1970 1975 1970
Mauritius 1976 1976 1976 1970
NZ 1971 1971 1971 1970
Botswana 1970 1975 1970 1970
Singapore 1970 1975 1975 1970
Trinidad & Tobago 1970 1984 1984 1970
Belize 1980 1979 1980 1970
Dominica 1977 1977 1977 1970*
St Vincent &
Grenadines
1977 1977 1977 1980
Variables Per Capita GDP, Arable land, and Population are available for all
countries and years. Education attainment is available for every five years. *It
is missing for Dominica in 1975.