the economic effects on agriculture of water export ... · the economic effects on agriculture of...
TRANSCRIPT

The Economic Effects on Agriculture of Water Export Salinity South of the Delta Technical Appendix I
Josué Medellín–Azuara Richard E. Howitt Jay R. Lund Ellen Hanak
with research support from William E. Fleenor
September 2008
Description This document is an appendix to the Public Policy Institute of California report, Comparing Futures for the Sacramento-San Joaquin Delta, prepared by a team of researchers from the Center for Watershed Sciences (University of California, Davis) and the Public Policy Institute of California. Supported with funding from Stephen D. Bechtel Jr. and the David and Lucile Packard Foundation
The Public Policy Institute of California is dedicated to informing and improving public policy in California through independent, objective, nonpartisan research on major economic, social, and political issues. The institute’s goal is to raise public awareness and to give elected representatives and other decisionmakers a more informed basis for developing policies and programs. The institute’s research focuses on the underlying forces shaping California's future, cutting across a wide range of public policy concerns, including economic development, education, environment and resources, governance, population, public finance, and social and health policy. PPIC is a private, nonprofit organization. It does not take or support positions on any ballot measures or on any local, state, or federal legislation, nor does it endorse, support, or oppose any political parties or candidates for public office. PPIC was established in 1994 with an endowment from William R. Hewlett. Mark Baldassare is President and Chief Executive Officer of PPIC. Thomas C. Sutton is Chair of the Board of Directors.
Copyright © 2008 by Public Policy Institute of California All rights reserved San Francisco, CA Short sections of text, not to exceed three paragraphs, may be quoted without written permission provided that full attribution is given to the source and the above copyright notice is included. Research publications reflect the views of the authors and do not necessarily reflect the views of the staff, officers, or Board of Directors of the Public Policy Institute of California.

iii
Contents
Summary iv
Acknowledgments vii
Acronyms viii
Introduction 1
1. MODEL AND DATA 3 Base Water Flow and Salinity Conditions 4
2. PRELIMINARY RESULTS 8 Revenues from Crops and Confined Animal Feeding Operations 8 Economic Effects of Salinity Changes from Different Sizes of Peripheral Canal 12
3. MODEL LIMITATIONS AND FURTHER WORK 17
Conclusions 18
References 19
About the Authors 21
iv
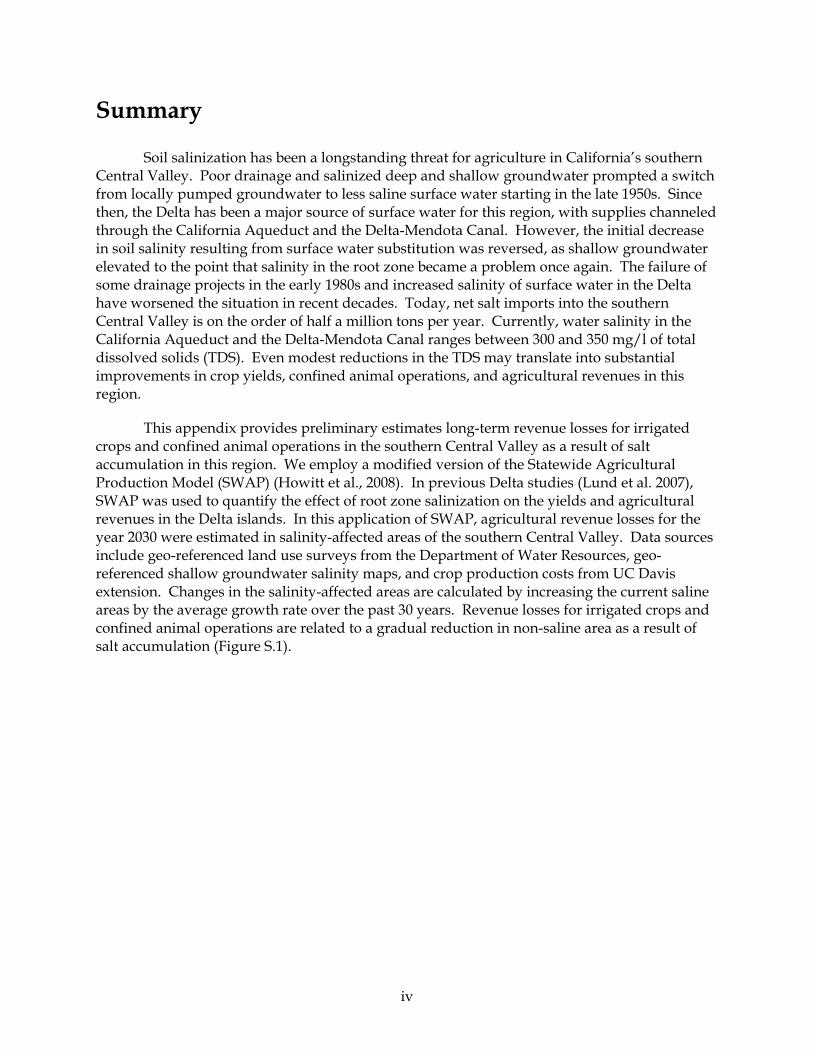
Summary
Soil salinization has been a longstanding threat for agriculture in California’s southern Central Valley. Poor drainage and salinized deep and shallow groundwater prompted a switch from locally pumped groundwater to less saline surface water starting in the late 1950s. Since then, the Delta has been a major source of surface water for this region, with supplies channeled through the California Aqueduct and the Delta-Mendota Canal. However, the initial decrease in soil salinity resulting from surface water substitution was reversed, as shallow groundwater elevated to the point that salinity in the root zone became a problem once again. The failure of some drainage projects in the early 1980s and increased salinity of surface water in the Delta have worsened the situation in recent decades. Today, net salt imports into the southern Central Valley is on the order of half a million tons per year. Currently, water salinity in the California Aqueduct and the Delta-Mendota Canal ranges between 300 and 350 mg/l of total dissolved solids (TDS). Even modest reductions in the TDS may translate into substantial improvements in crop yields, confined animal operations, and agricultural revenues in this region.
This appendix provides preliminary estimates long-term revenue losses for irrigated crops and confined animal operations in the southern Central Valley as a result of salt accumulation in this region. We employ a modified version of the Statewide Agricultural Production Model (SWAP) (Howitt et al., 2008). In previous Delta studies (Lund et al. 2007), SWAP was used to quantify the effect of root zone salinization on the yields and agricultural revenues in the Delta islands. In this application of SWAP, agricultural revenue losses for the year 2030 were estimated in salinity-affected areas of the southern Central Valley. Data sources include geo-referenced land use surveys from the Department of Water Resources, geo-referenced shallow groundwater salinity maps, and crop production costs from UC Davis extension. Changes in the salinity-affected areas are calculated by increasing the current saline areas by the average growth rate over the past 30 years. Revenue losses for irrigated crops and confined animal operations are related to a gradual reduction in non-saline area as a result of salt accumulation (Figure S.1).

v
S.1. Salinity-affected areas in the southern Central Valley
Notes: Electrical conductivity is for shallow groundwater, adapted from Howitt et al. (2008) and Department of Water Resources (2001).
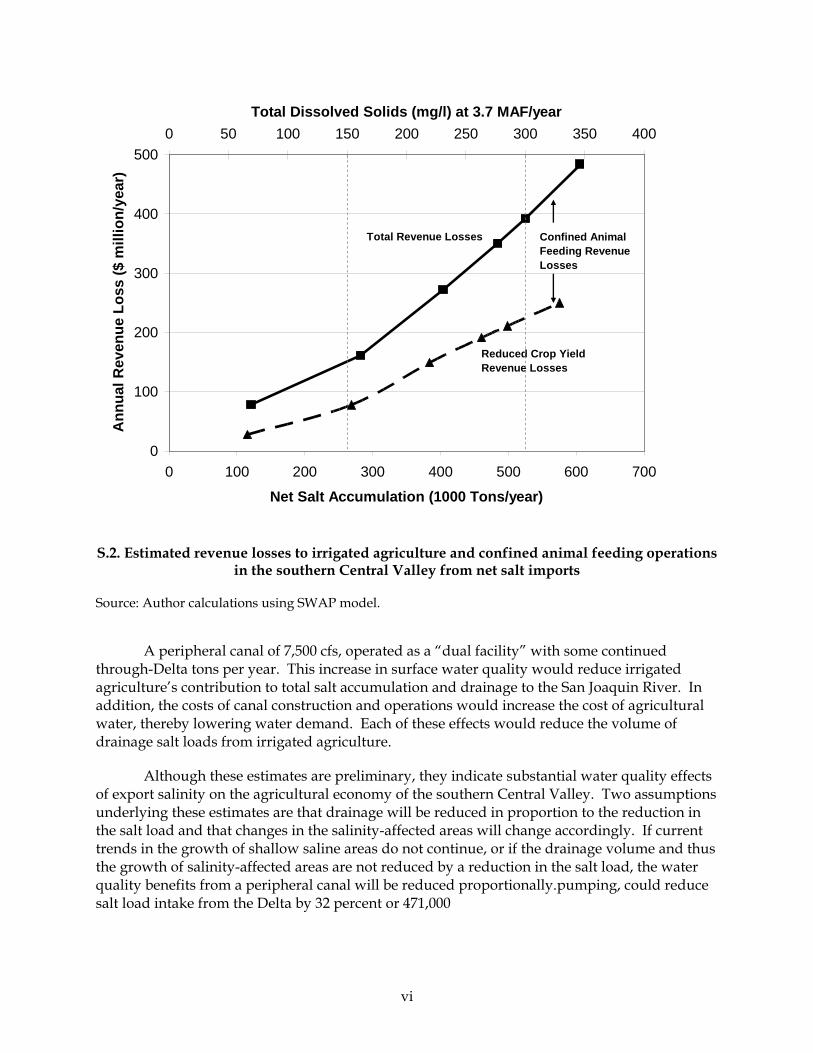
Changing the salinity of Delta exports would have a long-term economic effect on agricultural revenues in this region. Cost function estimates show that costs increase at an increasing rate with net salt accumulation. Under current conditions, with roughly 3.7 million acre-feet (maf) per year of surface water delivered to southern Central Valley agriculture with at least 300 mg/l of TDS, an equivalent of 1.5 million metric tons of dissolved solids is deposited in the ground each year. Roughly a third of this load accumulates in groundwater (Schoups et al., 2005), with the remainder draining into the San Joaquin River (Orlob, 1991). By 2030, the estimated incremental revenue losses for irrigated agriculture due to this growth in saline areas is in the range of $191 to $231 million per year (in 2008 $) (Figure S.2). When losses to confined animal operations are included, the total revenue loss to agriculture from salinity imports reaches $392 million per year on average, or between $341 and $439 million depending on the extent to which the change in salinity-affected area is linked to the incoming salt load.
vi
0
100
200
300
400
500
0 100 200 300 400 500 600 700
Net Salt Accumulation (1000 Tons/year)
Ann
ual R
even
ue L
oss
($ m
illio
n/ye
ar)
0 50 100 150 200 250 300 350 400Total Dissolved Solids (mg/l) at 3.7 MAF/year
Reduced Crop YieldRevenue Losses
Confined Animal Feeding Revenue Losses
Total Revenue Losses
S.2. Estimated revenue losses to irrigated agriculture and confined animal feeding operations in the southern Central Valley from net salt imports
Source: Author calculations using SWAP model.
A peripheral canal of 7,500 cfs, operated as a “dual facility” with some continued through-Delta tons per year. This increase in surface water quality would reduce irrigated agriculture’s contribution to total salt accumulation and drainage to the San Joaquin River. In addition, the costs of canal construction and operations would increase the cost of agricultural water, thereby lowering water demand. Each of these effects would reduce the volume of drainage salt loads from irrigated agriculture.
Although these estimates are preliminary, they indicate substantial water quality effects of export salinity on the agricultural economy of the southern Central Valley. Two assumptions underlying these estimates are that drainage will be reduced in proportion to the reduction in the salt load and that changes in the salinity-affected areas will change accordingly. If current trends in the growth of shallow saline areas do not continue, or if the drainage volume and thus the growth of salinity-affected areas are not reduced by a reduction in the salt load, the water quality benefits from a peripheral canal will be reduced proportionally.pumping, could reduce salt load intake from the Delta by 32 percent or 471,000

vii
Acknowledgments
The authors acknowledge the valuable contributions of William E. Fleenor and Jonathan D. Kaplan to this study. The authors also thank Ray Hoagland and Steve Hatchett for reviewing an earlier draft.
Research publications reflect the views of the authors and do not necessarily reflect the views of the staff, officers, or Board of Directors of the Public Policy Institute of California.
viii
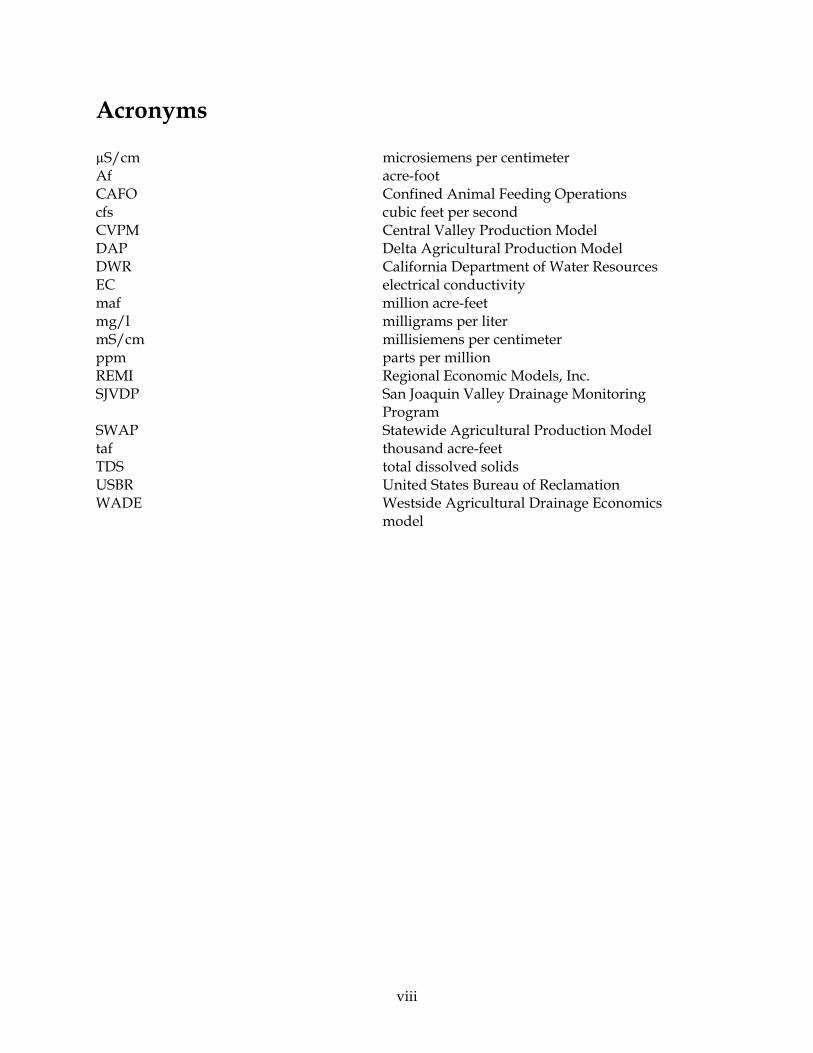
Acronyms
µS/cm microsiemens per centimeter Af acre-foot CAFO Confined Animal Feeding Operations cfs cubic feet per second CVPM Central Valley Production Model DAP Delta Agricultural Production Model DWR California Department of Water Resources EC electrical conductivity maf million acre-feet mg/l milligrams per liter mS/cm millisiemens per centimeter ppm parts per million REMI Regional Economic Models, Inc. SJVDP San Joaquin Valley Drainage Monitoring
Program SWAP Statewide Agricultural Production Model taf thousand acre-feet TDS total dissolved solids USBR United States Bureau of Reclamation WADE Westside Agricultural Drainage Economics
model
1
Introduction
Historically, soil salinization has caused agricultural yield losses and crop shifts in once prominent agricultural regions of the globe. Well documented cases of soil salinization exist dating back to 1700 BC in ancient Mesopotamia, with modern examples including the Nile, in Egypt (Ghassemi et al., 1995), Australia’s Murray-Darling Basin (O'Brien, 1984) the Danube in Central Europe (Maianu, 1984), and several regions in the United States such as the Colorado River Basin, the Brazos River in Texas and the southern Central Valley in California (Krich-Brinton, 2004).
In ancient Mesopotamia, after 1700 BC, a shift in water supply from the Euphrates River to the Tigris River is believed to have caused increased seepage, flooding, over-irrigation and consequentially a rise in the groundwater table (Artzy and Hillel, 1988). Salt and silt accumulation in the fertile Mesopotamian valley (as late as 1200 AD) were a major reason for the decline of agricultural activity and settlement (Jacobsen and Adams, 1958). Powell (1985) argued that a drainage system could have been put in place. But Artzy and Hillel (1988) claim that geophysical conditions would have made artificial drainage difficult, even using current technology.
Soil salinization is a long-term problem for the southern Central Valley. The Delta is a major source of the salts contributing to this problem, which results in significant and growing economic losses. As surface water delivered from the Delta evaporates or returns via the San Joaquin River, much of the salt remains behind. Salinity concerns in this region date at least from the late 1950s, when the California Department of Water Resources began monitoring agricultural drainage. Studies such as the “Rainbow Report” and the Westside Agricultural Drainage Economics Model (WADE) report (SJVDP 1990, 1989) were among the first to describe quantitatively the issues and economic effects of drainage and salinity in the southern Central Valley.
More recently, Howitt et al. (2008) developed a more comprehensive sector analysis of the economic impact of inaction with respect to salinity and drainage in this region, using an updated version of the Statewide Agricultural Production (SWAP) model (Howitt et al., 2001). This application extends methods developed for the Delta Agricultural Production (DAP) model (Appendix D of Lund et al., 2007) to the entire southern Central Valley. In this appendix, we draw on this model to provide preliminary estimates of the economic effects of water export salinity for agriculture south of the Sacramento-San Joaquin Delta. We also report estimates of statewide employment and income effects of salinity in this region, using an integrated economic model of the Central Valley.1
The WADE model differs from the SWAP approach used here in several ways. First, the WADE model was based on a much more detailed definition of salinity regions, with soil depths of different salinities. This added complexity made the WADE model difficult to solve and resulted in no formal use of the model in the final Rainbow report. Second, the economic component of the WADE model differs from the SWAP model in its representation of how farmers adapt their cropping practices for salinity or water restrictions. The WADE model had a 1 Regional Economic Models, Inc. (REMI). See www.remi.com.
2
specification that required that water and crop inputs be used in fixed ratios to crop acres, and neither the yield nor the input use intensity responded to changes in scarcity or cost. This assumption becomes less realistic as relative prices change and water becomes scarcer.
With recent water export quantities to southern Central Valley agriculture at roughly 3.7 maf per year (the volume delivered before the 2007 Wanger decision),2 roughly half a million metric tons per year of dissolved salt accumulate in groundwater south of the Delta (Schoups, et al., 2005).3 Assuming the change in the salinity-affected area is driven mostly by the change in salt load, additional revenue losses for irrigated agriculture in the Central Valley due to this salinity are estimated to reach an average of $211 million per year by 2030 (in 2008 $), as compared to today’s losses. When losses to confined animal operations are included, the total losses to agriculture from additional salinity accumulation range between $341 and $439 million per year. These direct losses reduce statewide income by almost $800 million dollars per year. These loss estimates are preliminary, but they indicate substantial water quality effects of export salinity on the agricultural economy of the southern Central Valley.
2 In December 2007, federal Judge Wanger ruled that changes were needed at the south Delta pumps to reduce the entrainment of delta smelt, a species listed under the federal and state endangered species acts (Natural Resources Defense Council, et al. v. Kempthorne, Findings of Fact and Conclusions of Law Re Interim Remedies Re: Delta Smelt ESA Remand and Reconsultation, United States District Court, Eastern District of California, 1:05-cv-1207 OWW GSA (2007). The Department of Water Resources (2007) estimates that these changes could reduce State Water Project exports on average by 22 to 30 percent. 3 Shoups et al. (2005) confirmed previous estimates by Orlob (1991) showing a net salt accumulation of half a million tons per year in the Southern Central Valley. This salt accumulates in dissolved form in shallow and deep groundwater. As less groundwater is pumped for irrigation, the groundwater table rises and starts affecting the root zone of the cultivated area.
3
1. Model and Data
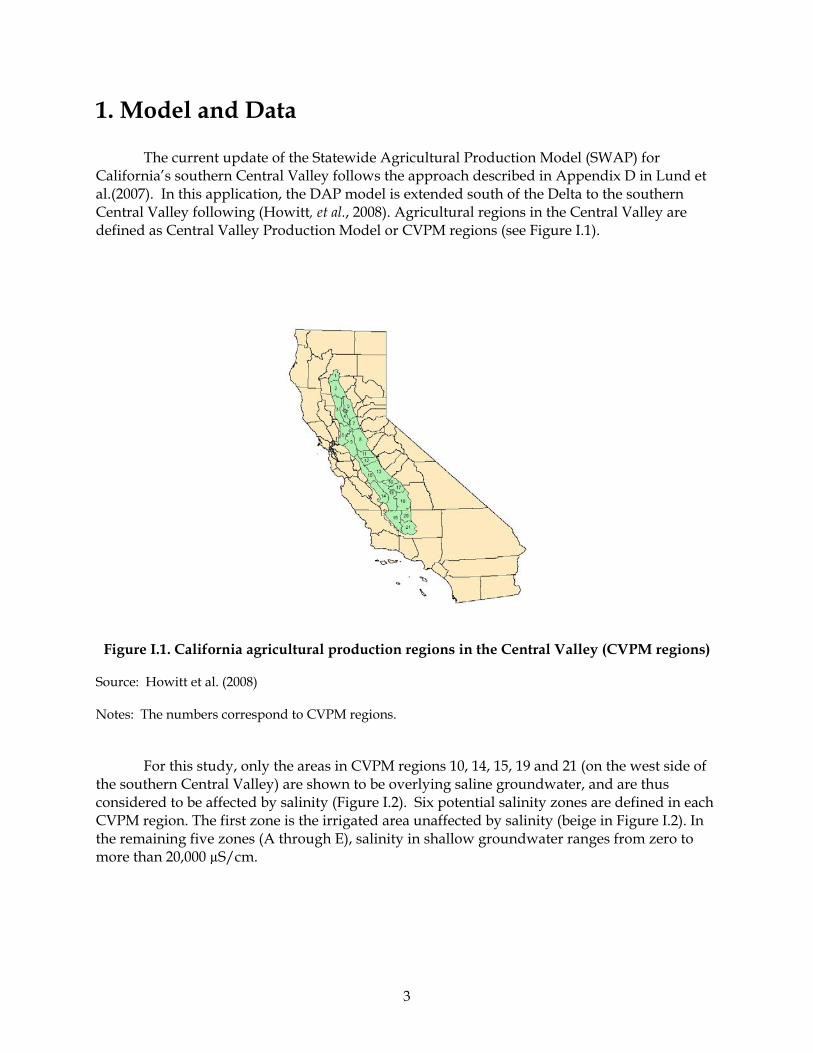
The current update of the Statewide Agricultural Production Model (SWAP) for California’s southern Central Valley follows the approach described in Appendix D in Lund et al.(2007). In this application, the DAP model is extended south of the Delta to the southern Central Valley following (Howitt, et al., 2008). Agricultural regions in the Central Valley are defined as Central Valley Production Model or CVPM regions (see Figure I.1).
Figure I.1. California agricultural production regions in the Central Valley (CVPM regions)
Source: Howitt et al. (2008)
Notes: The numbers correspond to CVPM regions.
For this study, only the areas in CVPM regions 10, 14, 15, 19 and 21 (on the west side of the southern Central Valley) are shown to be overlying saline groundwater, and are thus considered to be affected by salinity (Figure I.2). Six potential salinity zones are defined in each CVPM region. The first zone is the irrigated area unaffected by salinity (beige in Figure I.2). In the remaining five zones (A through E), salinity in shallow groundwater ranges from zero to more than 20,000 µS/cm.

4
Figure I.2. Salinity-affected CVPM regions south of the Sacramento-San Joaquin Delta
Source: Howitt, et al (2008) and Department of Water Resources (2001).
This study calibrates economic agricultural production functions using overlaying geo-referenced data on land use with the distribution of soil salinity in the Central Valley measured by electric conductivity (DWR 2001). Algorithms to estimate market-driven crop prices by 2030 (Howitt, et al., 2008) and agricultural land conversion (Landis and Reilly, 2002) also are introduced. As a result, we can estimate crop production functions by salinity zone within each CVPM region.
Base Water Flow and Salinity Conditions
For base conditions we assume that, on average, 3.7 million acre-feet of water are imported to agricultural areas from the Delta-Mendota Canal and the California Aqueduct, with an average salinity of about 300 mg/l measured by TDS. We project that current conditions will gradually increase the area affected by a salinized shallow groundwater table. These projections are based on a regression equation fitted to data over a subset of the area affected by salinity (417,000 acres) in Shoups (2004). Given the historical rates of change, we expect that by 2030 the salinity-affected area will increase by 12 to 15 percent. This growth rate is applied to the entire area shown in Figure I.2.
For simplicity, we calculate all costs on an annual basis as they will occur in the year 2030 (in 2008 dollars). It follows that salinity costs will increase slowly from the base year (2008)
5
to 2030. In reality the changing cropping patterns will result in higher revenue losses towards the end of the time period.
Salinity in shallow groundwater and the root zone are closely correlated (Schoups, et al., 2005). Here we assume that the total saline area within each CVPM region grows by 13 percent by 2030. The share of acres transferred from the non-saline zone to the saline zones (A through E) within each CVPM region is shown in Table I.1. Figure I.3 depicts a hypothetical change in the saline zone areas of Figure I.2. The largest changes occur at lower levels of salinity (Zones A and B), with smaller increases in the zones with higher salinity (C, D and E). Changing the distribution of the non-saline acres transferred to the saline zones (third column of Table I.1) did not significantly change the results of this analysis, as agricultural losses are driven mainly by the conversion of areas from non-saline to saline conditions. Changes in crop production are reflected in changes in the relative acreages of different crops grown. In general, the lower-valued crops are more salt-tolerant. In the higher salinity regions, some land is taken out of production. The model is calibrated to the actual regional cropping patterns as reflected in the DWR crop surveys. The mathematical programming approach followed here was validated in Howitt et al. (2008). We checked the analytical programming model using statistical methods in which the change in salinity is related to the change in the probability of a particular crop being grown on a given soil type. Results of both programming and statistical methods were very similar.
According to these results, if 100 acres from a non-saline area are converted to saline area, 50 of those acres will be relocated to the zone with 0-2000 µS/cm (Zone A), 30 will go to Zone B, and so on. This procedure was undertaken for 3, 7, 10, 13 and 15 percent changes in the salinity-affected areas. This parameterization can be used to explore the gradual effect of salt accumulation, assuming the salt load drives the change in the saline and non-saline areas. Thirteen percent is a mid-range projection of the accumulated increase in saline area expected by year 2030 under current conditions, including Delta surface water quality (Howitt, et al., 2008, Schoups, 2004).

6
Table I.1. Conversion of non-saline area to saline zones as a result of salt accumulation by 2030
Zone Salinity level (EC in shallow
groundwater (µS/cm))
Share of non-saline acres transferred to the saline zone (%)
A 0-2000 50 B 2000-4000 30 C 4000-10000 10 D 10000-20000 10 E above 20000 0
Source: Adapted from Howitt, et al., 2008.
Notes: Model assumes that 13 percent of non-saline acreage in each CVPM region becomes saline (entering zones A through E) by 2030. Electrical conductivity, a measure of a material’s ability to conduct electricity is often used as a measure of salinity in water. Often, total dissolved solids (TDS) are assumed proportional to the electrical conductivity by a factor of 0.64. Thus 1 mS/cm corresponds to 640 mg/l of total dissolved solids.
Figure I.3. Conceptual expected percent change in area of the saline and non-saline zones within a CVPM region
The mathematical programming model used for this study (Howitt et al., 2008) estimates calibrated production functions per crop group and saline or non-saline area within each CVPM region in the study area (Figure I.2). The production functions calibrate to observed values of land, water and labor. Here, market driven crop prices by 2030 are the same for all areas within a CVPM region, although it is assumed production costs vary slightly across saline zones. Differential yields for saline and non-saline areas were estimated in Howitt et al. (2008)

7
by adapting the yield reduction model of Van Genuchten and Hoffman (1984). The ratio of the salinity in the saturated soil region to the root zone region was calibrated at 2.0. Losses in crop revenues for agriculture south of the Delta occur as a result of overall reduced yields, as salinity-affected areas with lower yields encroach on the higher-yielding, less saline agricultural lands. Thus agricultural crop revenue losses depend to a great extent on the increase in the area of salinity-affected locations within each CVPM region.
The estimates of areas that go out of production due to salinity include lands that are planned to be retired through programs proposed by Westlands Water District and the US Bureau of Reclamation (USBR 2002). Since these saline areas are already included in our analysis, the planned retirements should not change the overall estimates of affected acreage and economic losses due to increased salinity.

8
2. Preliminary Results
We use this model to examine changes in agricultural revenues resulting from salinity exported from the Delta, which decreases crop yields and constrains confined animal operations. We also explore changes in salinity costs when a peripheral canal is introduced, operated as a dual facility with continued through-Delta pumping (keeping total agricultural deliveries constant). These are preliminary results, and many other aspects of salinity and salinity management should be explored.
Revenues from Crops and Confined Animal Feeding Operations
If current conditions persist, saline land will increase by 12 to 15 percent by 2030, resulting in agricultural revenue losses from reduced crop production in the southern Central Valley in the range of $191 to $231 million per year (Howitt, et al., 2008). This cost does not include losses or gains from land conversion and changing crop prices by 2030.4 A more conservative scenario, with only 7 percent loss of non-saline area, yields a yearly average loss of $78 million per year in crop revenues in 2030 (Figure I.4). Higher losses would occur if more than 13 percent of non-saline acreage were lost. These losses to irrigated crops assume land area change will be driven mostly by the salt load on the water used for irrigation south of the Delta.
0
50
100
150
200
250
0 2 4 6 8 10 12 14Percent Increase in Saline Land
Cro
p R
even
ue L
osse
s ($
Mill
ion/
year
)
Figure I.4. Yearly crop revenue losses for salinized CVPM regions in the Central Valley in 2030
Source: Author estimates, using the SWAP model. 4 Changes in land and crop demands are based on other models which estimate the effect of changes in the population and income on crop demand and the conversion of irrigated land to urban use.

9
Confined animal feeding operations (CAFO) in the Central Valley also experience revenue losses from increased saline area (Howitt, et al., 2008). Our model assumes that CAFOs meet nutrient disposal requirements in the most cost-effective way by applying effluent to field crops. The area of field crops limits effluent disposal by CAFOs in the Central Valley. Thus a reduction in acreage of field crops due to increases in salinity-affected areas also reduces the size of the CAFO industry. The reduction in the area of field crops occurs by shifts in cropping patterns as well as by land being retired. Howitt et al. (2008) estimated losses of $182 million per year with a 13 percent reduction in non-saline land (Figure I.5). The linkage of CAFOs and irrigated crops overestimates the impact of salinity changes to the extent that saline areas that are unsuitable for field crop production can be used to grow crops such as switch grass or similar varieties that have a biomass value, are salt tolerant and sequester phosphate and nitrogen.
0
50
100
150
200
250
0 2 4 6 8 10 12 14
Percent Increase in Saline Land
Rev
enue
Los
ses
($ M
illio
n/ye
ar)
Figure I.5. Yearly confined animal feeding operations revenue losses for salinized CVPM regions in the Central Valley in 2030
Source: Author calculations using the SWAP model.
To measure the economic cost of changes from current conditions, we estimated a cost function of revenue losses for irrigated agriculture and confined animal operations versus net annual salt accumulation. We assume that a yearly net tonnage of accumulated salt of 499 thousand tons per year corresponds to a 13 percent increase in salinity-affected land area (Howitt, et al., 2008, Schoups, 2004). In the absence of evidence to the contrary, we assume that
10
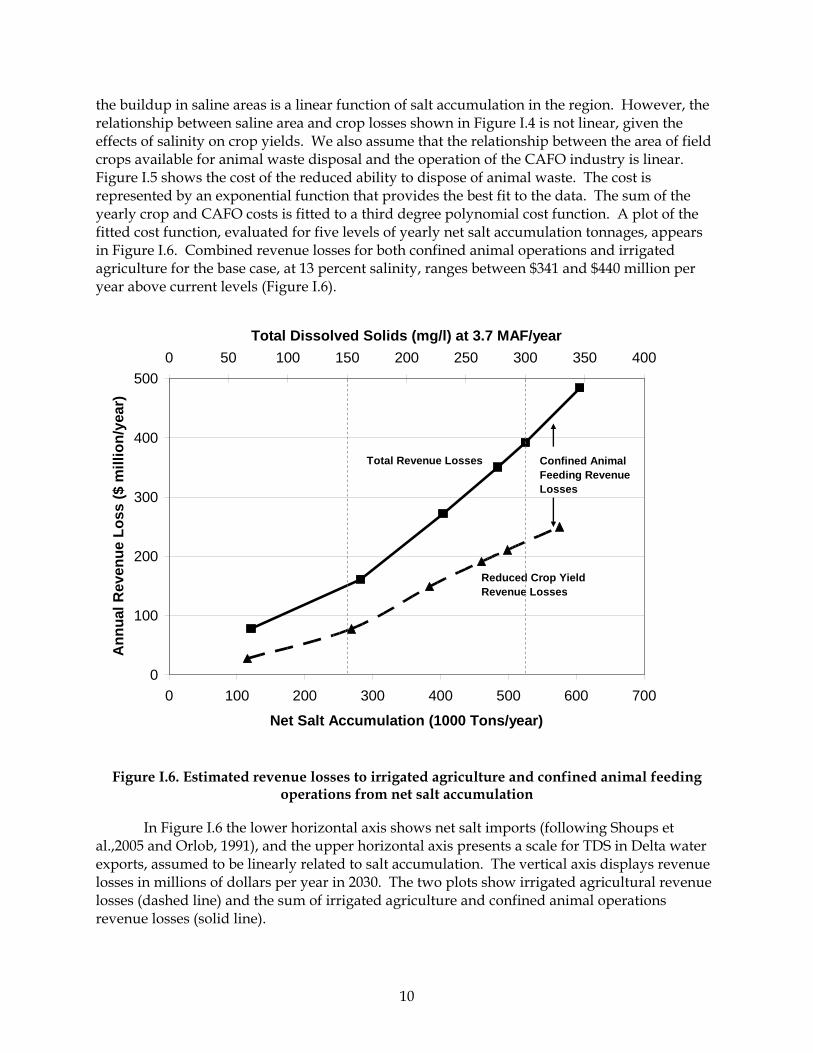
the buildup in saline areas is a linear function of salt accumulation in the region. However, the relationship between saline area and crop losses shown in Figure I.4 is not linear, given the effects of salinity on crop yields. We also assume that the relationship between the area of field crops available for animal waste disposal and the operation of the CAFO industry is linear. Figure I.5 shows the cost of the reduced ability to dispose of animal waste. The cost is represented by an exponential function that provides the best fit to the data. The sum of the yearly crop and CAFO costs is fitted to a third degree polynomial cost function. A plot of the fitted cost function, evaluated for five levels of yearly net salt accumulation tonnages, appears in Figure I.6. Combined revenue losses for both confined animal operations and irrigated agriculture for the base case, at 13 percent salinity, ranges between $341 and $440 million per year above current levels (Figure I.6).
0
100
200
300
400
500
0 100 200 300 400 500 600 700
Net Salt Accumulation (1000 Tons/year)
Ann
ual R
even
ue L
oss
($ m
illio
n/ye
ar)
0 50 100 150 200 250 300 350 400Total Dissolved Solids (mg/l) at 3.7 MAF/year
Reduced Crop YieldRevenue Losses
Confined Animal Feeding Revenue Losses
Total Revenue Losses
Figure I.6. Estimated revenue losses to irrigated agriculture and confined animal feeding operations from net salt accumulation
In Figure I.6 the lower horizontal axis shows net salt imports (following Shoups et al.,2005 and Orlob, 1991), and the upper horizontal axis presents a scale for TDS in Delta water exports, assumed to be linearly related to salt accumulation. The vertical axis displays revenue losses in millions of dollars per year in 2030. The two plots show irrigated agricultural revenue losses (dashed line) and the sum of irrigated agriculture and confined animal operations revenue losses (solid line).

11
As noted above, irrigated agricultural revenue losses are expected to be approximately $211 million per annum by year 2030 under current Delta water export conditions, with salinity (measured as TDS) of 300 mg/l. If TDS is decreased by 150 mg/l – to the level of salinity in the Sacramento River upstream of the Delta (upper horizontal axis Figure I.6) - crop revenue loss would decrease to $71 million per year. Total revenue losses (both for confined animal feeding operations and irrigated agriculture) would decrease from $392 to $151 million per year. Looking at likely ranges, this change in surface water source would generate savings on the order of $210 to $270 million per year. This decrease in TDS implies reduction of more than 160 thousand tons of net salt accumulation (lower horizontal axis, Figure I.6).
With current patterns of salt accumulation, average annual salinity costs are roughly $1.31 million per mg/l by 2030, with marginal annual salinity costs close to $1.81 million per mg/l, for 3.7 maf of annual deliveries. This translates into an average cost of $0.35 per mg/l and a marginal cost of $0.45 per mg/l per acre-foot of agricultural water delivered to the southern Central Valley. While these are preliminary cost estimates, they indicate the importance of export salinity for southern Central Valley agriculture. For example, by 2030, a 150 mg/l reduction in salinity of water exported to the region could result in a savings of $65 per acre-foot of water delivered.
Figure I.7 puts salinity costs for crops and CAFO into a time context for 200 and 300 mg/l of TDS in the California Aqueduct and the Delta Mendota Canal (where the 200 mg/l example could represent a blending of water from a peripheral canal and continued through-Delta exports). At 300 mg/l, saline area increases by 0.5 percent per year (upper horizontal axis); when salinity is reduced to 200 mg/l , this rate slows to about 0.33 percent per year. With this slower pace of salt accumulation, the total losses for crops and CAFO of $392 million per year would be postponed from 2030 to 2043, 13 years later.

12
Figure I.7. Estimated timescale for annual salinity costs at 200 and 300 mg/l of TDS in Central Valley surface water
Economic Effects of Salinity Changes from Different Sizes of Peripheral Canal
Using an upstream peripheral canal intake on the Sacramento River would reduce the average salinity of water exported to the southern Central Valley. This section summarizes the aggregate economic effects of changes in salinity due to different peripheral canal configurations on southern Central Valley agriculture. The analysis draws on results from hydrodynamic modeling of dual facilities presented in Appendix C. These modeling scenarios, simulated for water supply and daily export and operational conditions that occurred over the period 1981-2000, constrain the use of a peripheral canal by requiring minimum environmental flows on the Sacramento River. This operational constraint leads to reduced exports from the canal when there are insufficient excess flows on the Sacramento River, with the balance of daily export levels met by through-Delta pumping. As a result, there are decreasing returns to peripheral canal capacity, as described in Appendix C. Over the 1981-2000 simulation period, annual total water exports from the Delta averaged 4.9 maf, somewhat lower than more recent levels of roughly 6 maf per year.
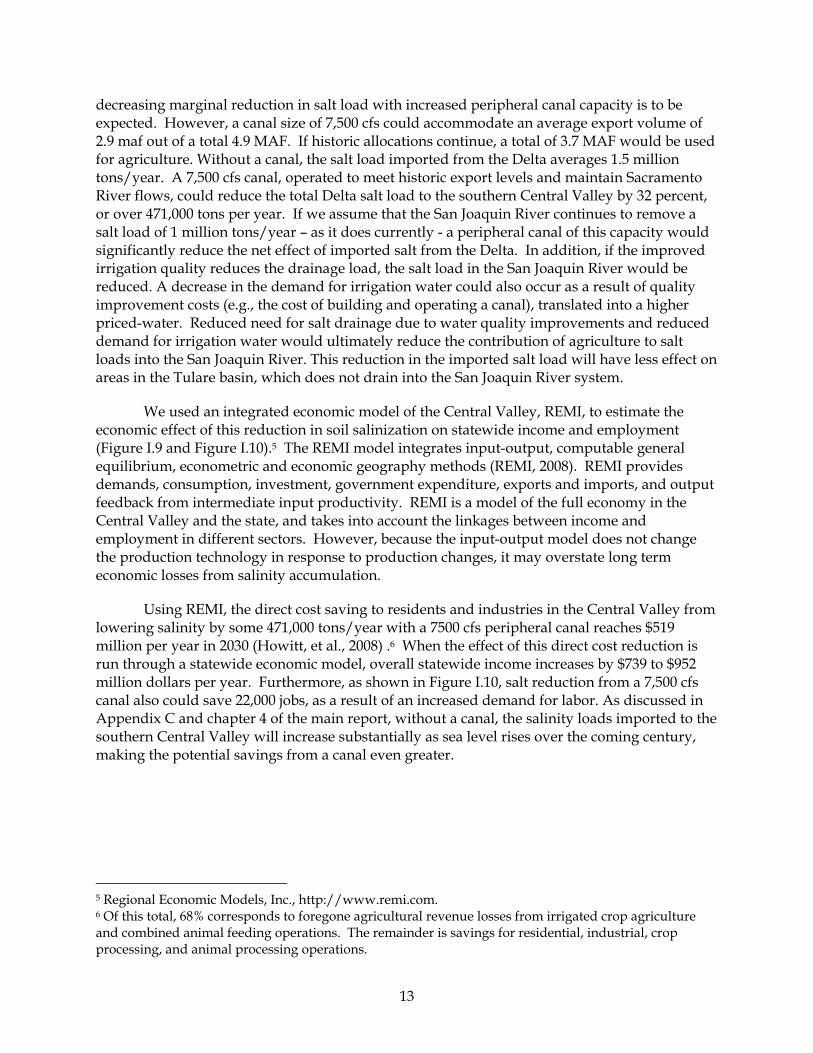
The results of changes in average daily salt load measured in tons are shown in Figure I.8. Since the frequency of using all available canal capacity decreases for larger canal sizes, a
13
decreasing marginal reduction in salt load with increased peripheral canal capacity is to be expected. However, a canal size of 7,500 cfs could accommodate an average export volume of 2.9 maf out of a total 4.9 MAF. If historic allocations continue, a total of 3.7 MAF would be used for agriculture. Without a canal, the salt load imported from the Delta averages 1.5 million tons/year. A 7,500 cfs canal, operated to meet historic export levels and maintain Sacramento River flows, could reduce the total Delta salt load to the southern Central Valley by 32 percent, or over 471,000 tons per year. If we assume that the San Joaquin River continues to remove a salt load of 1 million tons/year – as it does currently - a peripheral canal of this capacity would significantly reduce the net effect of imported salt from the Delta. In addition, if the improved irrigation quality reduces the drainage load, the salt load in the San Joaquin River would be reduced. A decrease in the demand for irrigation water could also occur as a result of quality improvement costs (e.g., the cost of building and operating a canal), translated into a higher priced-water. Reduced need for salt drainage due to water quality improvements and reduced demand for irrigation water would ultimately reduce the contribution of agriculture to salt loads into the San Joaquin River. This reduction in the imported salt load will have less effect on areas in the Tulare basin, which does not drain into the San Joaquin River system.
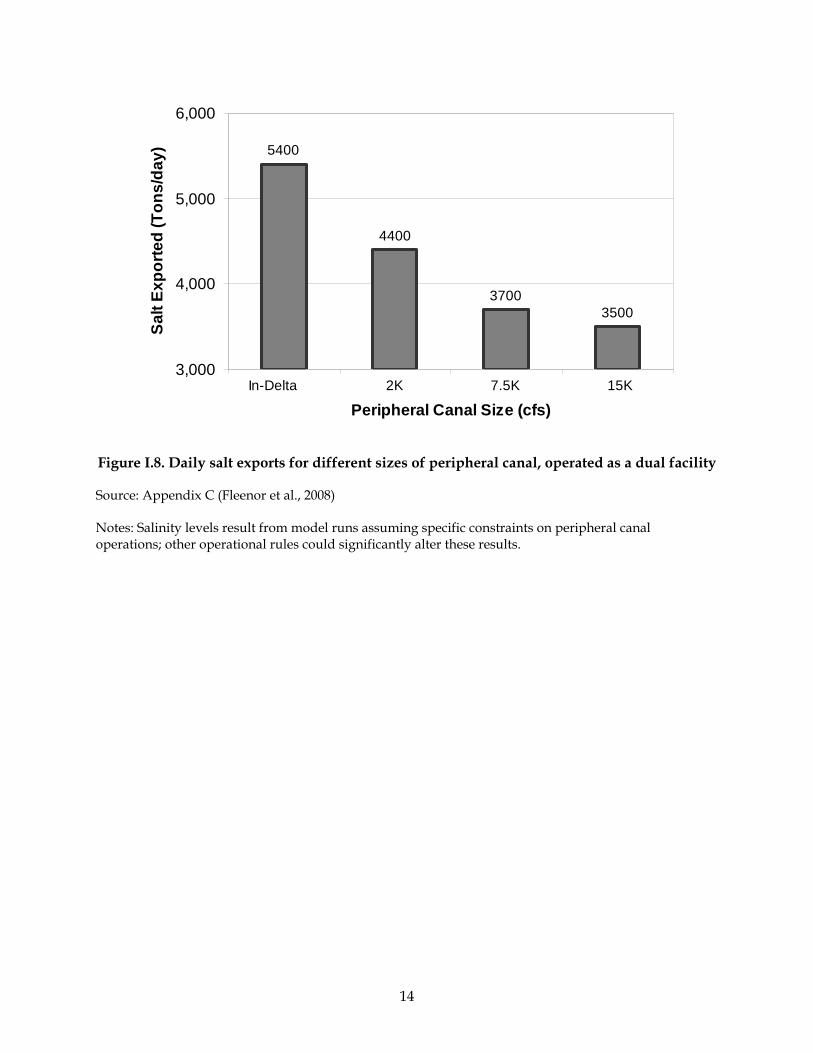
We used an integrated economic model of the Central Valley, REMI, to estimate the economic effect of this reduction in soil salinization on statewide income and employment (Figure I.9 and Figure I.10).5 The REMI model integrates input-output, computable general equilibrium, econometric and economic geography methods (REMI, 2008). REMI provides demands, consumption, investment, government expenditure, exports and imports, and output feedback from intermediate input productivity. REMI is a model of the full economy in the Central Valley and the state, and takes into account the linkages between income and employment in different sectors. However, because the input-output model does not change the production technology in response to production changes, it may overstate long term economic losses from salinity accumulation.
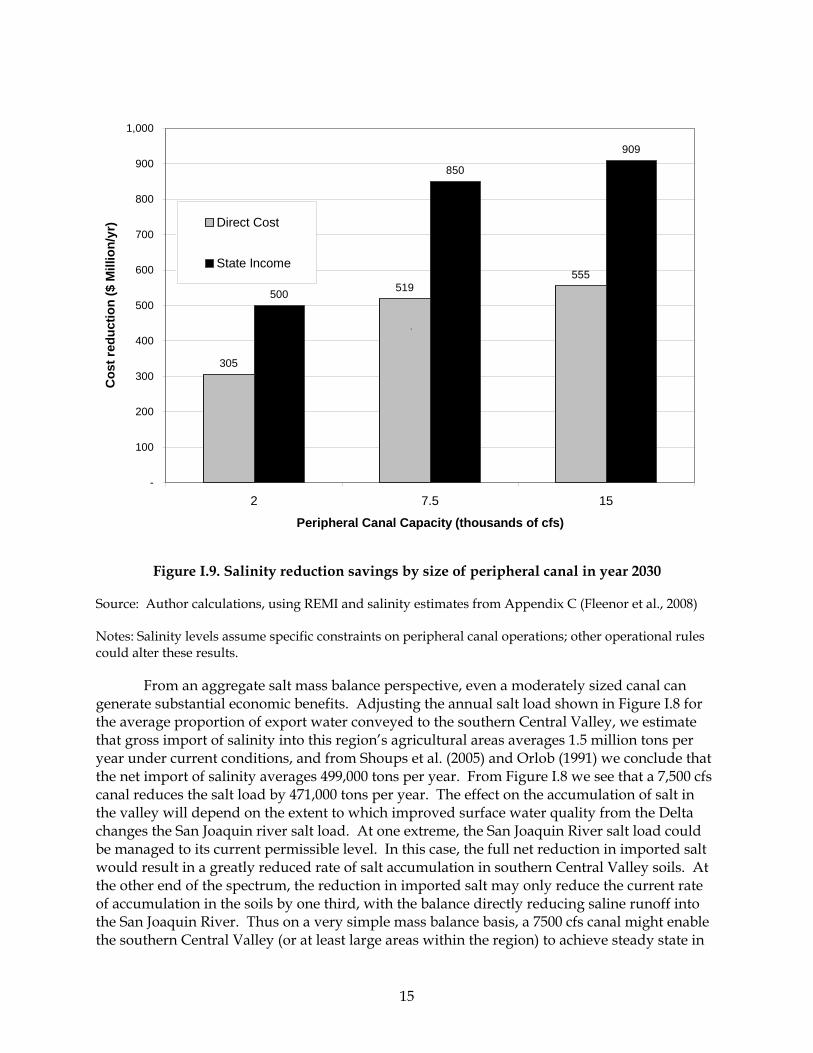
Using REMI, the direct cost saving to residents and industries in the Central Valley from lowering salinity by some 471,000 tons/year with a 7500 cfs peripheral canal reaches $519 million per year in 2030 (Howitt, et al., 2008) .6 When the effect of this direct cost reduction is run through a statewide economic model, overall statewide income increases by $739 to $952 million dollars per year. Furthermore, as shown in Figure I.10, salt reduction from a 7,500 cfs canal also could save 22,000 jobs, as a result of an increased demand for labor. As discussed in Appendix C and chapter 4 of the main report, without a canal, the salinity loads imported to the southern Central Valley will increase substantially as sea level rises over the coming century, making the potential savings from a canal even greater.
5 Regional Economic Models, Inc., http://www.remi.com. 6 Of this total, 68% corresponds to foregone agricultural revenue losses from irrigated crop agriculture and combined animal feeding operations. The remainder is savings for residential, industrial, crop processing, and animal processing operations.
14
5400
4400
37003500
3,000
4,000
5,000
6,000
Peripheral Canal Size (cfs)
Salt
Expo
rted
(Ton
s/da
y)
In-Delta 2K 7.5K 15K
Figure I.8. Daily salt exports for different sizes of peripheral canal, operated as a dual facility
Source: Appendix C (Fleenor et al., 2008)
Notes: Salinity levels result from model runs assuming specific constraints on peripheral canal operations; other operational rules could significantly alter these results.
15
305
519555
500
850
909
-
100
200
300
400
500
600
700
800
900
1,000
2 7.5 15
Peripheral Canal Capacity (thousands of cfs)
Cos
t red
uctio
n ($
Mill
ion/
yr) Direct Cost
State Income
`
Figure I.9. Salinity reduction savings by size of peripheral canal in year 2030
Source: Author calculations, using REMI and salinity estimates from Appendix C (Fleenor et al., 2008)
Notes: Salinity levels assume specific constraints on peripheral canal operations; other operational rules could alter these results.
From an aggregate salt mass balance perspective, even a moderately sized canal can generate substantial economic benefits. Adjusting the annual salt load shown in Figure I.8 for the average proportion of export water conveyed to the southern Central Valley, we estimate that gross import of salinity into this region’s agricultural areas averages 1.5 million tons per year under current conditions, and from Shoups et al. (2005) and Orlob (1991) we conclude that the net import of salinity averages 499,000 tons per year. From Figure I.8 we see that a 7,500 cfs canal reduces the salt load by 471,000 tons per year. The effect on the accumulation of salt in the valley will depend on the extent to which improved surface water quality from the Delta changes the San Joaquin river salt load. At one extreme, the San Joaquin River salt load could be managed to its current permissible level. In this case, the full net reduction in imported salt would result in a greatly reduced rate of salt accumulation in southern Central Valley soils. At the other end of the spectrum, the reduction in imported salt may only reduce the current rate of accumulation in the soils by one third, with the balance directly reducing saline runoff into the San Joaquin River. Thus on a very simple mass balance basis, a 7500 cfs canal might enable the southern Central Valley (or at least large areas within the region) to achieve steady state in

16
terms of net salinity imports. The salt load that results from mobilization of salt from subsurface marine layers (e.g. the Corcoran Clay) would remain mostly unchanged by improvement in imported water quality, unless the improvement reduced leaching fractions that salinize deep groundwater. Although this salinization process is slower, it may pose an additional challenge to future uses of deep groundwater (Shoups et al. 2005).
13
2224
-
5
10
15
20
25
30
2 7.5 15
Peripheral Canal Capacity (thousands cfs)
Jobs
sav
ed (t
hous
ands
)
Figure I.10. Jobs saved by peripheral canal size in year 2030
17
3. Model Limitations and Further Work
Limitations of the model arise from data availability and model specification. Estimated revenue losses are driven by changes in the acreage of saline-affected zones, with the assumption that less saline regions will tend to have higher crop yields. SWAP was calibrated to observed land use in each saline zone; nevertheless, the cropping pattern for each saline zone was preserved as its area changed. In practice, cropping patterns might shift with large increases in a particular zone, particularly for crops in which California has a large market share. Calibration to observed values of land use in salinity-affected areas may introduce a bias in revenue losses. As yields decline in salinity-affected areas, costs also need to decline if farms are to continue earning positive net revenues. In the modeling work, this issue was addressed by reducing costs in proportion to yield reductions in the saline zones. If farmers are not able to reduce production costs to this extent, the revenue losses would be higher than those reported here.
Another caveat in this preliminary cost estimation is the relationship between TDS, net salt accumulation tonnage, and non-saline land area reduction. It was assumed these three parameters have a linear relationship, but this is probably not the case. If the non-saline area is reduced at a lower rate than the TDS and the net salt accumulation tonnage, our estimates of revenue losses may be overstated. Furthermore, it is assumed that the salinity-affected areas grow in proportion to the current net imported salt loads south of the Delta. Estimated gains from a peripheral canal would be lower if net salt accumulation in groundwater is more sensitive to processes other than salt loads in the imported water. As more information becomes available, it will be useful to incorporate these types of details into salinity modeling work. On the same grounds, more research regarding water and salt balance south of the Delta is needed, in particular the relationship between irrigation water quality and salt accumulation in the shallow groundwater and the deep aquifer. This would allow better estimates of the tradeoffs between water quantity and quality in this region.
We are also aware that the analysis of the effect of a peripheral canal on the salt load being imported into the valley is based on historic export levels and standard operations over a 20 year interval. Changes in operations could result in quite different levels of salinity, possibly reducing the exported salt load yet further and also reducing agricultural drainage overall.
Finally, better surface water quality may ultimately influence crop selection in favor of higher-value, less salt-tolerant crops. This adaptation could increase slightly the estimated gains from a peripheral canal.

18
Conclusions
Changing the salinity of Delta exports has a long-term economic effect on agricultural revenues in the southern Central Valley. The cost functions based on revenue losses for irrigated agriculture and confined animal operations are convex, with costs increasing at an increasing rate with net salt accumulation. Revenue losses for continued water exports at 300 mg/l TDS – the current level of salinity at the South Delta pumps - will range between $341 and $440 million per year by 2030. Modest improvements in salinity of exported water can substantially reduce long-term agricultural revenue losses. The regional economic savings would exceed these direct effects.
Preliminary work with a water quality model demonstrates that even a small 2,000 cfs peripheral facility supplementing through-Delta pumping as a dual conveyance for both agricultural and urban users can reduce exported salts from the current Delta by nearly 20 percent; larger capacity canals would increase the benefits to agriculture, because most of the water and quality benefits of a very small canal would likely go to the urban sector.

19
References
Artzy, M. and Hillel, D. "A Defense of the Theory of Progressive Soil Salinization in Ancient Southern Mesopotamia", Geoarchaeology, 1988, 3(3), pp. 235-38.
Department of Water Resources. "San Joaquin Valley Drainage Monitoring Program" California Department of Water Resources. San Joaquin District., Sacramento, California, 2001, available at: <http://www.sjd.water.ca.gov/publications/drainage/dmr/01dmr/01DMReport.pdf>.
Fleenor, W.E., Hanak, E., Lund, J.R., and Mount, J.F., "Delta Hydrodynamics and Water Salinity with Future Conditions," Appendix C of Lund, J., Hanak, E., Fleenor, W., Bennett, W., Mount, J., and Moyle, P., Comparing Futures for the Sacramento-San Joaquin Delta, Public Policy Institute of California, San Francisco, California, 2008.
Ghassemi, F.; Jakeman, A. J.; Nix, H. A. and Australian National University. Salinisation of Land and Water Resources : Human Causes, Extent, Management and Case Studies. CAB International ; in association with Centre for Resource and Environmental Studies, Australian National University 1995.
Howitt, R. E.; Ward, K.B. and Msangi, S. "Statewide Agricultural Production Model" University of California, Davis, Davis, CA, 2001, available at: <http://cee.engr.ucdavis.edu/calvin/>.
Howitt, R.; Kaplan, J.; Larson, D.; MacEwan, D.; Medellin-Azuara, J.; Lee, N. and Horner, G. "Central Valley Salinity Report" Report for the State Water Resources Control Board. University of California, Davis, California, 2008.
Jacobsen, T. and Adams, R.M. "Salt and Silt in Ancient Mesopotamian Agriculture", Science, 1958, 128(3334), pp. 1251-58.
Krich-Brinton. "An Overview of Salt Contamination and a Comparison of Control, Remediation, and Treatment Options to Preserve Useful Water Quality." Masters, University of California, 2004.
Landis, J.D. and Reilly, M. "How We Will Grow: Baseline Projections of California’s Urban Footprint through the Year 2100. Project Completion Report." Department of City and Regional Planning, Institute of Urban and Regional Development, University of California, Berkeley., Berkeley, CA, 2002, available at: <http://www-iurd.ced.berkeley.edu/pub/WP-2003-04-screen.pdf>.
Lund, J.; Hanak, E.; Fleenor, W.; Howitt, R.; Mount, J. and Moyle, P. Envisioning Futures for the Sacramento-San Joaquin Delta. Public Policy Institute of California San Francisco, CA, 2007.
Maianu, A., Salinity Sources and Problems of the Danube River Basin, in R. H. French, Salinity in Watercourses and Reservoirs: Proceeding of the 1983 International Symposium on State-of-the-Art Control of Salinity, Butterworth, Salt Lake City, Utah.1984, pp 105-14.
O'Brien, T.A., The Problem of Salinity and Its Control, River Murray, Australia, in R. H. French, Salinity in Watercourses and Reservoirs: Proceeding of the 1983 International Symposium on State-of-the-Art Control of Salinity, Butterworth, Salt Lake City, Utah.1984, pp 33-42.

20
Orlob, G.T. "San Joaquin Salt Balance: Future Prospects and Possible Solutions", A. Dinar and D. Zilberman, The Economics and Management of Water and Drainage in Agriculture. Kluwer, Boston, MA., 1991, 143-67.
Powell, M.A. "Salt, Seed and Yields in Sumerian Agriculture: A Critique of the Theory of Progressive Salinization. ", Zeitschrift der Assyrologie, 1985, 75, pp. 7-38.
REMI. "Insight Model Documentation Version 9.0. Regional Economics Models, Inc. ", Amherst, MA. , 2008, available at: < http://www.remi.com >
San Joaquin Valley Drainage Program. "A Management Plan for Agricultural Subsurface Drainage and Related Problems Ont He Westside San Joaquin Valley.", 1990, pp. 183.
____. "Overview of the Use of the Westside Agricultural Drainage Economics Model (Wade) for Plan Evaluation", 1989.
Schoups, G. "Regional-Scale Hydrologic Modeling of Subsurface Water Flow and Reactive Salt Transport in t he Western San Joaquin Valley, California." Dissertation, University of California, Davis, 2004.
Schoups, G.; Hopmans, J.W.; Young, C.A.; Vrugt, J.A.; Wallender, W.W.; Tanji, K.K. and Panday, S. "Sustainability of Irrigated Agriculture in the San Joaquin Valley, California", Proceedings of the National Academy of Sciences, 2005, 102(43), pp. 15352-6.
Van Genuchten, N. T., and G. J. Hoffman "Analysis of Crop Salt Tolerance Data", in I. Shainberg, and J. Shalhevet., eds., Soil Salinity under Irrigation, Processes and Management, Ecological Studies 51, Springer Verlag, New York, 1984, pp. 258-271
U S Bureau of Reclamation Mid Pacific Region. 2002 http://www.usbr.gov/mp/sccao/sld/overview.html

21
About the Authors
Josué Medellín-Azuara is a postdoctoral scholar in the Civil and Environmental Engineering Department at the University of California, Davis. He received a bachelor’s degree in mechanical and electrical engineering and a master’s in business administration from the Instituto Tecnologico de Monterrey (Mexico). His professional experience includes environmental management positions for industry and consulting for non-governmental organizations such as the Natural Heritage Institute. He has led studies on adaptations to climate change in California (funded by the California Energy Commission) and water management in the US Mexico border of Baja California funded by UCMEXUS and CALEPA (http://cee.engr.ucdavis.edu/bajacalvin). Josue holds from UC Davis a master‘s degree in agricultural and resource economics and a PhD in ecology with his dissertation on water management for restoring the Colorado River Delta.
Richard Howitt is a professor and department chair of Agricultural and Resource Economics at the University of California, Davis. He teaches both graduate and undergraduate courses in resource economics, economic theory, and operations research. His current research interests include constructing disaggregated economic modeling methods based on maximum entropy estimators, testing the allocation of water resources by market mechanisms, and developing empirical dynamic stochastic methods to analyze changes in investments and institutions. He serves on advisory boards for the California Department of Water Resources and the U.S. Academy of Sciences.
Jay Lund is a professor in the Civil and Environmental Engineering Department at the University of California, Davis, where he holds the Ray B. Krone Chair in Environmental Engineering and is an Associate Director of the Center for Watershed Sciences. He specializes in the management of water and environmental systems. He served on the Advisory Committee for the 1998 and 2005 California Water Plan Updates, is a former Editor of the Journal of Water Resources Planning and Management, and has authored or co-authored over 200 publications.
Ellen Hanak is a senior fellow and associate director of research at the Public Policy Institute of California. Her career has focused on the economics of natural resource management and agricultural development. At PPIC, she has launched a research program on water policy and has published reports and articles on water marketing, water and land use planning, water conservation, and management of the Sacramento-San Joaquin Delta. Other areas of expertise include infrastructure finance and climate change. Before joining PPIC in 2001, she held positions with the French agricultural research system, the President’s Council of Economic Advisers, and the World Bank. She holds a Ph.D. in economics from the University of Maryland.

PUBLIC POLICY INSTITUTE OF CALIFORNIA
Board of Directors
Thomas C. Sutton, Chair Retired Chairman and Chief Executive Officer Pacific Life Insurance Company
Mark Baldassare President and Chief Executive Officer Public Policy Institute of California
Ruben Barrales President and Chief Executive Officer San Diego Regional Chamber of Commerce
Edward K. Hamilton Chairman Hamilton, Rabinovitz & Associates, Inc.
Gary K. Hart Former State Senator and Secretary of Education State of California
Walter B. Hewlett Director Center for Computer Assisted Research in the Humanities
Donna Lucas Chief Executive Officer Lucas Public Affairs
Leon E. Panetta Director The Leon & Sylvia Panetta Institute for Public Policy
Ki Suh Park Design and Managing Partner Gruen Associates
Constance L. Rice Co-Director The Advancement Project
Raymond L. Watson Vice Chairman of the Board Emeritus The Irvine Company
Carol Whiteside President Emeritus Great Valley Center
PUBLIC POLICY INSTITUTE OF CALIFORNIA 500 Washington Street, Suite 600 San Francisco, California 94111 phone: 415.291.4400 fax: 415.291.4401 PPIC SACRAMENTO CENTER Senator Office Building 1121 L Street, Suite 801 Sacramento, California 95814 phone: 916.440.1120 fax: 916.440.1121 www.ppic.org