the economic consequences of undernutrition in pakistan
TRANSCRIPT
1Islamabad/Bangkok, 2016
The Economic Consequences of Undernutrition in PakistanAn Assessment of Losses
All Rights Reserved© WFP 2017.
World Food Programme (WFP) PakistanPlot no. 1, Diplomatic Enclave No 1, Sector G-5, Islamabad, Pakistan
World Food Programme (WFP) Regional Bureau for Asia and the Pacific Wave Place Bldg., 7th Floor, 55 Wireless Road, Lumpini, Patumwan, Bangkok 10330, Thailand
The designations employed in WFP publications, which are in conformity with United Nations practice, and the presentation of material therein do not imply the expression of any opinion whatsoever on the part of the World Food Programme concerning the legal status of any country, area or territory or of its authorities, or concerning the delimitation of its frontiers.
The responsibility for opinions expressed in signed articles, studies and other contributions rests solely with their authors, and publication does not constitute an endorsement by the World Food Programme of the opinions expressed in them.
3
Foreword
Pakistan is steadily undergoing a process of urbanization, with 38% of the population now living in urban areas and 22% living in cities of more than 1 million people. The progress of urbanization is expected to increase. In addition to the critical issue of pervasive and persistent malnutrition in Pakistan, rising urbanization is bringing a new set of developmental concerns.
High prevalence of malnutrition in urban areas requires a different approach to nutrition programming than the one traditionally used in rural areas. In urban areas in Pakistan, access to health services is generally high and socioeconomic status is relatively higher, although clear disparities can be found between non-slum and slum urban areas. In addition, urban households are often reliant on purchased foods for consumption and do not have plots of land available for food production, unlike in rural areas.
The Government of Pakistan, the World Food Programme (WFP) in Pakistan and WFP’s regional bureau for Asia and the Pacific have joint the efforts to carry out the analysis ‘Nutrition in the Cities: Nutrition status of urban children under 5 years of age in Pakistan’. The objective of this analysis is to produce an evidence-based document that provides key information to better understand the magnitude of malnutrition in urban Pakistan and its influencing variables. Along with the Cost of the Diet and Fill the Nutrient Gap analyses, the findings included in this report pinpoint the major factors that affect the nutrition status of children under five years of age and their mothers, and identify possible avenues for solutions.
The 2011 National Nutrition Survey found very high prevalence of malnutrition in urban children, with acute malnutrition, chronic malnutrition and micronutrient deficiencies all major public health problems. While the prevalence of stunting (chronic malnutrition) is lower than in rural areas, at 36% it is considered to be high and a serious public health concern. Most concerning, the prevalence of wasting (acute malnutrition) and micronutrient deficiencies is critically high for both urban and rural areas, with no significant differences between the two. In addition, the report ‘Nutrition in the Cities: Nutrition status of urban children under 5 years of age in Pakistan’ identifies that malnutrition (stunting, wasting, micronutrient deficiencies) is high across all urban wealth quintiles and that 99% of urban children are affected by at least one or more forms of malnutrition. This complements the findings from the Minimum Cost of the Diet (CotD) in Pakistan (2016) report, also carried out in coordination between the Government of Pakistan and WFP, which estimated that a large majority of the urban households cannot afford a nutritious diet.
At a time when the Government of Pakistan is set to achieve the Sustainable Development Goals by 2030 as well as the goals identified within Vision 2025, the current levels of undernutrition are unacceptable and need to be addressed urgently. This report raises awareness on the importance of addressing malnutrition in urban areas of Pakistan, since national and regional malnutrition trends are greatly influenced by urban malnutrition trends, given its scope and size. Therefore, the results of the ‘Nutrition in the Cities: Nutrition status of urban children under 5 years of age in Pakistan’ analysis provides convincing evidence that can be strategically used to influence food and nutrition policy and programmatic work at national and decentralized levels.
We hope you will read this report in conjunction with the Cost of Diet and Fill the Nutrient Gap analysis reports, and will act upon the results of these reports in a coordinated fashion, under guidance from the competent governmental institutions, to ensure the right to adequate food and nutrition by all the Pakistani population, and to pave the way to future success in the drastic reduction of malnutrition in the country. To ensure efforts are effectively coordinated, we look forward to working together across sectors, such as health, agriculture, social protection and education, and across partners, including the private sector, in order to dramatically reduce urban malnutrition in Pakistan in a sustainable manner.
Prof. Ahsan Iqbal,Federal Minister for Planning, Development and Reform
Mr Finbarr Curran,WFP Country Director and Representative in Pakistan

4
5
Table of Contents
Acknowledgements .................................................................................................................... 7
Executive Summary: .................................................................................................................. 8
1. Introduction ......................................................................................................................... 10
1.1 The Status Quo: Current Indicators of Undernutrition in Pakistan ............................................ 10
1.2 Introduction to the Economic Analysis of Undernutrition: ....................................................... 12
1.3 Caveat to the “Consequence Model” Methodology ................................................................. 14
2. Pathway #1: Child Mortality Attributable to Malnutrition ..................................................... 15
2.1 Maternal Nutrition: Stature, BMI & Anemia ........................................................................... 16
2.2 Anthropometric Indicators: Height-for-Weight Z-scores (WHZ) & Weight-for-Age Z-scores (WAZ) ....................................................................................... 18
2.3 Mortality Attributed to Sub-Optimal Breastfeeding ................................................................. 20
2.4 Mortality Associated with Micronutrient Deficiencies ............................................................... 23
2.5 Summary Attributions for Child Mortality .............................................................................. 24
2.6 Estimating the Value of Workforce Lost to Child Mortality ....................................................... 25
2.7 Perspectives on Interventions to Reduce Child Mortality ......................................................... 26
3. Pathway #2: Reduced Future Productivity of Children ....................................................... 27
3.1 Stunting or Small Stature for age ....................................................................................... 27
3.2 Anemia in Children: .......................................................................................................... 29
3.3 Iodine Deficiency Disorders (IDD) ....................................................................................... 30
3.4 Long Term Disability from Folic Acid Related Neural Tube Defects ............................................ 31
3.5 Summary Attributions for Losses in Future Productive Potential .............................................. 31
4. Pathway #3: Reduced Current Productivity: Anemia in Adult Workers ............................... 32
5. Pathway #4: Excess Healthcare Expenditures ..................................................................... 34
5.1 Cases of Diarrhea and ARI from Zinc Deficiency and Suboptimal Breastfeeding ......................... 34
5.2 Low Birth weight Cases Associated with three Indicators of Maternal Nutrition Status ................ 38
6. Summary: National Economic Consequences of Child Undernutrition ................................... 40
Annex I: Summary Coefficients of Risk or Deficit ..................................................................... 42
Annex II: Definition of Terms .................................................................................................. 44
Annex III: Income or Earnings Estimates ................................................................................ 46
Annex IV: Adjusting for Multiple Risks ..................................................................................... 48
Annex V: Segmented Estimates for Breastfeeding Rates .......................................................... 49
Annex VI: NTD Rates ............................................................................................................... 50
Annex VII: Healthcare Cost Calculations ................................................................................. 51
Annex VIII: Global Anemia Prevalence Estimates .................................................................... 53
Annex IX: Population: Applying 2007 Census Segments to Current Population ....................... 54

6
7
Acknowledgements
This report is a result of collaboration between the Nutrition Section of Ministry of Planning, Development and Reform, Pakistan and the United Nations World Food Programme (WFP) Pakistan Country Office. The author and main contributor to the study was Jack Bagriansky, WFP consultant. The analysis was supervised and technical inputs provided by Cecilia Garzon (Head of Nutrition, WFP Pakistan) and Ali Ahmad Khan (Nutrition Officer, WFP Pakistan).
Mr. Aslam Shaheen (Chief Nutrition/ SUN Focal Point, Ministry of Planning Development and Reform) and Dr. Baseer Khan Achakzai (Director Nutrition, Ministry of National Health Services, Regulation and Coordination) provided valuable guidance and support for the successful completion of this analysis and report.
The team gratefully acknowledges the cooperation of the Pakistan Bureau of Statistics in providing the datasets needed for the analysis, WFP Pakistan Nutrition team and Pakistan SUN Secretariat in Nutrition Section of the Ministry of Planning Development & Reform for providing the support to the work and dissemination.
The design of this document was coordinated by Cecilia De Bustos (RBB) and carried out by ScandMedia. Shati Rahman (RBB), Jeanne Spillane (RBB), Anoushka Boteju (WFP Pakistan) and Haseeb Khalid (WFP Pakistan) contributed to the selection of pictures.

8
Executive Summary
As undernutrition increases morbidity and mortality, it also retards physical and cognitive growth, diminishes learning capacity and school performance, and leads to lower adult productivity. However, the tragic visible conditions that mark undernutrition represent only “the tip of the iceberg.”1 The predominant burden emerges from widespread invisible forms of undernutrition, which are characterized by a handful of biological, anthropometric and other nutrition indicators. A consensus of scientific literature has established concrete risks to survival and health, as well as deficits in child development, school performance and adult earnings:
• Poor nutrition status among pregnant women raises the risk of poor birth outcomes and can double the risk of infant mortality.
• Poor anthropometric indicators, along with vitamin and mineral deficiencies and suboptimal breastfeeding behaviors, can lead to a 15-fold increase in mortality risk.
• Childhood stunting and deficiencies in iron and iodine hamper cognitive development, school achievement and adult productivity by 2.5-19.8 percent.
• Adult anemia reduces work performance in manual labor in the areas of agriculture, industry and construction by 5-17 percent, depending on the physical demands of the job.
When different forms of undernutrition are highly prevalent, individual risks and deficits can aggregate and result in a substantial burden on national economic growth. Two recent national surveys, the National Nutrition Survey (NNS) 2011 and the Pakistan Demographic and Health Survey (PDHS) 2013, found widespread undernutrition throughout Pakistan. A summary of 15 indicators measured through these surveys reveals that there are more than 110 million individual cases of undernutrition in Pakistan, including more than half of adult women and possibly 97 percent of children.2
Indicator by indicator, each case of undernutrition brings concrete and quantifiable values for risks and deficits. The “coefficients of risk” are then applied to national prevalence, along with demographic, health, economic and labor statistics, to project the magnitude of reduction of the national economic activity that is associated with the undernutrition status quo.3
Computer modeling undertaken for the 15 indicators of undernutrition mentioned above indicates that the economic consequences emerging from the current prevalence and risk factors for poor nutritional status, as documented by the NNS (2011) and PDHS (2013), totals US$ 7.6 billion annually for Pakistan, which corresponds to nearly 3 percent of GDP. The cost of the status quo is measured via four pathways:
• Maternal nutrition and breastfeeding behavior, along with child underweight, wasting and micronutrient deficiencies, are linked to approximately 177,000 deaths annually in Pakistan, which corresponds to more than one-third of all-child mortality. The lost future workforce is valued at US$ 2.24 billion per year.
• Cognitive deficits derived from childhood stunting, anemia and iodine deficiency disorders will result in reduced future adult productivity, which is valued at a Net Present Value (NPV) of US$ 3.7 billion per year.
• Projections indicate that anemia among adult men and women who are engaged in agriculture, industry and other manual labor will lower their economic output by US$ 657 million per year.
• The cost of utilization of health care services due to zinc deficiencies, suboptimal breastfeeding and low birth weight is estimated at approximately US$ 1 billion annually.
1 Latham, Michael, Human Nutrition in the Developing World, Food and Nutrition Series - No. 29 FAO 1997
2 Word Food Programme and Ministry of Planning, Development and Reform – Government of Pakistan (2016). Nutrition in the Cities: Nutrition status of urban children under 5 years of age in Pakistan. Islamabad/Bangkok; World Food Programme.
3 Summary of Coefficients of Risk or Deficit used in Assessment are found in Annex I as well as explained in the text.
9
Every year, with each cohort of newborns, the annual US$ 7.6 billion burden accumulates. Evidence from the global literature indicates that effective, affordable and feasible nutrition programs can achieve significant reductions in undernutrition. A full portfolio of nutrition interventions includes the development of long-term “nutrition-sensitive” interventions as well as a range of “nutrition-specific” interventions that lower the prevalence of many undernutrition indicators within several years. The very high “Cost of Doing Nothing” suggests that the economic – as well as human and social - returns of investment on nutrition programs will be substantial.
Investment to reduce the prevalence of undernutrition lays the foundation for the ambitious first pillar of Pakistan’s Vision 2025: “The first priority is to provide every citizen the ability to improve his/her choices and quality of life. This requires capitalizing upon and strengthening existing social capital, improving the human skill base of the population, and providing access to opportunities for advancement. It involves a rapid scaling-up of investments in education, health and social development.”

10
The
Econ
omic
Con
seq
uen
ces
of U
nd
ern
utr
itio
n in
Pak
ista
n:
An
Ass
essm
ent
of L
osse
s
1. Introduction
Undernutrition is both a cause and a consequence of poverty. Poverty and undernutrition are locked in a vicious cycle of child morbidity and mortality, retarded physical and cognitive growth, diminished learning capacity and school performance, and ultimately lower adult productivity and earnings. This negatively affects national economies, eroding the foundation of economic growth: peoples’ strength and energy, creative and analytical capacity, initiative and entrepreneurial drive.
The immediately visible conditions that mark undernutrition represent only “the small tip of the iceberg…. 1-5 percent of the burden of undernutrition”.4 In reality, the predominant burden of undernutrition emerges from widespread “sub-clinical” indices of undernutrition, characterized by a handful of biological, anthropometric and other nutrition indicators. These indicators are concretely and quantifi ably associated with not only health and survival, but with physical and intellectual development, school performance and adult productivity. When prevalence is widespread, individual risks and defi cits can aggregate into a substantial burden on national economic growth.
Consequently, achieving reductions in the prevalence of undernutrition can generate human capital and fuel economic development. The traditional rationale for investment in nutrition programs is a moral imperative: nutrition is basic to the protection of human rights and good governance. Based on evidence that links nutrition to productivity, job performance and the overall quality of human resources, this paper seeks to augment this traditional rational with a purely economic case for investing in nutrition.
1.1 The Status Quo: Current Indicators of Undernutrition in Pakistan
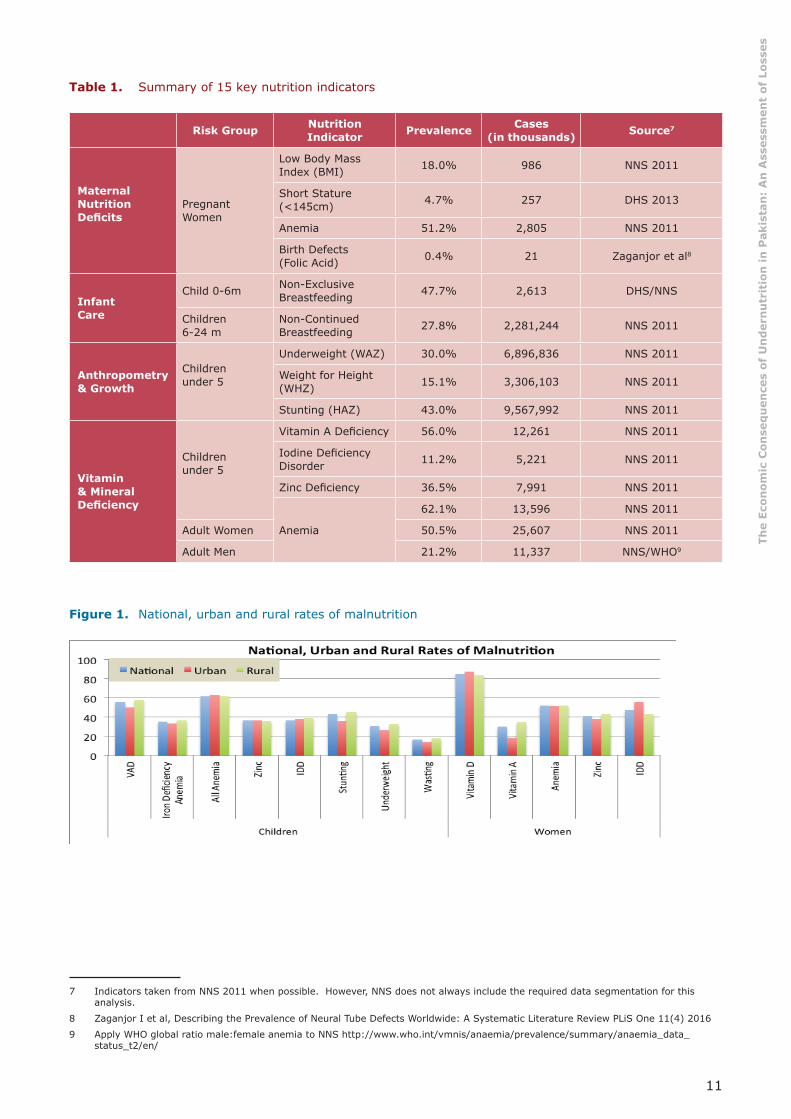
Indicators of undernutrition documented in national surveys, including the National Nutrition Survey (NNS) 2011 and the Pakistan Demographic and Health Survey (PDHS) 2013, pinpoint a signifi cant burden on national human, social and economic development. As shown in Table 1, the results derived from 15 individual indicators of undernutrition from those national surveys suggest there are approximately 110 million individual cases of undernutrition in Pakistan – including at least half of adult women and at least two thirds of children. A recent survey in urban areas identifi ed at least one indicator of malnutrition in 97 percent of children.5 In contrast, there are 1.27 million children with severe acute undernutrition (SAM).6 These children at highest risk of undernutrition, morbidity and mortality require urgent attention. However, they represent a minute fraction of the total national health, social and economic burden of undernutrition, constituting therefore the tip of the iceberg.
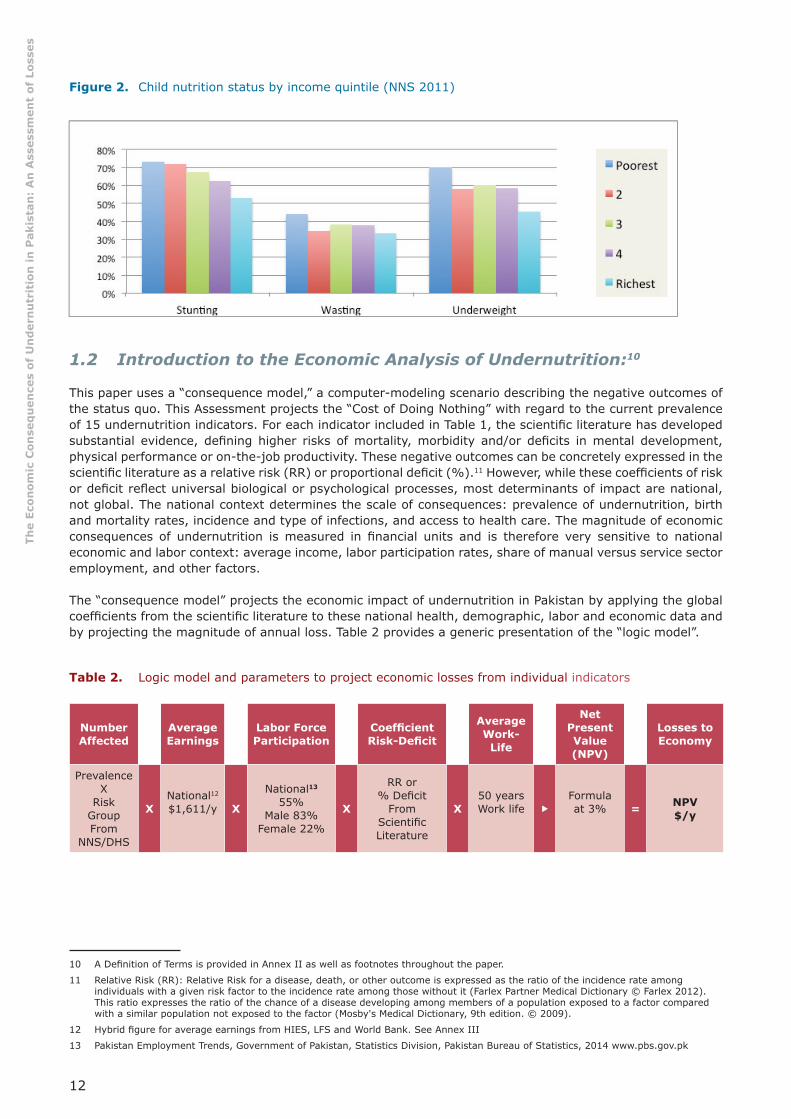
The rural and the poor suffer most. However, different forms of undernutrition expand throughout the population regardless of income or domicile. Figure 1 below illustrates that, in general, individual indicators do not differ signifi cantly between urban and rural areas. While less affl uent children are more likely to be underweight, wasted or stunted, as shown in Figure 2, the prevalence of different forms of undernutrition among children in the most affl uent quintile is high, around 33-53 percent, indicating a widespread public health threat.
4 Latham, Michael, Human Nutrition in the Developing World, Food and Nutrition Series - No. 29 FAO 1997
5 Word Food Programme and Ministry of Planning, Development and Reform – Government of Pakistan (2016). Nutrition in the Cities: Nutrition status of urban children under 5 years of age in Pakistan. Islamabad/Bangkok; World Food Programme.
6 Defi ned as <3SD Weight for Height : Prevalence (5.8%) x Risk Group Population (21.9. million) children 6-59 months of age.
11
The
Econ
omic
Con
seq
uen
ces
of U
nd
ern
utr
itio
n in
Pak
ista
n:
An
Ass
essm
ent
of L
osse
s
Table 1. Summary of 15 key nutrition indicators 7 8 9
Risk Group Nutrition Indicator Prevalence Cases
(in thousands) Source7
Maternal Nutrition Defi cits
Pregnant Women
Low Body Mass Index (BMI) 18.0% 986 NNS 2011
Short Stature (<145cm) 4.7% 257 DHS 2013
Anemia 51.2% 2,805 NNS 2011
Birth Defects(Folic Acid) 0.4% 21 Zaganjor et al8
Infant Care
Child 0-6m Non-Exclusive Breastfeeding 47.7% 2,613 DHS/NNS
Children6-24 m
Non-Continued Breastfeeding 27.8% 2,281,244 NNS 2011
Anthropometry& Growth
Children under 5
Underweight (WAZ) 30.0% 6,896,836 NNS 2011
Weight for Height (WHZ) 15.1% 3,306,103 NNS 2011
Stunting (HAZ) 43.0% 9,567,992 NNS 2011
Vitamin & Mineral Defi ciency
Children under 5
Vitamin A Defi ciency 56.0% 12,261 NNS 2011
Iodine Defi ciency Disorder 11.2% 5,221 NNS 2011
Zinc Defi ciency 36.5% 7,991 NNS 2011
Anemia
62.1% 13,596 NNS 2011
Adult Women 50.5% 25,607 NNS 2011
Adult Men 21.2% 11,337 NNS/WHO9
Figure 1. National, urban and rural rates of malnutrition
7 Indicators taken from NNS 2011 when possible. However, NNS does not always include the required data segmentation for this analysis.
8 Zaganjor I et al, Describing the Prevalence of Neural Tube Defects Worldwide: A Systematic Literature Review PLiS One 11(4) 2016
9 Apply WHO global ratio male:female anemia to NNS http://www.who.int/vmnis/anaemia/prevalence/summary/anaemia_data_status_t2/en/
12
The
Econ
omic
Con
seq
uen
ces
of U
nd
ern
utr
itio
n in
Pak
ista
n:
An
Ass
essm
ent
of L
osse
s
Figure 2. Child nutrition status by income quintile (NNS 2011)
1.2 Introduction to the Economic Analysis of Undernutrition:10
This paper uses a “consequence model,” a computer-modeling scenario describing the negative outcomes of the status quo. This Assessment projects the “Cost of Doing Nothing” with regard to the current prevalence of 15 undernutrition indicators. For each indicator included in Table 1, the scientifi c literature has developed substantial evidence, defi ning higher risks of mortality, morbidity and/or defi cits in mental development, physical performance or on-the-job productivity. These negative outcomes can be concretely expressed in the scientifi c literature as a relative risk (RR) or proportional defi cit (%).11 However, while these coeffi cients of risk or defi cit refl ect universal biological or psychological processes, most determinants of impact are national, not global. The national context determines the scale of consequences: prevalence of undernutrition, birth and mortality rates, incidence and type of infections, and access to health care. The magnitude of economic consequences of undernutrition is measured in fi nancial units and is therefore very sensitive to national economic and labor context: average income, labor participation rates, share of manual versus service sector employment, and other factors.
The “consequence model” projects the economic impact of undernutrition in Pakistan by applying the global coeffi cients from the scientifi c literature to these national health, demographic, labor and economic data and by projecting the magnitude of annual loss. Table 2 provides a generic presentation of the “logic model”.
Table 2. Logic model and parameters to project economic losses from individual indicators 12 13
Number Affected
AverageEarnings
Labor Force Participation
Coeffi cient Risk-Defi cit
AverageWork-
Life
Net Present Value (NPV)
Losses to Economy
PrevalenceX
Risk GroupFrom
NNS/DHS
XNational12
$1,611/y X
National13 55%
Male 83%Female 22%
X
RR or% Defi cit
From Scientifi c Literature
X50 yearsWork life �
Formulaat 3% = NPV
$/y
10 A Defi nition of Terms is provided in Annex II as well as footnotes throughout the paper.
11 Relative Risk (RR): Relative Risk for a disease, death, or other outcome is expressed as the ratio of the incidence rate among individuals with a given risk factor to the incidence rate among those without it (Farlex Partner Medical Dictionary © Farlex 2012). This ratio expresses the ratio of the chance of a disease developing among members of a population exposed to a factor compared with a similar population not exposed to the factor (Mosby's Medical Dictionary, 9th edition. © 2009).
12 Hybrid fi gure for average earnings from HIES, LFS and World Bank. See Annex III
13 Pakistan Employment Trends, Government of Pakistan, Statistics Division, Pakistan Bureau of Statistics, 2014 www.pbs.gov.pk

13
The
Econ
omic
Con
seq
uen
ces
of U
nd
ern
utr
itio
n in
Pak
ista
n:
An
Ass
essm
ent
of L
osse
s
The following paragraphs provide details on the national data used to populate Table 2:
• Prevalence values of the various nutrition indicators are taken from the NNS 2011 and the PDHS 2013, unless otherwise noted. Population numbers of the various risk groups are derived from the total population of 188,924,874 projected by the World Bank (2015), and the proportion of various age groups is collected from the Pakistan national census of 1998.14
• The average individual income is diffi cult to establish in an economic environment from a country like Pakistan, where a signifi cant share of the income is originated from either the informal sector, own-production or in-kind labor. The Assessment projects an average of US$ 1,611 annually, based on the average from three sources, namely the World Bank-reported GNI, the Labor Force Survey 2013 and the Household Income and Expenditure Survey 2013-2014. For stunting and adult anemia, estimates are made for average income in manual labor (US$ 1,184/y) versus service sectors (US$ 2,464/y); and in the case of anemia, separate analyses have been carried out for men (US$ 1,310/y) and women (US$ 569/y) in manual labor.15 Based on a 2014 report from the Pakistan Bureau of Statistics, 23 percent of the labor force is estimated to work in industry and 42 percent in agriculture, while 35 percent is estimated to be employed in the service sectors.16
• The economic impact is only estimated for individuals engaged in the workforce. The Assessment applies a labor participation rate reported by the World Bank and the International Labour Organization (ILO) as: 55 percent for the total population, with 83 percent for males and 22.3 percent for females.17 One of the caveats from this conservative methodology is that women who do not participate in the workforce (work outside the household level) are not considered for the analysis, even if they represent approximately three quarters of the total amount of women.
Determining a value for the lifetime of future productivity that is lost to childhood malnutrition is complex. The Assessment projects a 50-year work life, based on children entering the workforce at age 15 and continuing to work until 65 years of age, which constitutes a few years less than Pakistan’s national life expectancy at birth.18 For a child born in 2017, the earnings’ “stream” is not projected to begin until the child enters the work force in 2032 - and those earnings extend 50 years into the future. The available literature in psychology and economics confi rms that people place higher value on benefi ts available in the present, than benefi ts that will be available only 15 to 65 years in the future –the further off in the future, the less perceived value.19
The Net Present Value (NPV) is a subjective factor used to defi ne a future value by applying an interest or discount rate. The NPV substantially reduces the “gross” value of the future earnings, but enables a lifetime of future productivity to be expressed as a current economic loss. Often called a “social discount rate,” the NPV is not related to infl ation or bank interest charges, but merely refl ects the subjective preference for current over future consumption or savings.20 For this Assessment, a 3 percent discount rate was used to calculate NPV of lost future earnings due to child mortality or growth defi cits in childhood. This rate has been used by the World Bank and others to project social impacts.21 While 50 years of gross earnings at US$ 1,611 annually total approximately US$ 80,500, the NPV with a discount rate of 3 percent amounts to ~US$ 22,000. The value of a child’s survival or the child’s future lifetime productivity is dramatically affected by the selected discount rate. For example, with a discount rate of 7 percent, the NPV would value the above lifetime gross earnings at ~US$ 4,100.
14 http://data.un.org/Data.aspx?d=POP&f=tableCode%3A22
15 See Annex III
16 Pakistan Employment Trends, Government of Pakistan, Statistics Division, Pakistan Bureau of Statistics, 2014 www.pbs.gov.pk
17 http://data.worldbank.org/indicator/SL.TLF.TOTL.FE.ZS?locations=PK
18 http://gamapserver.who.int/gho/interactive_charts/mbd/hale_1/atlas.html
19 Harvard Business Review https://hbr.org/2014/11/a-refresher-on-net-present-value
20 Ross et all, Calculating the Consequences of Micronutrient Undernutrition on Economic Productivity, Health and Survival, AED 2003
21 Used by World Bank, Development Report 1993: Investing in Health. Oxford University Press World Bank 1993 as well as Horton, et al Copenhagen Consensus Challenge Paper 2008
14
The
Econ
omic
Con
seq
uen
ces
of U
nd
ern
utr
itio
n in
Pak
ista
n:
An
Ass
essm
ent
of L
osse
s
1.3 Caveat to the “Consequence Model” Methodology
Converting indicators of undernutrition to economic activity and attaching a monetary value to that economic activity is complex:
• The quality of the process of monetizing the consequences of undernutrition is often dependent on a relatively thin evidence base, complex methodologies and variable quality of national health, demographic and economic statistics.
• There are a number of factors beyond physical and intellectual potential for each individual that determine the level of earnings and work performance. Workplace incentives, available technology and sense of opportunity all affect the manner in which increased human potential translates into actual improved productivity.
• Benefi ts of improved nutrition extend beyond the workplace to a range of “voluntary” activities, including parenting, household activities, educational improvement, entrepreneurial pursuits and community participation. In a world where improved productivity emerges mainly from individual choices and behaviors, the signifi cance of these “voluntary” activities cannot be overstated. This Assessment places an economic value to the voluntary activity.
• Valuing a life saved as the sum NPV of lost potential earnings clearly devalues human life and is insuffi cient to describe the impact of lives lost to undernutrition. Likewise, only applying losses to populations considered likely to be employed further limits the projected impact, particularly the impact on women, with three quarters of women working in the household and therefore not having a gainful employment.22
There are other limitations to the methodology used for this Assessment. Even if different forms of malnutrition (Table 1) often coexist in the same individual, there is no disaggregated data that provides information on the exact number of individuals who experience more than one form of malnutrition. However, it is reasonable to conclude that simply summing individual results from each of the 15 indicators of undernutrition may grossly infl ate the projections. Therefore, the model applies an algorithm suggested by Rockhill et al. to theoretically adjust for these multiple risks, preventing the infl ation of results and enabling a more realistic and conservative projection.23 Nevertheless, the extent of overlapping nutritional conditions remains unknown.
Although computer modeling provides by nature very precise numbers, in reality these numbers should be considered as an order of magnitude. These projections are useful to facilitate policy discussion on the national investments that are made to lower the prevalence of undernutrition. This is achieved by providing a general picture of the substantial national economic “Cost of Doing Nothing”.
22 Pakistan Employment Trends, Government of Pakistan, Statistics Division, Pakistan Bureau of Statistics, 2014 www.pbs.gov.pk
23 Rockhill et al, Use and Misuse of Population Attributable Fractions, American Journal of Public Health, January 1988
15
The
Econ
omic
Con
seq
uen
ces
of U
nd
ern
utr
itio
n in
Pak
ista
n:
An
Ass
essm
ent
of L
osse
s
2. Pathway #1: Child Mortality Attributable to Malnutrition
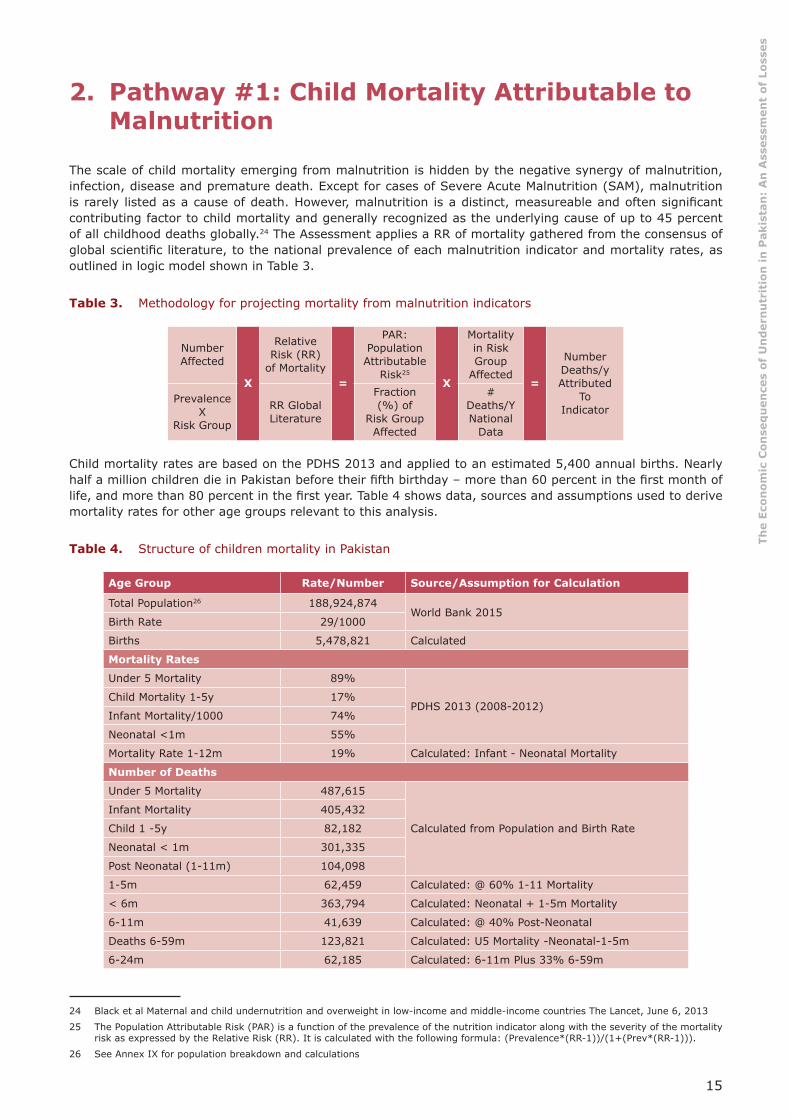
The scale of child mortality emerging from malnutrition is hidden by the negative synergy of malnutrition, infection, disease and premature death. Except for cases of Severe Acute Malnutrition (SAM), malnutrition is rarely listed as a cause of death. However, malnutrition is a distinct, measureable and often signifi cant contributing factor to child mortality and generally recognized as the underlying cause of up to 45 percent of all childhood deaths globally.24 The Assessment applies a RR of mortality gathered from the consensus of global scientifi c literature, to the national prevalence of each malnutrition indicator and mortality rates, as outlined in logic model shown in Table 3.
Table 3. Methodology for projecting mortality from malnutrition indicators 25
NumberAffected
X
Relative Risk (RR)
of Mortality=
PAR: Population Attributable
Risk25
X
Mortality in Risk Group
Affected=
Number Deaths/yAttributed
ToIndicator
PrevalenceX
Risk Group
RR Global Literature
Fraction (%) of
Risk Group Affected
# Deaths/YNational
Data
Child mortality rates are based on the PDHS 2013 and applied to an estimated 5,400 annual births. Nearly half a million children die in Pakistan before their fi fth birthday – more than 60 percent in the fi rst month of life, and more than 80 percent in the fi rst year. Table 4 shows data, sources and assumptions used to derive mortality rates for other age groups relevant to this analysis.
Table 4. Structure of children mortality in Pakistan 26
Age Group Rate/Number Source/Assumption for Calculation
Total Population26 188,924,874World Bank 2015
Birth Rate 29/1000
Births 5,478,821 Calculated
Mortality Rates
Under 5 Mortality 89%
PDHS 2013 (2008-2012)Child Mortality 1-5y 17%
Infant Mortality/1000 74%
Neonatal <1m 55%
Mortality Rate 1-12m 19% Calculated: Infant - Neonatal Mortality
Number of Deaths
Under 5 Mortality 487,615
Calculated from Population and Birth Rate
Infant Mortality 405,432
Child 1 -5y 82,182
Neonatal < 1m 301,335
Post Neonatal (1-11m) 104,098
1-5m 62,459 Calculated: @ 60% 1-11 Mortality
< 6m 363,794 Calculated: Neonatal + 1-5m Mortality
6-11m 41,639 Calculated: @ 40% Post-Neonatal
Deaths 6-59m 123,821 Calculated: U5 Mortality -Neonatal-1-5m
6-24m 62,185 Calculated: 6-11m Plus 33% 6-59m
24 Black et al Maternal and child undernutrition and overweight in low-income and middle-income countries The Lancet, June 6, 2013
25 The Population Attributable Risk (PAR) is a function of the prevalence of the nutrition indicator along with the severity of the mortality risk as expressed by the Relative Risk (RR). It is calculated with the following formula: (Prevalence*(RR-1))/(1+(Prev*(RR-1))).
26 See Annex IX for population breakdown and calculations
16
The
Econ
omic
Con
seq
uen
ces
of U
nd
ern
utr
itio
n in
Pak
ista
n:
An
Ass
essm
ent
of L
osse
s
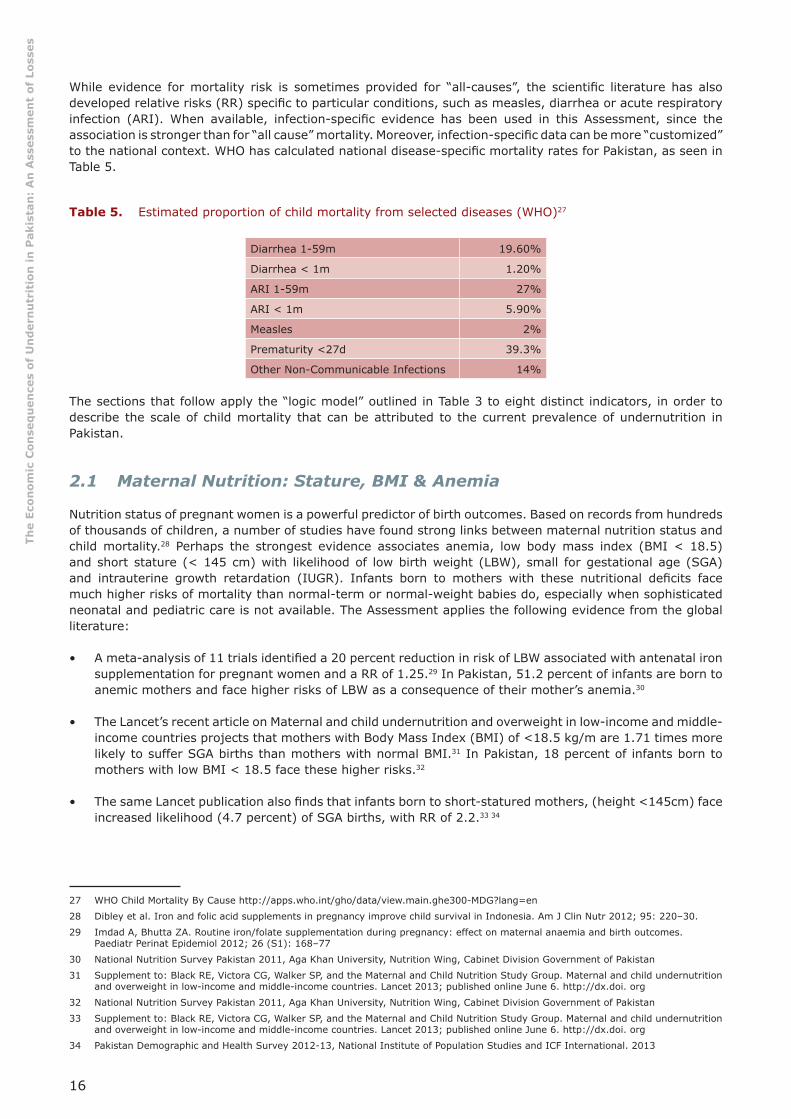
While evidence for mortality risk is sometimes provided for “all-causes”, the scientifi c literature has also developed relative risks (RR) specifi c to particular conditions, such as measles, diarrhea or acute respiratory infection (ARI). When available, infection-specifi c evidence has been used in this Assessment, since the association is stronger than for “all cause” mortality. Moreover, infection-specifi c data can be more “customized” to the national context. WHO has calculated national disease-specifi c mortality rates for Pakistan, as seen in Table 5.
Table 5. Estimated proportion of child mortality from selected diseases (WHO)27
Diarrhea 1-59m 19.60%
Diarrhea < 1m 1.20%
ARI 1-59m 27%
ARI < 1m 5.90%
Measles 2%
Prematurity <27d 39.3%
Other Non-Communicable Infections 14%
The sections that follow apply the “logic model” outlined in Table 3 to eight distinct indicators, in order to describe the scale of child mortality that can be attributed to the current prevalence of undernutrition in Pakistan.
2.1 Maternal Nutrition: Stature, BMI & Anemia
Nutrition status of pregnant women is a powerful predictor of birth outcomes. Based on records from hundreds of thousands of children, a number of studies have found strong links between maternal nutrition status and child mortality.28 Perhaps the strongest evidence associates anemia, low body mass index (BMI < 18.5) and short stature (< 145 cm) with likelihood of low birth weight (LBW), small for gestational age (SGA) and intrauterine growth retardation (IUGR). Infants born to mothers with these nutritional defi cits face much higher risks of mortality than normal-term or normal-weight babies do, especially when sophisticated neonatal and pediatric care is not available. The Assessment applies the following evidence from the global literature:
• A meta-analysis of 11 trials identifi ed a 20 percent reduction in risk of LBW associated with antenatal iron supplementation for pregnant women and a RR of 1.25.29 In Pakistan, 51.2 percent of infants are born to anemic mothers and face higher risks of LBW as a consequence of their mother’s anemia.30
• The Lancet’s recent article on Maternal and child undernutrition and overweight in low-income and middle-income countries projects that mothers with Body Mass Index (BMI) of <18.5 kg/m are 1.71 times more likely to suffer SGA births than mothers with normal BMI.31 In Pakistan, 18 percent of infants born to mothers with low BMI < 18.5 face these higher risks.32
• The same Lancet publication also fi nds that infants born to short-statured mothers, (height <145cm) face increased likelihood (4.7 percent) of SGA births, with RR of 2.2.33 34
27 WHO Child Mortality By Cause http://apps.who.int/gho/data/view.main.ghe300-MDG?lang=en
28 Dibley et al. Iron and folic acid supplements in pregnancy improve child survival in Indonesia. Am J Clin Nutr 2012; 95: 220–30.
29 Imdad A, Bhutta ZA. Routine iron/folate supplementation during pregnancy: effect on maternal anaemia and birth outcomes. Paediatr Perinat Epidemiol 2012; 26 (S1): 168–77
30 National Nutrition Survey Pakistan 2011, Aga Khan University, Nutrition Wing, Cabinet Division Government of Pakistan
31 Supplement to: Black RE, Victora CG, Walker SP, and the Maternal and Child Nutrition Study Group. Maternal and child undernutrition and overweight in low-income and middle-income countries. Lancet 2013; published online June 6. http://dx.doi. org
32 National Nutrition Survey Pakistan 2011, Aga Khan University, Nutrition Wing, Cabinet Division Government of Pakistan
33 Supplement to: Black RE, Victora CG, Walker SP, and the Maternal and Child Nutrition Study Group. Maternal and child undernutrition and overweight in low-income and middle-income countries. Lancet 2013; published online June 6. http://dx.doi. org
34 Pakistan Demographic and Health Survey 2012-13, National Institute of Population Studies and ICF International. 2013
17
The
Econ
omic
Con
seq
uen
ces
of U
nd
ern
utr
itio
n in
Pak
ista
n:
An
Ass
essm
ent
of L
osse
s
Recent scientifi c literature focuses on SGA and IUGR. However, birth data collection systems in Pakistan are incomplete and do not differentiate LBW, SGA and IUGR, even if they are distinct clinical conditions. Given the lack of differentiating data, and in order to include these critical maternal indicators in the Assessment, the established national prevalence of LBW is used as a rough surrogate for all three conditions.
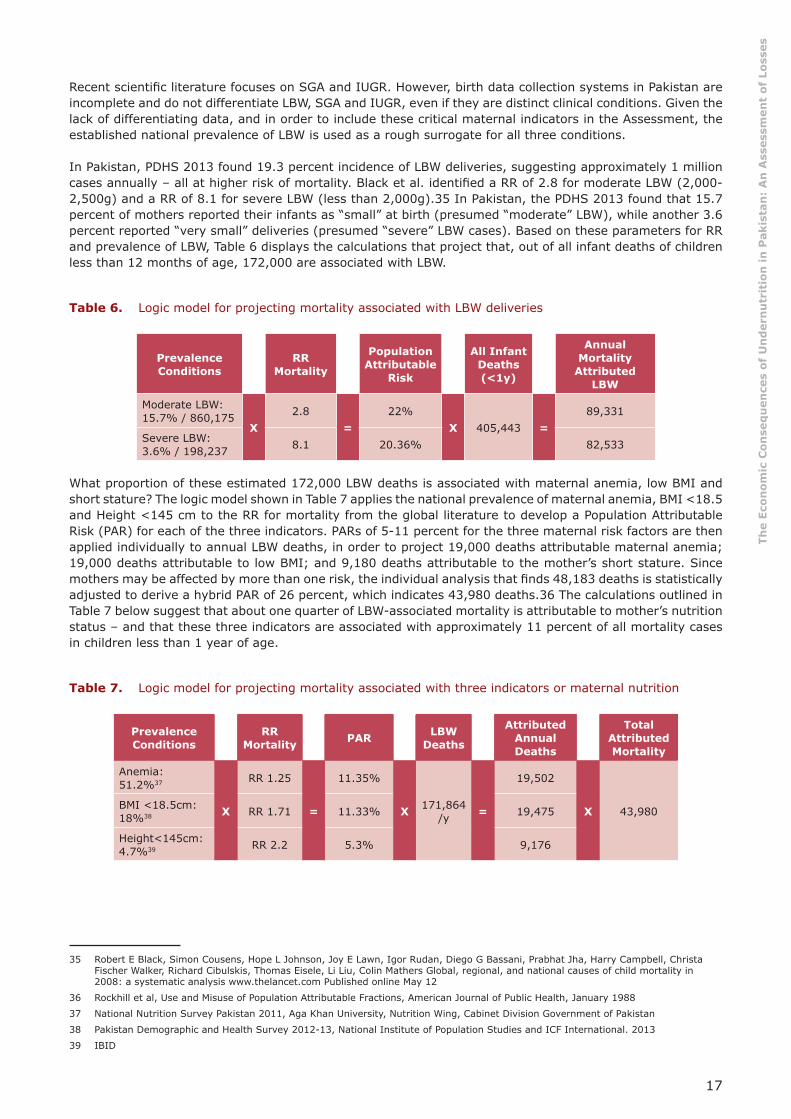
In Pakistan, PDHS 2013 found 19.3 percent incidence of LBW deliveries, suggesting approximately 1 million cases annually – all at higher risk of mortality. Black et al. identifi ed a RR of 2.8 for moderate LBW (2,000-2,500g) and a RR of 8.1 for severe LBW (less than 2,000g).35 In Pakistan, the PDHS 2013 found that 15.7 percent of mothers reported their infants as “small” at birth (presumed “moderate” LBW), while another 3.6 percent reported “very small” deliveries (presumed “severe” LBW cases). Based on these parameters for RR and prevalence of LBW, Table 6 displays the calculations that project that, out of all infant deaths of children less than 12 months of age, 172,000 are associated with LBW.
Table 6. Logic model for projecting mortality associated with LBW deliveries
Prevalence Conditions
RRMortality
Population Attributable
Risk
All Infant Deaths (<1y)
Annual Mortality
Attributed LBW
Moderate LBW:15.7% / 860,175
X2.8
=22%
X 405,443 =89,331
Severe LBW:3.6% / 198,237 8.1 20.36% 82,533
What proportion of these estimated 172,000 LBW deaths is associated with maternal anemia, low BMI and short stature? The logic model shown in Table 7 applies the national prevalence of maternal anemia, BMI <18.5 and Height <145 cm to the RR for mortality from the global literature to develop a Population Attributable Risk (PAR) for each of the three indicators. PARs of 5-11 percent for the three maternal risk factors are then applied individually to annual LBW deaths, in order to project 19,000 deaths attributable maternal anemia; 19,000 deaths attributable to low BMI; and 9,180 deaths attributable to the mother’s short stature. Since mothers may be affected by more than one risk, the individual analysis that fi nds 48,183 deaths is statistically adjusted to derive a hybrid PAR of 26 percent, which indicates 43,980 deaths.36 The calculations outlined in Table 7 below suggest that about one quarter of LBW-associated mortality is attributable to mother’s nutrition status – and that these three indicators are associated with approximately 11 percent of all mortality cases in children less than 1 year of age.
Table 7. Logic model for projecting mortality associated with three indicators or maternal nutrition 37 38 39
Prevalence Conditions
RRMortality PAR LBW
Deaths
Attributed Annual Deaths
Total Attributed Mortality
Anemia: 51.2%37
X
RR 1.25
=
11.35%
X 171,864/y =
19,502
X 43,980BMI <18.5cm:18%38 RR 1.71 11.33% 19,475
Height<145cm:4.7%39 RR 2.2 5.3% 9,176
35 Robert E Black, Simon Cousens, Hope L Johnson, Joy E Lawn, Igor Rudan, Diego G Bassani, Prabhat Jha, Harry Campbell, Christa Fischer Walker, Richard Cibulskis, Thomas Eisele, Li Liu, Colin Mathers Global, regional, and national causes of child mortality in 2008: a systematic analysis www.thelancet.com Published online May 12
36 Rockhill et al, Use and Misuse of Population Attributable Fractions, American Journal of Public Health, January 1988
37 National Nutrition Survey Pakistan 2011, Aga Khan University, Nutrition Wing, Cabinet Division Government of Pakistan
38 Pakistan Demographic and Health Survey 2012-13, National Institute of Population Studies and ICF International. 2013
39 IBID

18
The
Econ
omic
Con
seq
uen
ces
of U
nd
ern
utr
itio
n in
Pak
ista
n:
An
Ass
essm
ent
of L
osse
s
2.2 Anthropometric Indicators: Height-for-Weight Z-scores (WHZ) & Weight-for-Age Z-scores (WAZ)
Anthropometric indicators including low weight-for-height z-scores (WHZ) or wasting, and low weight-for-age z-scores (WAZ) or underweight, are among the strongest predictors of child mortality. Low scores for either WHZ or WAZ have been consistently shown to increase risk of death from infectious childhood diseases. For both WHZ and WAZ, the evidence has been linked with infection-specifi c mortality from diarrhea, pneumonia, measles and other infections.40 Infection-specifi c RRs shown in Table 8 are derived from a pooled analysis of ten longitudinal studies that included more than 55,000 child-years of follow-up and 1,315 child deaths.41 Severe WHZ or WAZ, defi ned as less than -3 Standard Deviations (SD) below an international reference, brings a very signifi cant risk of death, ranging from a RR of 11.6 for WAZ and a RR of 12.3 for WHZ. Even if it remains signifi cant, the RR is lower for moderate cases (-2 to -3 SD) and even for some mild cases (-1 to -2 SD). In order to not overestimate the results, this Assessment focuses only on severe and moderate conditions.
Table 8. Relative risk of mortality associated with severe and moderate wasting (WHZ) and underweight (WAZ)
RR ARI RR Diarrhea
RR Measles
RR Other
Wasting:
WHZ: < -3 SD 9.7 12.3 9.6 11.2
WHZ: -2 to -3 SD 4.7 3.4 2.79 2.7
Underweight:
WAZ: < -3 SD 10.1 11.6 7.7 8.3
WAZ: -2 to -3 SD 3.1 2.9 3.1 1.6
The NNS 2011 indicates that 31.5 percent or ~6.9 million Pakistani children 6-59 month old are moderately or severely underweight, and 15 percent or ~3.7 million are affected by moderate or severe wasting. In comparison to well-nourished children, these children face signifi cantly higher risks of death from diarrhea, ARI, measles and other infections before their fi fth birthday. National prevalence data is summarized in Table 9 below.
Table 9. Prevalence of moderate and severe wasting and underweight in children 6-59 months (NNS 2011)
Severe Moderate Totals
Low WHZ in children 6-59m
Prevalence 5.80% 9.30% 15.10%
Number of Children 1,269,894 2,036,209 3,306,103
Low WAZ in children 6-59m
Prevalence 11.60% 19.90% 31.5%
Number of Children 2,539,787 4,357,049 6,896,836
40 Supplement to: Black RE, Victora CG, Walker SP, and the Maternal and Child Nutrition Study Group. Maternal and child undernutrition and overweight in low-income and middle-income countries. Lancet 2013; published online June 6. http://dx.doi. org
41 Olofi n I, McDonald CM, Ezzati M, et al, for the Nutrition Impact Model Study (anthropometry cohort pooling). Associations of suboptimal growth with all-cause and cause-specifi c mortality in children under fi ve years: pooled analysis of ten prospective studies. PLoS One (in press).
19
The
Econ
omic
Con
seq
uen
ces
of U
nd
ern
utr
itio
n in
Pak
ista
n:
An
Ass
essm
ent
of L
osse
s
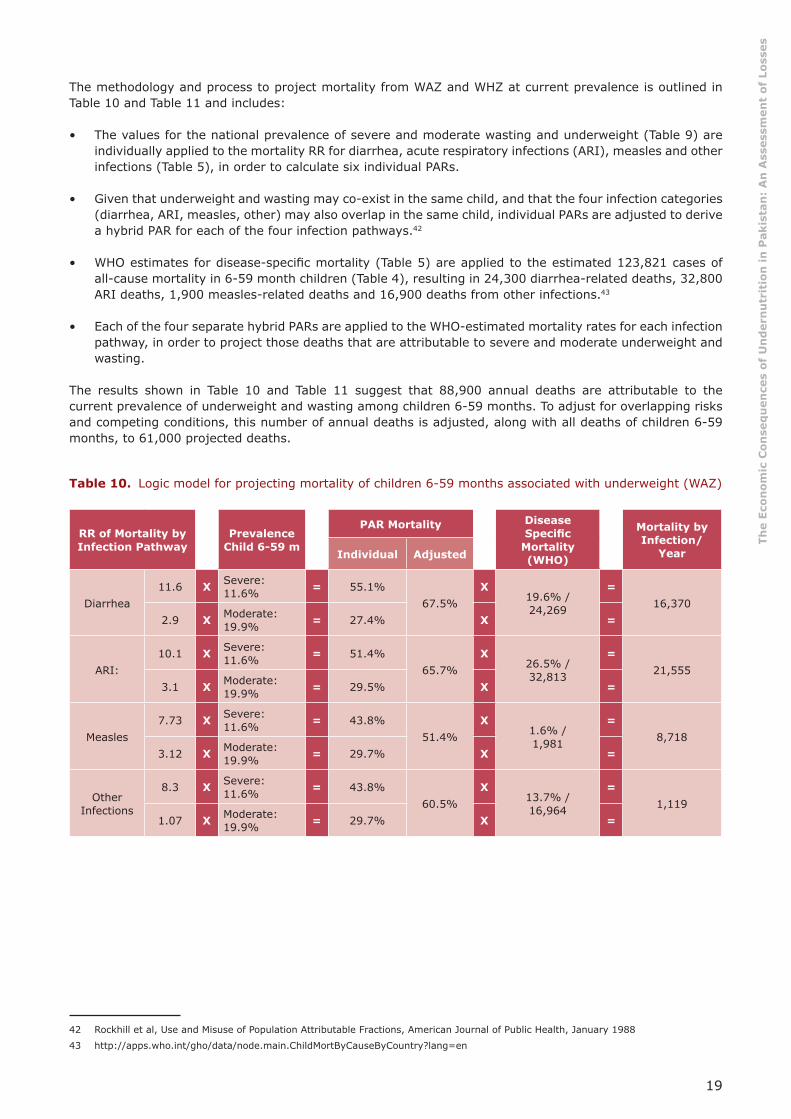
The methodology and process to project mortality from WAZ and WHZ at current prevalence is outlined in Table 10 and Table 11 and includes:
• The values for the national prevalence of severe and moderate wasting and underweight (Table 9) are individually applied to the mortality RR for diarrhea, acute respiratory infections (ARI), measles and other infections (Table 5), in order to calculate six individual PARs.
• Given that underweight and wasting may co-exist in the same child, and that the four infection categories (diarrhea, ARI, measles, other) may also overlap in the same child, individual PARs are adjusted to derive a hybrid PAR for each of the four infection pathways.42
• WHO estimates for disease-specifi c mortality (Table 5) are applied to the estimated 123,821 cases of all-cause mortality in 6-59 month children (Table 4), resulting in 24,300 diarrhea-related deaths, 32,800 ARI deaths, 1,900 measles-related deaths and 16,900 deaths from other infections.43
• Each of the four separate hybrid PARs are applied to the WHO-estimated mortality rates for each infection pathway, in order to project those deaths that are attributable to severe and moderate underweight and wasting.
The results shown in Table 10 and Table 11 suggest that 88,900 annual deaths are attributable to the current prevalence of underweight and wasting among children 6-59 months. To adjust for overlapping risks and competing conditions, this number of annual deaths is adjusted, along with all deaths of children 6-59 months, to 61,000 projected deaths.
Table 10. Logic model for projecting mortality of children 6-59 months associated with underweight (WAZ)
RR of Mortality by Infection Pathway
Prevalence Child 6-59 m
PAR Mortality Disease Specifi c
Mortality (WHO)
Mortality by Infection/
Year Individual Adjusted
Diarrhea11.6 X Severe:
11.6% = 55.1%67.5%
X19.6% /24,269
=16,370
2.9 X Moderate: 19.9% = 27.4% X =
ARI:10.1 X Severe:
11.6% = 51.4%65.7%
X26.5% /32,813
=21,555
3.1 X Moderate: 19.9% = 29.5% X =
Measles7.73 X Severe:
11.6% = 43.8%51.4%
X1.6% /1,981
=8,718
3.12 X Moderate: 19.9% = 29.7% X =
Other Infections
8.3 X Severe: 11.6% = 43.8%
60.5%X
13.7% /16,964
=1,119
1.07 X Moderate: 19.9% = 29.7% X =
42 Rockhill et al, Use and Misuse of Population Attributable Fractions, American Journal of Public Health, January 1988
43 http://apps.who.int/gho/data/node.main.ChildMortByCauseByCountry?lang=en

20
The
Econ
omic
Con
seq
uen
ces
of U
nd
ern
utr
itio
n in
Pak
ista
n:
An
Ass
essm
ent
of L
osse
s
Table 11. Logic model for projecting mortality of children 6-59 months associated with wasting (WHZ)
RR of Mortality by Infection
Pathway
Prevalence Child 6-59 m
PAR Mortality Disease Specifi c Mortality (WHO)
Mortality byInfection/YIndividual Adjusted
Diarrhea12.3 X Severe: 5.8% = 39.6%
50.6%X
19.6% /24,269 = 12,284
3.4 X Moderate: 9.3% = 18.2% X
ARI9.7 X Severe: 5.8% = 33.5%
50.5%X
26.5% /32,813 = 16,588
4.7 X Moderate: 9.3% = 25.6% X
Measles2.79 X Severe: 5.8% = 37.2%
67.8%X
1.6% /1,981 = 11,494
6.01 X Moderate: 9.3% = 48.7% X
Other Infections
11.2 X Severe: 5.8% = 22.5%33.6%
X13.7% /16,964 = 665
2.7 X Moderate: 9.3% = 14.3% X
2.3 Mortality Attributed to Sub-Optimal Breastfeeding
Evidence from both developing and developed countries shows the critical lifesaving signifi cance of exclusive breastfeeding during the fi rst 6 months of life, as well as of continued breastfeeding up to 2 years of age.44 A meta-analysis that included studies from multiple countries found infection-specifi c pathways to mortality and concluded that increased mortality risk for non-breastfed versus exclusively breastfed babies ranges from a RR of 10.53 for diarrhea, a RR of 15.13 for pneumonia and a RR of 14.4 for all causes.45 As shown in Table 12, these risks were lower but still signifi cant for predominant and partial breastfeeding - ranging from a RR of 1.48 to 2.28. Not continuing breastfeeding after the fi rst 6 months of life until 2 years of age also doubles the mortality risk compared to babies with continued breastfeeding.
Table 12. Relative risk for infant mortality by breastfeeding behavior
Children 0- 6m Children 6-23m
Predominant breastfeeding
Partial breastfeeding None None
Diarrhea 2.28 4.62 10.53 2.1
Pneumonia 1.75 2.49 15.13 1.92
All Mortality 1.48 2.85 14.4 3.68
44 Bernardo L. Horta, Rajiv Bahl, José C. Martines, Cesar G. Victora, Evidence on the long-term effects of breastfeeding, Systematic Reviews and Meta-Analysis, WHO 2007
45 Robert E Black, Lindsay H Allen, Zulfi qar A Bhutta, Laura E Caulfi eld, Mercedes de Onis, Majid Ezzati, Maternal and child undernutrition: global and regional exposures and health consequences Maternal and Child Undernutrition Study Group, Lancet January 17, 2008
21
The
Econ
omic
Con
seq
uen
ces
of U
nd
ern
utr
itio
n in
Pak
ista
n:
An
Ass
essm
ent
of L
osse
s
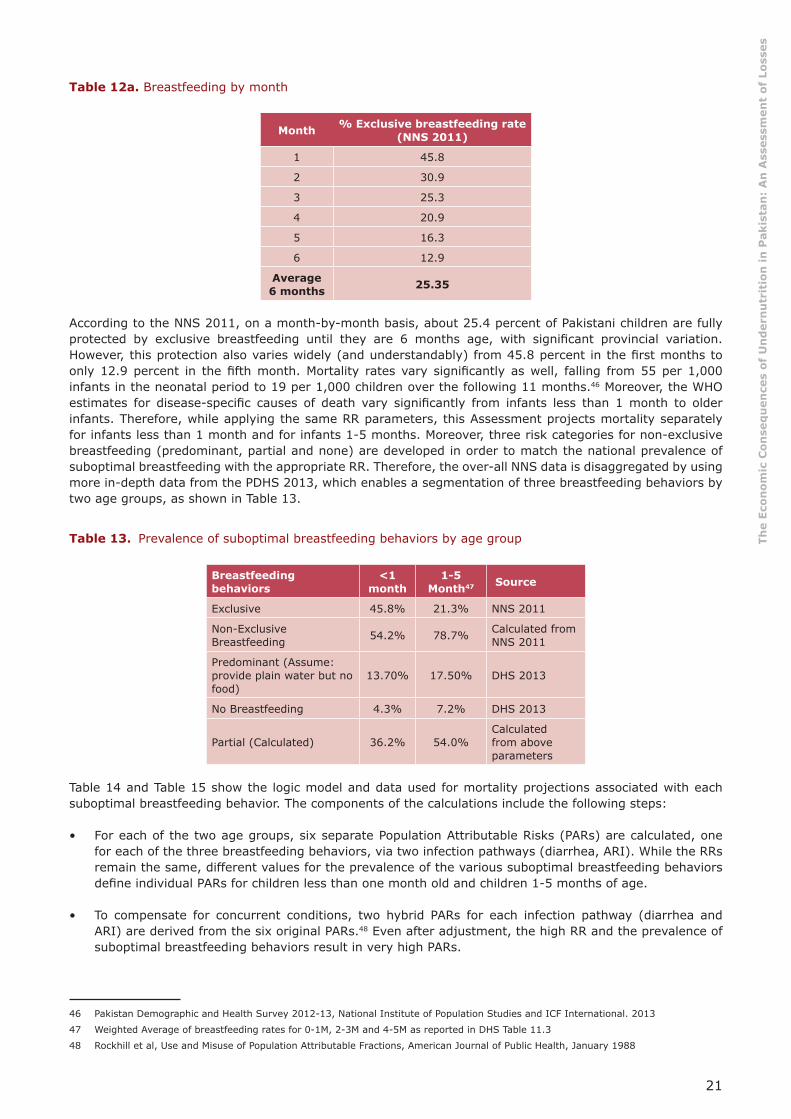
Table 12a. Breastfeeding by month
Month % Exclusive breastfeeding rate (NNS 2011)
1 45.8
2 30.9
3 25.3
4 20.9
5 16.3
6 12.9
Average 6 months 25.35
According to the NNS 2011, on a month-by-month basis, about 25.4 percent of Pakistani children are fully protected by exclusive breastfeeding until they are 6 months age, with signifi cant provincial variation. However, this protection also varies widely (and understandably) from 45.8 percent in the fi rst months to only 12.9 percent in the fi fth month. Mortality rates vary signifi cantly as well, falling from 55 per 1,000 infants in the neonatal period to 19 per 1,000 children over the following 11 months.46 Moreover, the WHO estimates for disease-specifi c causes of death vary signifi cantly from infants less than 1 month to older infants. Therefore, while applying the same RR parameters, this Assessment projects mortality separately for infants less than 1 month and for infants 1-5 months. Moreover, three risk categories for non-exclusive breastfeeding (predominant, partial and none) are developed in order to match the national prevalence of suboptimal breastfeeding with the appropriate RR. Therefore, the over-all NNS data is disaggregated by using more in-depth data from the PDHS 2013, which enables a segmentation of three breastfeeding behaviors by two age groups, as shown in Table 13.
Table 13. Prevalence of suboptimal breastfeeding behaviors by age group 47
Breastfeeding behaviors
<1 month
1-5 Month47 Source
Exclusive 45.8% 21.3% NNS 2011
Non-Exclusive Breastfeeding 54.2% 78.7% Calculated from
NNS 2011
Predominant (Assume: provide plain water but no food)
13.70% 17.50% DHS 2013
No Breastfeeding 4.3% 7.2% DHS 2013
Partial (Calculated) 36.2% 54.0%Calculated from above parameters
Table 14 and Table 15 show the logic model and data used for mortality projections associated with each suboptimal breastfeeding behavior. The components of the calculations include the following steps:
• For each of the two age groups, six separate Population Attributable Risks (PARs) are calculated, one for each of the three breastfeeding behaviors, via two infection pathways (diarrhea, ARI). While the RRs remain the same, different values for the prevalence of the various suboptimal breastfeeding behaviors defi ne individual PARs for children less than one month old and children 1-5 months of age.
• To compensate for concurrent conditions, two hybrid PARs for each infection pathway (diarrhea and ARI) are derived from the six original PARs.48 Even after adjustment, the high RR and the prevalence of suboptimal breastfeeding behaviors result in very high PARs.
46 Pakistan Demographic and Health Survey 2012-13, National Institute of Population Studies and ICF International. 2013
47 Weighted Average of breastfeeding rates for 0-1M, 2-3M and 4-5M as reported in DHS Table 11.3
48 Rockhill et al, Use and Misuse of Population Attributable Fractions, American Journal of Public Health, January 1988

22
The
Econ
omic
Con
seq
uen
ces
of U
nd
ern
utr
itio
n in
Pak
ista
n:
An
Ass
essm
ent
of L
osse
s
• PARs are applied to disease-specifi c mortality estimates, which are derived from WHO datasets (Table 5) and from estimates of national child mortality for the relevant age group (Table 4)
• Each hybrid PAR is applied to the infection-specifi c mortality rate that is projected for diarrhea- and ARI-based over-all mortality rates and for infection-specifi c mortality rates (WHO).
The calculations outlined in Table 14 and Table 15 suggest that approximately 14,000 deaths occur during the Neonatal period, while there are 22,700 deaths of children 1-5 months of age, which represents about 10 percent of mortality among children less than 6 months of age.
Table 14. Projected mortality from suboptimal breastfeeding behaviors for neonatal period
RR of Mortality by Infection Pathway & Breastfeeding
Behavior
Prevalence Suboptimal
Breastfeeding
PAR Mortality Disease Specifi c
Mortality (WHO)
Mortality/y by InfectionIndividual Hybrid
Diarrhea
None: 10.53 X None: 4.3% = 29.1%
73.9%
X1.2% /
3,616= 2,672Partial: 4.62 X Partial: 36.2% = 56.7% X
Pred.: 2.28 X Pred: 13.7.% = 14.9% X
ARI:
None: 15.13 X None: 4.3% = 37.8%
63.4%
X5.9% /
17,779= 11,264Partial: 2.49 X Partial: 36.2% = 35% X
Pred.: 1.75 X Pred: 13.7.% = 9.3% X
Pred. = Predominant
Table 15. Projected mortality from suboptimal breastfeeding behaviors for 1-5 month period
RR of Mortality by Infection Pathway & Breastfeeding
Behavior
Prevalence Suboptimal
Breastfeeding
PAR Mortality Disease Specifi c
Mortality WHO)
Mortality/y by InfectionIndividual Hybrid
Diarrhea
None: 10.53 X None: 7.2%% = 41.8%
83.6%
X19.6%
12,242= 10,237Partial: 4.62 X Partial: 54% = 66.2% X
Pred: 2.28 X Pred: 17.5% = 18.3% X
ARI:
None: 15.13 X None: 7.2%% = 50.5%
75.8%
X26.5%
16,552= 12,539Partial: 2.49 X Partial: 54% = 44.6% X
Pred: 1.75 X Pred: 17.5% = 11.6% X
Pred. = Predominant
In addition to the life-saving effect of exclusive breastfeeding in children under 6 months, the public health literature also shows that non-continued breastfeeding in children 6-24 months is associated with high risk of mortality. Data derived from the NNS 2011 suggests that 27.8 percent of children 6-24 months do not enjoy the protective effects of continued breastfeeding after 6 months of age.49 Table 16 shows projections for the potential consequences of suboptimal breastfeeding behaviors.
49 See Annex V

23
The
Econ
omic
Con
seq
uen
ces
of U
nd
ern
utr
itio
n in
Pak
ista
n:
An
Ass
essm
ent
of L
osse
s
Table 16. Projected mortality from suboptimal breastfeeding behaviors for children 6-24 months
RR of Mortality by Infection Pathway & Breastfeeding
Behavior
% Suboptimal Breastfeeding
Behavior
PAR Mortality
By Infection
Infection Share 6-59M
mortality (WHO)
Attributed to Suboptimal
Breastfeeding
Diarrhea 2.1X 27.8% =
20.3%X
26.5% / 16,479 = 4,601
ARI 1.92 23.4% 5.9% / 3,669
2.4 Mortality Associated with Micronutrient Defi ciencies
2.4.1 Mortality of 6-59 Month Old Children Associated with Vitamin A Defi ciency
Inadequate intake of vitamin A compromises the immune system, leading to risks of common illnesses that can progress to more severe disease, including death. These risks are especially high during periods of rapid physical growth, and consequent increases in nutritional requirements – such as in early childhood. A landmark 1993 meta-analysis by Beaton, Martorell and Aronson reviewing a number of vitamin A interventions and trials, concluded that children ages 6-59 months living in vitamin A defi cient (VAD) areas but received vitamin A supplements were 23 percent less likely to die than children not receiving supplements.50 Since 1993, additional analysis have confi rmed and refi ned this fi nding - the most recent being a Cochrane Review that defi nes a 24 percent mortality reduction, and a mortality RR of 1.32.51
The NNS 2011 found that the prevalence of vitamin A defi ciency among 6-59 month old children reached 56 percent, which corresponds to nearly 14 million children. As shown in Table 17, a calculated PAR of 15 percent suggests that, out of a total of 124,000 deaths from all causes among children 6-59 months in Pakistan, 18,600 are linked to vitamin A defi ciency.
Table 17. Logic model to project all-cause mortality associated with vitamin A defi ciency
Prevalence Conditions
RRMortality
Population Attributable
Risk
Mortality 6-59
months
Annual DeathsAttributed to
VAD
56% X 1.32 = 15% X 123,821 = 18,606
2.4.2 Mortality of 6-59 Month Old Children Attributed to Zinc Defi ciency
Zinc plays an essential central role in cellular tissue growth and differentiation, including the immune system and the gastrointestinal tract. An association of zinc defi ciency with higher morbidity and mortality rates due to infectious disease has been widely observed.52 A recent review of randomized control intervention trials showed a signifi cant 18 percent reduction (RR 0.82) in all-cause mortality in children aged 1–4 years.53 Three recent trials showed signifi cant infection-specifi c impacts via lower incidence of diarrhea, ranging from RR 0.22 to RR 0.89; and via incidence of pneumonia, ranging from 0.36 to 0.9.54 Based on these fi ndings of protective effect, Black et al derive a summary prevalence adjusted RR of mortality from diarrhea of RR 2.01 and from pneumonia of RR 1.96.55
50 Beaton GH, Martorell R. Aronson KA et al. Effectiveness of vitamin A supplementation in the control of young child morbidity and mortality in developing countries. Toronto, Canada: University of Toronto, 1993.
51 Imdad A, Herzer K, Mayo-Wilson E, Yakoob MY, Bhutta ZA. Vitamin A supplementation for preventing morbidity and mortality in children from 6 months to 5 years of age. Cochrane Database of Systematic Reviews 2010, Issue 12. Art.
52 Caulfi eld, L Black, R Zinc Defi ciency, in Comparative Quantifi cation of Health Risks, Volume 1, Chapter 3, WHO 2004
53 Brown KH, Peerson JM, Baker SK, et al. Preventive zinc supplementation among infants, preschoolers, and older prepubertal children. Food Nutr Bull 2009; 30 (suppl 1): S12–40.
54 Yakoob MY, Theodoratou E, Jabeen A, et al. Preventive zinc supplementation in developing countries: impact on mortality and morbidity due to diarrhea, pneumonia and malaria.
55 Supplement to: Black RE, Victora CG, Walker SP, and the Maternal and Child Nutrition Study Group. Maternal and child undernutrition and overweight in low-income and middle-income countries. Lancet 2013; published online June 6. http://dx.doi. org/10.1016/S0140-6736(13)609

24
The
Econ
omic
Con
seq
uen
ces
of U
nd
ern
utr
itio
n in
Pak
ista
n:
An
Ass
essm
ent
of L
osse
s
The NNS 2011 found low serum zinc in 36.5 percent of children 6-59 month old, suggesting that nearly 8 million children face higher mortality risks associated with zinc defi ciency. Table 18 shows a logic model projecting ~15,000 annual deaths of children to 6-59 months as a consequence of the current high prevalence of zinc defi ciency. This represents 5.3 percent of all 6-59 month child mortality.
Table 18. Projection of deaths of 6-59 month olds attributed to zinc defi ciency from ARI and diarrhea
Prevalence of Condition
Relative Risk
Mortality
Population Attributable
Risk
Infection Share 6-59m mortality
(WHO)
Annual Deaths
Attributed
36.5% X
ARI: RR 1.96
=25.9%
X
ARI: 27%32,813
=8,514
Diarrhea: RR 2.01 26.9% Diarrhea: 19.6%
24,269 6,537
2.4.3 Folic Acid related Neural Tube Defects:
Neural Tube Defects (NTD), including serious birth defects such as spina bifi da and anencephaly, are signifi cant causes of death and disability worldwide. A Cochrane Review including fi ve folic acid supplementation trials identifi ed a 72 percent reduction in the risk of neural tube defects as a result of folic acid supplementation.56 With no national birth registry, there is no comprehensive data on the incidence of NTDs in Pakistan. Global estimates suggest that NTDs occur at a rate of 10-48 per 10,000 births.57 A recent global review by Zagangor et al. found fi ve studies from Pakistan from 1994 to 2009 reporting NTD rates ranging from 38.6 to as high as 124 per 10,000 births.58 Given the high rates as well as the wide confi dence intervals from these studies (See Annex VI), , this Assessment applies the lowest estimate in an effort to be conservative, which corresponds to 38.6 per 10,000 births (Jooma et al., 2002). By appling this incidence, it is estimated that there are 21,500 annual births with anencephaly, spina bifi da or another NTD. Given the seriousness of these birth defects, the high rate of births outside health facilities, the lack of access to pediatric neurosurgery services and the over-all high mortality rate, we speculate a fatality rate of 90 percent in Pakistan, which corresponds to – 19,000 deaths as a consequence of folic acid-associated NTDs. In addition, the 2,000 survivors will suffer lifelong disabilities – an in many cases total loss of productive potential (see Section 3.4 for estimate).
2.5 Summary Attributions for Child Mortality
The mortality analysis individually run for each of the above indicators of undernutrition total 227,000 individual mortality attributions. However, these nutritional defi ciencies and risk factors often coexist, affecting the same child. Aggregating individual fi ndings may well infl ate the projections. Since the amount of children who suffer from two or more nutrition defi ciencies is unknown, this Assessment applies theoretical adjustments to these multiple risks factors - and enables a more realistic and conservative projection for total deaths attributed to these individual indicators.59 A separate hybrid PAR has been developed for four indicators that are associated with deaths of children less than 6 months of age. This has resulted in the reduction of the share of attributed mortality of children less than 6 months from 27.4. percent (additive PARs) to 24.9 percent (hybrid PARs). Likewise, a hybrid PAR was developed for fi ve indicators of mortality among children 6-59 month, reducing the total sum of PARs from 109 percent to 70 percent of all 6-59 month mortality. Overall, these two adjustments have reduced the results from the individual analysis from 47 percent to a aggregated projection of 36 percent mortality rate for children under 5 in Pakistan (Annex IV for hybrid PAR calculations).
As indicated in the Table 19 below, after this statistical adjustment, we project an annual death toll of approximately 178,000, based on the undernutrition indicators that were measured. During the fi rst six months of life, when multiple threats to survival are most acute (60-70 percent of all child mortality), about
56 De-Regil LM, Fernandez-Gaxiola AC, Dowswell T, et al. Effects and safety of periconceptional folate supplementation for preventing birth defects. Cochrane Database Syst Rev 2010; 10: CD007950.
57 Personal communication, Godfrey Oakley, United States Centers for Disease Control and Prevention
58 Zaganjor I, Sekkarie A, Tsang BL, Williams J, Razzaghi H, Mulinare J, et al. (2016) Describing the Prevalence of Neural Tube Defects Worldwide: A Systematic Literature Review. PLoS ONE 11(4): e0151586.
59 Rockhill et al, Use and Misuse of Population Attributable Fractions, American Journal of Public Health, January 1988

25
The
Econ
omic
Con
seq
uen
ces
of U
nd
ern
utr
itio
n in
Pak
ista
n:
An
Ass
essm
ent
of L
osse
s
one quarter of infant deaths are associated with maternal nutrition status, non-exclusive breastfeeding and folic acid-related birth defects. In the subsequent 6-59 month period, undernutrition becomes a relatively greater threat to child survival. The Assessment projects that nearly three quarters of all child mortality is associated with fi ve indicators of undernutrition: suboptimal breastfeeding, underweight, wasting, vitamin A defi ciency and zinc defi ciency.
Table 19. Total estimated annual undernutrition-attributable deaths: the “Cost of Doing Nothing”
Individual Analysis Adjusted Multiple Risks
# Deaths % Risk Group/Age # Deaths % Risk
Group/Age
Nutrition Attributed Mortality < 6M
Mothers Nutrition Status 43,980 12% 39,943 11%
Mother's FAD NTD 19,033 5% 17,286 5%
Sub Optimal Breast Feeding <1M 13,935 4% 12,656 3%
Sub Opt Breastfeeding 1-5M 22,776 6% 20,685 6%
99,725 27.4% 90,570 24.9%
Nutrition Attributed Mortality 6-59M
Breastfeeding (6-24ms) 4,601 4% 3,160 3%
Underweight (WAZ) 47,842 39% 32,857 27%
Wasting (WHZ) 41,030 33% 28,178 23%
VAD 18,606 15% 12,778 10%
Zinc 15,051 12% 10,337 8%
127,131 103% 87,309 70.5%
Nutrition Attributed Mortality < 5yrs 226,856 47% 177,880 36.5%
2.6 Estimating the Value of Workforce Lost to Child Mortality
The value of life lost is immeasurable. However, from a strictly economic perspective, a childhood death represents the future value of the lost workforce for this Assessment– a 50-year lifetime of lost earnings - discounted at 3 percent Net Present Value (NPV) for those who actually participate in the workforce. The parameters used for the calculation of the NPV - 178,000 childhood deaths attributed to undernutrition - are shown in Table 20. The annual losses of NPV, corresponding to US$ 2.25 billion per year, are calculated by discounting future earnings at 3 percent and correcting for a 13-15 year delay in the beginning of the earnings stream, depending on the projected age of death.60 This discounting approach reduces gross lifetime earnings to approximately US$ 12,600 per child. It should be noted that this methodology, though an accepted fi nance and accounting measure, is inadequate to measure the value of human life.
Table 20. Projection for future economic losses from nutrition-attributed mortality in children less than 5 years of age 61
AttributedDeaths
AverageWage
Labor Force Participation
NPV:Work life
Delay Earnings NPV
177,880 X $1,611/y X 55% �3% for
50y - 13-15 y61 = $2.25 billion/y
60 The Assessment applies 15 year time lag for infant deaths and an average 14 year lag for older age groups.
61 Varying delay in onset of worklife at 15 years is from different estimates for average time of death, ranging from neonatal period for some risk factors and up to 2 years of age.
26
The
Econ
omic
Con
seq
uen
ces
of U
nd
ern
utr
itio
n in
Pak
ista
n:
An
Ass
essm
ent
of L
osse
s
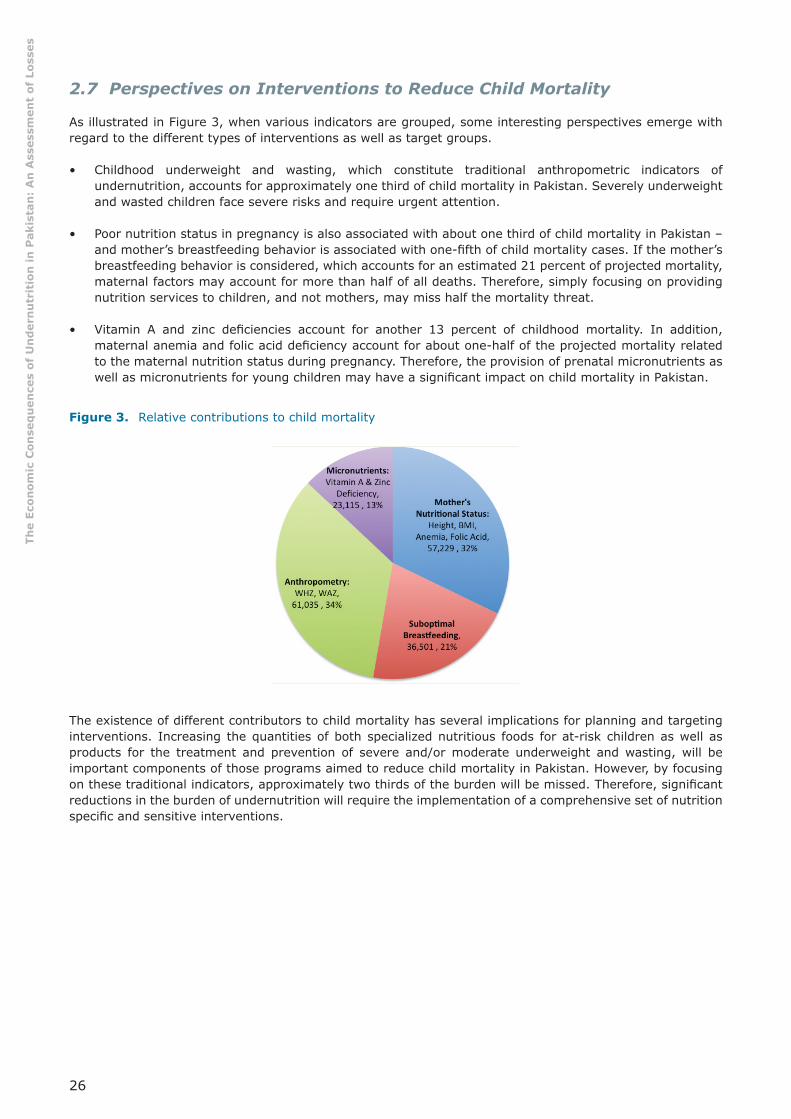
2.7 Perspectives on Interventions to Reduce Child Mortality
As illustrated in Figure 3, when various indicators are grouped, some interesting perspectives emerge with regard to the different types of interventions as well as target groups.
• Childhood underweight and wasting, which constitute traditional anthropometric indicators of undernutrition, accounts for approximately one third of child mortality in Pakistan. Severely underweight and wasted children face severe risks and require urgent attention.
• Poor nutrition status in pregnancy is also associated with about one third of child mortality in Pakistan – and mother’s breastfeeding behavior is associated with one-fi fth of child mortality cases. If the mother’s breastfeeding behavior is considered, which accounts for an estimated 21 percent of projected mortality, maternal factors may account for more than half of all deaths. Therefore, simply focusing on providing nutrition services to children, and not mothers, may miss half the mortality threat.
• Vitamin A and zinc defi ciencies account for another 13 percent of childhood mortality. In addition, maternal anemia and folic acid defi ciency account for about one-half of the projected mortality related to the maternal nutrition status during pregnancy. Therefore, the provision of prenatal micronutrients as well as micronutrients for young children may have a signifi cant impact on child mortality in Pakistan.
Figure 3. Relative contributions to child mortality
The existence of different contributors to child mortality has several implications for planning and targeting interventions. Increasing the quantities of both specialized nutritious foods for at-risk children as well as products for the treatment and prevention of severe and/or moderate underweight and wasting, will be important components of those programs aimed to reduce child mortality in Pakistan. However, by focusing on these traditional indicators, approximately two thirds of the burden will be missed. Therefore, signifi cant reductions in the burden of undernutrition will require the implementation of a comprehensive set of nutrition specifi c and sensitive interventions.

27
The
Econ
omic
Con
seq
uen
ces
of U
nd
ern
utr
itio
n in
Pak
ista
n:
An
Ass
essm
ent
of L
osse
s
3. Pathway #2: Reduced Future Productivity of Children
Undernutrition is associated with health and economic deprivations, since they affect child growth and development. Isolating the “nutrition factor” or the “child development factor” is complicated by the countless interactions of nutrition, nature and nurture. However, there is substantial evidence that, after correction for poverty and associated threats, nutrition status has independent impacts on child growth, cognition and development.62 Undernutrition diminishes children’s cognitive development through physiological changes as well as through reduced ability to participate in learning experiences. Compared to their well-nourished peers, even mild or moderately undernourished children score poorly on tests of cognitive function, psychomotor development and fi ne motor skills.63 Studies show that undernourished children have less interaction with their environment and consequent failure to acquire physical and intellectual skills at normal rates. These early nutrition defi cits determine a child’s ability to capitalize on educational opportunities and later employment prospects, resulting in an adult productivity defi cit.64 This Assessment focuses on childhood anemia, stunting and iodine defi ciency disorders - indicators strongly associated with reduced cognition as well as suboptimal school performance and subsequent reduced adult earnings.
3.1 Stunting or Small Stature for age
Stunting or low height-for-age is a general marker of the cumulative effects of chronic undernutrition in childhood. Children falling more than 2 standard deviations (SD) below an international reference population are considered to have low height for age (HAZ) or to be stunted.65 Findings from well-nourished populations from a range of nations consistently show that the trajectories of children growth are comparable. An Assessment of linear growth in well-nourished children in the fi rst 1000 days in Brazil, Ghana, India, Norway, Oman and USA shows that, despite some minor variation, the growth curves among these populations are very similar (Figure 3).66 There is no signifi cant difference among these well-nourished populations.
Figure 4. Six-country comparison: mean length from birth to 2 years (WHO 2006)
62 Grantham- McGregor et al, Developmental Potential in the fi rst 5 Years for Children in Developing Countries, The Lancet, VOl 369, 2007
63 IBID
64 Behrman (1993), Behrman and Deolalikar (1989), Deolalikar (1988), Foster and Rosenzweig (1993), Glick and Sahn (1997), Haddad and Bouis (1991), Schultz (1996), Strauss and Thomas (1998) and Thomas and Strauss (1997) Behrman (1993), Behrman and Deolalikar (1989), Deolalikar (1988), Foster and Rosenzweig (1993), Glick and Sahn (1997), Haddad and Bouis (1991), Schultz (1996), and Thomas and Strauss (1997)
65 Bulletin of the World health Organization, Vol 83, No 3, Geneva, Mar 2005
66 WHO Multicentre Growth Reference Study Group, Assessment of Linear Growth Difference Among Populations, Acta Paediatrica. 2006
Figure36-CountryComparison:MeanLengthover1000Days(WHO,2006)

28
The
Econ
omic
Con
seq
uen
ces
of U
nd
ern
utr
itio
n in
Pak
ista
n:
An
Ass
essm
ent
of L
osse
s
Being “short” only has negative effects when there is undernutrition. Stunted children suffer low physical activity, impaired motor and mental development, lowered immune competence and greater severity of infections.67 Numerous studies directly associate stunting with lower test scores for childhood cognition. A number of studies have established an association between stunting and future economic productivity via two general pathways:
• Suboptimal School Achievement: stunted children often start school later, progress through school less rapidly and show lower over-all grade attainment. A Lancet review of evidence from 79 countries concluded that “for every 10 percent increase in stunting, the proportion of children reaching the fi nal grade of primary school dropped by 7.9 percent.”68 The authors concluded that stunted children suffer a combined grade attainment and performance defi cit of 2.91 years, suggesting a “total percentage loss of adult yearly income” of 19.8 percent.”69
• Reduced earnings in manual labor: several studies controlling for a variety of characteristics, document a direct association between lower adult height and reduced earnings in physically demanding jobs.70 Among sugar cane workers in the Philippines, Haddad et al. found productivity rose 1.38 percent for every 1 percent increase in height.71 Compared to children with normal height for age, severe stunting (>-3 SD) represents a 6.25 percent reduction in height and moderate stunting (-2 to -3 SD) represents a 4.37 percent reduction. This Assessment applies this proportional height defi cit to the fi ndings from Haddad et al., leading to the following coeffi cients of defi cit for productivity: severely stunted children would experience a productivity loss of 8.6 percent, while moderate stunting would result in a 6.04 percent future defi cit.72
The evidence shows stunting impacts productivity through two very distinct pathways: schooling and agricultural work performance. Therefore, the Assessment applies differing coeffi cients of defi cit to the manual labor sector, including agriculture, industry and construction, where strength and endurance are key inputs to productivity; and service sectors or “white collar” jobs that require a range of numeracy, literacy and other intellectual skills, usually acquired via schooling. The Lancet fi ndings of a 19.8 percent defi cit due to school attainment and performance defi cit are applied to the 35 percent of the labor force that is employed in the Pakistan’s service sector.73 The 6-8.6 percent productivity defi cit found among sugar workers are applied in the Assessment modeling to the 65 percent of the national workforce employed in industry, working in agriculture or in other manual jobs that require strength and endurance.74
The NNS 2011 found stunting in 68 percent of children 6-59 month old, which constitutes nearly 15 million children. As outlined in Table 21, based on a prevalence of 21.8 percent severe and 21.9 percent moderate stunting, the Assessment projects a NPV of an annual US$ 1 billion from lost productivity in manual labor sectors. The calculation applies a 6 percent defi cit to the moderately stunted children and a 8.4 percent defi cit to the 65 percent of children with severe stunting that are projected to be employed in the agriculture, manufacturing and other manual labor sector. The estimated average income for manual labor is estimated at US$ 1,184 per year, corresponding to 74 percent of the national average (see Annex III).
67 Martorell, R. The role of nutrition in economic development. Nutr. Rev. 54: S66–S71(1996
68 Grantham- McGregor et al, Developmental Potential in the fi rst 5 Years for Children in Developing Countries, The Lancet, VOl 369, 2007;
69 IBID
70 Behrman (1993), Behrman and Deolalikar (1989), Deolalikar (1988), Foster and Rosenzweig (1993), Glick and Sahn (1997), Haddad and Bouis (1991), Schultz (1996), Strauss and Thomas (1998) and Thomas and Strauss (1997)
71 Haddad, L et al The Impact of Nutritional Status on Agricultural Productivity: Wage Evidence from the Philippines, Oxford Bulletin of Economics & Statistics, Vol 53 Feburary, 1991, 45-68 1991
72 Burkhalter, Barton R., Victor M. Aguayo, Serigne M. Diene, Margaret B. Parlato, and Jay S. Ross PROFILES: A Data-Based Approach to Nutrition Advocacy and Policy Development. BASICS/ USAID 1998
73 Pakistan Employment Trends, Government of Pakistan, Statistics Division, Pakistan Bureau of Statistics, 2014 www.pbs.gov.pk
74 IBID

29
The
Econ
omic
Con
seq
uen
ces
of U
nd
ern
utr
itio
n in
Pak
ista
n:
An
Ass
essm
ent
of L
osse
s
Table 21. Logic model for projecting economic loss from stunting in agricultural and other manual labor sectors
Number w/ Defi cit or Risk
AverageEarnings
Labor Force Participation
Coeffi cient Defi cit
AverageWork-Life
NPV Loss/y Loss @ 3%
Moderate: 21.9%: 3.1 million
X US$ 1,184/yr X 55% X 6.04% X
50 y, 12.5 years
delay to entry
� = $418.5 million/y
Severe: 21.8%: 3.1 million
8.6% $600.5million/y
The service sector represents about 35 percent of employment in Pakistan. Approximately 7.7 million children 6-59 month old will most likely work for “white collar” and service sector jobs, where literacy, numeracy, communication and analytical skills are keys to productivity.75 With moderate and severe stunting rates totaling 43.7 percent, 3.4 million children will suffer schooling and subsequent intellectual and work performance defi cits associated with 2.91 “grade equivalents.” As shown in Table 22, the future 19.8 percent productivity defi cit is applied to average earnings potential of US$ 2,464 per year projected for service sector employment (see Annex III for wage adjustment methodology) to derive an NPV of nearly US$ 2.7 billion in reduced productivity.
Table 22. Logic model for projecting economic loss from stunting in service and white collar sectors 76
Number w/ Defi cit or Risk
AverageEarnings
Labor Force Participation
Coeffi cient Defi cit
AverageWork-Life
NPV Loss/Y Loss @ 3%
All Stunting 43.7%3.348 million
X US$ 2,464/yr X 55% X 19.8% X
50 years, 15.7 Yr76 Delay to
entry
� = $2.66 billion/y
Projected losses per child are relatively small, at US$ 163 per lifetime for those in manual labor and US$ 822 for service sector jobs. However, as a consequence of high stunting prevalence in Pakistan, these relatively small individual defi cits aggregate to burden the entire economy with annual losses estimated at US$ 3.7 billion annually.
3.2 Anemia in Children:
A range of evidence links anemia and iron defi ciency in young children to cognitive and development delays. A review from the Journal of Nutrition identifi ed a consistently positive impact of iron interventions on cognitive scores, generally ranging from 0.5 to 1 SD, concluding that “available evidence satisfi es all of the conditions needed to conclude that iron defi ciency causes cognitive defi cits and developmental delays.”77 The literature from child psychology, nutrition and economic science, agrees that development defi cits related to iron status in children less than 2 years old are associated with a 4 percent drop in earnings.78 In general, studies show that iron supplementation in children less than 5 years lead to cognitive improvements that are sustained into adolescence, with a correlation coeffi cient of 0.62.79 Applied to the 4 percent earnings defi cit, the correlation coeffi cient suggests 2.5 percent lower future earnings.80
75 IBID
76 As opposed to manual labor analyzed previously with 12.5y delay to workforce entry we calculate a delay in the earnings stream is extended to account for the average 2.9 years additional schooling.
77 Haas, J. and Brownlie T., Iron Defi ciency and Reduced Work Capacity: A Critical Review of the Research Journal of Nutrition. 2001;131
78 Horton & Ross The Economics of Iron Defi ciency Food Policy 28 (2003) 51–75
79 Pollitt et al. 1995 and Jensen, 1980 in Horton & Ross The Economics of Iron Defi ciency Food Policy 28 (2003) 51–75
80 Horton & Ross The Economics of Iron Defi ciency Food Policy 28 (2003) 51–75
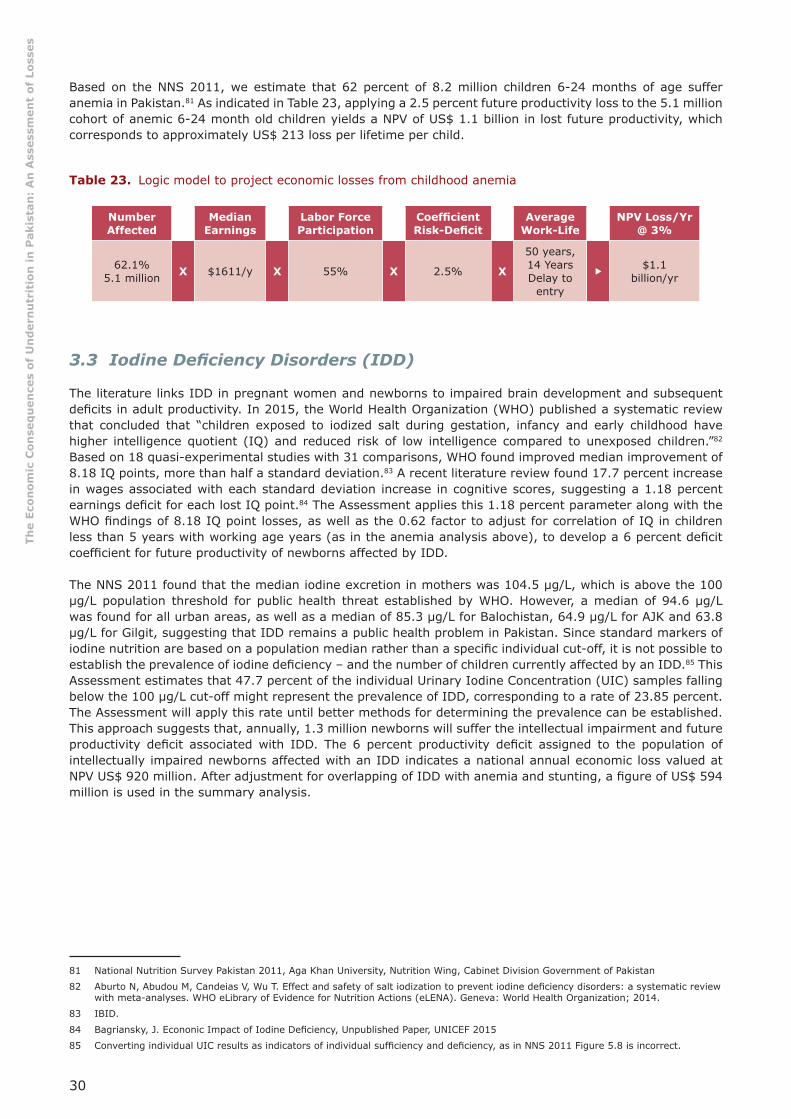
30
The
Econ
omic
Con
seq
uen
ces
of U
nd
ern
utr
itio
n in
Pak
ista
n:
An
Ass
essm
ent
of L
osse
s
Based on the NNS 2011, we estimate that 62 percent of 8.2 million children 6-24 months of age suffer anemia in Pakistan.81 As indicated in Table 23, applying a 2.5 percent future productivity loss to the 5.1 million cohort of anemic 6-24 month old children yields a NPV of US$ 1.1 billion in lost future productivity, which corresponds to approximately US$ 213 loss per lifetime per child.
Table 23. Logic model to project economic losses from childhood anemia
Number Affected
MedianEarnings
Labor Force Participation
Coeffi cient Risk-Defi cit
AverageWork-Life
NPV Loss/Yr@ 3%
62.1%5.1 million X $1611/y X 55% X 2.5% X
50 years, 14 Years Delay to
entry
�$1.1
billion/yr
3.3 Iodine Defi ciency Disorders (IDD)
The literature links IDD in pregnant women and newborns to impaired brain development and subsequent defi cits in adult productivity. In 2015, the World Health Organization (WHO) published a systematic review that concluded that “children exposed to iodized salt during gestation, infancy and early childhood have higher intelligence quotient (IQ) and reduced risk of low intelligence compared to unexposed children.”82 Based on 18 quasi-experimental studies with 31 comparisons, WHO found improved median improvement of 8.18 IQ points, more than half a standard deviation.83 A recent literature review found 17.7 percent increase in wages associated with each standard deviation increase in cognitive scores, suggesting a 1.18 percent earnings defi cit for each lost IQ point.84 The Assessment applies this 1.18 percent parameter along with the WHO fi ndings of 8.18 IQ point losses, as well as the 0.62 factor to adjust for correlation of IQ in children less than 5 years with working age years (as in the anemia analysis above), to develop a 6 percent defi cit coeffi cient for future productivity of newborns affected by IDD.
The NNS 2011 found that the median iodine excretion in mothers was 104.5 μg/L, which is above the 100 μg/L population threshold for public health threat established by WHO. However, a median of 94.6 μg/L was found for all urban areas, as well as a median of 85.3 μg/L for Balochistan, 64.9 μg/L for AJK and 63.8 μg/L for Gilgit, suggesting that IDD remains a public health problem in Pakistan. Since standard markers of iodine nutrition are based on a population median rather than a specifi c individual cut-off, it is not possible to establish the prevalence of iodine defi ciency – and the number of children currently affected by an IDD.85 This Assessment estimates that 47.7 percent of the individual Urinary Iodine Concentration (UIC) samples falling below the 100 μg/L cut-off might represent the prevalence of IDD, corresponding to a rate of 23.85 percent. The Assessment will apply this rate until better methods for determining the prevalence can be established. This approach suggests that, annually, 1.3 million newborns will suffer the intellectual impairment and future productivity defi cit associated with IDD. The 6 percent productivity defi cit assigned to the population of intellectually impaired newborns affected with an IDD indicates a national annual economic loss valued at NPV US$ 920 million. After adjustment for overlapping of IDD with anemia and stunting, a fi gure of US$ 594 million is used in the summary analysis.
81 National Nutrition Survey Pakistan 2011, Aga Khan University, Nutrition Wing, Cabinet Division Government of Pakistan
82 Aburto N, Abudou M, Candeias V, Wu T. Effect and safety of salt iodization to prevent iodine defi ciency disorders: a systematic review with meta-analyses. WHO eLibrary of Evidence for Nutrition Actions (eLENA). Geneva: World Health Organization; 2014.
83 IBID.
84 Bagriansky, J. Econonic Impact of Iodine Defi ciency, Unpublished Paper, UNICEF 2015
85 Converting individual UIC results as indicators of individual suffi ciency and defi ciency, as in NNS 2011 Figure 5.8 is incorrect.
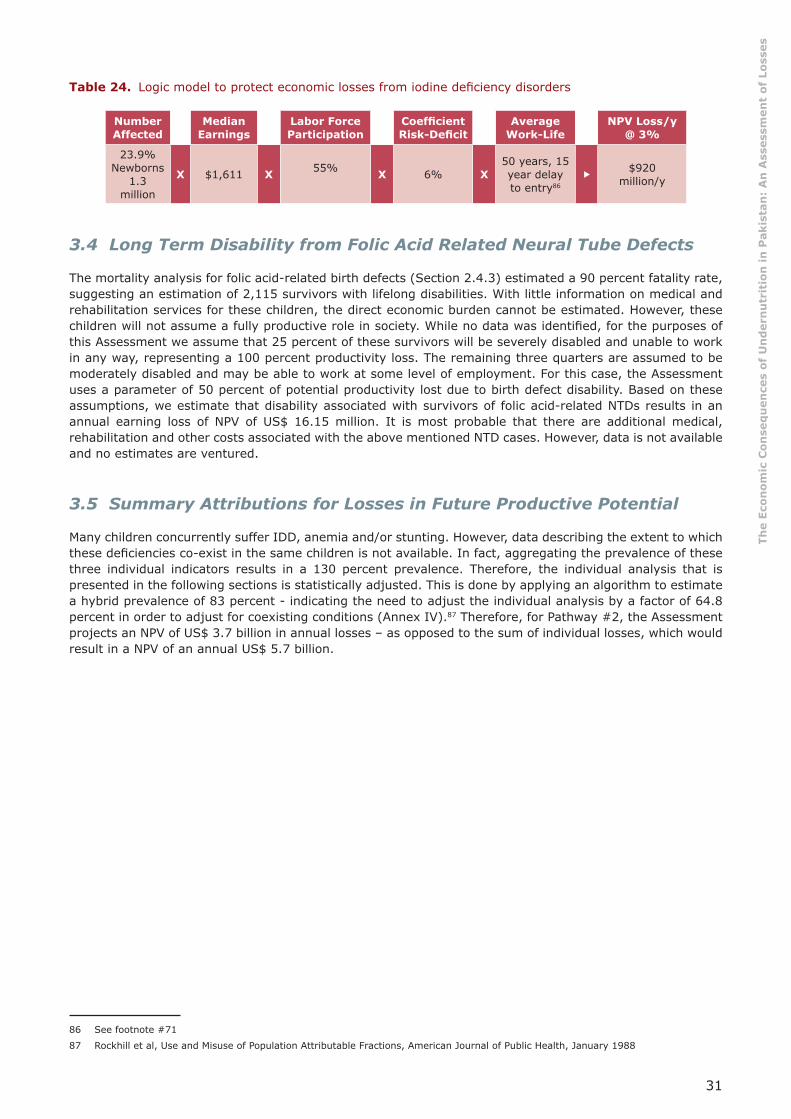
31
The
Econ
omic
Con
seq
uen
ces
of U
nd
ern
utr
itio
n in
Pak
ista
n:
An
Ass
essm
ent
of L
osse
s
Table 24. Logic model to protect economic losses from iodine defi ciency disorders 86
Number Affected
MedianEarnings
Labor Force Participation
Coeffi cient Risk-Defi cit
AverageWork-Life
NPV Loss/y@ 3%
23.9% Newborns
1.3 million
X $1,611 X 55% X 6% X50 years, 15 year delay to entry86
�$920
million/y
3.4 Long Term Disability from Folic Acid Related Neural Tube Defects
The mortality analysis for folic acid-related birth defects (Section 2.4.3) estimated a 90 percent fatality rate, suggesting an estimation of 2,115 survivors with lifelong disabilities. With little information on medical and rehabilitation services for these children, the direct economic burden cannot be estimated. However, these children will not assume a fully productive role in society. While no data was identifi ed, for the purposes of this Assessment we assume that 25 percent of these survivors will be severely disabled and unable to work in any way, representing a 100 percent productivity loss. The remaining three quarters are assumed to be moderately disabled and may be able to work at some level of employment. For this case, the Assessment uses a parameter of 50 percent of potential productivity lost due to birth defect disability. Based on these assumptions, we estimate that disability associated with survivors of folic acid-related NTDs results in an annual earning loss of NPV of US$ 16.15 million. It is most probable that there are additional medical, rehabilitation and other costs associated with the above mentioned NTD cases. However, data is not available and no estimates are ventured.
3.5 Summary Attributions for Losses in Future Productive Potential
Many children concurrently suffer IDD, anemia and/or stunting. However, data describing the extent to which these defi ciencies co-exist in the same children is not available. In fact, aggregating the prevalence of these three individual indicators results in a 130 percent prevalence. Therefore, the individual analysis that is presented in the following sections is statistically adjusted. This is done by applying an algorithm to estimate a hybrid prevalence of 83 percent - indicating the need to adjust the individual analysis by a factor of 64.8 percent in order to adjust for coexisting conditions (Annex IV).87 Therefore, for Pathway #2, the Assessment projects an NPV of US$ 3.7 billion in annual losses – as opposed to the sum of individual losses, which would result in a NPV of an annual US$ 5.7 billion.
86 See footnote #71
87 Rockhill et al, Use and Misuse of Population Attributable Fractions, American Journal of Public Health, January 1988

32
The
Econ
omic
Con
seq
uen
ces
of U
nd
ern
utr
itio
n in
Pak
ista
n:
An
Ass
essm
ent
of L
osse
s
4. Pathway #3: Reduced Current Productivity: Anemia in Adult Workers
Although this Assessment focuses mainly on undernutrition in pregnant women and children, widespread anemia among adults results in current work performance defi cits - and losses to the national economy. In addition, anemia in the general population of women of reproductive age is a key component that contributes to maternal undernutrition during early pregnancy. The period of early pregnancy prior to seeking antenatal care constitutes a key input to poor birth outcomes and therefore an integral component of the inter-generational burden of undernutrition.
Weakness, fatigue and lethargy brought on by anemia results in measurable productivity defi cits in the manual labor. Evidence gathered from the literature shows anemia has a negative impact on work performance indicators, including:
• The output of rubber tree tappers involved in heavy manual labor in Indonesia that received iron supplementation was found 17 percent higher than for those who did not receive supplementation.88
• Anemia impairs work that is less physically demanding (e.g. “blue collar labor”, manufacturing) on the order of 5 percent.89 90 91
• Based on an extensive review of the literature, Ross and Horton, as well as the Copenhagen Consensus challenge papers, estimate a 5 percent defi cit among all manual or “blue collar” manufacturing workers and an additional 12 percent loss for heavy manual labor workers (e.g. agriculture, construction).92
Table 25. Estimate of male and female share of manual labor93
Male Female Total
Services 40.70% 13.80% 35.0%
Industry 26.20% 11.30% 22.80%
Agriculture 33.10% 74.90% 42.2%
Manual Labor Share 59.3% 86.2% 65%
The NNS 2011 found that 50.1 percent, or nearly 26 million, of working-age women of reproductive age are anemic. However, no data was collected for adult men. A global analysis by WHO estimated that 30.2 percent of women and 12.7 percent of men have anemia – suggesting a global male prevalence at 42 percent of female prevalence.94 The Assessment applies the 42 percent parameter to the 50.1 percent female rate to estimate a 21.24 percent anemia prevalence among adult males in Pakistan.
Since sex is a major determinant of anemia, the Assessment addresses the consequences for men and women separately, including labor participation and average income. The evidence for productivity defi cits that emerge from anemia relates only to manual labor, where strength and endurance are required. While the over-all labor participation of women in Pakistan is very low at 22 percent, three-quarters of those in the labor force are employed in the agricultural sector, as indicated in Table 25. Not only is income from manual labor
88 Basta S. S. et al. Iron defi ciency anemia and the productivity of adult males in Indonesia. Am. J. Clin. Nutr. 1979;32:916-925
89 Li R., Chen X., Yan H., Deurenberg P., Garby L., Hautvast J.G.A.J. Functional consequences of iron supplementation in iron-defi cient female cotton workers in Beijing, China. Am. J. Clin. Nutr. 1994;59:908-913
90 Scholz B. D., Gross R., Schultink W., Sastroamidjojo S. Anaemia is associated with reduced productivity of women workers in even less-physically-strenuous tasks. Br. J. Nutr. 1997;77:47-57
91 Unturo J., Gross R., Schultink W. Association between BMI and hemoglobin and work productivity among Indonesian female factory workers. Eur. J. Clin. Nutr. 1998;52:131-135
92 Ross L Horton S The Economic Consequences of Iron Defi ciency, Micronutrient Initiative 1998
93 Pakistan Employment Trends, Government of Pakistan, Statistics Division, Pakistan Bureau of Statistics, 2014 www.pbs.gov.pk
94 See Annex VIII

33
The
Econ
omic
Con
seq
uen
ces
of U
nd
ern
utr
itio
n in
Pak
ista
n:
An
Ass
essm
ent
of L
osse
s
substantially less that service sectors, but national data indicate that women in “elementary occupations” such as agriculture earn substantially less than men. Based on data from the Labor Force Survey 2015, the Assessment estimates that males in manual labor may earn 81 percent of the national average income, while women earn about 35 percent of the national average income, which corresponds to only US$ 569 per year. This is due to their large share of employment in the lowest paying sector, which corresponds to elementary occupations, largely agriculture. (See Annex III)
As shown in table 26, the Assessment estimates that 10.5 million anemic women and men work in the manual labor sector, with an associated productivity defi cit of 5 percent. Of these, 15 percent or 1.58 million are assumed to work in heavy manual labor, where the impact of anemia is more signifi cant and estimated at 17 percent (or an additional 12 percent). Results are summarized in Table 26, with no discounting for NPV, because these are currently occurring losses in the work force, not projected future losses from conditions in children. Projected losses average US$ 62.5 annually per anemic worker, in combination with a current national productivity annual defi cit of US$ 657 million.
Table 26. Current annual losses in manual labor from anemia among workforce
Women Men Totals
Health Data Background
Prevalence of anemia in women 50.5% 21.24% 25,607,595.04
Demographic and Labor Data Background
Labor Participation Rate 22% 83%
Number Employed 11,307,908 44,310,277 55,618,186
Manual Labor Share Employment 86.2% 59.3%
Number Working in Manual Labor 9,747,417 26,275,994 36,023,411
Assumed Heavy Manual Labor Share 15% 15%
Number Workers with Anemia in Manual Labor 4,922,446 5,580,169 10,502,614
Workers with Anemia in Heavy Manual Labor 738,366.83 837,025.28 1,575,392
Economic Productivity Loss Projections
Annual Income Adjusted for Manual Labor $569 $1,228
Productivity Defi cit 5% 5%
Manual Labor Loss $140,019,888 $342,733,097 $482,752,984
Additional Defi cit from Heavy Manual Labor 12% 12%
Additional Loss for Heavy Manual Labor Subtotal $50,407,160 $123,383,915 $173,791,074
Grand Total $190,427,047 $466,117,011 $656,544,059
Per Person Loss $38.69 $83.53 $62.51

34
The
Econ
omic
Con
seq
uen
ces
of U
nd
ern
utr
itio
n in
Pak
ista
n:
An
Ass
essm
ent
of L
osse
s
5. Pathway #4: Excess Healthcare Expenditures
Undernutrition among pregnant women contributes to low birth weight deliveries and undernutrition in children contributes to impaired immunity and infection. Both translate into increased utilization and related expense of health services and generate a fi nancial burden on health systems as well as families. The fi nancial impact is considered for three indicators; suboptimal breastfeeding, zinc defi ciency, and LBW deliveries, which are linked to maternal stunting, low BMI and anemia.
5.1 Cases of Diarrhea and ARI from Zinc Defi ciency and Suboptimal Breastfeeding
A number of articles in the literature have documented the association of suboptimal breastfeeding and increased morbidity from acute respiratory infection and diarrhea. Relative risks from a Lancet review range from 1.17 to 2.65 for various suboptimal breastfeeding behaviors, as shown in Table 27.95 The evidence on the association of zinc defi ciency with diarrhea and ARI incidence in children 6-59 months is also robust. Based on 17 intervention studies that show the positive effect of zinc supplementation, Black et al. derive a RR 2.85 for diarrhea and a RR 2.07 for ARI.96 The NNS 2011 reports that 36.5 percent of children less than5 years of age are zinc defi cient and suffer higher morbidity risks.
Table 27. Relative risk of diarrhea and ARI
Breastfeeding Behavior
Diarrhea Cases ARI Cases
RR RR
0-6 months
None 2.65 2.48
Partial 1.68 2.07
Predominant 1.26 1.79
6-23 months:
None 2.07 1.17
Zinc Defi ciency 2.85 2.07
Parameters derived from the NNS 2011 for low prevalence of exclusive breastfeeding up to 6 months, continued breastfeeding from 6-24 months and zinc defi ciency have been outlined in Sections 2.3 and Section 2.4.2. The RR included above, along with the national prevalence of zinc defi ciency and the suboptimal breastfeeding behaviors calculations for a range of PARs, are shown in Table 28. In the 6-59 month age group, cases of zinc defi ciency and non-continued breastfeeding may co-exist. Therefore, PARs are adjusted. The derived PAR for diarrhea and ARI for these three conditions is applied to estimates for over-all burden of diarrhea and ARI in Pakistan, as shown in Table 29.
95 Robert E Black, Cesar G Victora, Susan P Walker, Zulfi qar A Bhutta, Parul Christian, Mercedes de Onis, Majid Ezzati, Sally Grantham-McGrego, Joanne Katz, Reynaldo Martorell, Ricardo Uauy, and the Maternal and Child Nutrition Study Group Maternal and child undernutrition and overweight in low-income and middle-income countries The Lancet, June 6, 2013
96 Supplement to: Robert E Black, Cesar G Victora, Susan P Walker, Zulfi qar A Bhutta, Parul Christian, Mercedes de Onis, Majid Ezzati, Sally Grantham-McGrego, Joanne Katz, Reynaldo Martorell, Ricardo Uauy, and the Maternal and Child Nutrition Study Group Maternal and child undernutrition and overweight in low-income and middle-income countries The Lancet, June 6, 2013
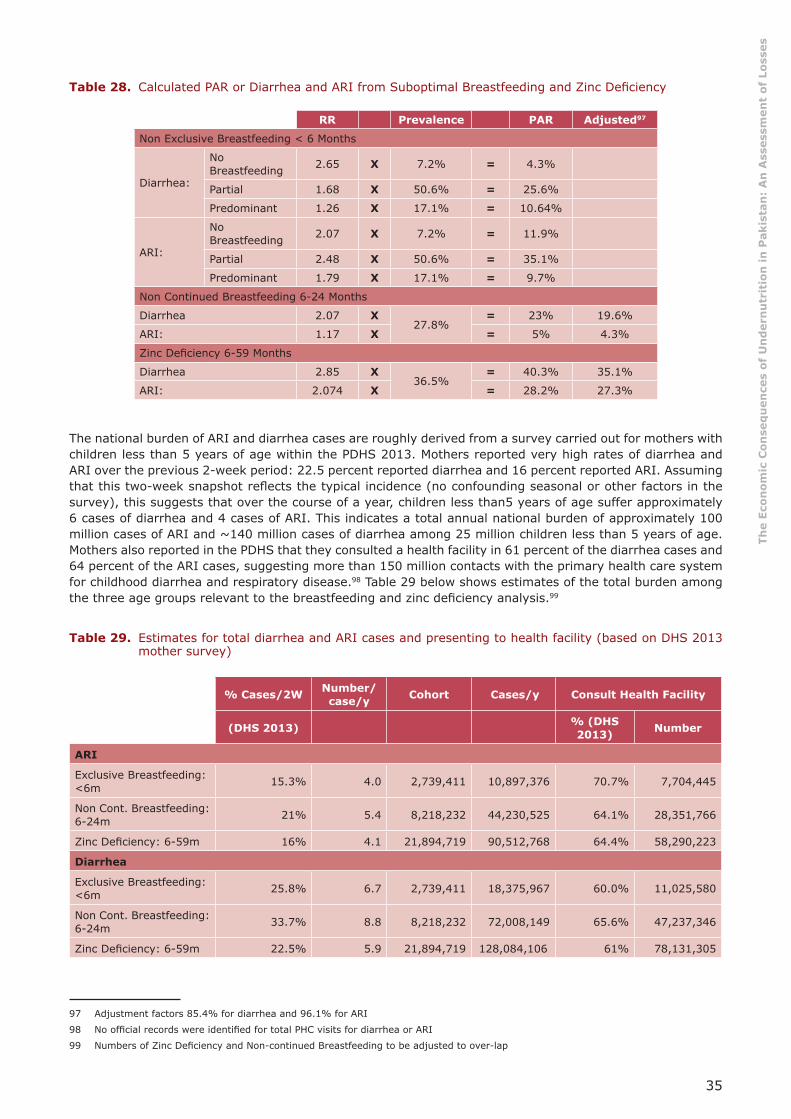
35
The
Econ
omic
Con
seq
uen
ces
of U
nd
ern
utr
itio
n in
Pak
ista
n:
An
Ass
essm
ent
of L
osse
s
Table 28. Calculated PAR or Diarrhea and ARI from Suboptimal Breastfeeding and Zinc Defi ciency 97
RR Prevalence PAR Adjusted97
Non Exclusive Breastfeeding < 6 Months
Diarrhea:
No Breastfeeding 2.65 X 7.2% = 4.3%
Partial 1.68 X 50.6% = 25.6%
Predominant 1.26 X 17.1% = 10.64%
ARI:
No Breastfeeding 2.07 X 7.2% = 11.9%
Partial 2.48 X 50.6% = 35.1%
Predominant 1.79 X 17.1% = 9.7%
Non Continued Breastfeeding 6-24 Months
Diarrhea 2.07 X27.8%
= 23% 19.6%
ARI: 1.17 X = 5% 4.3%
Zinc Defi ciency 6-59 Months
Diarrhea 2.85 X36.5%
= 40.3% 35.1%
ARI: 2.074 X = 28.2% 27.3%
The national burden of ARI and diarrhea cases are roughly derived from a survey carried out for mothers with children less than 5 years of age within the PDHS 2013. Mothers reported very high rates of diarrhea and ARI over the previous 2-week period: 22.5 percent reported diarrhea and 16 percent reported ARI. Assuming that this two-week snapshot refl ects the typical incidence (no confounding seasonal or other factors in the survey), this suggests that over the course of a year, children less than5 years of age suffer approximately 6 cases of diarrhea and 4 cases of ARI. This indicates a total annual national burden of approximately 100 million cases of ARI and ~140 million cases of diarrhea among 25 million children less than 5 years of age. Mothers also reported in the PDHS that they consulted a health facility in 61 percent of the diarrhea cases and 64 percent of the ARI cases, suggesting more than 150 million contacts with the primary health care system for childhood diarrhea and respiratory disease.98 Table 29 below shows estimates of the total burden among the three age groups relevant to the breastfeeding and zinc defi ciency analysis.99
Table 29. Estimates for total diarrhea and ARI cases and presenting to health facility (based on DHS 2013 mother survey)
% Cases/2W Number/case/y Cohort Cases/y Consult Health Facility
(DHS 2013) % (DHS 2013) Number
ARI
Exclusive Breastfeeding: <6m 15.3% 4.0 2,739,411 10,897,376 70.7% 7,704,445
Non Cont. Breastfeeding: 6-24m 21% 5.4 8,218,232 44,230,525 64.1% 28,351,766
Zinc Defi ciency: 6-59m 16% 4.1 21,894,719 90,512,768 64.4% 58,290,223
Diarrhea
Exclusive Breastfeeding: <6m 25.8% 6.7 2,739,411 18,375,967 60.0% 11,025,580
Non Cont. Breastfeeding: 6-24m 33.7% 8.8 8,218,232 72,008,149 65.6% 47,237,346
Zinc Defi ciency: 6-59m 22.5% 5.9 21,894,719 128,084,106 61% 78,131,305
97 Adjustment factors 85.4% for diarrhea and 96.1% for ARI
98 No offi cial records were identifi ed for total PHC visits for diarrhea or ARI
99 Numbers of Zinc Defi ciency and Non-continued Breastfeeding to be adjusted to over-lap
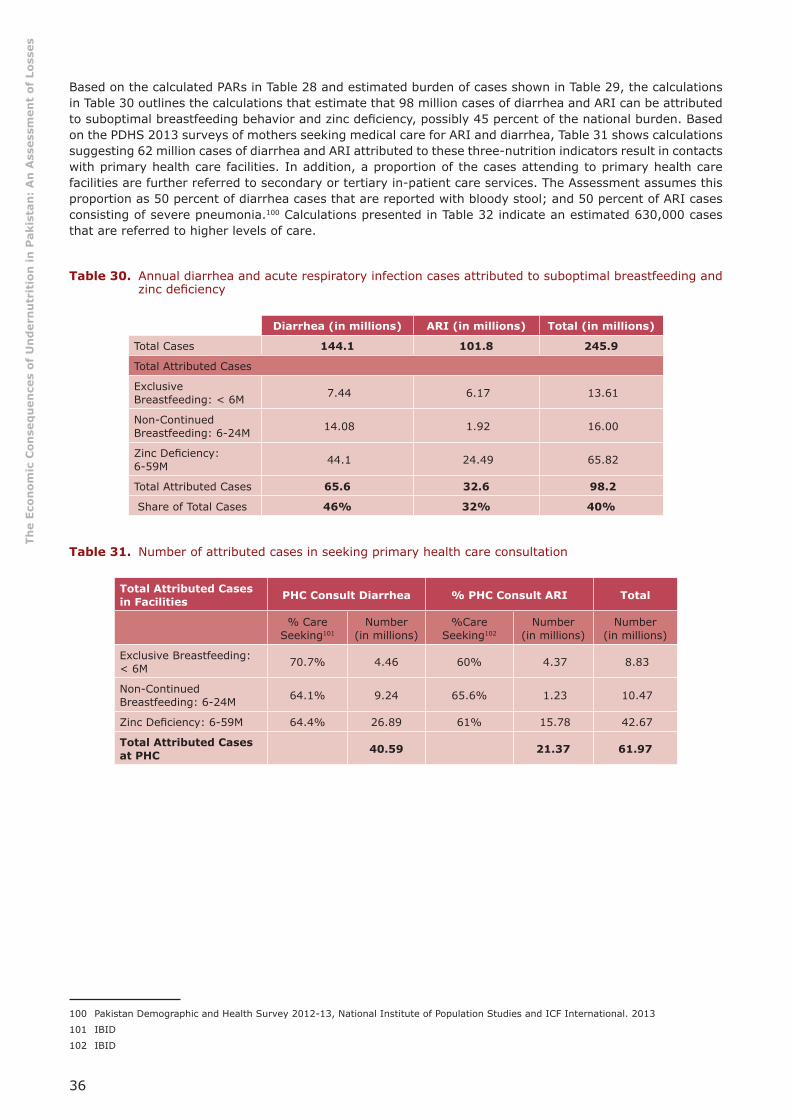
36
The
Econ
omic
Con
seq
uen
ces
of U
nd
ern
utr
itio
n in
Pak
ista
n:
An
Ass
essm
ent
of L
osse
s
Based on the calculated PARs in Table 28 and estimated burden of cases shown in Table 29, the calculations in Table 30 outlines the calculations that estimate that 98 million cases of diarrhea and ARI can be attributed to suboptimal breastfeeding behavior and zinc defi ciency, possibly 45 percent of the national burden. Based on the PDHS 2013 surveys of mothers seeking medical care for ARI and diarrhea, Table 31 shows calculations suggesting 62 million cases of diarrhea and ARI attributed to these three-nutrition indicators result in contacts with primary health care facilities. In addition, a proportion of the cases attending to primary health care facilities are further referred to secondary or tertiary in-patient care services. The Assessment assumes this proportion as 50 percent of diarrhea cases that are reported with bloody stool; and 50 percent of ARI cases consisting of severe pneumonia.100 Calculations presented in Table 32 indicate an estimated 630,000 cases that are referred to higher levels of care.
Table 30. Annual diarrhea and acute respiratory infection cases attributed to suboptimal breastfeeding and zinc defi ciency
Diarrhea (in millions) ARI (in millions) Total (in millions)
Total Cases 144.1 101.8 245.9
Total Attributed Cases
Exclusive Breastfeeding: < 6M 7.44 6.17 13.61
Non-Continued Breastfeeding: 6-24M 14.08 1.92 16.00
Zinc Defi ciency: 6-59M 44.1 24.49 65.82
Total Attributed Cases 65.6 32.6 98.2
Share of Total Cases 46% 32% 40%
Table 31. Number of attributed cases in seeking primary health care consultation 101 102
Total Attributed Cases in Facilities PHC Consult Diarrhea % PHC Consult ARI Total
% Care Seeking101
Number(in millions)
%Care Seeking102
Number(in millions)
Number(in millions)
Exclusive Breastfeeding: < 6M 70.7% 4.46 60% 4.37 8.83
Non-Continued Breastfeeding: 6-24M 64.1% 9.24 65.6% 1.23 10.47
Zinc Defi ciency: 6-59M 64.4% 26.89 61% 15.78 42.67
Total Attributed Cases at PHC 40.59 21.37 61.97
100 Pakistan Demographic and Health Survey 2012-13, National Institute of Population Studies and ICF International. 2013
101 IBID
102 IBID

37
The
Econ
omic
Con
seq
uen
ces
of U
nd
ern
utr
itio
n in
Pak
ista
n:
An
Ass
essm
ent
of L
osse
s
Table 32. Number of attributed cases referred from primary health care to higher level 103 104
% Referred Cases from
PHC:103
Diarrhea,(in millions)
% Referred Cases from
PHC:104
ARI (in millions) Total
Zinc Defi ciency 1.2% 0.31 0.5% 0.08 0.39
Non Exclusive < 6M 0.7% 0.05 0.02 0.07
Non Continued 6-24M 1.7% 0.16 0.01 0.17
Total Cases 0.52 0.11 0.63
The fi nancial consequences of these 63 million cases of diarrhea and ARI include the excess cost of medical care at primary health facilities and hospitals, as well as the fi nancial and opportunity costs of care to families. Comprehensive data on health care costs per contact at primary health care facilities are not identifi ed in this Assessment. The unit costs are taken from the literature as follows:
• In a study of primary health care in Pakistan, using data from 2005, Malik et al. found the mean cost of an outpatient visit of US$ 5.89 – or US$ 15.99 per visit corrected for 12 years infl ation. Recognizing the “softness” of this estimate, and in order not to overestimate, the Assessment assumes 50% of this infl ation corrected fi gure and applies a cost of US$ 7.99 per primary health care consultation for diarrhea and ARI.105
• Using 2002 data, Malik et al. also found the cost for a severe pneumonia episode at US$ 142.90. After adjustment for 50 percent of over-all infl ation, the Assessment estimations yield US$ 243 per episode. The Assessment uses this parameter to represent the cost of each referral from primary to higher level of in patient – or hospital cases.106
• In a study from Northern Pakistan from 2008, Hussain et al. estimated costs of pneumonia per episode for both health system as well as families, including travel and time at the facility. The Assessment applies the share of costs per episode falling on families determined by Hussain et al. to the dollar value of cost per contact derived from Malik et al., in order to estimate a family burden of US$ 1.71 per episode of ARI and diarrhea.107
• A separate calculation is made for costs to families not seeking primary health care for children with ARI and diarrhea. Based on an in-depth assessment of home treatment practices for diarrhea and ARI, Larsen et al. estimated two hours per day over seven days for diarrhea and four days for ARI, as time lost by families from a variety of tasks to provide care for the sick child.108 Valuing this lost time, or “opportunity costs,” is a problematic step. For the sake of this analysis, the Assessment applies a conservative value of 50 percent of the Pakistani minimum wage to derive an opportunity cost for families not seeking out medical care of US$ 4.01 for diarrhea and US$ 2.29 for ARI. In addition, we estimate a notional US$ 0.50 for cost of home treatments (Annex VII).
Table 33 shows the results from applying the unit costs derived above to the estimated number of primary health care visits and hospitalizations, along with home care for children with diarrhea and ARI attributed to zinc defi ciency and suboptimal breastfeeding (Tables 30-32). The Assessment estimates a US$ 962 million annual burden on the health system and individual families to treat cases of diarrhea and ARI attributed to suboptimal breastfeeding and zinc defi ciency.
103 50% of diarrhea with bloody stools reported in DHS 2013 for specifi c age groups
104 50% ARI classifi ed as sever in NNS 2011 for all age groups
105 Malik et al, Cost of Primary Health Care in Pakistan J Ayub Med Coll Abottabad 2015; 27(1)
106 IBID
107 Hussain et al, Economic Analysis of Childhood Pneumonia in Northern Pakistan, Health Policy and Planning, 2008:23: 438-442 Oxford University Press
108 Larsen, Bjorn. 2004. Cost of Environmental Damage in Colombia: A Socio-Economic and Environmental Health Risk Assessment. Prepared for the Ministry of Environment, Housing and Land Development, Republic of Colombia.
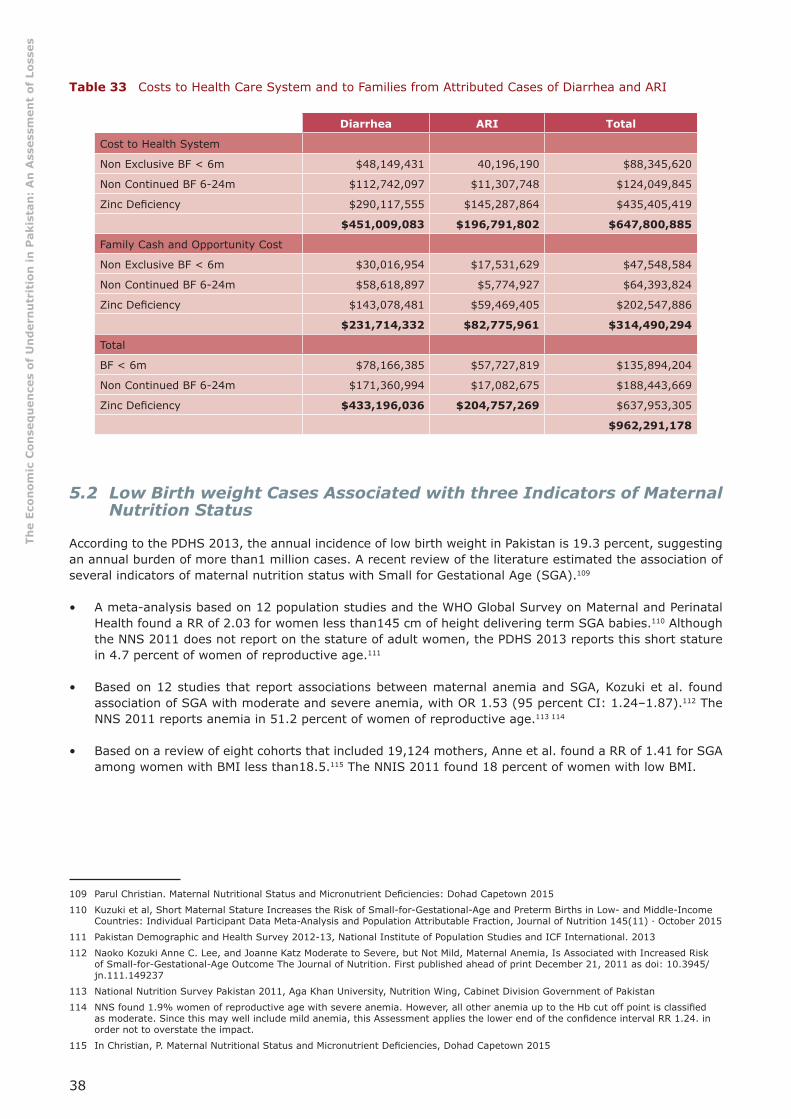
38
The
Econ
omic
Con
seq
uen
ces
of U
nd
ern
utr
itio
n in
Pak
ista
n:
An
Ass
essm
ent
of L
osse
s
Table 33 Costs to Health Care System and to Families from Attributed Cases of Diarrhea and ARI
Diarrhea ARI Total
Cost to Health System
Non Exclusive BF < 6m $48,149,431 40,196,190 $88,345,620
Non Continued BF 6-24m $112,742,097 $11,307,748 $124,049,845
Zinc Defi ciency $290,117,555 $145,287,864 $435,405,419
$451,009,083 $196,791,802 $647,800,885
Family Cash and Opportunity Cost
Non Exclusive BF < 6m $30,016,954 $17,531,629 $47,548,584
Non Continued BF 6-24m $58,618,897 $5,774,927 $64,393,824
Zinc Defi ciency $143,078,481 $59,469,405 $202,547,886
$231,714,332 $82,775,961 $314,490,294
Total
BF < 6m $78,166,385 $57,727,819 $135,894,204
Non Continued BF 6-24m $171,360,994 $17,082,675 $188,443,669
Zinc Defi ciency $433,196,036 $204,757,269 $637,953,305
$962,291,178
5.2 Low Birth weight Cases Associated with three Indicators of Maternal Nutrition Status
According to the PDHS 2013, the annual incidence of low birth weight in Pakistan is 19.3 percent, suggesting an annual burden of more than1 million cases. A recent review of the literature estimated the association of several indicators of maternal nutrition status with Small for Gestational Age (SGA).109
• A meta-analysis based on 12 population studies and the WHO Global Survey on Maternal and Perinatal Health found a RR of 2.03 for women less than145 cm of height delivering term SGA babies.110 Although the NNS 2011 does not report on the stature of adult women, the PDHS 2013 reports this short stature in 4.7 percent of women of reproductive age.111
• Based on 12 studies that report associations between maternal anemia and SGA, Kozuki et al. found association of SGA with moderate and severe anemia, with OR 1.53 (95 percent CI: 1.24–1.87).112 The NNS 2011 reports anemia in 51.2 percent of women of reproductive age.113 114
• Based on a review of eight cohorts that included 19,124 mothers, Anne et al. found a RR of 1.41 for SGA among women with BMI less than18.5.115 The NNIS 2011 found 18 percent of women with low BMI.
109 Parul Christian. Maternal Nutritional Status and Micronutrient Defi ciencies: Dohad Capetown 2015
110 Kuzuki et al, Short Maternal Stature Increases the Risk of Small-for-Gestational-Age and Preterm Births in Low- and Middle-Income Countries: Individual Participant Data Meta-Analysis and Population Attributable Fraction, Journal of Nutrition 145(11) · October 2015
111 Pakistan Demographic and Health Survey 2012-13, National Institute of Population Studies and ICF International. 2013
112 Naoko Kozuki Anne C. Lee, and Joanne Katz Moderate to Severe, but Not Mild, Maternal Anemia, Is Associated with Increased Risk of Small-for-Gestational-Age Outcome The Journal of Nutrition. First published ahead of print December 21, 2011 as doi: 10.3945/jn.111.149237
113 National Nutrition Survey Pakistan 2011, Aga Khan University, Nutrition Wing, Cabinet Division Government of Pakistan
114 NNS found 1.9% women of reproductive age with severe anemia. However, all other anemia up to the Hb cut off point is classifi ed as moderate. Since this may well include mild anemia, this Assessment applies the lower end of the confi dence interval RR 1.24. in order not to overstate the impact.
115 In Christian, P. Maternal Nutritional Status and Micronutrient Defi ciencies, Dohad Capetown 2015

39
The
Econ
omic
Con
seq
uen
ces
of U
nd
ern
utr
itio
n in
Pak
ista
n:
An
Ass
essm
ent
of L
osse
s
Based on the RR outlined above and on the national prevalence of these three indicators, Table 34 shows calculations for PARs and estimate of 221 million low birth weight deliveries annually attributed to low maternal BMI, stature/height and anemia. While all these infants will face threats to health and survival, the 48.2 percent of births delivered in public and private medical facilities represent an additional fi nancial burden. Based on a speculated and purely notional cost of US$ 500 per case for additional days in a health facility for both mother and child, including some with incubator and other special care, this suggests US$ 53 million annual cost.
Table 34. Logic model for projecting low birth weight mortality attributed to three indicators of maternal nutrition
RR of LBW Delivery
Prevalence of Condition
CalculatedPAR Infection
Annual Cases Low Birth
Weight
Attributed Cases (in millions)
Low BMI 1.41
X
18%
=
6.9%
20.9% = 1,057,413 =48.2% in facility:
106.5 casesLow Height 1.98 4.7% 4.6%
Anemia 1.24 51.2% 10.9% 221 cases

40
The
Econ
omic
Con
seq
uen
ces
of U
nd
ern
utr
itio
n in
Pak
ista
n:
An
Ass
essm
ent
of L
osse
s
6. Summary: National Economic Consequences of Child Undernutrition
The individual analysis in Sections 2 to 5 are corrected for over-lapping risks (for Pathways 1 and 2) and then aggregated to estimate a burden to the national economy of approximately US$ 7.6 billion annually. This represents approximately 3 percent of the national GDP.116 This fi gure is comprised of qualitatively different kinds of economic losses, as measured via four pathways:
• Pathway #1: the Net Present Value (NPV) of the lost workforce that results from more than 180,000 annual deaths, totals US$ 2.46 billion yearly or 30 percent of the national burden.
• Pathway #2: the NPV of lost future productivity due to cognitive defi cit and other defi cits from childhood anemia, IDD and stunting, total US$ 3.7 billion yearly, about half the national burden.
• Pathway #3: current annual losses due to work performance defi cits among anemic adults engaged in the manual labor sector total US$ 657 million annually or 9 percent of the total annual burden.
• Pathway #4: expenses incurred in treating excess cases of low birth weight, diarrhea and respiratory disease attributed to zinc defi ciency, suboptimal breastfeeding behaviors and maternal undernutrition costs the Government of Pakistan and families approximately US$ 1 billion, or 13 percent of the burden of undernutrition.
Table 35: Summary economic consequences for all indicators (adjusted for multiple risks)
Lost Workforce (in millions)
Lost Future Productivity (in millions)
Lost Current Productivity (in millions)
Current Health Costs
(in millions)
Total (in millions)
Maternal Nutrition $722.0 $16.15 $53.2 $791
Suboptimal Breastfeeding $447.8 $324.3 $772
Stunting $2,380.4 $2,380
Underweight/Wasting $780.5 $780
Iodine Defi ciency $594.3 $594
Zinc Defi ciency $132.2 $638.0 $770
Vitamin A Defi ciency $163.4 $163
Childhood Anemia $702.6 $703
Adult Anemia $656.5 $657
Annual Total $2,246 $3,694 $657 $1,016 $7,611
30% 49% 9% 13%
The quality of the “currency” varies signifi cantly among the pathways. Pathways #1 and #2 apply an NPV to capture the future productivity loss or earnings defi cit emerging from child mortality or growth defi cits. Pathway #3 describes current loss of productive potential of today’s adults working at less than optimal effi ciency. Pathway #4 represents the current costs of preventable cases of disease, resulting in excess utilization of health care services and requiring resources from families or the health care system. Pathways #1-2 represent a NPV of losses projected for the next generation, while Pathways #3-4 represent the current value of reduced productivity and fi nancial costs.
116 $272.595 billion:http://databank.worldbank.org/data/reports.aspx?source=2&country=PAK
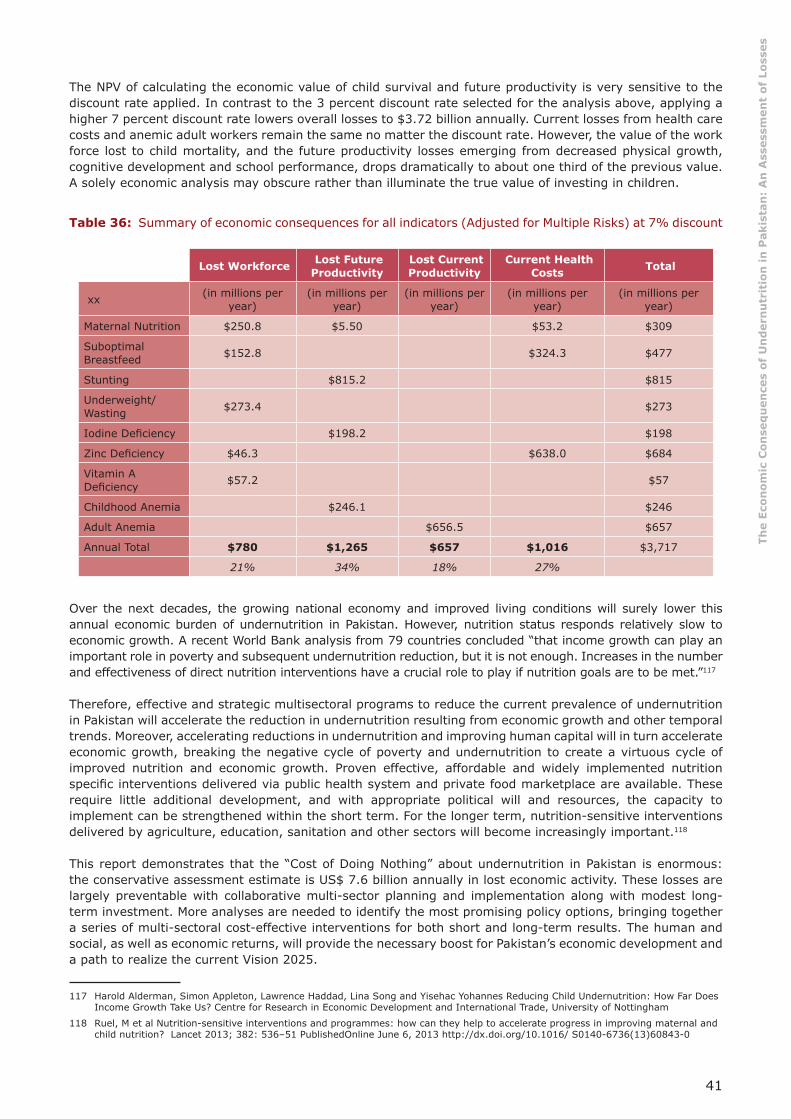
41
The
Econ
omic
Con
seq
uen
ces
of U
nd
ern
utr
itio
n in
Pak
ista
n:
An
Ass
essm
ent
of L
osse
s
The NPV of calculating the economic value of child survival and future productivity is very sensitive to the discount rate applied. In contrast to the 3 percent discount rate selected for the analysis above, applying a higher 7 percent discount rate lowers overall losses to $3.72 billion annually. Current losses from health care costs and anemic adult workers remain the same no matter the discount rate. However, the value of the work force lost to child mortality, and the future productivity losses emerging from decreased physical growth, cognitive development and school performance, drops dramatically to about one third of the previous value. A solely economic analysis may obscure rather than illuminate the true value of investing in children.
Table 36: Summary of economic consequences for all indicators (Adjusted for Multiple Risks) at 7% discount
Lost Workforce Lost Future Productivity
Lost Current Productivity
Current Health Costs Total
xx (in millions per year)
(in millions per year)
(in millions per year)
(in millions per year)
(in millions per year)
Maternal Nutrition $250.8 $5.50 $53.2 $309
Suboptimal Breastfeed $152.8 $324.3 $477
Stunting $815.2 $815
Underweight/Wasting $273.4 $273
Iodine Defi ciency $198.2 $198
Zinc Defi ciency $46.3 $638.0 $684
Vitamin A Defi ciency $57.2 $57
Childhood Anemia $246.1 $246
Adult Anemia $656.5 $657
Annual Total $780 $1,265 $657 $1,016 $3,717
21% 34% 18% 27%
Over the next decades, the growing national economy and improved living conditions will surely lower this annual economic burden of undernutrition in Pakistan. However, nutrition status responds relatively slow to economic growth. A recent World Bank analysis from 79 countries concluded “that income growth can play an important role in poverty and subsequent undernutrition reduction, but it is not enough. Increases in the number and effectiveness of direct nutrition interventions have a crucial role to play if nutrition goals are to be met.”117
Therefore, effective and strategic multisectoral programs to reduce the current prevalence of undernutrition in Pakistan will accelerate the reduction in undernutrition resulting from economic growth and other temporal trends. Moreover, accelerating reductions in undernutrition and improving human capital will in turn accelerate economic growth, breaking the negative cycle of poverty and undernutrition to create a virtuous cycle of improved nutrition and economic growth. Proven effective, affordable and widely implemented nutrition specifi c interventions delivered via public health system and private food marketplace are available. These require little additional development, and with appropriate political will and resources, the capacity to implement can be strengthened within the short term. For the longer term, nutrition-sensitive interventions delivered by agriculture, education, sanitation and other sectors will become increasingly important.118
This report demonstrates that the “Cost of Doing Nothing” about undernutrition in Pakistan is enormous: the conservative assessment estimate is US$ 7.6 billion annually in lost economic activity. These losses are largely preventable with collaborative multi-sector planning and implementation along with modest long-term investment. More analyses are needed to identify the most promising policy options, bringing together a series of multi-sectoral cost-effective interventions for both short and long-term results. The human and social, as well as economic returns, will provide the necessary boost for Pakistan’s economic development and a path to realize the current Vision 2025.
117 Harold Alderman, Simon Appleton, Lawrence Haddad, Lina Song and Yisehac Yohannes Reducing Child Undernutrition: How Far Does Income Growth Take Us? Centre for Research in Economic Development and International Trade, University of Nottingham
118 Ruel, M et al Nutrition-sensitive interventions and programmes: how can they help to accelerate progress in improving maternal and child nutrition? Lancet 2013; 382: 536–51 PublishedOnline June 6, 2013 http://dx.doi.org/10.1016/ S0140-6736(13)60843-0
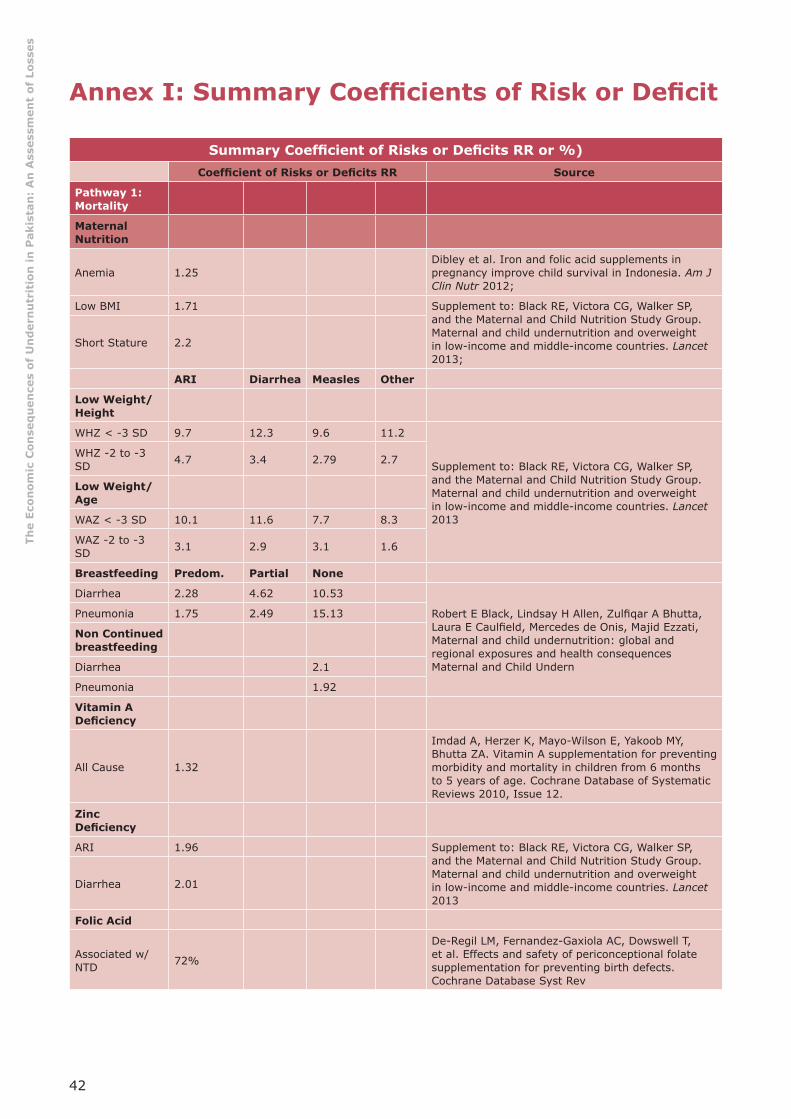
42
The
Econ
omic
Con
seq
uen
ces
of U
nd
ern
utr
itio
n in
Pak
ista
n:
An
Ass
essm
ent
of L
osse
s
Annex I: Summary Coeffi cients of Risk or Defi cit
Summary Coeffi cient of Risks or Defi cits RR or %)Coeffi cient of Risks or Defi cits RR Source
Pathway 1: Mortality
Maternal Nutrition
Anemia 1.25Dibley et al. Iron and folic acid supplements in pregnancy improve child survival in Indonesia. Am J Clin Nutr 2012;
Low BMI 1.71 Supplement to: Black RE, Victora CG, Walker SP, and the Maternal and Child Nutrition Study Group. Maternal and child undernutrition and overweight in low-income and middle-income countries. Lancet 2013;
Short Stature 2.2
ARI Diarrhea Measles Other
Low Weight/Height
WHZ < -3 SD 9.7 12.3 9.6 11.2
Supplement to: Black RE, Victora CG, Walker SP, and the Maternal and Child Nutrition Study Group. Maternal and child undernutrition and overweight in low-income and middle-income countries. Lancet 2013
WHZ -2 to -3 SD 4.7 3.4 2.79 2.7
Low Weight/ Age
WAZ < -3 SD 10.1 11.6 7.7 8.3
WAZ -2 to -3 SD 3.1 2.9 3.1 1.6
Breastfeeding Predom. Partial None
Diarrhea 2.28 4.62 10.53
Robert E Black, Lindsay H Allen, Zulfi qar A Bhutta, Laura E Caulfi eld, Mercedes de Onis, Majid Ezzati, Maternal and child undernutrition: global and regional exposures and health consequences Maternal and Child Undern
Pneumonia 1.75 2.49 15.13
Non Continued breastfeeding
Diarrhea 2.1
Pneumonia 1.92
Vitamin A Defi ciency
All Cause 1.32
Imdad A, Herzer K, Mayo-Wilson E, Yakoob MY, Bhutta ZA. Vitamin A supplementation for preventing morbidity and mortality in children from 6 months to 5 years of age. Cochrane Database of Systematic Reviews 2010, Issue 12.
Zinc Defi ciency
ARI 1.96 Supplement to: Black RE, Victora CG, Walker SP, and the Maternal and Child Nutrition Study Group. Maternal and child undernutrition and overweight in low-income and middle-income countries. Lancet 2013
Diarrhea 2.01
Folic Acid
Associated w/NTD 72%
De-Regil LM, Fernandez-Gaxiola AC, Dowswell T, et al. Effects and safety of periconceptional folate supplementation for preventing birth defects. Cochrane Database Syst Rev

43
The
Econ
omic
Con
seq
uen
ces
of U
nd
ern
utr
itio
n in
Pak
ista
n:
An
Ass
essm
ent
of L
osse
s
Pathway 2: Productivity
Stunting Moderate Severe
Manual Labor 6.04% 8.6%
Derived from: Haddad, L et al The Impact of Nutritional Status on Agricultural Productivity: Wage Evidence from the Philippines, Oxford Bulletin of Economics & Statistics, Vol 53 Feburary, 1991, 45-68 1991 and Burkhalter, Barton R., Victor M. Aguayo, Serigne M. Diene, Margaret B. Parlato, and Jay S. Ross PROFILES: A Data-Based Approach to Nutrition Advocacy and Policy Development. BASICS/ USAID 1998
Service Sector
All Stunting 19.8%Grantham-McGregor et al, Developmental Potential in the fi rst 5 Years for Children in Developing Countries, The Lancet, VOl 369, 2007;
Anemia
Loss in Earnings 2.5% Horton & Ross The Economics of Iron Defi ciency Food Policy 28 (2003) 51–75
Iodine Defi ciency
Loss in Earnings 6%Bagriansky, J. Economic Impact of Iodine Defi ciency, Unpublished Paper, UNICEF 2015 Poster at Micronutrient Forum 2016
Pathway 3: Adult Anemia
Loss Manual Labor 5%
Ross L Horton S The Economic Consequences of Iron Defi ciency, Micronutrient Initiative, 1998Loss in Heavy
Labor 15%
Pathway 4: Health Care
Non Exclusive Diarrhea ARIRobert E Black, Cesar G Victora, Susan P Walker, Zulfi qar A Bhutta, Parul Christian, Mercedes de Onis, Majid Ezzati, Sally Grantham-McGrego, Joanne Katz, Reynaldo Martorell, Ricardo Uauy, and the Maternal and Child Nutrition Study Group Maternal and child undernutrition and overweight in low-income and middle-income countries The Lancet, June 6, 2013
None 2.65 2.48
Partial 1.68 2.07
Predominant 1.26 1.79
Non-Continued
None 2.07 1.17
Zinc Defi ciency
2.85 2.07
Supplement to: Robert E Black, Cesar G Victora, Susan P Walker, Zulfi qar A Bhutta, Parul Christian, Mercedes de Onis, Majid Ezzati, Sally Grantham-McGrego, Joanne Katz, Reynaldo Martorell, Ricardo Uauy, and the Maternal and Child Nutrition Study Group Maternal and child undernutrition and overweight in low-income and middle-income countries The Lancet, June 6, 2013
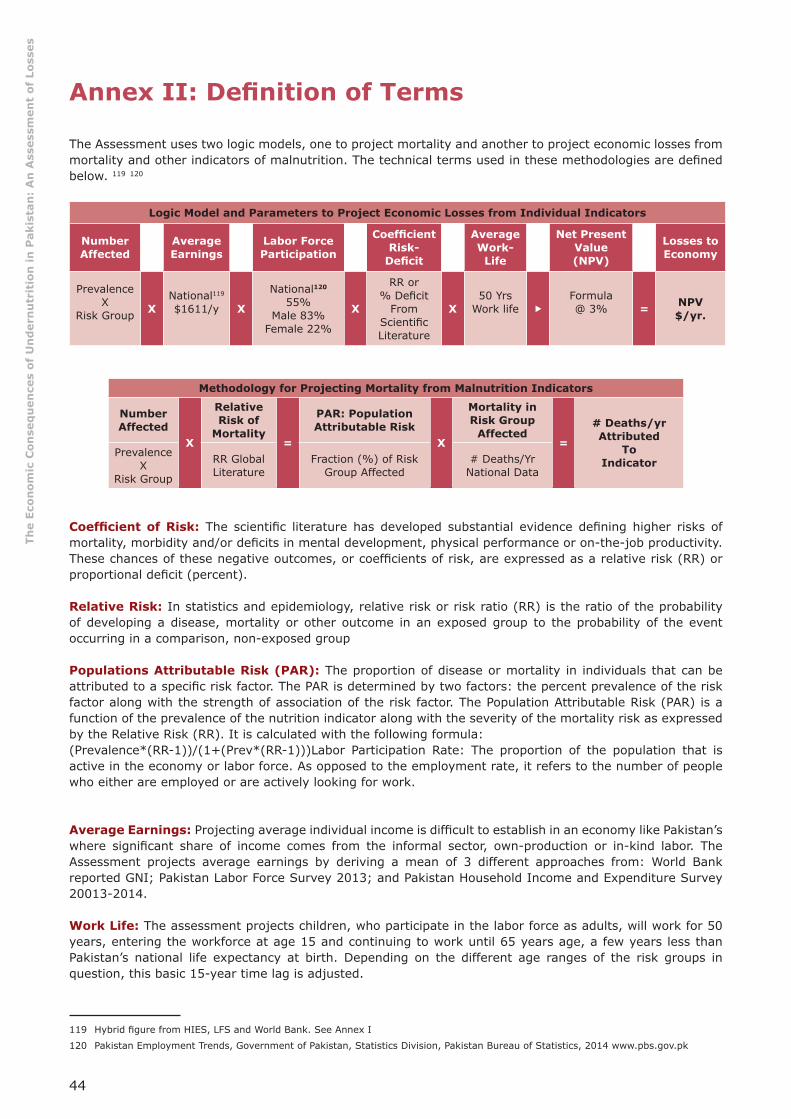
44
The
Econ
omic
Con
seq
uen
ces
of U
nd
ern
utr
itio
n in
Pak
ista
n:
An
Ass
essm
ent
of L
osse
s
Annex II: Defi nition of Terms
The Assessment uses two logic models, one to project mortality and another to project economic losses from mortality and other indicators of malnutrition. The technical terms used in these methodologies are defi ned below. 119 120
Logic Model and Parameters to Project Economic Losses from Individual Indicators
Number Affected
AverageEarnings
Labor Force Participation
Coeffi cient Risk-
Defi cit
AverageWork-
Life
Net Present Value (NPV)
Losses to Economy
Prevalence X
Risk Group
XNational119
$1611/y X
National120 55%
Male 83%Female 22%
X
RR or% Defi cit
From Scientifi c Literature
X50 Yrs
Work life �Formula@ 3% = NPV
$/yr.
Methodology for Projecting Mortality from Malnutrition Indicators
Number Affected
X
Relative Risk of
Mortality =
PAR: Population Attributable Risk
X
Mortality in Risk Group
Affected=
# Deaths/yrAttributed
ToIndicator
Prevalence X
Risk Group
RR Global Literature
Fraction (%) of Risk Group Affected
# Deaths/Yr National Data
Coeffi cient of Risk: The scientifi c literature has developed substantial evidence defi ning higher risks of mortality, morbidity and/or defi cits in mental development, physical performance or on-the-job productivity. These chances of these negative outcomes, or coeffi cients of risk, are expressed as a relative risk (RR) or proportional defi cit (percent).
Relative Risk: In statistics and epidemiology, relative risk or risk ratio (RR) is the ratio of the probability of developing a disease, mortality or other outcome in an exposed group to the probability of the event occurring in a comparison, non-exposed group
Populations Attributable Risk (PAR): The proportion of disease or mortality in individuals that can be attributed to a specifi c risk factor. The PAR is determined by two factors: the percent prevalence of the risk factor along with the strength of association of the risk factor. The Population Attributable Risk (PAR) is a function of the prevalence of the nutrition indicator along with the severity of the mortality risk as expressed by the Relative Risk (RR). It is calculated with the following formula: (Prevalence*(RR-1))/(1+(Prev*(RR-1)))Labor Participation Rate: The proportion of the population that is active in the economy or labor force. As opposed to the employment rate, it refers to the number of people who either are employed or are actively looking for work.
Average Earnings: Projecting average individual income is diffi cult to establish in an economy like Pakistan’s where signifi cant share of income comes from the informal sector, own-production or in-kind labor. The Assessment projects average earnings by deriving a mean of 3 different approaches from: World Bank reported GNI; Pakistan Labor Force Survey 2013; and Pakistan Household Income and Expenditure Survey 20013-2014.
Work Life: The assessment projects children, who participate in the labor force as adults, will work for 50 years, entering the workforce at age 15 and continuing to work until 65 years age, a few years less than Pakistan’s national life expectancy at birth. Depending on the different age ranges of the risk groups in question, this basic 15-year time lag is adjusted.
119 Hybrid fi gure from HIES, LFS and World Bank. See Annex I
120 Pakistan Employment Trends, Government of Pakistan, Statistics Division, Pakistan Bureau of Statistics, 2014 www.pbs.gov.pk
45
The
Econ
omic
Con
seq
uen
ces
of U
nd
ern
utr
itio
n in
Pak
ista
n:
An
Ass
essm
ent
of L
osse
s
• For defi cits measured at birth or during the fi rst 6 months, a full 15-year delay to onset of employment is projected.
• For mortality, when risk group is 6-24 to 6-59 months a 14 year delay is applied, since most mortality occurs in the fi rst year.
• For anemia productivity calculations, which is based on the 6-24 month age group, a delay of 14 years is also used.
• For IDD and Stunting (in service sector), the average age of the 6-59 month cohort is considered to be 2.2 years. This is subtracted from 15 years – but then 2.9 years in additional schooling are considered required to capitalize on this intellectual benefi ts. In this case, the average is 15.7 years.
Net Present Value (NPV): NPV considers the time value of money, translating future earnings fl ows into contemporary currency. The NPV is a subjective factor used to defi ne that future value in today’s currency by applying an interest or discount rate. When analyzing health and development options, the selection is often referred to as a “social discount rate,” this is not identical with bank interest charges but merely refl ects the subjective preference for current over future consumption or savings.121
Adjusting for Co-Existing ConditionsThere are other limits to the assessment methodology. Indicators of malnutrition, the ~110 million cases of undernutrition shown in Table 1, often coexist in the same individual – and data to disaggregate how many individuals suffer multiple conditions is not available. However, it is reasonable to conclude that simply summing individual results from each of the 15 indicators of undernutrition may grossly infl ate the projections. Therefore, the model applies an algorithm suggested by Rockhill et all to theoretically adjust for these multiple risks, work against infl ating the results and enables a more realistic projection.122 These calculations are provided in Annex IV.
121 Ross et all, Calculating the Consequences of Micronutrient Undernutrition on Economic Productivity, Health and Survival, AED 2003
122 Rockhill et al, Use and Misuse of Population Attributable Fractions, American Journal of Public Health, January 1988

46
The
Econ
omic
Con
seq
uen
ces
of U
nd
ern
utr
itio
n in
Pak
ista
n:
An
Ass
essm
ent
of L
osse
s
Annex III: Income or Earnings Estimates
Income Scenarios
GDP/Population-Based Approach
Total GNI (Atlas Current) $272,051,818,560 World Bank 2015
Wage Share GDP 31% Guerriero et al, 2012
GDP/Working Person $1,495 Calculated
Labor Force Survey-Based Approach
Average Wage (PKR/Mo) 13,154 Table 43 LFS
Average Wage (US$/y) $1,507 @ 0.009546
HIES-Based 2013 Approach
HH Monthly Income PKR 30,999 Table 3.5.B HIES
Income Earners Per Household 1.94 Table 3.3 HIES
Monthly Income Per Earner (PKR) 15,979 Calculated
Annual Average Income in US$ $1,831
Average Over-all Wage/Income Used in Calculated $1,611
% National Average Earnings for Manual Labor for Male and Female from LFS
PERCENTAGE DISTRIBUTION OF EMPLOYEES BY WAGE GROUPS, MAJOR OCCUPATIONAL GROUPS AND SEX 2013-14 TABLE-43
Monthly Payment Proportion of Payments Weighted
Nation Male Female Nation Male Female Nation Male Female
Average 13154 14079 8209.
Agriculture, Fishery 10616.4 10726.6 4880.2 0.66% 0.77% 0.08% 70.1 82.6 3.9
Craft 10987.7 11938.6 4646.89 20.73% 21.40% 17.60% 2277.8 2554.9 817.9
Plant and Machine 12094.9 12138.8 9129.01 9.68% 11.30% 0.90% 1170.8 1371.7 82.2
Elementary 8228.4 9365.53 4569.66 35.59% 32.23% 53.55% 2928.5 3018.5 2447.1
% Share of Workforce 0.34739 66.66% 65.70% 72.13%
6447.1 7027.7 3351.0
Average Manual 10482 11042 5806 9,671.6 10,696. 4,645.7
% National Average 80% 84% 44% 74% 81% 35%
PERCENTAGE DISTRIBUTION OF EMPLOYEES BY WAGE GROUPS, MAJOR OCCUPATIONAL GROUPS AND SEX 2013-14 TABLE-43
Average 13154 Theoretical 100% % National Average
Manager 52299.8 0.0173 904.78654
Professional 25067.7 0.1007 2524.31739
Technicians 20271.8 0.0503 1019.67154
Clerical 19913.2 0.0381 758.69292
Service & Sales 11806.6 0.1269 1498.25754 Average Service Sector
0.3333 6705.72593 20119.18971 1.529%

47
The
Econ
omic
Con
seq
uen
ces
of U
nd
ern
utr
itio
n in
Pak
ista
n:
An
Ass
essm
ent
of L
osse
s
PERCENTAGE DISTRIBUTION OF EMPLOYEES BY WAGE GROUPS, MAJOR OCCUPATIONAL GROUPS AND SEX 2013-14 (Table 43)
National Male Female National Male Female National Male Female
Monthly Payment % Share of Workforce Weighted Average
Average 13154 14079 8209.9
Agriculture, Forestry, 10616.4 10726.67 4880.2 0.66% 0.77% 0.08% 70.1 82.6 3.9
Craft 10987.7 11938.68 4646.89 20.73% 21.4% 17.6% 2277.8 2554.9 817.9
Plant and Machine 12094.9 12138.89 9129.01 9.68% 11.3% 0.90% 1170.8 1371.7 82.2
Elementary 8228.4 9365.53 4569.66 35.59% 32.% 53.55% 2928.5 3018.5 2447.1
% Share of Workforce 66.66% 65.% 72.13%
6447.1 7027.7 3351.0
Average Manual 10482 11042 5806 9,671.6 10,696 4,645.7
% National Average 80% 84% 44% 74% 81% 35%
Monthly Payment % Share of workforce Services Manual
Average 13154
Manager 52299.8 1.73% 904.78654
Professional 25067.7 10.07% 2524.31739
Technicians 20271.8 5.03% 1019.67154
Clerical 19913.2 3.81% 758.69292
Service & Sales 11806.6 12.69% 1498.25754
Agriculture, Forestry, Fishery 10616.4 0.66% 70.06824
Craft 10987.7 20.73% 2277.75021
Plant and Machine 12094.9 9.68% 1170.78632
Elementary 8228.4 35.59% 2928.48756
Weighted Average 19031.83333 6705.72593 6447.09233
% Work Force 33.33% 66.66%
20,119.19 9671.605656
1.53 0.735259667
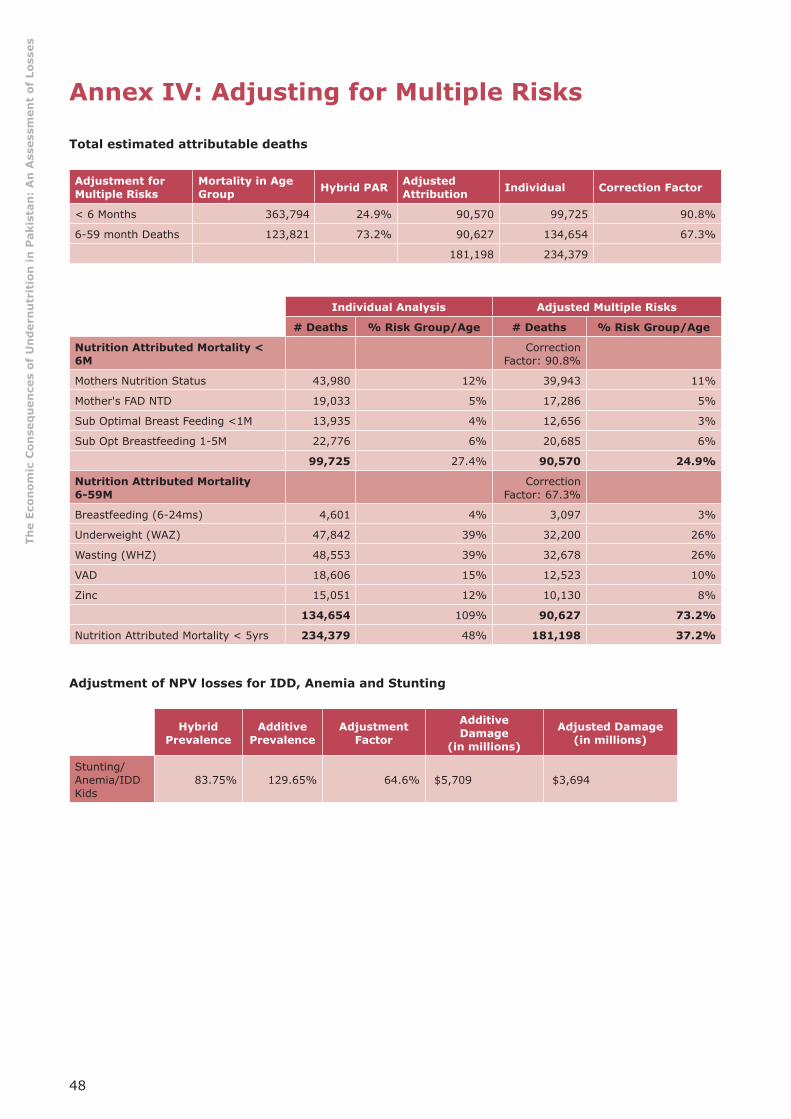
48
The
Econ
omic
Con
seq
uen
ces
of U
nd
ern
utr
itio
n in
Pak
ista
n:
An
Ass
essm
ent
of L
osse
s
Annex IV: Adjusting for Multiple Risks
Total estimated attributable deaths
Adjustment for Multiple Risks
Mortality in Age Group Hybrid PAR Adjusted
Attribution Individual Correction Factor
< 6 Months 363,794 24.9% 90,570 99,725 90.8%
6-59 month Deaths 123,821 73.2% 90,627 134,654 67.3%
181,198 234,379
Individual Analysis Adjusted Multiple Risks
# Deaths % Risk Group/Age # Deaths % Risk Group/Age
Nutrition Attributed Mortality < 6M
Correction Factor: 90.8%
Mothers Nutrition Status 43,980 12% 39,943 11%
Mother's FAD NTD 19,033 5% 17,286 5%
Sub Optimal Breast Feeding <1M 13,935 4% 12,656 3%
Sub Opt Breastfeeding 1-5M 22,776 6% 20,685 6%
99,725 27.4% 90,570 24.9%
Nutrition Attributed Mortality 6-59M
Correction Factor: 67.3%
Breastfeeding (6-24ms) 4,601 4% 3,097 3%
Underweight (WAZ) 47,842 39% 32,200 26%
Wasting (WHZ) 48,553 39% 32,678 26%
VAD 18,606 15% 12,523 10%
Zinc 15,051 12% 10,130 8%
134,654 109% 90,627 73.2%
Nutrition Attributed Mortality < 5yrs 234,379 48% 181,198 37.2%
Adjustment of NPV losses for IDD, Anemia and Stunting
Hybrid Prevalence
Additive Prevalence
Adjustment Factor
AdditiveDamage
(in millions)
Adjusted Damage(in millions)
Stunting/Anemia/IDD Kids
83.75% 129.65% 64.6% $5,709 $3,694
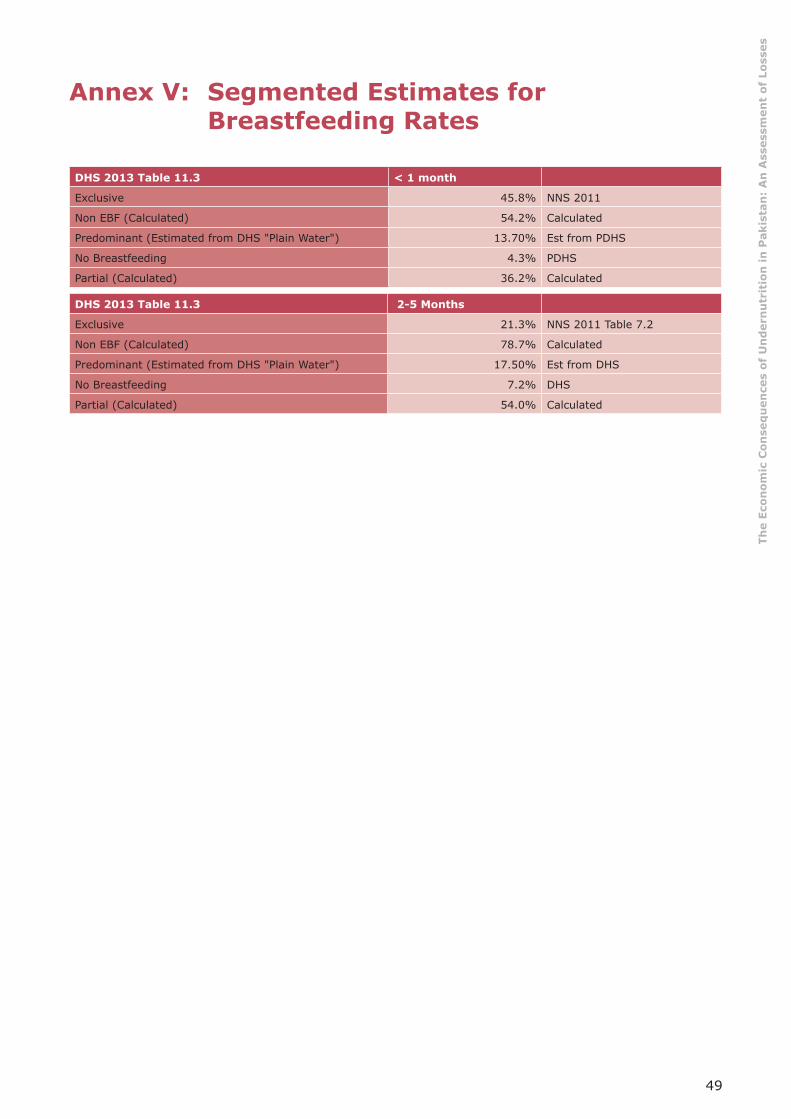
49
The
Econ
omic
Con
seq
uen
ces
of U
nd
ern
utr
itio
n in
Pak
ista
n:
An
Ass
essm
ent
of L
osse
s
Annex V: Segmented Estimates for Breastfeeding Rates
DHS 2013 Table 11.3 < 1 month
Exclusive 45.8% NNS 2011
Non EBF (Calculated) 54.2% Calculated
Predominant (Estimated from DHS "Plain Water") 13.70% Est from PDHS
No Breastfeeding 4.3% PDHS
Partial (Calculated) 36.2% Calculated
DHS 2013 Table 11.3 2-5 Months
Exclusive 21.3% NNS 2011 Table 7.2
Non EBF (Calculated) 78.7% Calculated
Predominant (Estimated from DHS "Plain Water") 17.50% Est from DHS
No Breastfeeding 7.2% DHS
Partial (Calculated) 54.0% Calculated
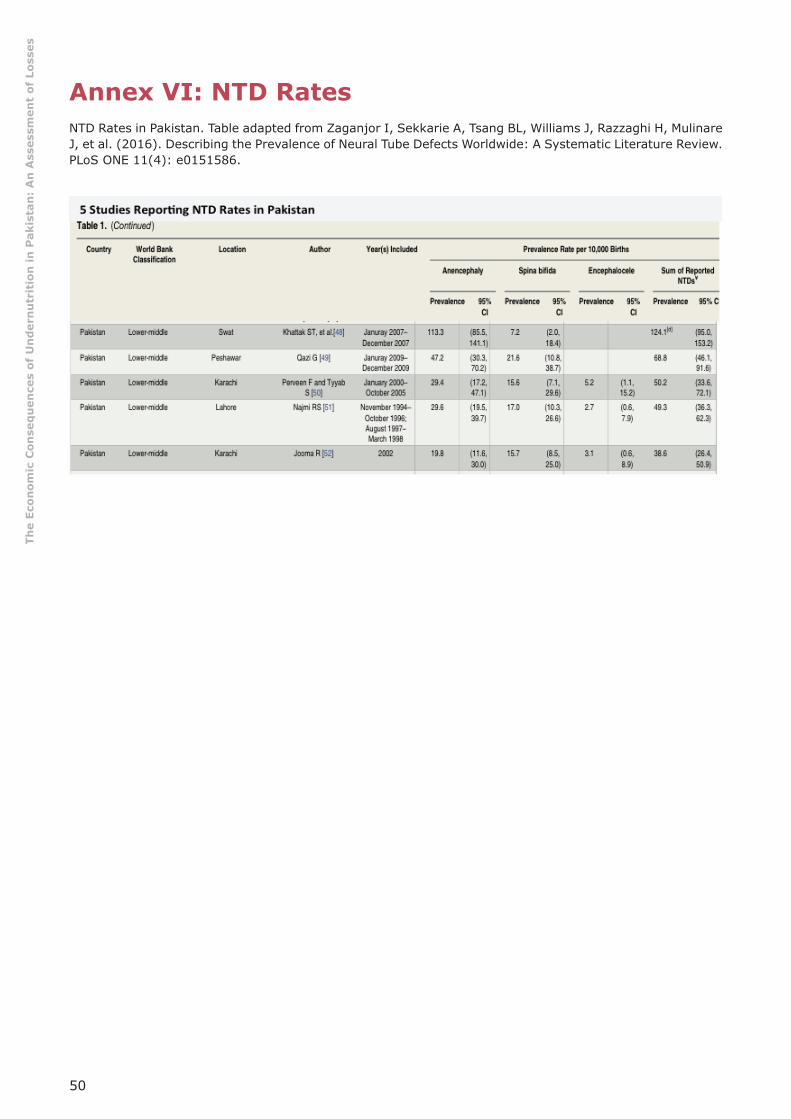
50
The
Econ
omic
Con
seq
uen
ces
of U
nd
ern
utr
itio
n in
Pak
ista
n:
An
Ass
essm
ent
of L
osse
s
Annex VI: NTD Rates
NTD Rates in Pakistan. Table adapted from Zaganjor I, Sekkarie A, Tsang BL, Williams J, Razzaghi H, Mulinare J, et al. (2016). Describing the Prevalence of Neural Tube Defects Worldwide: A Systematic Literature Review. PLoS ONE 11(4): e0151586.
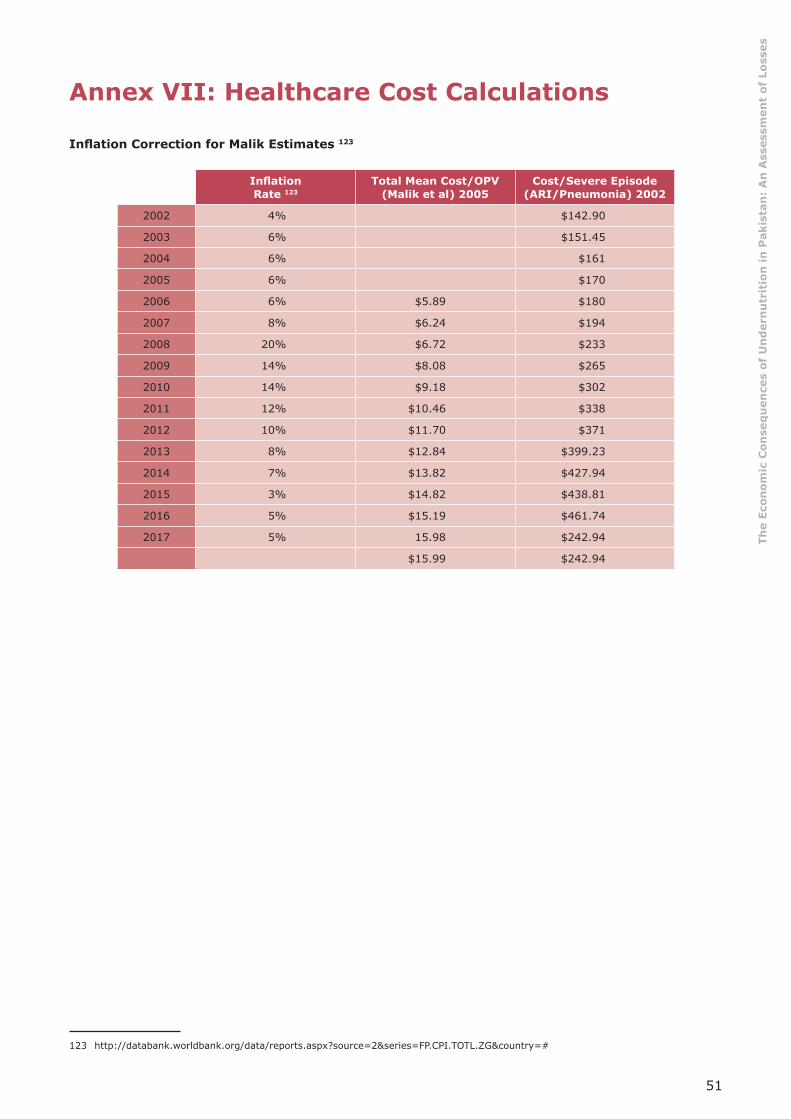
51
The
Econ
omic
Con
seq
uen
ces
of U
nd
ern
utr
itio
n in
Pak
ista
n:
An
Ass
essm
ent
of L
osse
s
Annex VII: Healthcare Cost Calculations
Infl ation Correction for Malik Estimates 123
Infl ation Rate 123
Total Mean Cost/OPV(Malik et al) 2005
Cost/Severe Episode(ARI/Pneumonia) 2002
2002 4% $142.90
2003 6% $151.45
2004 6% $161
2005 6% $170
2006 6% $5.89 $180
2007 8% $6.24 $194
2008 20% $6.72 $233
2009 14% $8.08 $265
2010 14% $9.18 $302
2011 12% $10.46 $338
2012 10% $11.70 $371
2013 8% $12.84 $399.23
2014 7% $13.82 $427.94
2015 3% $14.82 $438.81
2016 5% $15.19 $461.74
2017 5% 15.98 $242.94
$15.99 $242.94
123 http://databank.worldbank.org/data/reports.aspx?source=2&series=FP.CPI.TOTL.ZG&country=#
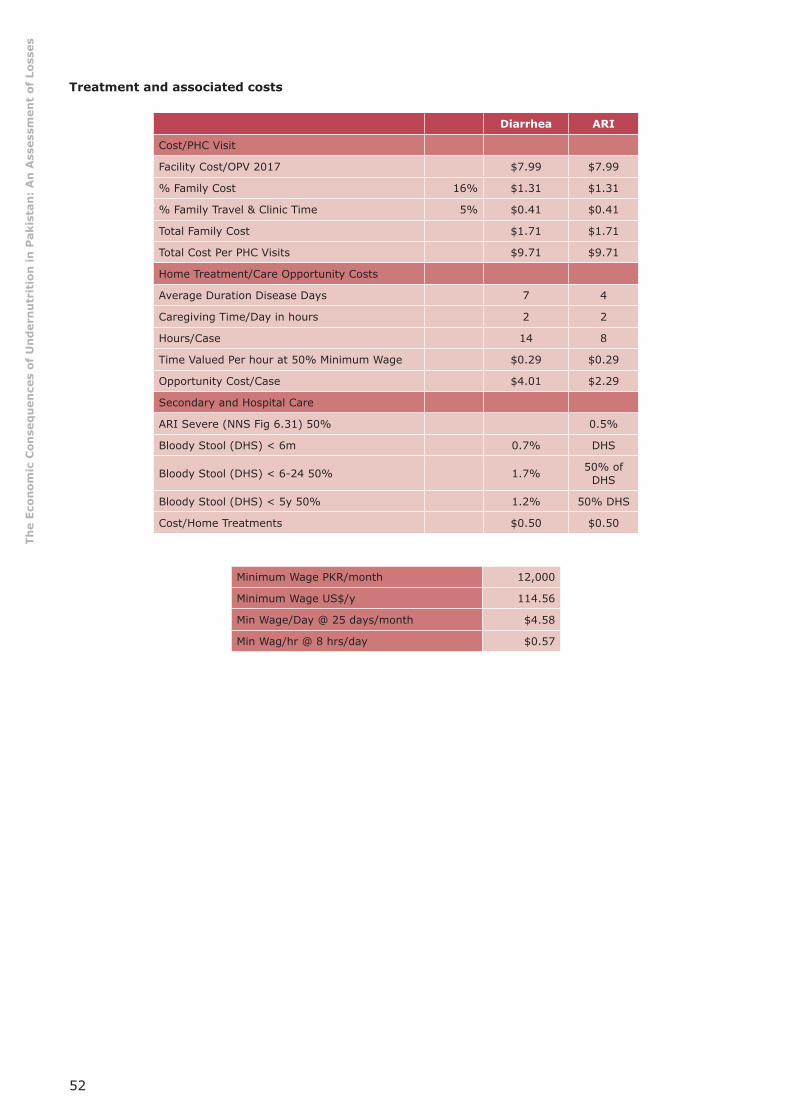
52
The
Econ
omic
Con
seq
uen
ces
of U
nd
ern
utr
itio
n in
Pak
ista
n:
An
Ass
essm
ent
of L
osse
s
Treatment and associated costs
Diarrhea ARI
Cost/PHC Visit
Facility Cost/OPV 2017 $7.99 $7.99
% Family Cost 16% $1.31 $1.31
% Family Travel & Clinic Time 5% $0.41 $0.41
Total Family Cost $1.71 $1.71
Total Cost Per PHC Visits $9.71 $9.71
Home Treatment/Care Opportunity Costs
Average Duration Disease Days 7 4
Caregiving Time/Day in hours 2 2
Hours/Case 14 8
Time Valued Per hour at 50% Minimum Wage $0.29 $0.29
Opportunity Cost/Case $4.01 $2.29
Secondary and Hospital Care
ARI Severe (NNS Fig 6.31) 50% 0.5%
Bloody Stool (DHS) < 6m 0.7% DHS
Bloody Stool (DHS) < 6-24 50% 1.7% 50% of DHS
Bloody Stool (DHS) < 5y 50% 1.2% 50% DHS
Cost/Home Treatments $0.50 $0.50
Minimum Wage PKR/month 12,000
Minimum Wage US$/y 114.56
Min Wage/Day @ 25 days/month $4.58
Min Wag/hr @ 8 hrs/day $0.57

53
The
Econ
omic
Con
seq
uen
ces
of U
nd
ern
utr
itio
n in
Pak
ista
n:
An
Ass
essm
ent
of L
osse
s
Annex VIII: Global Anemia Prevalence Estimates
Data adapted from http://www.who.int/vmnis/anaemia/prevalence/summary/anaemia_data_status_t2/en/
Population group Prevalence of anaemia
Population affected
Percent 95% CINumber
95% CINumber
(millions) (millions)
Preschool-age children 47.4 45.7-49.1 293 283-303
School-age children 25.4 19.9-30.9 305 238-371
Pregnant women 41.8 39.9-43.8 56 54-59
Non-pregnant women 30.2 28.7-31.6 468 446-491
Men 12.7 8.6-16.9 260 175-345
Elderly 23.9 18.3-29.4 164 126-202
Total population 24.8 22.9-26.7 1620 1500-1740
Male % Non Pregnant Female 42%
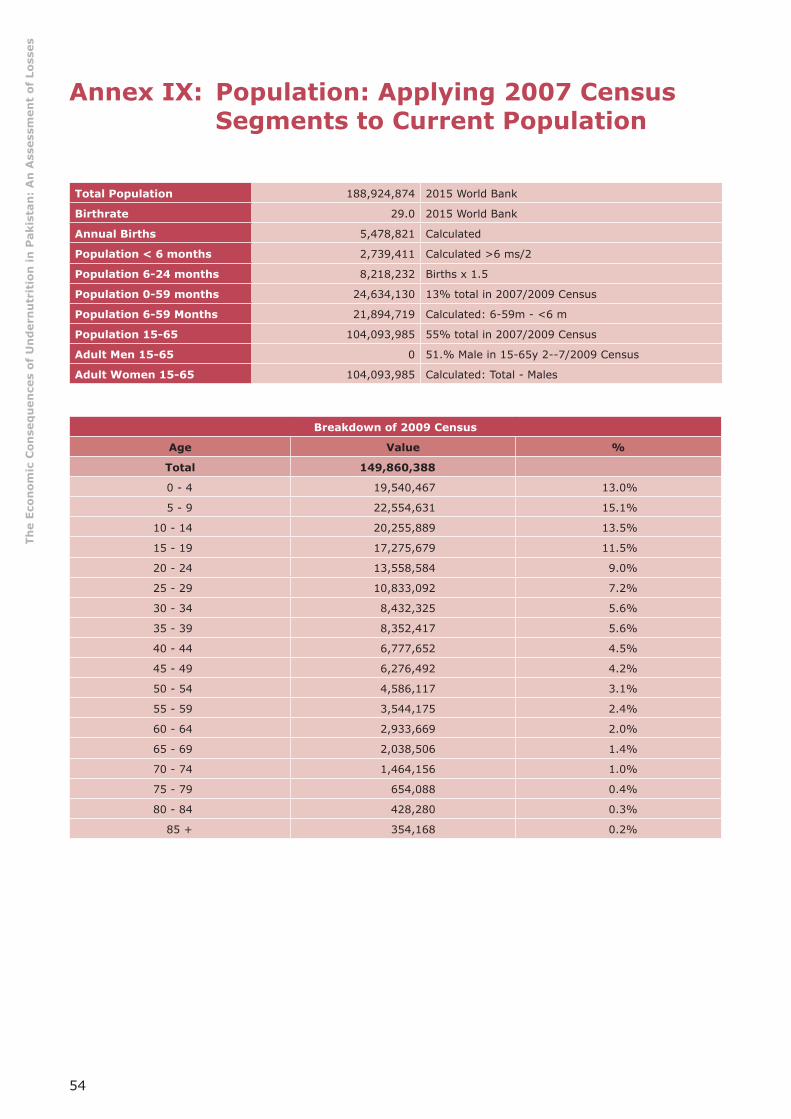
54
The
Econ
omic
Con
seq
uen
ces
of U
nd
ern
utr
itio
n in
Pak
ista
n:
An
Ass
essm
ent
of L
osse
s
Annex IX: Population: Applying 2007 Census Segments to Current Population
Total Population 188,924,874 2015 World Bank
Birthrate 29.0 2015 World Bank
Annual Births 5,478,821 Calculated
Population < 6 months 2,739,411 Calculated >6 ms/2
Population 6-24 months 8,218,232 Births x 1.5
Population 0-59 months 24,634,130 13% total in 2007/2009 Census
Population 6-59 Months 21,894,719 Calculated: 6-59m - <6 m
Population 15-65 104,093,985 55% total in 2007/2009 Census
Adult Men 15-65 0 51.% Male in 15-65y 2--7/2009 Census
Adult Women 15-65 104,093,985 Calculated: Total - Males
Breakdown of 2009 Census
Age Value %
Total 149,860,388
0 - 4 19,540,467 13.0%
5 - 9 22,554,631 15.1%
10 - 14 20,255,889 13.5%
15 - 19 17,275,679 11.5%
20 - 24 13,558,584 9.0%
25 - 29 10,833,092 7.2%
30 - 34 8,432,325 5.6%
35 - 39 8,352,417 5.6%
40 - 44 6,777,652 4.5%
45 - 49 6,276,492 4.2%
50 - 54 4,586,117 3.1%
55 - 59 3,544,175 2.4%
60 - 64 2,933,669 2.0%
65 - 69 2,038,506 1.4%
70 - 74 1,464,156 1.0%
75 - 79 654,088 0.4%
80 - 84 428,280 0.3%
85 + 354,168 0.2%


56