the development of the share of agriculture in gdp and ... · grounds, as well some diversity. two...
TRANSCRIPT

The development of the share of agriculture in GDP and employment
A case study of China, Indonesia, the Netherlands and the United States
Annemarie van Arendonk
May 2015

The development of the share of agriculture in GDP and employment
A case study of China, Indonesia, the Netherlands and the United States
Annemarie van Arendonk

i
Acknowledgements
This Master thesis Agricultural Economics and Rural Policy has been written and submitted in partial
fulfilment of the degree of Master of Science in Management Economics and Consumer Studies at
Wageningen University, the Netherlands.
I am very grateful for the support of my supervisors Dr. Ir. J.H.M. Peerlings and Prof. Dr. T. Herzfeld.
I thank Prof. Dr. Herzfeld for the opportunity to work at IAMO, the Leibniz Institute of Agricultural
Development in Transition Economies, and for his always optimistic attitude and positive view. I
thank Dr. Ir. J.H.M. Peerlings for all the effort made and his critical comments, it really helped me
forward to finalise my thesis. I also want to thank my parents, for always stimulating and supporting
me.

ii
Abstract
The position of agriculture within the economy seems more important in developing countries and
less important in developed countries. This research focuses on the development of the share of
agriculture in GDP and total employment in both developing countries as developed countries.
Indonesia, China, the Netherlands and the United States will be the case studies. The paper first
presents some general theories about the development of agriculture and then presents the
theoretical method and data extracted from National Input and Output Tables. The data cover the
period between 1995 and 2010. Several explanatory factors for the development over time of the
shares are taken into account. Results are compared between the countries and over time. Changes
have been linked to the different stages of economic development. The factor with the highest
impact on the development of agriculture is the increase in agricultural productivity.
Key words: Agriculture, Development, GDP, Employment, Indonesia, China, The Netherlands, the
United States.

iii
Content
Acknowledgements .................................................................................................................................. i
Abstract ....................................................................................................................................................ii
Content .................................................................................................................................................... iii
1. Introduction ........................................................................................................................................ 1
2. Literature overview ............................................................................................................................ 2
2.1 The role of agriculture in economic development: a review of the theory ................................. 2
2.2 Development of the share of agriculture in GDP and employment ............................................. 6
2.3 Historical setting countries ........................................................................................................... 8
3. Theoretical model ............................................................................................................................. 12
3.1 Share of agriculture in GDP ........................................................................................................ 12
3.2 Share of agriculture in employment ........................................................................................... 14
4. Data .................................................................................................................................................. 16
4.1 Data from the National Input Output Tables ............................................................................. 16
4.2 Data from Socio Economic Accounts .......................................................................................... 17
5. Results .............................................................................................................................................. 19
5.1 Share of agriculture in GDP ........................................................................................................ 19
5.2 Share of agriculture in employment ........................................................................................... 23
6. Discussion and Conclusion................................................................................................................ 26
6.1 Discussion ................................................................................................................................... 26
6.2 Conclusion .................................................................................................................................. 27
References ............................................................................................................................................. 30

1
1. Introduction
As economic development proceeds, the share of agriculture in GDP and total employment changes
being high but declining in developing countries, and low but more stable in developed countries.
The position of agriculture within the economy seems more important in developing countries and
less important in developed countries. This thesis will analyse this issue and illustrates this with data
and comparisons between two developed and two developing countries.
Agriculture’s definitions and measurement are influenced by different factors including data, time
period and case studies. The development of the agricultural sector can and has been measured via
multiple primary measures like income, employment, sales, value added and economic multipliers.
This thesis has the general objective to analyse the development of the agricultural sector whereby
it focuses on agriculture as primary sector. Decomposing the share of agriculture in total GDP and
employment can help to identify the factors that determine these shares. The share of agriculture in
GDP and employment will be analysed over the time period of 1995-2010.
This thesis uses an approach that departs from country studies. Country studies have some common
grounds, as well some diversity. Two developing countries, China and Indonesia, and two developed
countries, the Netherlands and the United States, belong to the largest producing or trading
countries of agricultural commodities. These countries will be analysed and compared in the share of
agriculture in GDP and employment.
This leads to the following research questions:
1. How can the development of the share of agriculture in GDP and employment be explained?
2. What are the developments in the factors determining the share of agriculture in GDP and
employment for Indonesia, China, the Netherlands and the United States?
3. What explains the differences of the shares in GDP and employment for Indonesia, China, the
Netherlands and the United States?
As applied by Lains and Pinilla (2008), this thesis uses a comparative framework given by a common
set of formulas and concepts to which each country responds, and also by defining the appropriate
theoretical and historical setting. Chapter 2 presents the theoretical background about economic and
agricultural development. Also background and historical setting of countries are provided. Chapter 3
describes the theoretical model and explanatory variables used. Chapter 4 explains the National
Input Output Tables from which data is extracted. In chapter 5 is the presentation of the results.
From this a general discussion and conclusions about the development of the share of agriculture in
GDP and employment will be drawn in chapter 6.

2
2. Literature overview
This chapter presents an overview of the literature on how the development of the share of
agriculture in GDP and employment can be explained. The first section is about the role of agriculture
in economic development and highlights several theories. In the second section there is more focus
on the development of agriculture itself instead of the role of agriculture in economic development.
Section 2.3 gives a historical background of the countries researched to understand their historical
economic background and the present share of agriculture in total GDP and employment.
2.1 The role of agriculture in economic development: a review of the theory
Tsakok and Gardner (2007) raise the question what role the agricultural sector plays in economic
development. They noticed that there are two opposite views about the central role of agriculture in
the process of economic growth. On the one hand, agricultural development is essential for overall
economic transformation of a country. “The contribution of agriculture in food, raw materials, and
financial surplus (including foreign exchange) to invest is essential for the process of industrialization
in its early stages” (Johnston, 1970). On the other hand is the view that economies can invest to build
an industrial base and bypass the process of agricultural development. Two approaches, the linear-
stages theories and structural change models, focus on the role of agriculture in economic
development. Theorists within these approaches have discussed whether or not the agricultural
sector is contributing to economic development and differ on this point of view. Some of these
theories are discussed below:
Linear-stages theory
The linear-stages theory is a theory of economic development according to which a country passes
through sequential stages in achieving development. There are several growth stage theories:
Ruttan (1965) considers the introduction of manufacturing as the dynamic element in the
process of economic growth. He stated that progress in agriculture could only occur with domestic
industrial development because “(a) the increased demand for farm products from an expanding
non-farm sector and (b) the development of more efficient methods of production resulting from the
application of science and technology” (Ruttan, 1965).
The Fisher-Clark’s approach argued that by increases in output per worker in any sector and
not only the agricultural sector the transformation to economic growth is achieved, and second, by
the transfer of labour from sectors with low output per worker to sectors with higher output per
worker, economic growth is achieved (Ruttan, 1965).

3
Rostow (1960) is the only one which clearly specifies a role for the agricultural sector. The
primary industry may act as a leading sector in the transition from a traditional to a modern
economy. In his model he distinguishes five stages of economic growth and development:
1) traditional society, 2) pre-conditions for take-off, 3) take-off, 4) drive to maturity and 5) high mass
consumption. The primary sector, mainly subsistence agriculture, has a vast majority in the first two
stages and in the third stage it starts to decline (see figure 2.1). In the fourth and fifth stage
agriculture has a very small share in economics growth. According to Rostow (1960), agriculture is
playing a significant role in the first three stages of economic growth. The agricultural sector greatly
influences the industrial and economic backbone from which a country’s economic growth and
development can take off.
Figure 2.1: The share of the sectors in the development stages of economic growth (source: www.geographyalltheway.com, 2015)

4
In figure 2.2 the five different stages of economic growth are described. Over time economies
develops via the five stages to the final stage of ‘high mass production’ which represents a
supposedly fully developed economy. Stage I, traditional society, is characterised by subsistence
agriculture and the economy almost wholly depends on the primary sector. Stage II, preconditions
for take-off, is characterised by expansion of agricultural output based on labour-intensive and
capital-saving techniques. While in stage I there was mostly subsistence agriculture, it moved to a
more commercial agriculture in the second stage. The transition to the second stage is triggered by
external influence, interests or markets. From stage II there came a reliance on technological
innovations. Going to the third stage, the manufacturing sector expands and the ratio of secondary
versus primary sectors in the economy shifts quickly towards secondary. In stage III, take-off, still the
expansion of agricultural output is based on capital-intensive and labour-saving techniques. In the
third stage this expansion was related to a situation in which agriculture no longer has a large share
in the economy and the opportunity cost of labour has risen substantially (Johnston, 1970).
Increase in agricultural productivity is important in the transition process to the next stage. It
provides a mass market for the products of the emerging industrial sectors and generates the capital
investment for new leading sectors outside of agriculture (Johnston, 1970). Technology plays an
important role in this process. It provides in both the emergence of new leading sectors as in the
secular decline or elimination of older sectors, like the primary sector.
Structural change model
Structural-change models focus on the mechanism by which developing countries transform their
domestic economic structures. The economies transform from a heavy emphasis on traditional
Time
Development
Figure 2.2: The stages of economic growth (source: the Pennsylvania State University, 2014)

5
agriculture to a more industrially and service economy. Eventually the contribution to national
income by the agricultural sector is surpassed by the industry sector (Todaro and Smith, 2012). A key
implication of this model is that growth in agricultural productivity is central to development
(Timmer, 1988).
Lewis’ two-sector surplus model is a well-known example of the structural-change approach.
This model place emphasis on rapid industrial growth with an agricultural sector fuelling this
industrial expansion by means of its cheap food and surplus labour. Lewis focused on the role of
agriculture as labour reservoir for other sectors. Economic development is a growth process that
needs the re-allocation of production factors from a low-productivity primary sector to a
commercialized industrial sector with higher productivity and more returns (Lewis, 1954). Both
labour and savings have to be extracted from agriculture to satisfy labour demand and finance
capital investment in industry. This assumption explains “why industrial and agrarian revolutions
always go together and why economies in which agriculture is stagnant do not show industrial
development” (Lewis, 1954).
Lewis’ two-sector model is also known as the surplus labour model. Surplus labour is a form of
involuntary employment. Generally, it is widespread in overpopulated developing economies where
the agricultural sector still has a large share in GDP and employment. Around 25 percent of the
agrarian population is either totally or partially unemployed. For Rosenstein-Rodan (1943) a central
aim of industrialization was to create productive employment for the agrarian excess population.
According to Basu (2003) this is a major concern for most developing countries. It is an acute
inadequacy in the economy’s capacity to employ its labour force. He defines surplus labour as
follows: A sector is characterized by surplus labour if it is possible to remove a maximum fraction of
the labour force without causing any reduction in output, even when the amount of other factors is
not changed. A decline in the number of workers will result in output rising or remaining constant.
One predominant explanation for the existence of surplus labour used to be that in developing
countries, marginal productivity of labour is zero over certain ranges. As a result, the withdrawal of
part of the labour force has no effect on the output. However, Sen (1966), disputed this predominant
view (Basu, 2003). He argues that this is not a necessary assumption for the existence of surplus
labour. Surplus labour only implies that a number of workers can move out without reducing output,
but this does not require that the marginal product of labour has to be zero. There are several
circumstances under which labour surplus exist. A flat section in the marginal rate of indifferent
substitution between income and work in the relevant region is a sufficient assumption. Closely
related to this point is the observation that the assumption of surplus labour does not conflict with
an equilibrium at a positive marginal product of labour, where labour is being measured in terms of
hours of work, rather than in terms of number of persons (Sen, 1966). At equilibrium the marginal
product of labour should equal the “real labour cost”, and its schedule should be flat, but not
necessary equal to zero. He also argues that “the existence of surplus labour is consistent with a
production function with any degree of substitutability between labour time and other factors”.
So there are many different stories and theories concerning the role of agriculture. The dichotomized
positions regarding the role of agriculture have been reflected in several literature reviews. However,
endogenous growth theories contribute little to the understanding of the role of agriculture in
economic change (Stern, 1996).

6
2.2 Development of the share of agriculture in GDP and employment
Whereby in the previous section the focus is on the role of agriculture in economic development the
question here is how the agricultural sector develops over time. While the theories differ about the
role of agriculture, they agree that over time the importance of agriculture is expected to decline as
economic development advances The process whereby employment and output is increasing for by
sectors other than agriculture is defined as ‘structural transformation’. Although there is an absolute
increase in the agriculture and food system, relatively the economy become less agriculturally
oriented. The reasons for the sectoral decline of agriculture and substantial expansion of the
secondary and tertiary sector have not been fully elucidated. Johnston and Meller (1961) recognize
two basic factors as responsible for the structural transformation of an economy, and so the decline
of the agricultural sector: “(1) an income elasticity of demand for food that is less than one and
declining, and (2) the possibility of a substantial expansion of agricultural production with a constant
or declining farm labour force”.
Martin and Warr (1990) explain that as economic growth proceeds, agriculture declines in economic
importance relative to manufacturing and services. They connect this to the phenomena that at any
stage of this growth process, resources frequently appear to be less productive in agriculture than in
industry. According to Martin and Warr (1990) higher economic returns to mobile factors of
production in industry than in agriculture provide the economic incentive for their movement out of
agriculture during the growth process, which explains the secular decline of agriculture. They add a
number of economic forces contributing to agriculture’s relative decline. They have included: (i)
effects on the demand for food relative to other goods coming from the changes in income and
population levels, and the resulting effects on relative commodity prices via these demand shifts; (ii)
differences in the rates of technical change between sectors; (iii) the resulting effects of changes in
aggregate supplies of capital and labour in the economy on industry structure; and (iv) the
implications that adjustment costs and other impediments to factor movements have for the rates at
which resource allocation will respond to the above determinants of agriculture's share (Martin and
Warr, 1990).
Technological innovations and institutional innovations are the expected structural changes within
the agricultural sector overcoming decline. Commercial agriculture has readily accepted
technological innovations like new chemicals, new hybrids, new tillage practices, new feeding
regimes and mechanization. New or different ways of doing business and institutional innovations
have met with more resistance, effected probably by changing relationships and often substitute
interdependence for independence in the decision-making process. But the economic benefits of the
combined technological and institutional innovators will likely result in a fast transition to an
industrial model of production and distribution of the agricultural sector.
Countries are going through different stages of agricultural transformation. The World Bank Group
(2014) developed a country classification based on the role of agriculture in GDP and employment.
This country segmentation has the following five different stages and associated characteristics:
1) Agriculture-based countries: Agriculture employs more than 50% of the total
economically active population, and agriculture value added is more than 25% of GDP.

7
2) Pre-transition countries: Still, agriculture employs more than 50% of the total
economically active population. The contribution of agriculture value added to the
GDP decreases to less than 25%, but more than 10%.
3) Transition countries: There is a decline in agricultural employment, this is now
between 25% and 50%. Agriculture value added still contributes between 10% to 25%
to the GDP.
4) Urbanizing countries: Agricultural employment declines to between 10% and 25% of
the total workforce. Agriculture value added as percent of GDP remains unchanged.
5) Developed countries: Agriculture employs less than 10% of total employment and the
contribution of agriculture to GDP drops to less than 10%.
In figure 2.3 the transition of the role of agriculture in GDP and employment is presented. Over time
the development of this role in a country goes from agriculture-based through three different stages
to the final stage of developed country. The country segmentation demonstrates a pattern that as
countries become less agriculture-based, the relative importance of agricultural GDP decreases and
there is a reduction in agricultural employment. There is a continuing decline in the size of the
primary agriculture sector’s GDP and employment. Countries are at different points of agricultural
transformation. Countries are at different points of agricultural transformation. In the last stage of
developed countries, there are differences in recent developed countries and older developed
countries.
Figure 2.3: Country segmentation based on agriculture's role in the national economy (source: World Bank Group, 2015)
The continuing decline of agriculture has been related to the fact that certain activities have been
transferred to the non-farm sector, such as cheese making. Besides this transformation, farm inputs
formerly produced on the farm have been replaced by off-farm inputs produced by the industrial
sector (Johnston, 1970). The aggregated definition of this is agribusiness. Agribusiness is the
combination of all the inputs and outputs of agriculture. Combined, they represent much bigger
shares of the economy than just only the primary sector (Pryor and Holt, 1999).

8
The World Bank Group (2014) provides an example to demonstrate this: In an agriculture-based
economy, for every dollar generated in the primary sector, another 56 cents of value is added in the
agribusiness sector. In countries in the pre-transition stage, the value-added in the off-farm sector
increases to 87 cents. Particularly the input and output sector is meant by the off-farm sector. In the
transition stage the value added even doubled to about 1.06 dollars. In the final stage of developed
country, another 1,90 dollar of value is added in the agribusiness sector. The increase in value added
may indicate that the relative importance of the agribusiness GDP grows along the transformation
process (see figure 2.4).
Figure 2.4: Agriculture and agribusiness value added share of GDP and the ratio between them. (source: World Bank Group, 2015)
2.3 Historical setting countries
The role of agriculture in a country’s economy is in many instances an aggregation of different
developments within each country. It is necessary to take into account the experience of individual
countries for several reasons (Lains and Pinilla, 2008):
- Most relevant advances concerning the knowledge of major changes in agricultural
production and productivity have been made at the national level.
- Quantitative and qualitative information on output and productivity growth is mostly
produced at the national level or in some cases, at the regional level.
- Countries’ economies are to a large extent affected by institutional developments and
economic policies, which were also defined nationally.
This thesis uses an approach that departs from country studies, and because a more general history
is needed, national histories are set within a context that allows generalisations. Country studies
have some common grounds, as well some diversity. As applied by Lains and Pinilla (2009), this thesis
uses a comparative framework given by a common set of formulas and concepts to which each
country responds, and also by defining the appropriate historical and theoretical setting.
The historical setting can be defined by two major events of economic history which are
interconnected and related to what happened in agriculture. The first is the industrialisation of the

9
economies in the Netherlands and the United States and the associated decline in the importance of
the agricultural sector.
A series of factors related to the domestic characteristics of the national economies and to the
intensity of economic relations determine the spread and speed of industrialisation. The countries
where agriculture had attained higher levels of efficiency were the earlier industrial starters.
In some regions, as in the Netherlands, agricultural efficiency remained comparatively high and the
Netherlands managed to attain high rates of growth of GDP and labour productivity keeping
resources in the agricultural sector, where important structural changes were taking place, favouring
agricultural sectors with higher income elasticities and also with higher levels of factor productivity
(Lains and Pinilla, 2008). The Netherlands is a small urbanised country specialised in agricultural
production. Agricultural income was relatively high until 1870, when agricultural prices showed rising
trends. The agricultural prices deteriorated from the 1870s onwards and the farmers had to devise
strategies to accommodate these negative relative price movements. Due to institutional changes
economies of scale in the agricultural cooperatives were created. Hereby the farmers were able to
continue their activities on a small-scale basis, while reaping the benefits of working together with
other famers in selling their products and buying inputs. These cooperatives enhanced the
dissemination of knowledge. This technological diffusion was instrumental in raising the yields of
many arable crops and the ‘second’ answer to the deteriorating agricultural prices (Smits, 2008).
Around 1930s experiments were done in the field of mechanisation and the Dutch government
introduced a system of guaranteed prices. Here the roots can be found for the spectacular
productivity growth and enormous increases in agricultural output (Smits, 2008). The Netherlands
developed comparative advantages in agriculture and managed to climb the product chain exploring
opportunities in transforming agricultural products. So structural change can also occur within the
agricultural sector, by shifts in labour and capital from products with lower to higher levels of factor
productivity, such has happened in the Netherlands (Lains and Pinilla, 2008).
The United States is major exporter of agricultural products. Since the 1870s it has dominated the
world market for agricultural products (van der Meer and Yamada, 1990). It was then already self-
sufficient and created ever-increasing surpluses. Paralleling that in manufacturing, the revolution in
agriculture involved a shift from hand labour to mechanization, and from traditional to commercial
agriculture. The number of farms in the United States tripled between 1860 and 1910, while the area
farmed more than doubled to 352 million hectares (Dunbar, 1967). Several factors accounted for this
extraordinary achievement, like science and the application of machinery to farming which
developed in rapid succession. Relying upon the American standard of agricultural productivity,
Dunbar (1967) describes a phenomenon of commercialisation. Over time the United States gradually
shifted from subsistence agriculture to commercial agriculture, with an accompanying increase in
productivity, also referred to as the Agricultural Revolution. Subsistence farming amended via
provided opportunities like efficient land management, distributed ownership and advanced
technologies and shifted towards a commercial viable enterprise. Catalysed by an industrial
revolution, scale and technology allowed for improved tillage productivity, rapidly accelerating the
output of agricultural production, and gradually resulting in the politicisation of the farming
community, to protect the interests of farmers.

10
Since the entrance of the first Agricultural Adjustment Act (AAA) in 1933, two key features of
commodity programs, commodity specificity and focus on income support, have remained constant
(Dimitri, 2005). Around 1950s the rising productivity led to growing surpluses even as the number of
farms and agricultural production continued to decline as share of economic activity. The decrease in
agriculture’s share of GDP was not the result of a decreasing primary sector. Indeed, agriculture
value-added increased fast over the period but the U.S. economy increased even faster. As
agriculture declined as a share of the economy and became agricultural productivity increased,
labour was released from the sector, helping to fuel growth elsewhere in the economy (Alston,
2010).
The second major event is the Green Revolution. The view that agriculture plays only a passive role in
development was eliminated by the dynamism of the Green Revolution in Asia during the late 1960s
and early 1970s. “The transformation of traditional agriculture into a modern sector revealed the
potential of agriculture as a growth sector” (Diao et al, 2007). The Green Revolution contributed to
large increases in agricultural productivity. “Countries experiencing increases in agricultural
productivity are able to release labour from agriculture into other sectors of the economy” (Gollin et
al, 2002). “The opportunity of transforming traditional agriculture into a modern sector shows
agriculture’s capability as a growth sector and its effective role in emphasizing broader development”
(Adelman, 2001). China and Indonesia are examples of middle-income developing countries where
the process of structural change has been proceeding rapidly.
Prior to the Green Revolution, China’s agricultural growth was slow. Despite emphasis on self-
sufficiency, the population grew faster than grain production and agricultural output. Agricultural
output increased by over 61% between 1978 and 1984. Mostly systemic changes like household
responsibility via decollectivization is found to improve total factor productivity. However, this
accelerated growth in agricultural output can also be linked to the increased prices of agricultural
outputs and the increased use of inputs such as chemical fertilizers at the same time (McMillan,
1989). China adopted “hybridization breeding technology” to produce different varieties of rice.
Subsequently with government support and steadily increasing its investments since the 1980s for
further research and development, China is the first country in the world to produce hybrid varieties
on an industrial scale, and it contributes almost one third of the world’s rice production (Shen, 2009).
In China, the agricultural sector is still the sector with the highest employment rate.
In the 1950s and 1960s Indonesia’s growth rate of agricultural production was the slowest of any
major Asian country and many countries in Latin America and Africa. During and after the Green
Revolution, there was an acceleration in Indonesia’s agricultural output in the 1970s and 1980s. By
then, the per capita cereal production was the second highest in Asia (Booth, 1989). The acceleration
in Indonesia’s agricultural output was partly caused by the new seed-fertiliser food grain
technologies introduced in the 1970s. The growth in agricultural sector didn’t mean an increase in
the agricultural share of GDP. Other sectors grow faster, so the share of agriculture in GDP fell from
45% in 1970 to 17% in 1995. Nevertheless, more than 60% of the population continued to live in rural
areas in 1998 and is the agricultural sector still the main source of employment for around 40% of
the labour force. Around the 1970s, the Indonesian government focused on the growth of the
agricultural sector and intervened in the pricing of commodities, in the provision of inputs and trade.
The Mass Guidance Program (BIMAS) is one of the most important examples of Indonesia’s

11
agricultural policy (Pray, 1985). The program is meant for rice production which is by far the most
important commodity in Indonesia. It occupies more than half of total agricultural land. Via the
BIMAS program, subsidized inputs were supplied to rice farmers and products were purchased at
guaranteed prices. Around the 1980s and 1990s there has been some liberalization in agricultural
policy. Restrictions on trade and prices for corn and soybeans have been removed, and subsidies on
pesticides and fertilizers were eliminated in respectively 1980s and 1998 (Fuglie, 2003). Around the
1990s, the Indonesian encouraged the private sector to invest in agricultural research and technology
transfers.

12
3. Theoretical model
This chapter discusses how the share of agriculture in GDP and employment develops over time and
what their determinants are. Section 3.1 discusses the factors defining the share of agriculture in
GDP. Section 3.2 examines the factors explaining the share of agriculture in employment.
3.1 Share of agriculture in GDP
Gollin (2002) shows that changes affecting agriculture may have aggregate effects on
macroeconomic activity (see also chapter 2). Therefore, it is important to understand the role and
development of agriculture in economic growth. In order to do so we decompose the share of
agriculture in GDP in a number of explanatory factors. In figure 3.1 the development of agriculture’s
share in GDP is showed for the Netherlands, the United States, China and Indonesia for the period
1989-2011.
Figure 3.1: Development over time; agriculture share in GDP (source: World Bank Data, 2015)
As economic development proceeds, agriculture declines as a proportion of GDP. This accounts for all
four countries presented in figure 3.1. In Indonesia and China the share of agriculture declines
quickly in the period 1989-2011 whereas in the Netherlands and the United States the decline is slow
in the period 1989-2011. For a series of years the share remains even constant at a low level.
The share of agriculture in GDP can be decomposed as follows:
𝐺𝑉𝐴𝑎𝑔𝑟𝑖𝑐𝑢𝑙𝑡𝑢𝑟𝑒
𝐺𝐷𝑃=
𝐺𝑉𝐴𝑎𝑔𝑟𝑖𝑐𝑢𝑙𝑡𝑢𝑟𝑒
𝑌𝑎𝑔𝑟𝑖𝑐𝑢𝑙𝑡𝑢𝑟𝑒∗𝑌𝑎𝑔𝑟𝑖𝑐𝑢𝑙𝑡𝑢𝑟𝑒
𝑌𝑓𝑜𝑜𝑑∗𝑌𝑓𝑜𝑜𝑑
𝐶𝑓𝑜𝑜𝑑∗𝐶𝑓𝑜𝑜𝑑
𝐶𝑡𝑜𝑡𝑎𝑙∗𝐶𝑡𝑜𝑡𝑎𝑙
𝐺𝐷𝑃 (3.1)
a b c d e
where:
GVA: gross value added; GDP: gross domestic product; Y: production; C: consumption of final
products; total: total economy (Gardebroek and Peerlings, 2013).
The factors defining the ratios give insight in the development of the contribution of agriculture to
GDP. Next the different ratios and their expected development over time is discussed.

13
a) The ratio of net value added and production in agriculture
Expected is that over time in all four countries the agricultural production will increase and the GVA
of agriculture will relatively decrease. Agricultural productivity is ‘a measure of the efficiency with
which inputs are used to produce an output’ (Matsuyama, 1984). Agricultural production will
increase due to innovations and knowledge in technology and science. In combination with
differentiation and specialisation growth of agricultural production will even accelerate. When the
production process is divided vertically (differentiation), the several production processes are not
brought together within one firm but divided over several companies. The special knowhow is
aggregated per company and economies of scale is reached via specialisation and differentiation, and
reduces the input costs. The increase of productivity implies that the same quantity of output can be
produced with less inputs. It is expected that the demand for agricultural products will not grow as
fast as the production of agricultural products. The oversupply of agricultural products will lead to a
decrease of prices, which will lead to a lower ratio of net value added and agricultural production.
b) The ratio between agricultural and food production
Food products are mainly processed agricultural products, and several ingredients are added which
request more goods and services. The expectation is that consumers in a developed country have
more preference for processed products than consumers in developing countries, where is more
demand for the primary products. This makes that this ratio will go down with economic growth.
c) Self-sufficiency of food products
On the one hand it is expected is that self-sufficiency of food products will be lower in developing
countries than in developed countries. Developed countries have more available resources and
capital to e.g. import missing food ingredients and to adapt new technologies for a higher agricultural
productivity. This improves the ability to produce (more) food which will contributes to a higher
degree of self-sufficiency of food products. This is possibly stimulated by protective agricultural
policies. On the other hand developing countries are often less integrated in the global economy and
this can lead to a higher level of self-sufficiency. However, the comparative advantage in producing
food products depends on a country’s factor endowments and natural conditions. So, differences
between countries can be expected.
d) Share of food in total consumption
Low-income countries like Indonesia and China have a large share of income spend on food products.
When income increases also the absolute share of income spent on food will increase but the relative
proportion of income spent on food will decrease, as indicated by Engel‘s Law. Therefore it is
expected that this ratio will decline over time. A relative stronger decline is expected in Indonesia
and China because they will have a stronger increase in income than in developed countries as in the
Netherlands and the United States (based on the country’s GDP growth). This makes that this ratio
will go down with economic growth and lowers the share of agriculture in GDP.
e) Share of consumer expenditure in GDP
How the share of consumer expenditure in GDP develops is influenced by the size and growth of GDP
and its composition. It is expected that the increase in GDP leads to a relative increase in total
consumer expenditure (Barro, 2007).
14
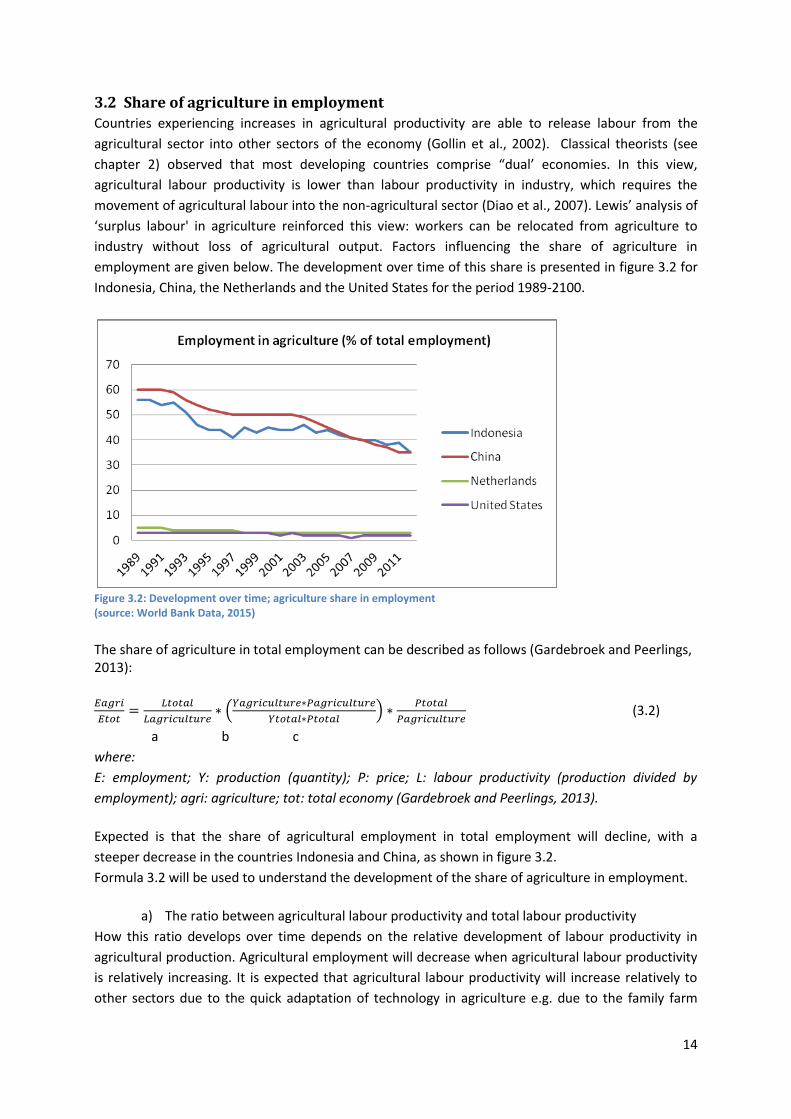
3.2 Share of agriculture in employment
Countries experiencing increases in agricultural productivity are able to release labour from the
agricultural sector into other sectors of the economy (Gollin et al., 2002). Classical theorists (see
chapter 2) observed that most developing countries comprise “dual’ economies. In this view,
agricultural labour productivity is lower than labour productivity in industry, which requires the
movement of agricultural labour into the non-agricultural sector (Diao et al., 2007). Lewis’ analysis of
‘surplus labour' in agriculture reinforced this view: workers can be relocated from agriculture to
industry without loss of agricultural output. Factors influencing the share of agriculture in
employment are given below. The development over time of this share is presented in figure 3.2 for
Indonesia, China, the Netherlands and the United States for the period 1989-2100.
Figure 3.2: Development over time; agriculture share in employment (source: World Bank Data, 2015)
The share of agriculture in total employment can be described as follows (Gardebroek and Peerlings, 2013): 𝐸𝑎𝑔𝑟𝑖
𝐸𝑡𝑜𝑡=
𝐿𝑡𝑜𝑡𝑎𝑙
𝐿𝑎𝑔𝑟𝑖𝑐𝑢𝑙𝑡𝑢𝑟𝑒∗ (
𝑌𝑎𝑔𝑟𝑖𝑐𝑢𝑙𝑡𝑢𝑟𝑒∗𝑃𝑎𝑔𝑟𝑖𝑐𝑢𝑙𝑡𝑢𝑟𝑒
𝑌𝑡𝑜𝑡𝑎𝑙∗𝑃𝑡𝑜𝑡𝑎𝑙) ∗
𝑃𝑡𝑜𝑡𝑎𝑙
𝑃𝑎𝑔𝑟𝑖𝑐𝑢𝑙𝑡𝑢𝑟𝑒 (3.2)
a b c
where:
E: employment; Y: production (quantity); P: price; L: labour productivity (production divided by
employment); agri: agriculture; tot: total economy (Gardebroek and Peerlings, 2013).
Expected is that the share of agricultural employment in total employment will decline, with a
steeper decrease in the countries Indonesia and China, as shown in figure 3.2.
Formula 3.2 will be used to understand the development of the share of agriculture in employment.
a) The ratio between agricultural labour productivity and total labour productivity
How this ratio develops over time depends on the relative development of labour productivity in
agricultural production. Agricultural employment will decrease when agricultural labour productivity
is relatively increasing. It is expected that agricultural labour productivity will increase relatively to
other sectors due to the quick adaptation of technology in agriculture e.g. due to the family farm

15
structure and availability of technology due to R&D by governments and input delivering and
processing companies. Adaption of new technologies is expected to be higher in developed countries
e.g. due to credit availability and higher income levels in developed countries. This will lower the
share of agriculture in total employment.
b) Share of value of agricultural production in total value of production
An higher agricultural labour productivity will lead to a relative strong growth in production which
contribute to lower food prices. The effect on the value of production is not clear in advance. In a
growing economy it is to be expected that total production grows faster than food production e.g.
due to Engel’s Law. This will lower the share of agriculture in total employment.
c) The ratio of total prices and agricultural prices
It is expected that the demand for agricultural products will not grow as fast as the production of
agricultural products. The oversupply of agricultural products will lead to a decrease of prices, which
will lead to a lower share of agricultural prices in total prices. This will increase the share of
agriculture in total employment.

16
4. Data
This chapter presents the data and explains the National Input Output Table’s composition. In section
4.1 the data and National Input Output Table used to analyse the role of agriculture in GDP is
discussed and in section 4.2 the data for the share of agricultural employment.
4.1 Data from the National Input Output Tables
The data is extracted from the World Input Output Database (WIOD). In this database National Input
Output (IO) tables are collected covering the period from 1995 to 2011. Data used for analysis cover
the period between 1995 and 2010. The IO table is of the industry by industry type, divided in
industry rows and columns, in current prices (millions of US$). The use of products are indicated in
the rows in the upper part, being for intermediate or final use. Intermediate use includes each
product that can be an intermediate input in the production of other products. Final demand consists
of domestic use (private or government consumption and investment) and exports (Timmer et al.,
2015). The total use of each product is the row total. Information on the supply of each product are
indicated in the industry columns. The column indicates the values of all capital, labour and
intermediate inputs used in production. A product can be imported or domestically produced.
Domestic output plus imports indicates total supply of the product in the economy. Total output of a
domestic industry is equal to the use of inputs by that industry such that all flows in the economic
system are accounted for (Timmer, 2012). In figure 4.1 a schematic outline for a national input-
output table is presented.
Figure 4.2: Schematic outline of a national Input-Output (IO) table (source: Timmer et al, 2012).
a) The ratio of gross value added and production in agriculture
The value of gross value added of agriculture (GVAagriculture) can be found in the intersection of the
‘Value Added’ row and the ‘agriculture-industry’ in the industry-by-industry section. Data of the
production of the agriculture-industry is extracted from the ‘Total Output’ section.
b) The ratio between agricultural and food production
Data of the agricultural production is extracted from the ‘Total Output’ of the agriculture industry
which represents the output at basic prices. Data of food production is presented by the ‘Total
Output’ of the food, beverages and tobacco sector which also represents the output at basic prices.
c) Self-sufficiency of food products
Self-sufficiency is the ratio of food production and consumption of food. Consumption of food
represents the direct consumption by households of both agriculture and food products, plus the

17
consumption of imported agriculture and food products. The direct consumption by households is a
sub-column in the ‘Domestic Final Use’ column.
d) Share of food in total consumption
Total consumption is the sum of the final consumption expenditures of all industries by domestic
households
e) Share of consumer expenditure in GDP
GDP represents all the industries available in value added at basic prices in the Input-Output table.
4.2 Data from Socio Economic Accounts
There is an extension on the National Input-Output table available on labour and capital inputs. The
Socio Economic Accounts contains industry-level data on employment, capital stocks, gross output
and value added at current prices. Value added is broken down into the compensation for the
production factors labour and capital (Timmer et al., 2015). To calculate labour productivity the gross
output by industry at current basic prices is divided by total hours worked by persons engaged. For
the food and agricultural sector, among 33 other industries, the socio-economic accounts contain
data on detailed labour and capital inputs like hours worked and income. Because data is not
completely available for 2010, the data cover the period between 1995 and 2009. In figure 4.2 there
is a schematic outline of how the labour and capital inputs are composed.
Figure 4.2: Schematic outline of extended National Supply-Use table (source: Timmer et al, 2012)
The section ‘Labour by type’ is divided in three different categories: values, prices and volumes. From
these three categories data is extracted to determine the share of agriculture in employment.
a) The ratio between agricultural labour productivity and total labour productivity
Labour productivity is production divided by employment. Production is calculated as the gross
output by industry at current basic prices. The employment is indicated by the total hours worked by
persons engaged.

18
b) Share of value of agricultural production in total value of production
The total value of production is calculated by total (or agricultural) production times total (or
agricultural) prices. Prices are in price levels of gross output and presented in indexes whereby
1995=100.
c) The ratio of total prices and agricultural prices
As stated in b), prices are in price levels of gross output and presented in indexes whereby 1995=100.

19
5. Results
This chapter presents the results where the results have been extracted from the data of National
Input Output Tables. In paragraph 5.1 results for the share of agriculture in GDP are discussed and in
paragraph 5.2 the results for the share of agriculture in total employment.
5.1 Share of agriculture in GDP
a) The ratio of gross value added as percentage of agricultural production
Table 5.1: Gross value added as percentage of agricultural production
Indonesia China Netherlands U.S.
1995 82.1 61.5 46.3 38.7 2000 77.5 58.8 43.8 39.4 2005 76.9 58.4 40.2 42.6 2010 76.9 58.6 36.6 42.4
Source: own calculations
The ratio of gross value added (GVA) and agricultural production in the Netherlands and the United
States is smaller than in Indonesia and China. The ratios in the Netherlands and the United States are
close to each other, also during the years, and is on average around 40. There is a difference in how
high this ratio is in Indonesia and China, respectively 82.1 and 61.5 in 1995 to 76.9 and 58.6 in 2010.
Even if the level of this ratio differs, there is a similar decrease over the years. Only in the United
States there is a small increase in this ratio while it was expected that there will be a lower ratio of
gross value added and agricultural production as is the case in the other three countries. In the
United States value added increases relative faster than agricultural production. Reasons for this
growth could be a shift to products with more value added or the farmers’ dependency on income
subsidies. Within the United States Department of Agriculture, the agency Commodity Credit
Corporation (CCC) buy agricultural products at the guaranteed “support price”. That keeps market
prices at or near the support price.
Over time the growth of GVA of agriculture accelerates in Indonesia and China but not that fast as
the growth of agricultural production, respectively with 336% and 508%. The relative slower increase
in GVA agriculture than in agricultural production causes the decrease in ratio in Indonesia, China
and the Netherlands. This can be explained by the fact that the demand for agricultural products will
not grow as fast as the production of agricultural products. As stated in 3.1, the oversupply of
agricultural products will lead to a decrease of prices, which will lead to a lower ratio of gross value
added and agricultural production.
Also there is an increase in the production of agriculture in the developed countries like the
Netherlands and the United States, respectively with 28% and 78%. The GVA agriculture increases
respectively with 2% and 95%. In the developing countries Indonesia and China there is a large
growth in the agricultural production. Over time the production increases with 358% in Indonesia
and it even increased by a factor of 6.3 in China. This could be the aftermath of the Green Revolution.
As expected there is an acceleration of the increase of agricultural production due to innovations and
knowledge in technology and science.

20
Since the GVA agriculture and production of agriculture are close together you could say that GVA
has a large share in production of agriculture in developing countries. The explanation for the
differences in ratios is that in Indonesia, and to a lesser extent in China, less intermediate inputs are
used probably due to the high costs of fertilisers and pesticides. On top they have a large use of
labour (see figure 3.2). Income from agricultural activity, i.e. the compensation of the factors of
production (capital and labour), can be estimated using agricultural GVA. Besides, in developing
countries there is more demand for primary products, and therefore, less pressure on value added.
b) The ratio between agricultural and food production
Agricultural products are the primary products direct off land. The difference with the food products
is that the products are available from cultivating raw materials without a manufacturing process.
Production of food goes through a value chain and passes different activities of added value till the
end consumer buys it. The definition of food production is thereby broad. Demand is increasing since
consumers prefer more and more processed products like ready-made meals. Several goods and
services are needed more in these increasingly processed products and contain less agricultural
products.
Table 5.2: Agricultural production as percentage of food production
Indonesia China Netherlands U.S.
1995 50.6 66.1 34.0 32.8 2000 49.2 63.8 33.3 30.5 2005 48.4 58.8 33.0 31.0 2010 49.2 52.3 31.7 31.5
Source: own calculations
As expected the ratio between agricultural and food production goes down. In Indonesia, the
Netherlands and the United States a similar relative decline is noticeable. In China there is a stronger
decrease visible. The ratios in the developed countries are almost equal, only between China and
Indonesia there is a bigger difference. In China the ratio is 66.1 in 1995 against 50.6 in Indonesia, but
in 2010 these ratios are almost similar, respectively 52.3 against 49.2.
There is a difference in the level of the ratios between the developing and developed countries.
The expectation was that consumers in a developed country have more preference for processed
products, which are the food products. This could explain the relative low ratios in the Netherlands
and the United States. There is more demand for food products than agricultural products, and the
demand for food products is increasing faster than for agricultural products which make the ratio go
down. This is also the case in the developing countries. The demand for food products rises faster
relative to the agricultural products. There is a change in the food pattern of Indonesia and China,
especially in the latter. This could be explained by the relative high increase of GVA agriculture which
makes it possible to buy other food products and not only consume own produced agricultural
products. China’s food production is likely to increase substantially for some time as incomes
continue rising, given that food production is closely related to income. The ratio implies a shift from
a more subsistence agricultural sector to commercial agriculture.
c) Self-sufficiency of food products
The term “food security” was used to describe whether a country had access to enough food.

21
“National food security” was used by some to mean self-sufficiency. It indicates whether a country
produces the food it needs or that which its population demands. Self-sufficiency could mean that all
citizens had access to enough food to meet energy and nutritional requirements or whether
economic demand meets the domestic production (Pinstrup-Andersen, 2009). Here, self-sufficiency
of food products is defined as domestic food and agricultural production divided by the domestic
consumption of food and agricultural products. Country’s possibilities to produce food, the relative
productivity of the food sector (in relation to other countries) and governmental policies determine
the degree of self-sufficiency of food. An higher degree of self-sufficiency of food products can be
reached when policies (national and international) stimulate agricultural production (Peerlings,
2013).
Table 5.3a: Production of food as percentage of consumption of food by private households
Indonesia China Netherlands U.S.
1995 216.7 226.4 366.5 236.1 2000 198.2 216.8 366.4 202.0 2005 191.0 282.2 352.1 204.7 2010 213.6 314.2 380.1 218.2
Source: own calculations
In the time period 1995-2010 there are fluctuations. Overall, in the United States and Indonesia there
is a small decrease in the ratio of self-sufficiency of food products, respectively 236.1 to 218.2 and
216.7 to 213.6. In China and the Netherlands there is an increase in this ratio, respectively from
226.4 to 314.2 and 366.5 to 380.1. Especially in the Netherlands the ratio of self-sufficiency is very
high. This could be explained as it is one of the largest exporting country of agricultural and food
products.
All four countries have remarkable high ratios of self-sufficiency of food products. This is because
only direct consumption by households has been taken into account, not the food and agricultural
products consumption by governments and other companies (like feed industry). In table 5.3b also
consumption by governments and companies have been taken into account. The domestic food
production is equal to the production used in table 5.3a and consumption is calculated as total
consumption of domestic and imported products, minus export.
Table 5.3b: Production of food as percentage of consumption of food by all sectors
Indonesia China Netherlands U.S.
1995 101.6 101.5 142.8 102.2
2000 100.6 100.4 148.0 99.2
2005 103.5 99.5 150.3 97.7
2010 104.5 98.5 150.6 99.6
Source : own calculations
It was expected on the one hand that in developing countries self-sufficiency of food products will be
lower than in developed countries because they have less available resources and capital, which
could be the case in China compared to the Netherlands, based on table 5.3b. On the other hand it
was expected that in developing countries self-sufficiency of food products will be higher than in
developed countries because they are less integrated in the global economy and this can lead to a
22
higher level of self-sufficiency, as is the case in Indonesia and the United States (based on the year
2010 in table 5.b. Both possible outcomes are represented in the ratios of the countries.
In China and United States the ratio of self-sufficiency is decreasing while you would expect it to
increase. This is because the consumption of food is higher than the domestic production of food.
In China the demand of food products increases faster than the production of food. Over time
imports of food products increase with 709% while export of food products stays rather constant.
This causes a high rate of consumption of food. The fast increase could be due to higher incomes and
a growing demand for processed goods. China became membership of the World Trade Organization
(WTO) in 2001. The opening of agricultural and food markets could have contributed to the growing
import of food products.
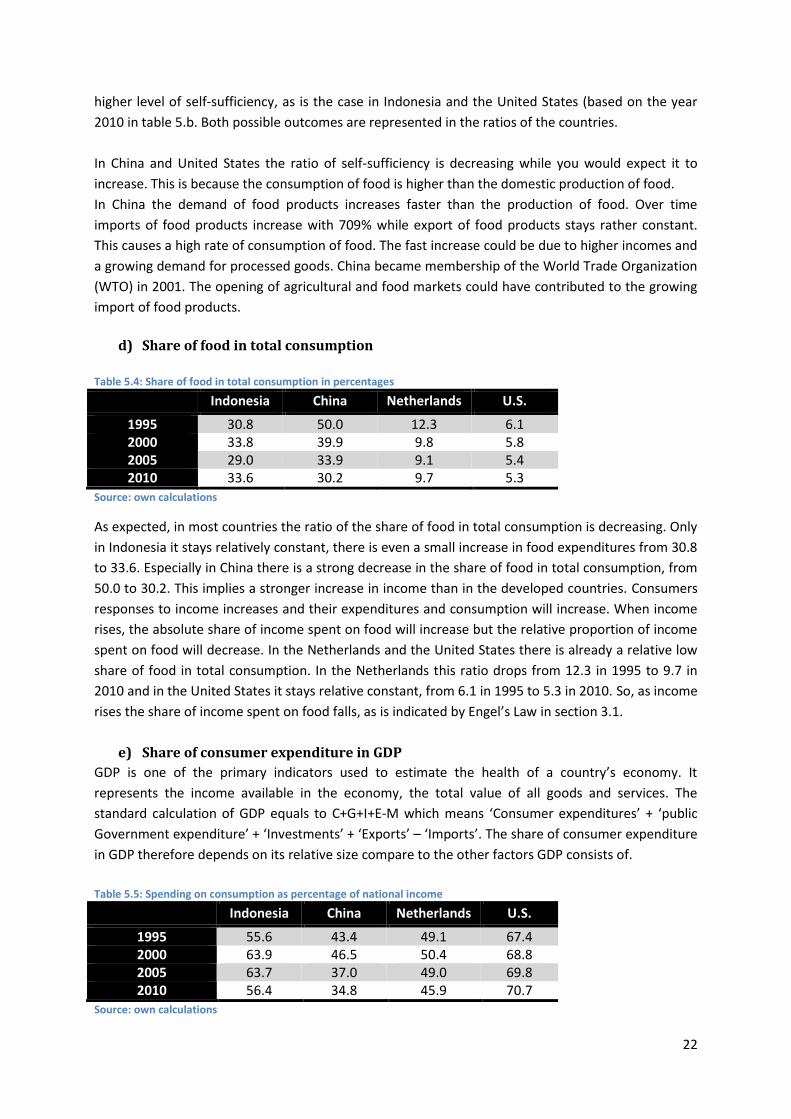
d) Share of food in total consumption
Table 5.4: Share of food in total consumption in percentages
Indonesia China Netherlands U.S.
1995 30.8 50.0 12.3 6.1 2000 33.8 39.9 9.8 5.8 2005 29.0 33.9 9.1 5.4 2010 33.6 30.2 9.7 5.3
Source: own calculations
As expected, in most countries the ratio of the share of food in total consumption is decreasing. Only
in Indonesia it stays relatively constant, there is even a small increase in food expenditures from 30.8
to 33.6. Especially in China there is a strong decrease in the share of food in total consumption, from
50.0 to 30.2. This implies a stronger increase in income than in the developed countries. Consumers
responses to income increases and their expenditures and consumption will increase. When income
rises, the absolute share of income spent on food will increase but the relative proportion of income
spent on food will decrease. In the Netherlands and the United States there is already a relative low
share of food in total consumption. In the Netherlands this ratio drops from 12.3 in 1995 to 9.7 in
2010 and in the United States it stays relative constant, from 6.1 in 1995 to 5.3 in 2010. So, as income
rises the share of income spent on food falls, as is indicated by Engel’s Law in section 3.1.
e) Share of consumer expenditure in GDP
GDP is one of the primary indicators used to estimate the health of a country’s economy. It
represents the income available in the economy, the total value of all goods and services. The
standard calculation of GDP equals to C+G+I+E-M which means ‘Consumer expenditures’ + ‘public
Government expenditure’ + ‘Investments’ + ‘Exports’ – ‘Imports’. The share of consumer expenditure
in GDP therefore depends on its relative size compare to the other factors GDP consists of.
Table 5.5: Spending on consumption as percentage of national income
Indonesia China Netherlands U.S.
1995 55.6 43.4 49.1 67.4 2000 63.9 46.5 50.4 68.8 2005 63.7 37.0 49.0 69.8 2010 56.4 34.8 45.9 70.7
Source: own calculations

23
Remarkable is the difference between the Netherlands and the United States and the high ratio in
the United States. There they spend around 70% of national income during the past 20 years. In
China they spend the least and it is still decreasing. Were the consumption expenditures 43.4% of
GDP in 1995, in 2010 it was 34.8%. In Indonesia there was a small increase in expenditures but
eventually are the expenditures in 2010 almost the same as in 1995, around 56%. In the Netherlands
there is a small decrease in the spending on consumption as per cent of national income, from 49.1%
to 45.9%.
The relative fast increase of export for Indonesia and the Netherlands and the relative fast increase
of consumption (due to increase in imports) in China are the factors which are most changing in their
GDP. This makes the ratio goes down. The high and fast increases in export and import is due to the
openness of the economy of a country. Trade is important for these countries.
For instance, since the Indonesian membership of the WTO in 1995, the amount of export of food
products accelerates. Probably because of the demand of tobacco, since Indonesia is the fifth largest
tobacco market in the world.
In the United States mostly the growth of the consumption factor is changing the ratio making it go
up. The consumption of final products in the United States grows relative faster than the growth of
GDP. This explains the increase in ratio. Disposable income is the main factor driving consumer
demand. The high ratio of the share of consumer expenditure in GDP implies that the population of
the United States has a relative high income and an high consumption pattern compared to the other
countries. Besides, the United States is a large country and there is by definition less trade.
Consumption is money what households are spending and roughly equals household income. The
relative low and decreasing ratios in the Netherlands and China could imply that the people in the
countries are savers, or that in that period the government expenditure or investments were
relatively high. Government can affect households level of disposable income by increasing or
decreasing taxes. By increasing taxes the disposable income will decrease which could lead to lower
consumption expenditure. The steep decrease of this ratio could be explained by the accelerated
growth of GDP in China, which increased tenfold over the period 1995-2010 in current US dollars.
(World Bank Data, 2015).
5.2 Share of agriculture in employment
a) The ratio between total labour productivity and agricultural labour productivity Table 5.6: The ratio between total labour productivity and agricultural labour productivity in percentages
Indonesia China Netherlands U.S.
1995 369.0 333.5 138.2 114.8
2000 394.6 412.1 175.7 149.2
2005 462.9 479.9 178.2 146.9
2009 488.7 519.2 171.1 136.7
Source: own calculations

24
In all countries there is an increase in the ratio between total labour productivity and agricultural
labour productivity. Especially in China there is a steep increase in this ratio, from 333.5 in 1995 to
519.2 in 2009. Since the ratio is higher than 100, in all countries the labour productivity is higher in
total economy than in the agricultural sector. Because the ratio is growing, you could conclude that
the labour productivity is increasing faster in total economy than in the agricultural sector. In
Indonesia and China there is a faster growth of labour productivity in total economy than in the
Netherlands and the United State. Therefore you could conclude that there are possibilities for a
more efficient way of producing in the agricultural sector in these developing countries. The labour
productivity in agriculture in developing countries is often relatively low.
The relatively low ratios in the United States and the Netherlands means there is a high labour
productivity in the agricultural sector.
It was expected that the agricultural labour productivity would grow faster than total labour
productivity. This is not the case. This could be due to the stage the country is in. Indonesia and China
are industrializing whereby you can expect a faster growth in total labour productivity. The relative
low and sometimes increasing and decreasing ratios of the Netherlands and United States is because
they are more tertiary economies, where the primary and secondary sector are highly efficient and
labour productivity is high.
b) Share of value of agricultural production in total value of production
Table 5.7: Share of value of agricultural production in total value of production in percentages
Indonesia China Netherlands U.S.
1995 16.4 12.5 3.6 1.8
2000 15.1 9.5 2.5 1.1
2005 12.2 7.3 2.0 1.1
2009 13.1 6.6 1.8 1.3
Source: own calculations
All countries represent a decrease in the ratio of share of value of agricultural production in total
value of production as expected, whereby China shows the strongest decline. In Indonesia and China
there is a stronger decline in this ratio (respectively 16.4 to 13.1 and 12.5 to 6.6) than in the
Netherlands and the United States (respectively 3.6 to 1.8 and 1.8 to 1.3) as can be expected as these
economies grow faster. The contribution of agriculture to total employment is decreasing when the
share of agriculture in the total value of production is decreasing.
c) The ratio of total prices and agricultural prices
Table 5.8: The ratio of total prices and agricultural prices in percentages
Indonesia China Netherlands U.S.
1995 100 100 100 100
2000 97.6 103.8 110.1 117
2005 97.5 98.1 121.1 115
2009 80.7 87.9 129.3 110.2
Source: own calculations

25
The ratio of total prices and agricultural prices is increasing in the Netherlands and the United States,
and declining in Indonesia and China. Taking 1995 as the basic year (100), in 2009 the ratio decreased
respectively to 80.7 and 87.9. The ratio in the Netherlands and the United States increases to
respectively 129.3 and 110.2.
Expected was a decrease of agricultural prices due to oversupply of these products and lower input
costs. The ratios in the Netherlands and the United States implies a smaller increase in agricultural
prices than the increase in total prices, the total prices increased faster. Only in the period 2005-2009
the agricultural prices increased relative fast compared to previous years, probably due the world
food price crisis in 2007-2008. In Indonesia and China the agricultural prices increases relative fast
compared to the total prices. It is expected for prices to come down again (OECD, 2008). Then it will
meet the hypothesis as stated in section 3.2.

26
6. Discussion and Conclusion
6.1 Discussion
This thesis is based on data extracted from national input-output tables of the World Input-Output
Database. The database covers data for the period from 1995 to 2011. In order to make some
conclusions or generalisations an extended time frame is recommended. The time path of 1995-2011
is too short to make conclusions about the long-term development of agriculture. To describe a
certain pattern and making future predictions based on the past, data should be collected over a
broader time perspective for a more complete picture. Also data extracted from other sources can
help to create such a more complete picture.
In addition to more extended time series, also more countries can be added to get a better picture of
the development of agriculture in an economy as a whole. The country segmentation of the World
Bank Group (see figure 2.3) can be used to choose for a better comparison between developed,
developing, and in-between countries. More countries per stage have to be added to compare the
role and development of agriculture in the several transition stages for a solid generalization of the
results. However, data are not available for all such countries in the WIOD database although it
contains data on more countries than the four discussed.
The different explanatory factors are expressed in ratios explaining the share of agriculture in GDP
and total employment. The theoretical framework can be more exhaustive. For instance adaptation
of technology, innovation and policy is not included. For example, an international (e.g. the European
Common Agricultural Policy) or national policy can be very decisive. It determines the framework
wherein a farm can operate. This can be in the form of research, financial support (subsidies) or
environmental policy (e.g. the Netherlands applies supply quotas for pig and poultry for this
purpose). The agricultural policy either stimulates or restricts the development of agriculture. So it
can be taken in consideration for further research.
As an industry becomes less labour intensive, or more efficient, employment measures may
understate the significance of that sector since it is decreasing. Another difficulty using employment
as a measure, is converting part-time employment into full time equivalents. This is especially
complex in the agricultural production sector where part-time and seasonal labour is very common.
This thesis narrows the focus on agriculture as primary sector, which is the production of agricultural
products on farms. However, the impact of agriculture on the economy is much broader as it has
backward and forward linkages. The input sector (e.g. fertilizer), the processing sector (e.g. cheese),
and the distribution together with the agricultural sector form the agribusiness. Agribusiness has a
much larger effect on the country’s GDP. The factors used in the ratios to determine the role of
agriculture in GDP and employment should not only being researched for agriculture as primary
sector, but also for agribusiness as a whole. Agribusiness has to be taken into account when to
discuss the impact and role of agriculture in a national economy.
Finally, external effects of agricultural production and public goods produced by agriculture have not
been taken into account.

27
6.2 Conclusion
The objectives of this study were threefold: The first is to provide an overview of the theory of the
role of agriculture in economic development and to explain the general development of the share of
agriculture in GDP and employment. The second is to apply the theoretical framework to the data
from National Input Output Tables, in order to establish the developments in the factors determining
the share of agriculture in GDP and employment in the four selected countries. The third is to explain
the differences in these shares and compare those between the countries.
In order to explain how the agricultural sector has changed over time you have to understand the
role of agriculture in economic development. In section 2.1 several theories about the role of
agriculture in economic development have been discussed. The structural change model of Lewis and
the linear-stage theory of Rostow are the most relevant theories in determining the role of
agricultural sector. The major difference between the theories is that in Lewis’ theory the focus is on
the role of agriculture as labour reservoir for other sectors, and in Rostow’ theory the focus is on the
increase in agricultural productivity where technology plays an important role. Both theories are
convinced that the agricultural sector is fuelling the national economy by means of its cheap food
and surplus labour.
Where Rostow’s theory focuses on stages of economic development where agriculture plays a role in
the first stages, the World Bank Group focuses on stages of agricultural development. Based on
figure 3.1 Indonesia, China, the Netherlands and the United States are added in figure 6.1. For the
last two countries there is almost no difference in the development of the share of agriculture in GDP
and employment. These countries stayed in the developed stage for the period of 1989-2010 with a
share of agriculture in GDP between the 1 and 3.5% and a share in total employment between 2%
and 5%. For Indonesia and China this is a different story. They shifted trough different stages of
agricultural transformation. Indonesia underwent a small development in agriculture’s role in
national GDP. In 1989 the share of agriculture in GDP was 18% and decreased to 15% in 2010.
Agricultural employment was 55% of total employment and decreased to 38%. Indonesia went from
a pre-transition stage to a transition stage. China had a bigger development in the share of
agriculture in GDP and employment, respectively it decreased from 25% to 10% and from 65% to
38%. It transitioned from an in-between stage of an agriculture-based and pre-transition country, to
a transition stage which is almost similar to where Indonesia is. The changes in agricultural
development accelerates in China compared to the other countries. This development over time is
explained by the ratios in chapter 5.

28
Figure 6.1: Country segmentation based on agriculture’s role in the national economy
The ratios with the strongest development over time affecting agricultural share in China ‘s GDP, is
the ratio between agricultural and food production (b) and the ratio of share of food in total
consumption (d). Over time the ratios decline respectively with 21% and 40%. This decline was also
expected in the hypothesis stated in section 3.1 The expectation is that consumers in developed
countries have more preference for processed products than consumers in developing countries.
That’s why ratio (b) will go down with economic growth. The relative strong economic growth in
China also causes the decline in ratio (d). The increases in income makes sure that the relative share
of income spent on food will decrease as is indicated by Engel’s Law. Ratios determining the share of
agriculture in employment with the strongest development over time is the ratio of total and
agricultural labour productivity and the ratio of the value of production. These are also the ratios
changing the strongest over time for Indonesia, the Netherlands and the United States. Thus, highest
change occurs for productivity which is the most important driver of agriculture’s relative decline.
Although the expectation was that agricultural labour productivity would increase relatively faster
than in other sectors this cannot be derived from the ratios. This could be the case because as well in
total industry as in the agricultural sector total output is increasing while the employment in total
industry keeps increasing and employment in the agricultural sector is decreasing. That is why the
ratio goes up instead of the expected decrease.
The theories of Rostow and Lewis come together in this shift and increase in productivity. There is an
increase in agricultural (labour) productivity and a shift of labour to other sectors. Experiencing
increases in agricultural productivity are able to release labour from agriculture into other sectors of
the economy. Technology plays an important role in this process, based on innovations in capital-
augmenting and labour-saving techniques. For Indonesia and China started the implementation of
these technologies during the Green Revolution as stated in section 2.3. The agricultural productivity
China Indonesia The Netherlands The United States

29
was already high in the Netherlands and the United States. The major differences in the shares
between the countries is because of the stage where they are in. As presented in the figure Indonesia
and China slowly transition towards the stage of the Netherlands and the United States. The
developed countries are already more balanced, indicated by the relative small ratios and the small
decreases in ratio compared to the developing countries. These developing countries begin with
relative high ratios with a steeper decrease over time. This make sense because they are still in
transition, moving via different stages to eventually the stage of developed country.
The share of agriculture in GDP and employment is decreasing. All factors taken into account this is
mostly due to the increase of agricultural productivity. This leads to a relative lower value of
agricultural production. Certain activities have been transferred to the non-farm sector which
declares the continuing decline of agriculture along the preferred demand for processed products
which contain less agricultural products. The primary sector is becoming relatively unimportant in
the country’s economy but the agribusiness as a whole represent much bigger shares of the
economy. While the ratio between agriculture and agribusiness value added is increasing, eventually
the share of agribusiness in GDP is decreasing (see figure 2.4). Also productivity of industries is
growing relatively fast. As stated before, growth in (agricultural) productivity is a key factor
determining to the development (Timmer, 1988).

30
References
Adelman I. (2001). Fallacies in Development Theory and Their Implications for Policy. Frontiers of
Development Economics, Oxford University Press, 103-134.
Alston J.M., AndersenM.A., James J.S., and Pardey P.G. (2010). U.S. Agricultural Productivity Growth
and the Benefits from Public R&D Spending. Series: Natural Resource Management and Policy,
Vol. 34.
Barro R. (2007). Macroeconomics: a Modern Approach. Cengage Learning.
Basu K. (1997). Analytical development economics: the less developed economy revisited.
Booth A. (1989). Agricultural Development in Indonesia. Southeast Asia publications series.
Diao X., Hazell P., Resnick D., and Thurlow J. (2007). The role of agriculture in development:
Implications for Sub-Saharan Africa Research Report of the International Food Policy Research
Institute, 153:1-66.
Dimitri C., Effland A., and Conklin N. (2005). The 20th Century Transformation of U.S. Agriculture and
Farm Policy / EIB-3 Economic Research Service/USDA.
Fuglie K. (2004). Productivity growth in Indonesian agriculture, 1961-2000, Bulletin of Indonesian
Economic Studies, Taylor & Francis Journals, 40(2): 209-225.
Gardebroek C., and Peerlings J.H.M. (2013). Economics of Agribusiness. Chapter 1: Position of
agriculture and agribusiness within the economy. Wageningen University.
Gollin D., Parente S., and Rogerson R. (2002). The role of agriculture in development. American
Economic Review 92 (2): 160–164.
Johnston B.F. (1970). Association Agriculture and Structural Transformation in Developing Countries:
A Survey of Research. Journal of Economic Literature, 8(2): 369-404.
Johnston B.F., and Mellor J.W. (1961). The Role of Agriculture in Economic Development.
The American Economic Review, 51: 566-593.
Lains P., and Pinilla V. (2008). Agriculture and economic development in Europe since 1870. London:
Routledge.
Lewis W.A. (1954), Economic Development with Unlimited Supplies of Labour. The Manchester
School, 22: 139–191.
Martin W., and Warr P.G. (1990). The Declining Economic Importance of Agriculture. National Centre
for Development Studies and Department of Economies, Research School of Pacific Studies,
Australian National University.
Matsuyama K. (1992). Agricultural Productivity, Comparative Advantage and Economic Growth.
Department of Economics, Northwestern University.
McMillan J., Whalley J., and Zhu L. (1989). The Impact of China’s Economic Reforms on Agricultural
Productivity Growth. Journal of Political Economy, 97(4): 781-807.
Meer van de C.L.J., and Yamada S. (1990). Japanese Agriculture: A Comparative Economic Analysis
OECD (2008). Rising food prices: causes and consequences. Retrieved April, 2015, from
http://www.oecd.org/trade/agricultural-trade/40847088.pdf.
Pinstrup-Andersen P. (2009). Food security: definition and measurement. Food Security 1:5–7.
Pray C.E. (1986). Private Sector Agricultural Research and Technology Transfer in Indonesia. Report
No. 3, Economic Development Center, University of Minnesota.
Pryor S., and Holt T. (1999). Agribusiness as an engine of growth in developing countries. U.S. agency
for international development, Washington, DC.

31
Rosenstein-Rodan P.N. (1943). Problems of industrialisation of Eastern and South-Eastern Europe.
The Economic Journal, 53(210/211): 202-211.
Rostow W. W. (1960). The Stages of Economic Growth: A Non-Communist Manifesto. London.
Ruttan V. W. (1965). Growth stage theories and agricultural development policy. Australian Journal
of Agricultural Economics, 9: 17–32. doi: 10.1111/j.1467-8489.1965.tb00327.x.
Sen A. (1966). Peasants and dualism with or without surplus labor. Journal of Political Economy,
74(5): 425-450.
Shen X. (2010). Understanding the Evolution of Rice Technology in China – From Traditional
Agriculture to GM Rice Today, 46(6): 1026 – 1046.
Smits J.P. (2008). Technological change, institutional development and economic growth in Dutch
agriculture, 1870-1939. Chapter 2 in Lains P., and Pinilla V. (2008).
Stern N. (1996). Growth Theories Old and New and the Role of Agriculture in Economic Development,
Rome: Food and Agriculture Organization.
Timmer C. P. (1988). The Agricultural Transformation, in: H. Chenery and T. N. Srinivasan, eds.,
Handbook of development economics, Amsterdam: Elsevier, 275- 331.
Timmer M. P., Dietzenbacher E., Los B., Stehrer R., and de Vries G. J. (2015). An Illustrated User Guide
to the World Input–Output Database: the Case of Global Automotive Production, Review of
International Economics. (DOI: 10.1111/roie.12178).
Timmer M.P., Erumban A.A., Gouma R., Los B., Temurshoev U., Vries de G.J., Arto I., Genty V.A.A.,
Neuwahl F., Rueda-Cantuche J.M., Villanueva A., Francois J., Pindyuk O., Pöschl J., Stehrer R.,
and Streicher G. (2012). "The World Input-Output Database (WIOD): Contents, Sources and
Methods", WIOD Working Paper Number 10
Retrieved March, 2015, from http://www.wiod.org/publications/papers/wiod10.pdf.
Todaro M.P., and Smith S. (2012). Economic Development (11th Edition) ISBN: 978-0-13-801388-2.
Tsakok I., and Gardner B. (2007). Agriculture in Economic Development: Primary Engine of Growth or
Chicken and Egg? American Journal of Agricultural Economics, 89(5): 1145-1151.
World Bank Data (2015). World Bank national accounts data and OECD national accounts data files.
Catalogue Sources World Development Indicators. Retrieved March, 2015, from
http://data.worldbank.org/indicator/NV.AGR.TOTL.ZS.
World Bank Group (2014). Enabling the Business of Agriculture; a Progress Report.