urbanization issues in two large asian countries ... · urbanization issues in two large asian...
TRANSCRIPT

Urbanization issues in two large Asian countries: Indonesia and Bangladesh
Gavin Jones
Seminar at PIDE, Islamabad 31 August 2016

Outline
• Issues in measuring urbanization
• Trends in urbanization in Indonesia and Bangladesh
• Differences in people’s lives in rural and urban areas
• Growth of mega-urban areas
• Jakarta and Dhaka: among the world’s largest megacities
• Some conclusions and policy recommendations.
What is urbanization?
• Urbanization means an increase in the proportion of population living in urban areas.
• Urban growth is different from urbanization. If population growth in a country is 2 per cent per annum, and the growth of urban population is also 2 per cent per annum, urbanization is not taking place, although the urban population is increasing quite rapidly.
• If, on the other hand, urban population is increasing by 4 per cent per annum in a country where population growth is 2 per cent per annum, then urbanization - an increase in the urban share of the total population - is clearly taking place.

Urban-rural distinctions
Bangkok, Thailand
Java, Indonesia
Peri-urban area - Jakarta

What is an urban area?
• Increasingly difficult to distinguish urban from rural areas
•Many localities (especially on the fringes of large cities) have very mixed characteristics
• Even “truly” rural areas are now linked to urban areas through communications (television, mobile phones, better transportation) in ways that were inconceivable four or five decades ago
• So when we say Indonesia is 50% urban, or Bangladesh 28% urban, we need to be aware of the uncertainty of this figure

Role of migration in urbanization
•3 possible factors increasing urban populations • Natural increase • Net in-migration • Re-classification from rural to urban area
The first and third of these are often neglected; but net in-migration does play a large role

Migration data
•Crucial role of Population Census in providing migration data
•Small area data crucial
•Problems in Bangladesh migration data (2011)
•The feminization of rural-urban migration in Bangladesh

WHY RURAL-URBAN MIGRATION?
•Big differences in output per worker by sector; provided jobs are available, the economy benefits from urban-ward migration
Bangladesh Indonesia
Agriculture 1.00 1.00
Manufacturing 4.09 7.17
Services 3.41 2.39

Bangladesh – trends in real wages 1970-2010
0.0
20.0
40.0
60.0
80.0
100.0
120.0
140.0
160.0
180.0
Re
al w
age
in
de
x 1
96
9-7
0=1
00
Agriculture
Industry

Indonesia: Distribution of the employed population across broad industry sectors
1971-2010
Sector 1971 1980 1990 1995 2010
Agriculture 65.9 56.2 52.7 44.0 38.4
Industry 10.1 13.3 15.1 18.4 19.3Services 24.1 30.5 32.2 37.6 42.3
Total 100 100 100 100 100

-
10.0
20.0
30.0
40.0
50.0
60.0
70.0
1971 1980 1990 2000 2010
Indonesia
Java
Outer islands
Indonesia: Trends in percentage of population living in urban areas, 1971-2010


Future population growth will be entirely in urban areas
•Expected population growth 2015-2035 • Indonesia - 50 million, 20 per cent increase • Bangladesh - 39 million, 24 per cent increase
•How is this growth to be accommodated? • In situ urbanization • Further growth of cities and towns


Indonesia: Urban and Rural Age Pyramids, 2010

Indonesia: educational attainment of household population, urban and rural, 2012 (%)
Incompleteprimaryor
less
Completedprimary/
incompletesecondary
Completedsecondary
ormore
Total
MALE(aged6+)
Urban 22.9 39.4 37.7 100.0Rural 37.2 47.2 15.6 100.0
Total 30.0 43.8 26.8 100.0
FEMALE(aged6+) Urban 27.2 39.5 33.3 100.0
Rural 42.1 45.0 12.9 100.0
Total 34.7 42.3 23.0 100.0FEMALESAGED15-49
Urban 8.7 43.0 48.3 100.0
Rural 19.8 58.6 21.6 100.0

Bangladesh. Percentage of households possessing various household effects and means of transportation, by residence, 2014 Possession Urban Rural Total
Housing – earth or sand
floor
32.5 81.5 67.8
Household effects
Radio 3.2 3.6 3.5
Television 70.6 33.0 43.5
Mobile telephone 93.4 86.7 88.5
Non-mobile telephone 4.2 0.5 1.6
Refrigerator 40.6 12.3 20.2
Electric fan 85.9 48.5 59.0
DVD/VCD player 12.1 4.8 6.8
Computer/laptop 11.8 2.4 5.1
Means of transport
Bicycle 16.7 28.4 25.1
Motorcycle/scooter 8.0 5.7 6.4
Rickshaw/van 5.5 5.5 5.5
Animal drawn cart 0.2 0.1 0.1
Car/truck/microbus 1.2 0.6 0.8

Indonesia: Percent distribution of the population by wealth quintiles, by residence, 2012
Area Wealthquintile
Lowest Second Middle Fourth Highest TotalDKIJakarta
2.5 7.6 14.8 27.8 47.2 100.0
Urban 6.4 13.6 21.0 26.4 32.7 100.0
Rural 33.5 26.4 19.0 13.7 7.4 100.0
Total 20.0 20.0 20.0 20.0 20.0 100.0

Indonesia: Percentage of households possessing various household effects and means of transportation, by residence, 2012
Possession Urban Rural Total
Householdeffects Radio 39.6 27.8 33.6
Television 91.7 74.8 83.2
Mobiletelephone 90.7 75.5 82.9Non-mobiletelephone
11.5 1.0 6.2
Refrigerator 55.5 24.7 39.8
Meansoftransport
Bicycle 45.2 38.9 42.0Motorcycle/scooter 73.2 60.7 66.8
Rowboat 0.6 2.4 1.5
Boatwithamotor 0.7 1.6 1.1Animaldrawncart 0.2 0.1 0.1
Car/truck 12.3 5.1 8.6
Ship 0.1 0.1 0.1


City size distributions

Urban primacy
• Jakarta – 20% of Indonesia’s urban population
•Dhaka – 37% of Bangladesh’s urban population
•4-city primacy index • Dhaka – 2.12 • Jakarta – 1.57

Proportion of Bangladesh’s urban population in 10 largest cities, 1950-2030
0
5.0
10.0
15.0
20.0
25.0
30.0
35.0
Pe
rce
nta
ge
Barisal
Bogra
Chittagong
Comilla
DHAKA
Khulna
Mymensingh
Rajshahi
Rangpur
Sylhet

Indonesia: role of secondary cities
• In Java, the secondary cities grew only slowly over the 2000-2010 period
• But we need to study the growth of those which were not “Kota Otonom” (e.g. Karawang, Pandeglang, Ciamis, Jember, Jombang)
• World Bank says medium-sized cities (populations half to one million) have performed better than smaller cities. Some smaller cities have declined – lack of infrastructure and skilled labour, poor access to major cities and ports
• Small and medium urban centres in outer islands are doing better. Annual growth over 2000-2010 period: • Batam 8.0% Pekanbaru 4.4% Bontang 3.7% • Sorong 7.0% Den Pasar 4.0% Samarinda 3.4% • Jayapura 5.1% Dumai 3.9% Blikpapan 3.1% • Tarakan 5.2% Kendari 3.7%

Small and Medium Urban Centers in Indonesia (Population 100,000 to 1 Million)

Mega-urban regions (MURs)

Donut growth and fringe area transformation
• Indonesia’s official metropolitan areas are the hole in the donut – population increasing very slowly
• The donut ring – areas outside the official city – increasing very rapidly. Annual percentage increases are as follows (2000-2010)
Crucial to focus on the MUR as a whole – otherwise the wrong policy conclusions can easily be drawn
Core Periphery MUR
Jakarta 1.4 5.6 3.8
Surabaya 0.7 2.8 1.8
Bandung 1.2 4.6 3.3
Medan 1.1 2.5 1.7
Semarang 1.5 2.6 2.0
Makassar 2.2 5.8 2.7
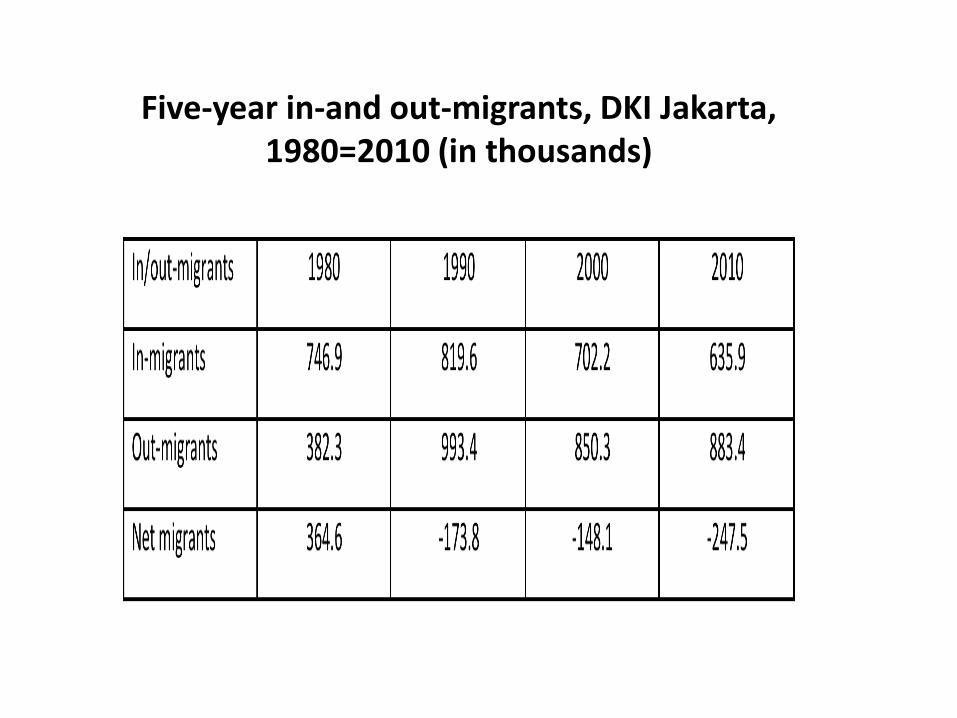
Five-year in-and out-migrants, DKI Jakarta, 1980=2010 (in thousands)
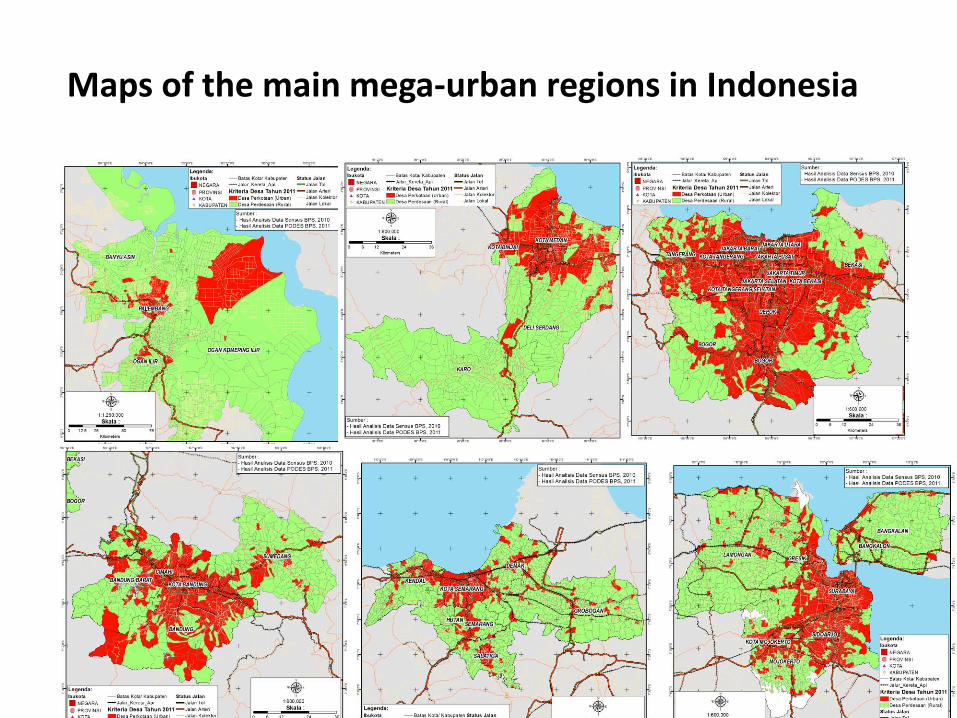
Maps of the main mega-urban regions in Indonesia

JABODETABEK – INDONESIA’S FOREMOST MUR
Expansion of built-up area of Jakarta over time

New residential developments in Jabodetabek, 2010

Population of Indonesia’s major Mega-urban regions, 2010
Mega-urbanregion Population2010 Urbanproportion
oftheMUR
population
(%)
Shareofcore*inthe: MUR’sshareof
Indonesianpopulation
(%)
Urbanareasonly
Urbanandruralareas MUR
population
(%)
MURurban
population
(%)
Jakarta(Jabodetabek-
Punjur)
26,147,936 28,626,735 91 34 37 12.0
Surabaya(Gerbangkertosusila)
6,182,485 8,919,329 68 31 45 3.8
Bandung(BandungRaya)
6,793,054 8,002,462 85 30 35 3.4
Medan(Mebidangro)
3,724,787 4,223,775 88 50 56 1.8
Semarang
(Kedungsepur)
3,174,290 6,049,946 52 26 48 2.5
Makassar
Maminasata)
1,849,507 2,484,475 74 54 73 1.0
Palembang(PalembangRaya)
1,686,515 3,287,648 51 44 81 1.4
DenPasar(Sarbagita)
1,613,388 1,791,360 90 44 49 0.8

Percent of National Population and GDP by Metropolitan Areas in Java, 2010
AgglomerationPopulation
2010
(million)
PercentofIndonesia’spopulation
Percentof
Indonesia’s
GDP2010
Jakarta
(Jabodetabek)
26.15 11.0 25.3
Surabaya
(Gerbangkertosusila)
6.22 2.6 6.7
Bandung(Bandung
Raya)
6.79 2.9 3.3
Semarang
(Kedungsepur)
3.17 1.3 1.8

Actual and projected population of Dhaka, 1950-2030
0.3 0.4 0.5 0.8 1.4 2.2 3.3
4.7 6.6
8.3 10.3
12.3 14.7
17.6
21.0
24.3
27.4
0
5.00
10.00
15.00
20.00
25.00
30.00
Po
pu
lati
on
(m
illio
ns)

Actual and projected population of Dhaka, Mumbai and Karachi, 1950-2030
0
5.00
10.00
15.00
20.00
25.00
30.00
Po
pu
lati
on
(m
illio
ns)
Dhaka
Mumbai
Karachi

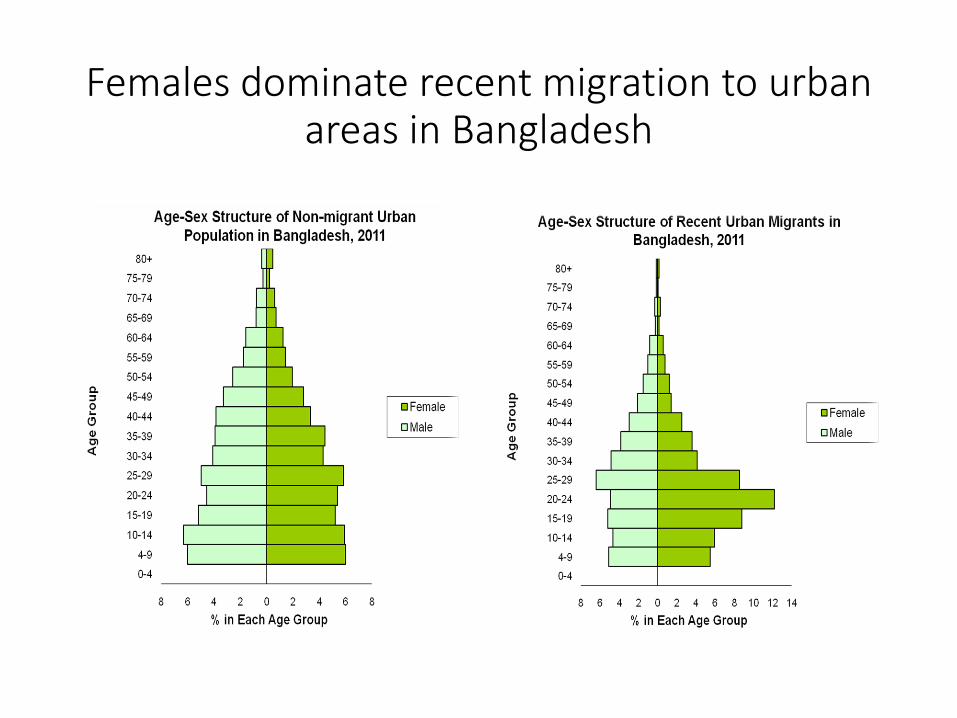
Females dominate recent migration to urban areas in Bangladesh


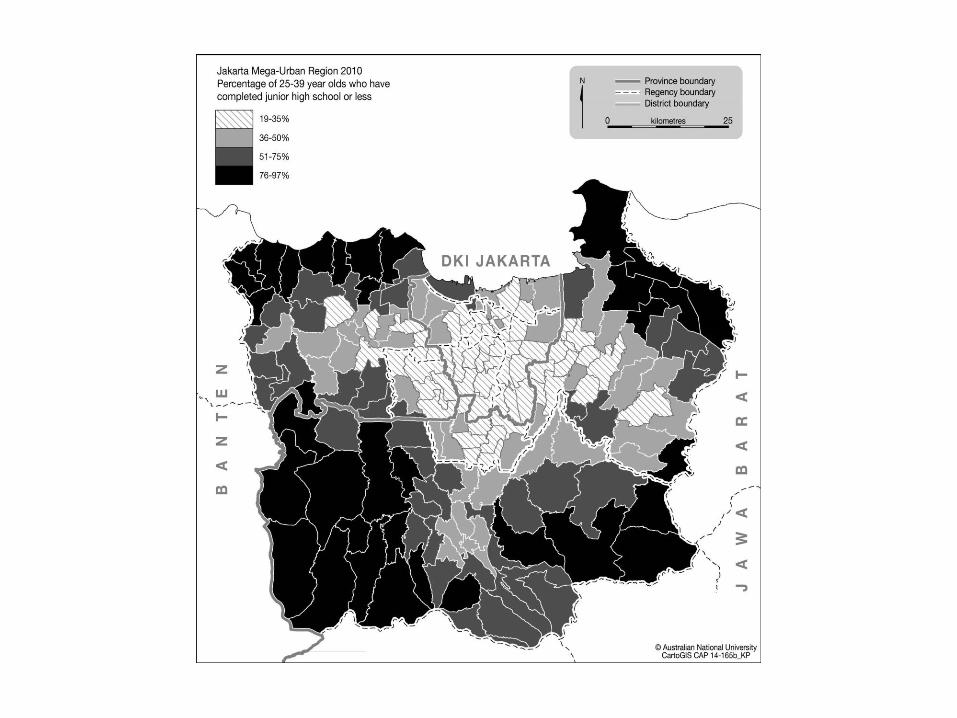
Migration has played a crucial role in changing the educational characteristics of the Jabodetabek
population
• See following maps
• Cities of Bekasi, Depok and Tangerang Selatan have somewhat higher educational attainment than Jakarta.
• This is clearly because of selectivity in migration patterns
• In DKI Jakarta, at aged 25-39, migrants, on average, are more poorly educated than the local population
• Urban areas of Bodetabek – at ages 25-39, migrants are much better educated, on average, than the local population
• So migration is lowering the educational attainment in Jakarta and raising it in urban Bodetabek

Conclusions and recommendations
• For Bangladesh, in situ urbanization could play a key role in ameliorating the problems of massive growth in Dhaka • Lessons from Japan, Korea, Taiwan? • Some benefits (?) of extreme density • Environmental concerns in Bangladesh urbanization
• An increasingly urbanized Indonesia • Risk of increasingly urban-focused planning • Reaping the benefits of agglomeration? • West of the Central Java-West Java border – in 2035, 90% urban, 76
million urban population
• Increasing the livability of cities in the two countries
• Urban governance and community involvement
• Many research needs

T H A N K Y O U