the deloitte consumer tracker confidence suffers …...uk consumer confidence suffered a setback in...
TRANSCRIPT

Q4 2013
A Deloitte Insight Report
The Deloitte Consumer TrackerConfidence suffers a setback

Contents
About this researchThe Deloitte Consumer Tracker is based on a consumer survey carried out by independent market research agency, YouGov, on our behalf. This survey was conducted online with a nationally representative sample of over 3,000 UK adults aged 18+ between 3 and 5 January 2014.
A note on the methodologySome of the figures in this research show the results in the form of a net balance. This means that in a survey of 100 respondents, assume that 30 reported they are spending more, 50 reported no change and 20 reported they are spending less. The net balance is calculated by subtracting the number that reported they spent less from the number that reported they spent more, i.e. 30 – 20 = 10. This means 10 per cent of consumers reported that they spent more rather than less.
The Deloitte Consumer Tracker 1
Confidence suffers a setback 2
Downward pressure on discretionary spending continues to ease 4
The outlook remains positive 7
Contacts 9

UK consumer confidence suffered a setback in the fourth quarter of 2013 according to the latest edition of the Deloitte Consumer Tracker.
The Tracker shows that consumer confidence slowed in Q4, halting 2013’s upward trajectory. Consumers were less optimistic about their level of disposable income, their job and their level of debt in the fourth quarter, highlighting some of the headwinds still facing the consumer recovery.
Household budgets remain under pressure, with real disposable income remaining flat since 2009. In fact, recent gains in consumer spending have been largely fuelled by a mixture of historically low interest rates, consumers dipping into their savings, easier access to credit and lower inflation.
The Deloitte Consumer TrackerQ4 2013
Key findings:
• All measures of confidence slowed in the fourth quarter, following a 12-month upward trend, highlighting that there are still some headwinds facing the consumer recovery.
• In an illustration of the uneven nature of the recovery the Tracker shows that downward pressure on discretionary spending continued to ease, with categories such as going out, clothing and electricals seeing a net improvement year-on-year.
• Our data also shows that both expansionary and defensive behaviours have been growing simultaneously, as consumers continue to trade selectively at both the premium and value end of the market.
• Entering 2014, we would expect consumer confidence to return to an upwards trajectory, as lower inflation and an improving labour market combine to help lift real incomes and provide the conditions for sustained growth in the consumer market.
Figure 1. UK consumer confidence
Net % of UK consumers who said that their level of confidence has improved during the pastthree months
-20%
-15%
-10%
-5%
0%
Q42013
Q32013
Q22013
Q12013
Q42012
Q32012
Q22012
Q12012
Q42011
Q32011
-18%
-15%-14% -15%
-13%-15%
-12%
-10%
-8%
-11%
The Tracker also shows that consumers have been reducing their spending in essential categories as a result of lower inflation, which has allowed them to increase spending in more discretionary areas. Categories such as going out, clothing and electricals saw a net improvement year-on-year.
In addition, the data highlights that both expansionary behaviours such as trading up and buying more, and defensive behaviours such as trading down have been growing simultaneously, although expansionary behaviours are growing at a faster rate.
The example of the retail market can explain this paradox where we have seen growth at both the premium and value end of the market, often with the same consumers shopping at both ends. The net effect is that the middle has been squeezed.
Entering 2014, we would expect consumer confidence to return to an upwards trajectory, as lower inflation and an improving labour market combine to help lift real incomes and provide the conditions for sustained growth in the consumer market.
Deloitte Consumer Tracker Q4 2013 1
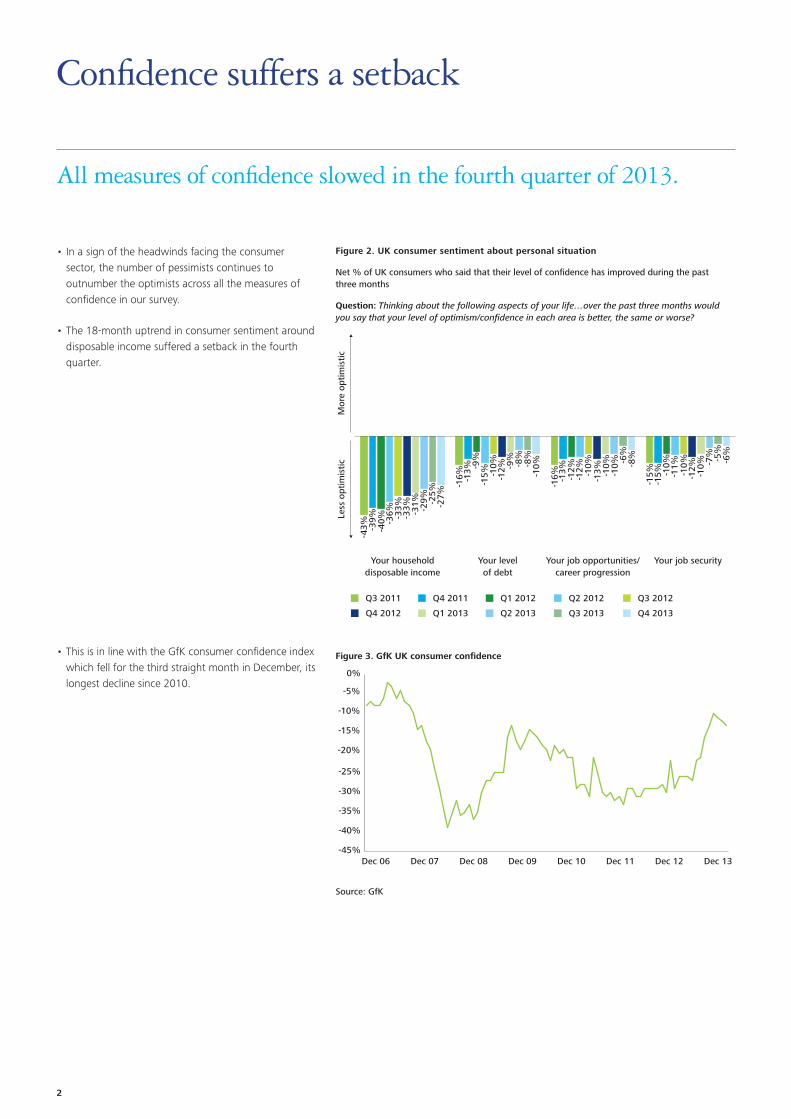
• In a sign of the headwinds facing the consumer sector, the number of pessimists continues to outnumber the optimists across all the measures of confidence in our survey.
• The 18-month uptrend in consumer sentiment around disposable income suffered a setback in the fourth quarter.
Figure 2. UK consumer sentiment about personal situation
Net % of UK consumers who said that their level of confidence has improved during the past three months
Question: Thinking about the following aspects of your life…over the past three months would you say that your level of optimism/confidence in each area is better, the same or worse?
Your job securityYour job opportunities/career progression
Your levelof debt
Your householddisposable income
-43%
Less
opt
imis
tic
Mor
e op
tim
isti
c
-40%
-39% -3
6% -33%
-33% -31% -29% -2
5%-2
7%
-16%
-9%
-13%
-15% -1
0%-1
2% -9%
-8%
-8%
-10%
-16% -1
2%-1
3%
-12% -10%
-13% -1
0%-1
0% -6%
-8%
-15% -1
0%-1
5% -11%
-10%
-12%
-10% -7
% -5%
-6%
Q3 2011 Q4 2011 Q1 2012 Q2 2012 Q3 2012
Q4 2013Q4 2012 Q1 2013 Q2 2013 Q3 2013
• This is in line with the GfK consumer confidence index which fell for the third straight month in December, its longest decline since 2010.
Figure 3. GfK UK consumer confidence
-45%
-40%
-35%
-30%
-25%
-20%
-15%
-10%
-5%
0%
Dec 06 Dec 07 Dec 08 Dec 09 Dec 10 Dec 11 Dec 12 Dec 13
Source: GfK
Confidence suffers a setback
All measures of confidence slowed in the fourth quarter of 2013.
2

• The Tracker results also show that there was a slight increase in the number of people reporting a reduction or loss of income, while fewer started a new job in the fourth quarter.
Figure 4. Changes in personal household circumstances in the past three months
% of UK consumers
Question: Thinking about your household circumstances in the past three months, which of the following apply to you or someone in your household?
Being laid off/made redundant Started a new job Received a pay rise or a bonusReduction/loss of some income
0%
2%
4%
6%
8%
10%
12%
14%
16%
Q4 2013Q3 2013Q2 2013Q1 2013Q4 2012Q3 2012Q2 2012Q1 2012Q4 2011
• Official employment figures improved in the last two years.
Figure 5. UK unemployment rate (16 and over)
4.5
5.0
5.5
6.0
6.5
7.0
7.5
8.0
8.5
Sep03
Sep04
Sep05
Sep06
Sep07
Sep08
Sep09
Sep10
Sep11
Sep12
Sep13
UK LFS: Unemployment rate, all aged 16 & over SADJ
• Despite the recent growth in employment, economic commentators agree that much of the weakness in household incomes is attributable to low real wage growth since the onset of the economic downturn.
Figure 6. Average earnings growth and UK national inflation
-4
-3
-2
-1
0
1
2
3
4
5
6
Dec
07
Mar
08
Jun
08Se
p 08
Dec
08
Mar
09
Jun
09Se
p 09
Dec
09
Mar
10
Jun
10Se
p 10
Dec
10
Mar
11
Jun
11Se
p 11
Dec
11
Mar
12
Jun
12Se
p 12
Dec
12
Mar
13
Jun
13Se
p 13
Dec
13
CPI Harmonised inflation Average earnings after tax
Source: ONS
Deloitte Consumer Tracker Q4 2013 3
Downward pressure on discretionary spending continues to ease
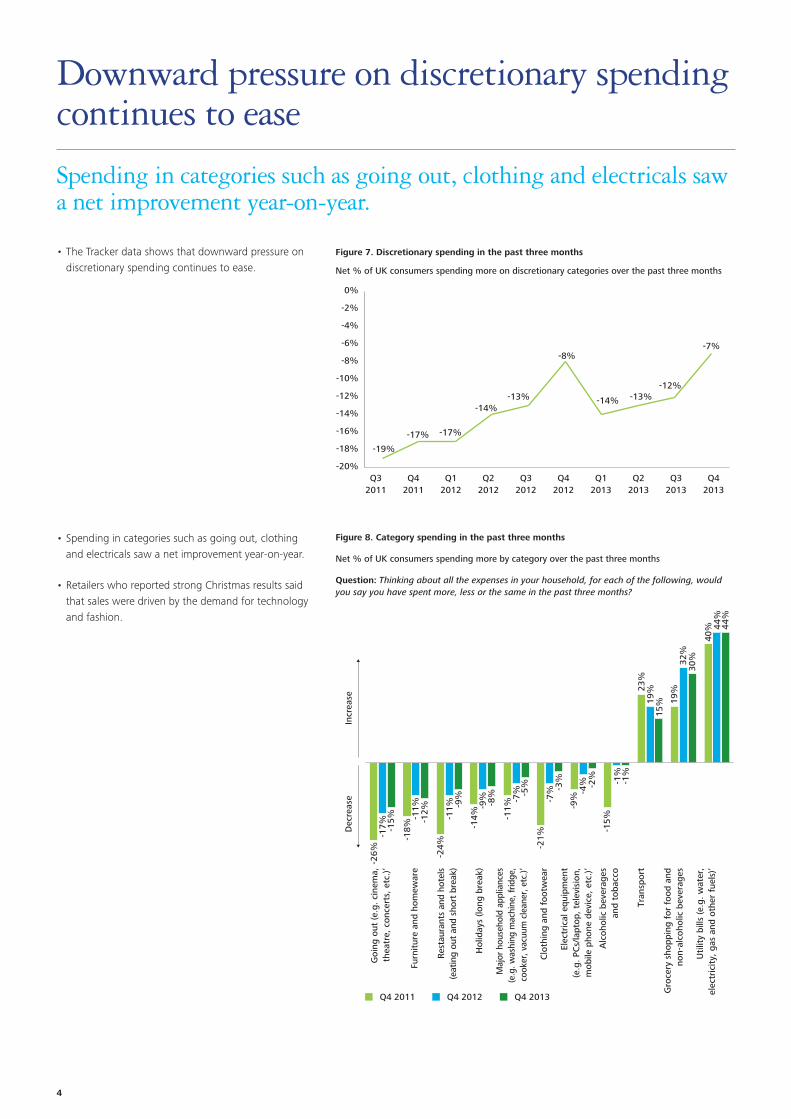
• The Tracker data shows that downward pressure on discretionary spending continues to ease.
Figure 7. Discretionary spending in the past three months
Net % of UK consumers spending more on discretionary categories over the past three months
Q32011
Q42011
Q12012
Q22012
Q32012
Q42012
Q12013
Q22013
Q32013
Q42013
-19%
-17% -17%
-14%-13%
-8%
-14% -13%-12%
-7%
-20%
-18%
-16%
-14%
-12%
-10%
-8%
-6%
-4%
-2%
0%
• Spending in categories such as going out, clothing and electricals saw a net improvement year-on-year.
• Retailers who reported strong Christmas results said that sales were driven by the demand for technology and fashion.
Figure 8. Category spending in the past three months
Net % of UK consumers spending more by category over the past three months
Question: Thinking about all the expenses in your household, for each of the following, would you say you have spent more, less or the same in the past three months?
Q4 2011 Q4 2012 Q4 2013
Dec
reas
eIn
crea
se
Goi
ng o
ut (e
.g. c
inem
a,th
eatr
e, c
once
rts,
etc
.)’
Furn
itur
e an
d ho
mew
are
Res
taur
ants
and
hot
els
(eat
ing
out
and
shor
t br
eak)
Hol
iday
s (lo
ng b
reak
)
Maj
or h
ouse
hold
app
lianc
es(e
.g. w
ashi
ng m
achi
ne, f
ridge
, co
oker
, vac
uum
cle
aner
, etc
.)’
Clo
thin
g an
d fo
otw
ear
Tran
spor
t
Gro
cery
sho
ppin
g fo
r fo
od a
nd
non-
alco
holic
bev
erag
es
Uti
lity
bills
(e.g
. wat
er,
elec
tric
ity,
gas
and
oth
er f
uels
)’
Elec
tric
al e
quip
men
t (e
.g. P
Cs/
lapt
op, t
elev
isio
n,
mob
ile p
hone
dev
ice,
etc
.)’
Alc
ohol
ic b
ever
ages
and
toba
cco
-26%
-17%
-18%
-11%
-11%
-11%
-7%
-7% -3
%
-4% -2
% -1%
23%
19%
19%
32%
30%
40% 44
%44
%
15%
-1%
-21%
-5%
-9%
-9%
-9%
-8%
-12%
-14%
-15%
-24%
-15%
Spending in categories such as going out, clothing and electricals saw a net improvement year-on-year.
4

• The steady growth in discretionary spending has been partly fuelled by falling inflation in utility and food prices.
Figure 9. UK CPI categories
Dec 12 Dec 07Dec 13
-15 -10 -5 0 5 10 15 20
Food & Non-alcoholic beverages
Alcoholic beverages, Tobacco & Narcotics
Clothing & Footwear
Housing, Water & Fuels
Furn, HH equip & Repair of the house
Health
Transport
Communication
Recreation & Culture
Education
Hotels, Cafes & Restaurants
Miscellaneous goods & Services
Total inflation
19.7 8.6
2 2.7 3.1
0.322.6
2.3
3.32.2
0.51.1
0.1
2.52.8
2.1
1.40.90.8
3.73.9
14.3
1.6
5.86
4.4
1.93.8
10.4
0.8-10.3
-3.4
10.3
0.80.7
-1.2
3.23.6
Source: ONS
• Our research also shows that this increase in spending was driven by growth in volume rather than by price inflation.
Figure 10. Reasons consumers spent less in the past three months
% of UK consumers spending more
Question: You just mentioned you spent more in the last three months, which of the following reasons apply to you?
Buying more items More expensive
20%
25%
30%
35%
40%
45%
50%
Q42013
Q32013
Q22013
Q12013
Q42012
Q32012
Q22012
Q12012
Q42011
Q32011
Deloitte Consumer Tracker Q4 2013 5
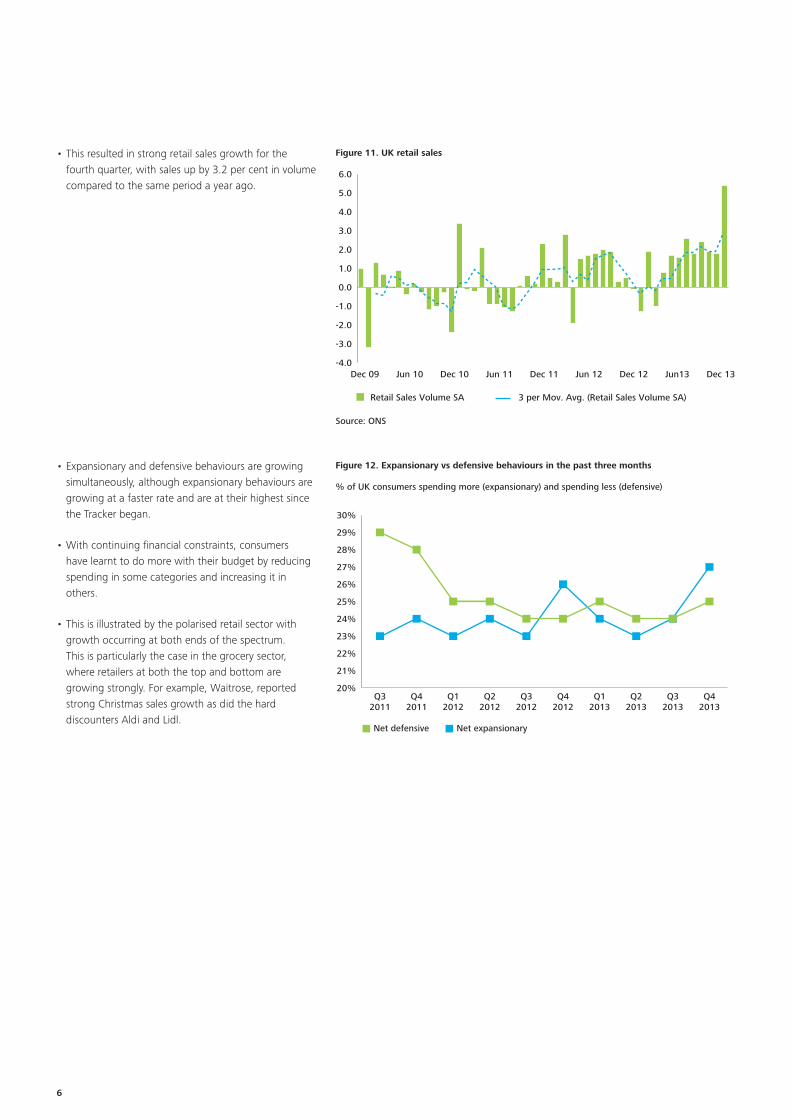
• This resulted in strong retail sales growth for the fourth quarter, with sales up by 3.2 per cent in volume compared to the same period a year ago.
Figure 11. UK retail sales
Retail Sales Volume SA 3 per Mov. Avg. (Retail Sales Volume SA)
Dec 09 Jun 10 Jun 11 Jun 12 Jun13Dec 10 Dec 11 Dec 12 Dec 13-4.0
-3.0
-2.0
-1.0
0.0
1.0
2.0
3.0
4.0
5.0
6.0
Source: ONS
• Expansionary and defensive behaviours are growing simultaneously, although expansionary behaviours are growing at a faster rate and are at their highest since the Tracker began.
• With continuing financial constraints, consumers have learnt to do more with their budget by reducing spending in some categories and increasing it in others.
• This is illustrated by the polarised retail sector with growth occurring at both ends of the spectrum. This is particularly the case in the grocery sector, where retailers at both the top and bottom are growing strongly. For example, Waitrose, reported strong Christmas sales growth as did the hard discounters Aldi and Lidl.
20%
21%
22%
23%
24%
25%
26%
27%
28%
29%
30%
Q42013
Q32013
Q22013
Q12013
Q42012
Q32012
Q22012
Q12012
Q42011
Q32011
Net defensive Net expansionary
Figure 12. Expansionary vs defensive behaviours in the past three months
% of UK consumers spending more (expansionary) and spending less (defensive)
6

The outlook remains positive
Further growth in consumer spending expected as conditions continue to improve in the consumer market.
• While our data shows that consumers are expecting to spend less in the grocery and transport categories in the first quarter of this year, the trend towards increasing discretionary spending is expected to continue.
• Compared to the same time last year more consumers are planning major purchases such as buying a car or a property this quarter.
Q4 2011 Q4 2012 Q4 2013
Dec
reas
eIn
crea
se
Goi
ng o
ut (e
.g. c
inem
a,th
eatr
e, c
once
rts,
etc
.)
Furn
itur
e an
d ho
mew
are
Res
taur
ants
and
hot
els
(eat
ing
out
and
shor
t br
eak)
Hol
iday
s (lo
ng b
reak
)
Maj
or h
ouse
hold
app
lianc
es(e
.g. w
ashi
ng m
achi
ne, f
ridge
, co
oker
, vac
uum
cle
aner
, etc
.)
Clo
thin
g an
d fo
otw
ear
Tran
spor
t
Gro
cery
sho
ppin
g fo
r fo
od a
nd
non-
alco
holic
bev
erag
es
Uti
lity
bills
(e.g
. wat
er,
elec
tric
ity,
gas
and
oth
er f
uels
)
Hou
sing
(e.g
. ren
t,m
ortg
age,
mai
nten
ance
)
Elec
tric
al e
quip
men
t (e
.g. P
Cs/
lapt
op, t
elev
isio
n,
mob
ile p
hone
dev
ice,
etc
.)
Alc
ohol
ic b
ever
ages
and
toba
cco
-20%
-24%
-24%
-25% -23% -2
1%
-22%
-23% -2
0%
-23%
-22% -1
9%
-21%
-22%
-16%
-20% -1
6% -14%
-19% -1
7%-1
3%
-8%
-8%
-4%
5%9%
4%
10%
10%
7%
1%4%
8%
17%
30%
31%
Figure 13. UK consumer sentiment about disposable income by income groups
Net % of UK consumers spending more by category over the next three months
Question: And now thinking about all the expenses in your household in the next three months, for each of the following, would you say you will spend more, less or the same compared to four to six months ago?
Figure 14. UK consumer planning major purchases in the next three months
% of UK consumers
Question: Are you planning any of the following in the next three months?
Upgrading:moving into alarger home
Buying a property
Buying a carBuying a major piece of furniture
Buying anexpensive electricalitem (e.g. iPhone,
flat screen TV, computer/
laptop,etc.)
7% 7%
9%
7% 7%8%
5% 5%6%
3% 3%
5%
3%2%
4%
Q4 2011 Q4 2012 Q4 2013
Deloitte Consumer Tracker Q4 2013 7
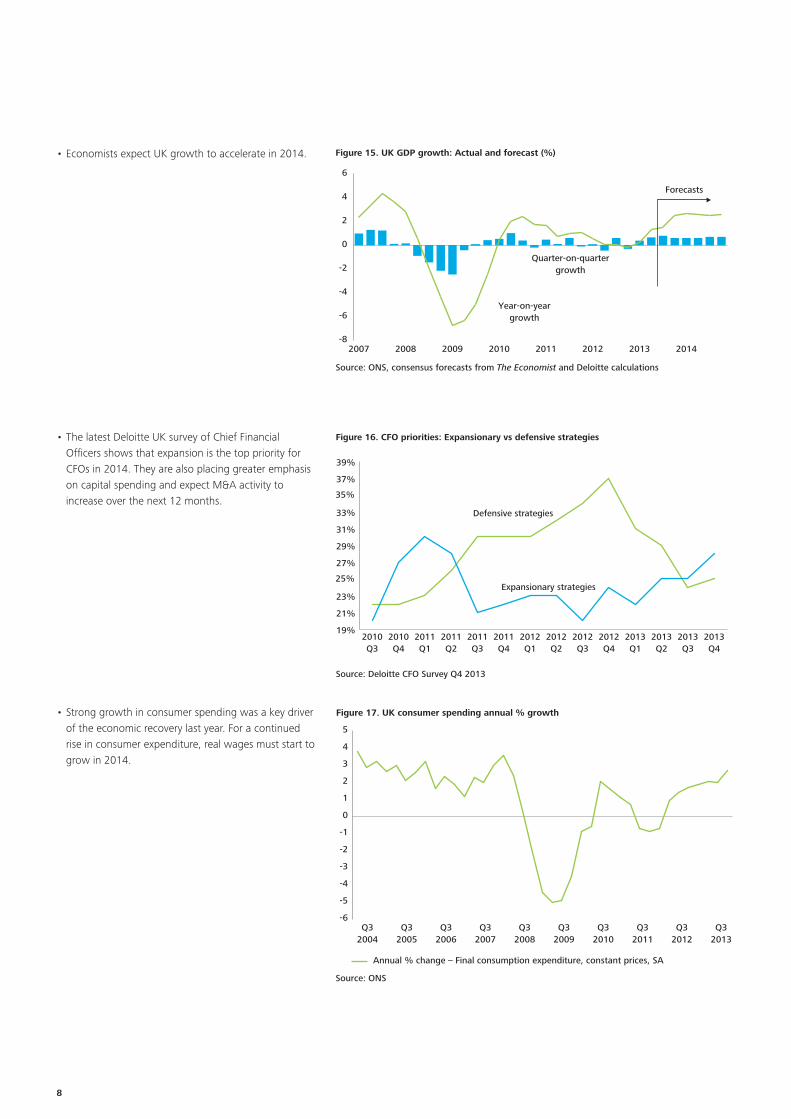
• Economists expect UK growth to accelerate in 2014.
• The latest Deloitte UK survey of Chief Financial Officers shows that expansion is the top priority for CFOs in 2014. They are also placing greater emphasis on capital spending and expect M&A activity to increase over the next 12 months.
• Strong growth in consumer spending was a key driver of the economic recovery last year. For a continued rise in consumer expenditure, real wages must start to grow in 2014.
Figure 15. UK GDP growth: Actual and forecast (%)
Quarter-on-quartergrowth
Year-on-yeargrowth
20142013201220112010200920082007-8
-6
-4
-2
0
2
4
6
Forecasts
Source: ONS, consensus forecasts from The Economist and Deloitte calculations
19%
21%
23%
25%
27%
29%
31%
33%
35%
37%
39%
2013Q4
2013Q3
2013Q2
2013Q1
2012Q4
2012Q3
2012Q2
2012Q1
2011Q4
2011Q3
2011Q2
2011Q1
2010Q4
2010Q3
Defensive strategies
Figure 16. CFO priorities: Expansionary vs defensive strategies
Source: Deloitte CFO Survey Q4 2013
Expansionary strategies
-6
-5
-4
-3
-2
-1
0
1
2
3
4
5
Figure 17. UK consumer spending annual % growth
Q32004
Q32005
Q32006
Q32007
Q32008
Q32009
Q32010
Q32011
Q32012
Q32013
Annual % change – Final consumption expenditure, constant prices, SA
Source: ONS
8

Authors
Ben PerkinsHead of Research, Consumer Business020 7307 [email protected]
Céline FenechResearch Manager, Consumer Business020 7303 [email protected]
Aino PietikainenResearch Manager, Consumer Business020 7007 [email protected]
Leadership team
Nigel WixceyIndustry Leader, Consumer Business020 7303 [email protected]
Ian GeddesLead Partner, UK Retail020 7303 [email protected]
Graham PickettLead Partner, UK Travel, Hospitality and Leisure01293 [email protected]
Contacts
Deloitte Consumer Tracker Q4 2013 9

Deloitte refers to one or more of Deloitte Touche Tohmatsu Limited (“DTTL”), a UK private company limited by guarantee, and its network of member firms, each of which is a legally separate and independent entity. Please see www.deloitte.co.uk/about for a detailed description of the legal structure of DTTL and its member firms.
Deloitte LLP is the United Kingdom member firm of DTTL.
This publication has been written in general terms and therefore cannot be relied on to cover specific situations; application of the principles set out will depend upon the particular circumstances involved and we recommend that you obtain professional advice before acting or refraining from acting on any of the contents of this publication. Deloitte LLP would be pleased to advise readers on how to apply the principles set out in this publication to their specific circumstances. Deloitte LLP accepts no duty of care or liability for any loss occasioned to any person acting or refraining from action as a result of any material in this publication.
© 2014 Deloitte LLP. All rights reserved.
Deloitte LLP is a limited liability partnership registered in England and Wales with registered number OC303675 and its registered office at 2 New Street Square, London EC4A 3BZ, United Kingdom. Tel: +44 (0) 20 7936 3000 Fax: +44 (0) 20 7583 1198.
Designed and produced by The Creative Studio at Deloitte, London. 32472A