the decay of longitudinal vortices shed from airfoil
TRANSCRIPT

NASA Contractor Report 198356AIAA-95-1797
The Decay of Longitudinal Vortices ShedFrom Airfoil Vortex Generators
Bruce J. Wen&
Modern Technologies Corporation
Middleburg Heights, Ohio
Bruce A. Reichert
Kansas State UniversityManhattan, Kansas
Jeffry D. FosterIowa State University
Ames, Iowa
June 1995
Prepared forLewis Research Center
Under Contract NAS3-27377
National Aeronautics and
Space Administration
P,J0
0_ u_ o_
t_ Uo- C oZ _ o
,, 0 rOoa_ C
_0 Ct.j uJ _ L_
;._ Z i
_00 0 0
00 ..I I-- _
F-I Z r._l_...-
I I'- "_ _ 0
,.__J <¢ k.) t--
_JC.3
P_


THE DECAY OF LONGITUDINAL VORTICES SHED FROM AIRFOIL VORTEX GENERATORS
Bruce J. Wen&*
Modern Technologies Corporation, Middleburg Heights, Ohio, 44130Bruce A. Reichert t
Kansas State University, Manhattan, Kansas
Jellry D. Foster t
Iowa State University, Ames, Iowa
Absu-act
An ex_timental study is conducted to examine the
crossplane structure and streamwise decay of vorticesshed from airfoil-type vortex generators. The vortex gen-
erators are set in a counter-rotating array spanning the
full circumference of a straight pipe. The span of the
vortex generators above the duct surface, h, is approxi-
mately equal to the local turbulent boundary layer thick-hess, 6. Measurement of tluee-component mean flow ve-
locity in downstream crossplanes are used to characterizethe structure of the shed vortices. Measurements in ad-
jacent erossplanes (closely spaced along the streamwise
coordinate) characterize the interaction and decay of the
embedded vortices. A model constructed by the super-position of Oseen vortices is compared to the data forone test case.
Motivation and Research Objectives
Modem design characteristics of aircraft engine in-
lets, diffusers, and associated ducting components includelarge amounts of strenmwise curvatme coupled with rapid
axial variations in cross-sectional area. The flow perfor-
mance of these components is degraded by the devel-
opment of strong internal secondary flows and boundary
layer separations. Surface mounted vortex generators are
an effective means of alleviating these problems. Recent
experimental work at NASA Lewis has explored the strat-
egy of using vortex generator induced flows to counter
deleterious secondary flow development and boundary
layer separation inside a diffusing S-dueL 1 Dramatic im-
provements in total pressure recovery and exit plane flow
distortion were demonstrated. An experimental program
to test candidate designs for the new High Speed Research
*Resident Research Engineer at NASA Lewis, Cleve-
land Office, 7530 Lucerne Drive, Islander Two, Suite 100,Member AIAA.
*Associate Professor, Department of Mechanical En-
gineering, Member AIAA.*NASA Resident Research Associate at Lewis
Research Center and Graduate Student, Mechanical
Engineering Department at Iowa State University._pTaight O 1995 by e,,. _ Im6m_ d Atom*aries sad ,_na_, _- No
mpyright iJ amp.din the Um_d Sta_s madw "lfide 17, U_. Cede. The U.S. 0¢u_mzm hu
a m_dtF-fatc liamm m ¢_ffi_c all rigl_ macka-tlz mpytigl_t daim_ I_r_.n fur _
p_:_. All eta= ti#= _ _=,=ved by ,,-- oem_igat ewe=.
(HSR) diffuser is currently in the planning stages. Sur-
face mounted vortex generators are being considered as a
means of enhancing the performance of the HSR diffuser.
Arrays of vortex generators may be studied to deter-
mine what vortex generator size, spacing, and streamwise
location produces optimal flow conditions in a particular
duct operating at a particular condition. This can be done
experimentally, as in Reference 1. However, due to the
large number of poss_le vortex generator array parame-
ter variations, optimization may be best suited for com-
putational work. The effort required for a computational
study hinges on the manner in which the vortex gener-
ators are represented in the analysis. A particularly ef-
fective approach is to model the shed vortex immediately
downstream of the vortex generator, rather than model
the vortex generator by including it in the gridwork of
the duct. The advantage here lies in the fact that a newly
formed vortex may be accurately represented as a stream-
wise vorticity or crossplane velocity distribution having
a simple exponential form. This is the approach taken in
recent work by Anderson and Gibb, 2 and Anderson and
Farokhi, 3 where multiple vortex generator array geome-
tries in a diffusing S-duct inlet were examined using a
parabolized Navier-Stokes (PNS) solver. The crossplane
slxucmre of embedded vortices shed from vortex gener-
ators may be characterizedin terms of quantitiesknown
as vortex "descriptors". The modelled vortices are based
on these descriptors. Following the work of Westphal et
al. 4 we identify three descriptors:
I. Peak streamwise vorticity: _Orn,: is an indicationof vortex concenwation. The larger the magnitude
of peak vordcity, the thinner and more concentratedthe vortex structure.
2. The crossplane location of ¢ama=. This location
corresponds to the center of the vortex, the point
about which the vortex spins.
3. Circulation: F is a measure of the vortex strength.
In an ongoing research program at NASA Lewis, a
set of experimental studies are being conducted to acquire
the database necessary for simple analytical modelling of
all types of common vortex generators. A recently com-
pleted study on the sub-boundary layer scaled "wishbone"
vortex generator has provided detailed datasets and corre-
sponding descriptors for the modelling of this type of vor-
tex generator over a limited Mach number and Reynolds
number range: This paper describes a similar experimen-
tal study of blade or airfoil-type vortex generators. The

Flow
Sta. Sta.
0 2.29
Dimensions in Meters t
Six. St,, Sta. Sta.4.50 5.55 10.14 12.96
Figure 1 The Internal Fluid Mechanics Facility of NASA Lewis.
vortex generators are mounted in a symmetric counter-
rotating array which spans the full interior circumference
of a circular pipe. A thin tarbulent boundary layer is
developed upstream of this array. The boundary layerthickness, 6, is approximately 4% of the pipe diameter,
d, at the axial location of the vortex generators.
The primary objective of this study is to examinethe crossplane slructure and streamwise decay of vor-
tices shed from airfoil-type vortex generators. Vortex de-
scriptors are derived fxom crossplane measurements of
three-component mean flow velocities acquired with a
rake probe. Crossplane grid resolution is greater than in
previous studies, and axial separation (Az) between ad-jacent crossplanes is much finer, with Az _ 8. Simple
analytical models of the induced crossplune distributions
of velocity and vorticity are constructed with the vortex
descriptors. These will be compared against the data.
subsonic facility designed to investigate a variety of duct
flow phenomena. The facility, as it is configured for thistest, is illustrated in Figure 1. Air is supplied from the
surrounding test cell to a large settling chamber contain-
ing honeycomb and screens. At the downstream end ofthe settling chamber the airstream is accelerated through
a conWaction section (having a cross-sectioual area reduc-
tion of 59 to 1) to the test section duct. The test section
duct consists of a straight circular pipe of inside diame-
ter d = 20.4 cms. After exiting the test section duct theairstream enters a short conical diffuser and is then muted
to a discharge plenum which is continuously evacuated
by central exhaustex facilities. The Mach number rangein the test section duct is between 0.2 and 0.8 with cor-
responding Reynolds numbers (based on pipe diameter)between 0.95 and 3.80 million. Mass flows are between
3 and 7 kgs/sec. More information on the design and op-
eration of the IFMF may be found in the report of Portoet al. 6
Facilities and Procedures
Test Facility
This study is conducted in the Internal Fluid Me-
chanics Facility (IFMF) of NASA Lewis. The IFMF is a
Vortex Generator
Inlet Pipe
76.2 --
Flowm--==.l_
100.0
Duct [ Instrumentation Duct
34.3 -_" 127.0
' J_ae*e'_ c_r t
/.,
_\ Dimensions in Centimeters
A_ (x) ori_ of Coerdimt. S_tm
Figure 2 A cut-away sketch of the test section duct.
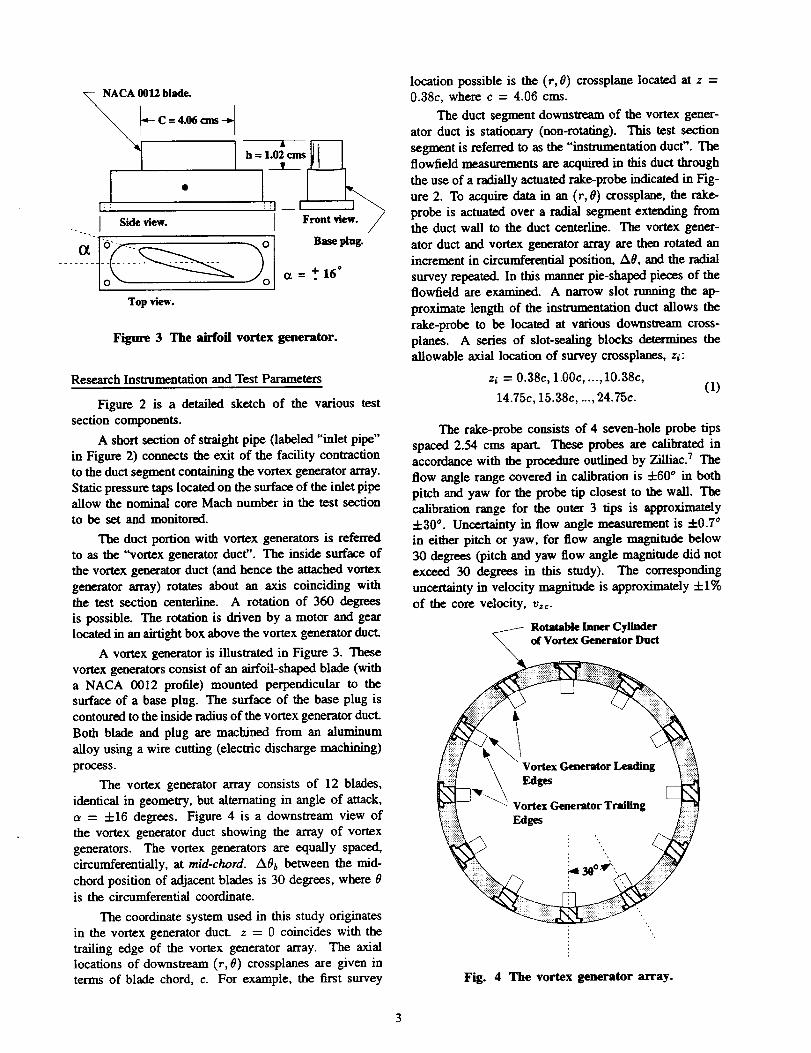
NACA0012blade.
I "[ Side view.p
Top view.
h = 1.02 cms
Front view. /
Base plug.
i _ = +16°
Figure 3 The airfoil vortex generator.
Research Instrumentation and Test Parameters
Figure 2 is a detailed sketch of the various test
section components.
A short section of straight pipe (labeled "inlet pipe"
in Figure 2) connects the exit of the facility contractionto the duct segment containing the vortex generator array.
Static pressure taps located on the surface of the inlet pipeallow the nominal core Mach number in the test section
to be set and monitored.
The duct portion with vortex generators is referredto as the "vortex generator duct". The inside surface of
the vortex generator duct (and hence the attached vortex
generator array) rotates about an axis coinciding withthe test section centerline. A rotation of 360 degrees
is possible. The rotation is driven by a motor and gear
located in an airtight box above the vortex generator duct.
A vortex generator is illustrated in Figure 3. These
vortex generators consist of an airfoil-shaped blade (with
a NACA 0012 profile) mounted perpendicular to thesurface of a base plug. The surface of the base plug is
contoured to the inside radius of the vortex generator duct.
Both blade and plug are machined flom an aluminum
alloy using a wire cutting (electric discharge machining)
process.
The vortex generator array consists of 12 blades,
identical in geometry, but alternating in angle of attack,
t_ = 4-16 degrees. Figure 4 is a downstream view of
the vortex generator duct showing the array of vortex
generators. The vortex generators are equally spaced,
circumferentially, at mid-chord. A0b between the mid-
chord position of adjacent blades is 30 degrees, where 0is the circumferential coordinate.
The coordinate system used in this study originates
in the vortex generator duct. z = 0 coincides with the
trailing edge of the vortex generator array. The axiallocations of downstleam (r, 0) crossplanes are given in
terms of blade chord, c. For example, the first survey
location possible is the (r, 0) crossplane located at z =0.38c, where c = 4.06 cms.
The duct segment downstream of the vortex gener-
ator duct is stationary (non-rotating). This test section
segment is referred to as the "instrumentation duct". Theflowfield measurements are acquired in this duct through
the use of a radially actuated rake-probe indicated in Fig-
ure 2. To acquire data in an (r, 0) crossplane, the rake-
probe is actuated over a radial segment extending fromthe duct wall to the duct centerline. The vortex gener-
ator duct and vortex generator array are then rotated an
increment in circumferential position, A0, and the radial
•survey repeated. In this manner pie-shaped pieces of the
flowfield are examined. A narrow slot running the ap-
proximate length of the instrumentation duct allows the
rake-probe to be located at various downstream cross-
planes. A series of slot-sealing blocks determines theallowable axial location of survey crossplanes, zi:
zi = 0.38c, 1.00c, ..., 10.38c,(1)
14.75c, 15.38c, ..., 24.7Bc.
The rake-probe consists of 4 seven-bole probe tips
spaced 2.54 cms apart. These probes are calibrated inaccordance with the procedure outlined by Zilliac. 7 The
flow angle range covered in calibration is 4-60 ° in both
pitch and yaw for the probe tip closest to the wall. The
calibration range for the outer 3 tips is approximately
+30 ° . Uncertainty in flow angle measurement is 4-0.7 °
in either pitch or yaw, for flow angle magnitude below30 degrees (pitch and yaw flow angle magnitude did not
exceed 30 degrees in this study). The corresponding
uncertainty in velocity magnitude is approximately 4-1%
of the core velocity, Vzc.
Rotatable Inner Cylinderof Vortex Generator Duct
Vortex Generator LeadingEdges
Vortex Generator TrailingEdges
_30o_ ',
Fig. 4 The vortex generator array.

Experimental Results
Figures 5a-k illustrate the experimental results. On
the left in Figure 5 are vector plots of crossplane (or
"transverse") velocity. The radial axis represents distance
from the wall, in centimeters, and the circumferential axis
represents angular position in degrees. In the middle
of Figure 5 are the corresponding contours of primary
velocity ratio, v,/vzc, where v=c _, 85 ndsec is the
core velocity of the pipe (this corresponds to a nominaltest section Mach number M = 0.25). On the right
hand side of Figure 5 are plots of streamwise vorticity.
These results are derived fIom the transverse velocity data
following the relation:
6ve ve 1 6v_wz = "_r -t- (2)r r 6e'
where w2 is the streamwise component of vorticity, and
(v,, v0) are the transverse components of velocity inthe radial and circumferential coordinates, respectively.
Finite difference formulas are used to represent the spatial
derivatives in Eq. (2). Solid contour lines represent
negative vortieity, dashed lines are positive. The axial
location of each crossplane is indicated in Figure 5.
0 _grccs
95 85zes I F ts
• , _ t- _ _ , , -• ". ; _ _ _ , : : :
O.'--_,_f,,, ? " ". , • . . * , , , -V__tHi. :. :• . . _ , , ,_j,,_,_ ; ,,, :
(dVZ-r) cms
95 85 9,$ 85
Sa) z = 0.38c
95 &$ 85 95 85
, , , • . . _ '' :' " '• , . • . ..,,. .... . , , . .,--, _,,......,!_[_! ,,,,I • • ". ' , '_ ........... : . , , , I.@ I._
o °-°
5c) z = 1.62c
95 &_ 95 &f 95 85
.. I ts zes I I 7s _es I I 7s
\-_\ _!_!!!_[1//// . It \ _.., _,\\\',,-__ \ .".-'--) \ "_'\,",
5d) z = 2.2_
95 85 95 85 95 8..;
105 ' , 75 lOS _. ' __..._
o.o-_-iiL,,_,., o.o• • . . • , ,,,_' _". , ,f-- e.O
::.. .. .. .. . ; . ;,[,,.o-\, ,,• . . . . • , ,,, ....... o# o o_ _ •
_L_ :-- ..... 7''::::: ,' : : . Z=3._ 2
Figure 5 Velocity and streamwise vorticity results. (Continued...)

95 85 95 85 95 S5
105 I . I 75 105 _ L_ 75 I____L............_ I 75
(d/2-r) cms 51)z = 4.75c
95 S5 95 85 95 S5
105 _ /5 105 __]. _ ..105__. _....]__o,..o ./!/! ,.o ,.o "--"_,-_..(d/2-r) cms 5g) z = 6.00c
95 85 95 85 95 85
00"_'----. . '- '. . '. :, ::::':::::.:.',_,_;; : 0.0 0.0
• .0"_--.-\-" \..'- ' . " • " "_='-"_,_-_i ,
:.:.........:-..t__7_,7-_,.,,,, Lttt .....,, ,, -_......... -_ ( [
• " ". ' " " t _ '"°_" -,,_lli/tilX"-kttt :., ,.o ,\ '. : :.--:-: ........::....tiff',, _"_"
• ...... : : ........... ,;,,o,,,.3.0.,_ " . . < .-. : ,,
5h) z = S.50c
95 85 95 85 95 85
105 __1 f_ 105 _ 75 I05 _...__, I _• .:::iiiii:::".-. - -- .......
•.. -. . . . - ........ .',_.,,- .... _ _, ,
=.o&".%/:::i!!!!!'"-;'-']/lll.li_.°Jt_°_ <,\\\\<_//( _'°Jt.',_J. J]_l_ ,:- : : :--::::::::'.h t_," " "\--.-..- -:-........:,,ill:,: \ \',,\\\_"<" ____'"" _'_/I/:
,.0%-.-_-.::::::::::::::::::::: ,.o_ __ _.o%_..,_ ,-.<,_.-,>--\--.- ::::::::::::::::::::::: \ _ _ @
_.o"_ 4.o-'_ 4,o"_ ,,5i) z = 10.38c
95 85 95 85 95 85
oo ii o.o___ o.o_-_'-::::_ >_
z.o . .. :.,. : :.. :-: :: _,,';:: z.o 2.o -,oo.-, "2.0 - ." .," ,, .',ll ",,
.... , .... . .::.. :s; +/s,' : : ,,_•,.-" . .... ::..:',,_._ _i_.
,.o-_:-...:-.-..-........ ,.o% \kk\_ ,.o_ _ . /,,,-: .... : ..... :',,,,_,,
5j) z = 14,75(:
Figure 5 Velocity and streamwise vorticity results. (Continued ... )

95 85 95 85 95 85
:-:-.. - ,.,
3om_.c--* Sk) z = 17.25,:
Figure 5 Velocity and streamwise vorticity results.
Crossplane grid resolution for these surveys is based
on the size of the vortex core. At axial locations just
downstream of the vortex generator the vortex core is
small and highly concentrated with large secondary ve-
locities present. To properly capture vortex structure the
grid resolution must be greater here than at locations far
downstream where the developing core has grown largerand more diffuse. Thus, in Figures 5a-h, Ar = 1.3 nun
and A0 = 1.0 degree in the vicinity of the core; and
in Figures 5i-k, Ar = 1.7 mm and A0 = 1.5 degrees.
Although the full pie-sector (firom pipe wall to center-line) was surveyed, only the portion of the grid closest to
the wall and embedded vortex is plotted. This is done to
save space in Figure 5. The survey grid covers somewhatmore than a 30 degree sector of the pipe cross-section.
A 30 degree sector coincides with the circumferential do-main occupied by one vortex generator (hence the single
vortex observed in each of the crossplane plots of Fig-
ate 5). For the counter-rotating arrangement of vortex
generators tested in this study the full flowiield is (ide-ally) a 12 unit multiple of this pie-sector, alternating in
the rotation of the shed vortex from one 30 degree sector
to the next. The circumferential component of velocity
(v0), and hence the crossflow, is expected to vanish at
the boundaries of the pie-sector where the influence ofthe neighboring vortex begins. We note from Figure 5
(particularly Figures 5e-k) this is approximately the case,with the boundary between the domain of the illustrated
vortex and the domain of its nearest neighbor located at
0 -- 79 or 80 °. A portion ofthe adjacent sector (0 _< 80 °)
and neighboring vortex is visible in Figure 5. The illus-
trated vortex and its neighbor constitute an up]tow pair
of counter-rotating vortices. Upflow pairs have a strong
tendency to pull together and lift away from the wall, and
this is clearly evident in Figure 5.
In Figures 5a-b we see a s_rong, concentrated vortex
structure. At the z ----1.00c position (Figure 5b) contours
of primary velocity ratio show two distinct regions of
v_ deficit in the vicinity of the vortex core. One region
appears to be a convection of low momentum boundarylayer fluid found near the wall and wrapping around the
core on the fight-hand side; the other region is associ-
ated with the central portion of the vortex core. This
characteristic double deficit persists downstream of the
z = 1.00c position. Interestingly, however, the centralcore vz deficit is not nearly as pronounced further up-
stream at the z = 0.38c position. Here the central or
core primary velocity strUCaLr¢ is much more complex,
with what appears to be two separate deficit regions. The
primary velocity ratio contours in Figure 5 also illus-trate the altemam thinning and thickening of the bound-
ary layer in the core downwash and upwash, respectively.
The upwelling of boundary layer fluid produced by thestrong convection of the torturer-rotating vortex pair is
quite pronounced at the downstream survey locations. In
Figure 5k an indication of the crossplane profile of the
vortex generator is provided. The cruciform of dashed
lines identifies the trailing edge tip.
The three previously defined structural descriptors
of the embedded vortex originate from the streamwise
vorticity and transverse velocity data in the crossplane.
_,_ is located at some grid point having coordinates
(r,_a_, 0,r,ax)- The vortex circulation F is calculated by
first isolating the region of core vorticity in the data field.This is done by referring to the contour plots of vorticity
in Figure 5. A path enclosing the region of core vorticity
is defined. The outer boundary of the core is taken to be
the location where streamwise vorticity is 1% of the peak
core value. The circulation is then calculated according
to:
V- ds, (3)
path
where V is the velocity vector in the crossplane, and
s refers to the path coordinate. By using closed paths
composed of line segments in the r or 0 coordinate
directions the circulation is easily determined.

AxialLocation,7/c Circulation PeakVort_ CrossplaneLocationof Pmd_Yortidty
m2/sec sec'l (cms,deg)*
KineticF_merl_Ratio
lmviscidAirfd TheoryEst. .0.753 -- (1.02,90.5)**0.38 -0.733 -34655 (0.,89,93) 0.00781.00 -0.722 .-3_14 (0.89,92) 0.00721.62 -0.698 .33896 (0.89,91) 0.00672.25 -0.688 -30488 (0.1t9,90) 0.00643.SO .O.671 -242SS (o.sg,ss) O.OOS7
41.75 -0.663 -22807 (1.02,g6) 0.00506.00 -0.646 -19179 (1.27,85) 0.0045
&SO -0..$96 -10679 (1.78,_1) 0.0034
10.38 -0.$43 -6606 (2.29,84) 0.0028
14.75 -0.40S -2748 (2.79_SO') 0.001417.25 -0.360 -1766 (2.79,86) 0.0010
Uncertainty +. 0.007 + 225 + (0.04,0.3) 4-.0.0003
• l-m_¢dmmmI_s (d_r,Urns)wbcr¢d=20.4¢ms=i_p¢m_._. 0"Trdlmg¢dg¢ttpotvortexgemmrstor.
Table I - The decay of the symmetric array.
In addition to the vortex descriptors, an integral
parameter known as the "kinetic energy ratio" (/_) is alsocalculated for each orossplane data grid. /z is defined asfollows:
= KEt/KE,,
¼//KEt = p(v,. -t- v_) dA,
1
(4)
where p is the fluid density, and A_ is the area ofa 30 degree pie-sector in the pipe. Table 1 fists the
three descriptors, and kinetic energy ratio for the vortexcaptured in the 11 crossplane grids shown in Figure 5.The units of Table 1 are SL The "inviscid airfoil theory"estimate of vortex circulation is derived from Prandtl's s
result for a wing of elliptical planform:
P = _'cv_a (5)1 + 2/AR'
where the aspect ratio of the vortex generator is AR =
4x span�re. Note that when performing this calculation,
use span = 2h (refer to Figure 3), due to the wall effect
or "image vortex generator". Uncertainty estimates for all
listed quantities are given in Table 1. These are derived
by combining the uncertainties in measured velocities
and probe placement in accordance with the procedure
outlined by Moffat. 9
The results listed in Table 1 are plotted in Figures
6 a-c.
Figure 6a plots the axial distribution of embedded
vortex circulation. The shape of the curve demonstratestwo mechanisms of circulation decay affecting the em-bedded vortex. This is similar to what is outlined in an
earlier study on the decay behavior of embedded vortex
arrays on a flat plate. 1° Just downstream of the vortex
generator, the viscous vortex core is close to the wall and
isolated (by surrounding regions of near-zero streamwise
vorticity) from neighboring vorticies. Refer to Figures5a-d. The dominant mechanism of circulation decay is
through the action of wall friction, which sets up a span-
wise component of wall shear stress opposing the ro-tation of the core. As the neighbor vortex core draws
near and lifts the vortex away from the wall, the rate of
circulation decay due to wall friction effects drops (Fig-
ures 5e-f). When the core vorticity profiles of vortex and
neighbor begin to "touch" (recall that they are of opposite
sign) another mechanism of circulation decay begins todominate (Figures 5g-k). This is circulation loss through
vorticity diffusion across core boundaries. Rapid losses
in circulation, peak vorticity, and kinetic energy ratio oc-cur downstream of the location where this mechanism of
circulation decay is prominent.
Figures 6b-c plot the decay of peak vorticity and
kinetic energy ratio as given in Table 1.
Modelling Results
The large number of parameters to consider when
designing a vortex generator array for an aircraft com-
ponent, such as a wing or inlet, has the implication that
experimental work on optimum array geometries is of-
ten slow and expensive. This fact has motivated a few
workers in computational fluid mechanics to assist in the
optimizing problem by including a means of representing
vortex generators in their codes. A simple and effectivemeans of doing this is to employ a model for the cross-
plane velocity or vorticity field induced by the generators.
This is the approach taken in recent work by Andersonet al. 3"2 who examined multiple vortex generator array
geometries in a diffusing S-duct inlet using a parabolizedNavier-Stokes (RNS) solver. A similar inclusion of em-
bedded vortices in a full Navier-Stokes (FNS) code was

implementedbyChoandGreber 11 for a constant area cir-
cular duct and a diffusing S-duct geometry. The advan-
tage of this approach lies in the fact that a newly formed
vortex may be accurately represented in this manner.
Experimental workers concerned with embedded
vortices have often noticed the close similarity of
observed crossplane vortex structure to simple two-
dimensional models of vortices. Inviscid or "potential"
models were first applied to results obtained in subsonicdiffusers by Grose and Taylor./2 Later, Pearcy 13 would
develop embedded vortex interaction models based on
the inviscid representation of embedded vortex sU_cture.
Eibeck and Eaton 14compared the structme of a single em-
bedded vortex to that of the patchwork "Rankine" model
vortex. Studies by Pauley and Eaton 15 and Wen& et
0.8
0
i_ 0.2
0.0
4x10⁴
0
N
e:
0.4
o.2
.... i .... t .... I
5 10 15
i i J
20
b)
5 10 15 20
0.8 : " ' " _ _ '
c)
0.0 , , J , T i , , , i , , , ....
Axial Distancefrom VG Trailing EdgeTip, VG Chordlengths
Figure 6 Decay Behavior of the Symmetric Array.
aLtO. 16 have made comparisons to the "'ideal viscous" or"Oseen" model.
Let us now examine the equations of the Oseen
vortex and show how the array of embedded vortices
examined in this study may be represented using a simplyconstructed model based on this vortex.
The Oseen Model of the Embedded Vortex Array
The two-dimensional Oseen model of a viscous vor-
tex represents the time dependent decay of a potential
vortex where the velocity at the origin (r = O) is forced
to zero at time t = 0. A single isolated vortex cen-
tered on the crossplane origin has velocity components
(in cylindrical coordinates):
_']r "-" 01
(6)
where F is the vortex circulation and u the laminar
coefficient of kinematic viscosity. Following Squire 17
the unsteady solution is transformed to a steady one by
relating the decay time to the distance between the vortex
generator tip and the crossplane of interest (z - z0):
Z -- Z 0
t ._ _ (7)Uoo
For an isolated turbulent vortex i located at:
(zi, Yi = ri cos Oi, ri sin Oi) (8)
the velocity components in the crossplane can be written
in terms of the vortex descriptors. 18 In cartesian coor-dinates:
r,(x- _i)
_- _-_ r,, (9)I',(y- _)
w_ = 2_rR_ F_I
where:
ny = (_ - x_)2 + (y - u,)_, (10)
and:7r_3m ax 2
The vorticity field is given by:
(11)
w_ -- w'_a=(1 - Fi). (12)
We can superimpose solutions for a representation of the
pipe wall and other array vortices. Figure 7 illustrates
this construction. Each of the 12 vortices in the array
is located a distance R_ from the pipe centerline. To
represent the influence of the wall on each vortex in the
array, an image vortex is superimposed a distance R.., =R_/Rv in accordance with the procedure outlinedby
Mihle-Thomson. 19 The angle e = 30 ° for all test cases in
this study. In each test case, the descriptors of all vortices

and images are determined from symmetry followingTable 1 and Figure 7. For example, the angle _ between
the center of the vortex and the line of flowfield symmetry
between upflow vortices is repeated at regular intervals
around the pipe. Also, the magnitude of circulation
and peak vorticity is assumed to be the same for all
vortices and images in each test case, differing only in
sign, depending on the rotation of the vortex or imagevortex. With these constraints on the array geometry the
equations of the model are simply:
12
12 m E(1)i "]- 12i ira),
i=l
12
11) = E (113i + Wiira)'
i_--1
(13)
where the i im subscript denotes the appropriate expres-
sion from Equations 9-11 for the image vortex i.
Data and Model Comparisons
The data and model are compared at the z = 1.00
chord survey position. The vortex descriptors are taken
directly from Table 1 and used in Equation 13. Fig-ures 8a-b illustrate the resulting comparison. Figure 8a
compares the transverse velocity and streamwise vorticityfields of the data (top) and model (bottom) vortex arrays.
Note the close similarity of the transverse velocity fields.
Since the model is two-dimensional, representation of the
secondary (or "wall") generation of opposite-sign vortic-
ity, found in the data, is not possible. This is evident in
the comparisons of the streamwise vorticity fields. Define
"--..%
¢,
Pipe
o.O.o'°
R im -- R2/Rv
Figure 7 The construction of an Oseen model of an
array of 12 symmetrically placed vortices in a pipe.
a fit parameter based on the transverse velocity:
(14)
Figure 8b is a contour plot of this parameter over the
survey grid The shaded areas represent regions where
the fit parameter exceeds 1.00 (or "100 percent"). Lim-
ited probe resolution of the weak velocities in these areas
8 _lqmm @ dllm.
95 115 95 I_
, x..fc.'y"--_ ,
_a
3.°"
41.0_
data
model e _ e9_5 Ikq 95 g3
an.o.. : "..-":::::::::::: i.
" :.:.--'"i::::::_i_!! _i_...__ • 3"°o_
a) Transverse Velocity and Streamwise Vorticity Comparisons
95 g5 0,_nmles ) I_ 7s
, ,4.1 _De,mm_ Ilmmm ,,,-,d"
b) Contours of Fit Parameter
Figure 8 A comparison of the data and model a) data and model transverse velocityand streamwise vorticity fields, b) contours of the fit parameter (Equation 14).

is the most probable cause of the large discrepancies. It
is encouraging to note that where the convective effects
of the vortex are strongest the model best represents the
data. The viscous core, the region of strong crossflow
underneath the core, and the upwash and downwash re-
gions to either side, ate all within the 40 percent contourof the fit pamn_ter.
Summary
An experimentalstudyisconducted toexamine the
crossplaneflow stxucture,interaction,and streamwisede-
cay of an arrayof counter-rotatinglongitudinalvortices
embedded ina turbulentboundary layeron the wall of
a straightpipe. The vorticesare shed from a symmet-
ricarrayof NACA 0012 airfoilvortexgenerators.The
span of the vortex generators above the flow surface, h,
is approximately equal to the localboundary layer thick-
ness, 6. The ratio of boundary layer thickness to pipe
diameter is 6/d = 0.04, and the core Mach number =
0.25. Measurements of mean three-component velocities
in downstream crossplanes are used to characterize thestructure of the shed vortices. Measurements in adjacent
crossplanes, closely spaced along the axial coordinate,characterize the vortex-to-vortexand vortex-to-wallin-
teractionand streamwisedecay of vortexstructure.
Downstream of thevortexgenerators,theshed vor-
ticesare observed forming upflow pairs. The convec-
tive effects of each vortex on its neighbor drive the pairaway from the wall, initially mitigating the wall-fiiction
driven decay of circulation and peak vorticity. Further
downstream, the rate of decay is enhanced when vortic-
ity diffusion occurs across core boundaries in the closely
spaced vortex pairs.
The velocity field of the embedded vortex is well
represented with a model constructed by the superpositionof Os_n vortices. Variation in the transverse vector
field between the data and model is less than 40 percentin crossplane regions containing the vortex core, vortex
downwash, upwash, and near-wall crossflows.
Future Work
This study will be extended to examine the depen-
dence of vortex generator geometry (h, c, a) and imping-
ing flow conditions (Mach, 6) on the shed vortex de-
scriptors. A paper on this topic should be ready earlyin 1996.
Acknowledgements
This project was supported with funding from NASALewis and the National Research Council. The authors
would like to acknowledge the mechanical skills of Bill
Darby and Bob Ehrbar (NASA's Test Installation Di-
vision) and the systems engineering supportof Robert
Gronski (NYMA). Charles Wasserbauer (also of NYMA)
provided engineering and operational support. Design
engineering service was provided by Arthur Sprungle of
NASA Lewis. Dr. Warren R. Hingst provided valuable
insight into the test section design. A special thank you
to Bernie Anderson, whose vortex generator computa-
tiousaided greatly in determiningthe gridlocationand
resolutionforthisstudy,and toMr. R. Brautiganforhis
insights.
References
1Reichert, B. A. and Wendt, B. J., "Improving Diffusing
S-Duct Performance by Secondary Flow Control," AIAA
Paper 94-0365, Jan. 1994.
2Anderson, B. H. and Gibb, J., "Application of Com-
putational Fluid Dynamics to the Study of Vortex Flow
Control for the Management of Inlet Distortion," AIAA
Paper 92-3177, July 1992.
3Anderson, B. H. and Farokhi, S., "A Study of Three
Dimensional Turbulent Boundary Layer Separation andVortexFlow ControlUsing the Reduced Navier-Stokes
Equations," Turbulent Shear Flow Symposium tech. rep.,1991.
4Westphal, R. V., Pauley, W. R., and Eaton, J. K.,
"Interaction Between a Vortex and a Turbulent Boundary
Layer-Part 1: Mean Flow Evolution and Turbulence
Properties," NASA TM 88361, Jan. 1987.
5Wendt, B. J. and Hingst, W. R., "Measurements and
Modeling of Flow Structure in the Wake of a Low Profile
Wishbone Vortex Generat_r," AIAA Paper 94-0620, Jan.1994.
6Porro, A. R., Hingst, W. R., Wasserbaner, C. A., and
Andrews, T. B., "The NASA Lewis Research Center
Internal Fluid Mechanics Facility," NASA TM 105187,
Sept. 1991.
7Zilliac, G. G., "Modelling, Calibration, and Error Anal-
ysis of Seven-Hole Probes," Experiments in Fluids,
Vol. 14, 1993, pp. 104-120.
s Prandtl, L., "Applications of Modem Hydrodynamics to
Aeronautics," NACA Report 116, 1921.
9 Moffat, R. J., "Contributions to the Theory of Single-
Sample Uncertainty Analysis," Transactions of the ASME,
Vol. 104, June 1982, pp. 250-258.
l°Wendt, B. J., Greber, I., and Hingst, W. R., "The
Structure and Development of Streamwise Vortex Arrays
Embedded in a Turbulent Boundary Layer," AIAA Paper92-0551, Jan. 1992.
11Cho, S. Y. and Greber, I., Three Dimensional Com-
pressible Turbulent Flow Computations for a Diffusing
S-Duct With/Without Vortex Generators, Ph.D. Disserta-
tion, Case Western Reserve University, Cleveland, OH,Nov. 1992.
12 CJrose, R. M. and Taylor, H. D., "Theoretical and Exper-
imental Investigation of Various Types of Vortex Gener-
10

ators," United Aircraft Corporation Research Department
Report R-15362-5, East Hartford, CT, Mar. 1954.
13Pearcy, H. H., "Shock-lnduced Separation and its
Prevention by Design and Boundary Layer Control,"
Boundary Layer and Flow Control, Vol. 2, edited by G. V.
Lachmann, Pergamon Press, New York, 1961, pp. 1166-1344.
t4Eibeck, P. A. and Eaton, J. K., "An Experimental In-
vestigation of the Heat-Transfer Effects of a Longitudinal
Vortex Embedded in a Turbulent Boundary Layer," Stan-
ford University Tech. Rep. MD-48, Stanford, CA, Nov.
1985.
ISpauley, W. R. and Eaton, J. K., "The Fluid Dynamicsand Heat Transfer Effects of Streamwise Vortices Embed-
ded in a Turbulent Boundary Layer," Stanford University
Tech. Rep. MD-51, Stanford, CA, Aug. 1988.
16Wendt, B. J. and Hingst, W. R., "Flow Structure in the
Wake of a Wishbone Vortex Generator," A/AA Journal,
Vol. 32, Nov. 1994, pp. 2234--2240.
17Squire, H. H., "The Growth of a Vortex in Turbulent
Flow," Aeronautical Quarterly, Vol. 16, Aug. 1965,
pp. 302-306.
ISWendt, B. J., Greber, I., and Hingst, W. R., "The
Structure and Development of Streamwise Vortex Arrays
Embedded in a Turbulent Boundary Layer," NASA TM
105211, Sept. 1991.
19Milne-Thomson, L. M., Theoretical Hydrodynamics,
4th ed., Macmillan, New York, 1960.
11

FormAp/xovealREPORT DOCUMENTATION PAGE OMBNo.07040188
Public reporling burdenfor this collectionof Informationis mtirnaled to average 1 hour Per msponx, includingthe t_rnefor reviewing Instrucllom, searchinge_islingdata soumu,gathering am¢lmaintainingthe dam needed, and completingand reviewingthe colleclk_ of Information. Send oommentsregardingins berden esdmme or any other aspect of this
of inlormat_, including suggmtlam tot reducingthis burden, to Washhgton Hemquamms Sendc:m. Dkectorste far Informant Oper_ons and Reports. 1215 Jeffenm,Davis Highway, Suite 1204, AtI_ton, VA 22202-4302. and to the Office of M_t and Budget,Papemork ReductionPro_ect(0704-0188), Washlngloe, DC 20503.
! 1. AGENCY USE ONLY (Leave b/ank) 2- REPORT DATE :L REPORT TYPE AND DATES COVERED
June 1995 Final Contractor Report
4. TITLE AND SUBTITLE 5. FUNDING NUMBERS
The Decay of Longitudinal Vortices Shed From Airfoil Vortex Generators
6. AUTHOR(S)
Bruce J. Wendt, Bruce A. Reichert, and Jeffry D. Foster
7. PERFORMINGORGANIZATIONNAME(S)ANDADDRESSES)
Modem Technologies CorporationCleveland Office
7530 LucerneDrive
Islander Two, Suite 100
Middleburg Heights, Ohio 44130
9. SPONSORING/MONITORINGAGENCYNAME(S)ANDADDRESS(ES)
National Aeronautics and Space AdministrationLewis Research Center
Cleveland, Ohio 44135-3191
WU-505--62-52
C-NAS3-27377
8. PERFORMING ORGANIZATIONREPORT NUMBER
E-9730
lO. SPONSORING41ONITORINGAGENCY REPORT NUMBER
NASA CR- 198356
AIAA-95-1797
11. SUPPLEMENTARY NOTES
P_ for the 13Zh AppUcdAemdymmmcs Co_enmce spom4m_d by the American ]nsdlme of Aem_udcs and Amoamzd_ Sm _go, California,
June 19--22, 1995. Bmoe J. Wendt, Modem Technologies Cmpotatioo, 7530 Lucerne Ddve, Idander Two. Suite 100, Middelmrg Heighra. Ohio 44130
(x_rch stam:d while Natioual Research Cotmdl--NASA Research Associate at Lewis Reseax_ Center); Brace A. Reichert, Kansas State Univendty,
Depmtmmt Of Mechanical Engineering, Manhattan, Kansas 66502; lettry D. F-ostea', Iowa State Univendty, Mechanical Engineering Dqmmnem, Ames,
Iowa 50010 =nd NASA Rmidem Reteateh Asux£ue at Lewis Re_trch Center. Project Manager, ldm M. Abbott, Intenud Fluid Mechanics Divition,
orgmiza6on code 2660, (216) 433-3607.
12a. DISTRIBUTION/AVAILABILITY STATEMENT
Unclassified -Unlimited
Subject Category 02
This publication is available from the NASA Center for Aerm'lm_ Information, (301) 621--0390.
12b. DISTRIBUTION CODE
13. ABSTRACT (Max/mum200 morals)
An experimental study is conducted to examine the crossplane struelnre and streamwise decay of vortices shed fiomairfoil-type vortex generators. The vortex generators are set in a counter-rolaling array spanning the full circumference of
a straight pipe. The span of the vortex generators above the duct surface, h, is approximately equal to the local turbulent
boundary layer thickness, 8. Measurement of three-component mean flow velocity in downstream crossplanes are used tocharacterize the structure of the shed vortices. Measurements in adjacent crossplanes (closely spaced along the
streamwise coordinate) characterize the interaction and decay of the embedded vortices. A model constructed by the
superposition of Oseen vortices is compared to the data for one test case.
14. SUBJECT TERMS
Vortices; Vortex generators; Three dimensional boundary layer
17. SECURITY CLASSIFICATION
OF REPORT
Unclassified
NSN 7540-01-280-5500
18. SECURITY CLASSIFICATIONOF THIS PAGE
Unclassified
19. SECURITY CLASSIFICATION
OF ABSTRACT
Unclassified
15. NUMBER OF PAGES
1316. PmCE CODE
A0320. LIMITATION OF ABSTRACT
Standard Form 298 (Rev. 2-89)
Prescribed by ANSI Std. Z39-182ge-102