the corporate digital divide: determinants of internet adoption
TRANSCRIPT

This article was downloaded by: [140.120.135.222] On: 12 April 2014, At: 08:21Publisher: Institute for Operations Research and the Management Sciences (INFORMS)INFORMS is located in Maryland, USA
Management Science
Publication details, including instructions for authors and subscription information:http://pubsonline.informs.org
The Corporate Digital Divide: Determinants of InternetAdoptionChris Forman,
To cite this article:Chris Forman, (2005) The Corporate Digital Divide: Determinants of Internet Adoption. Management Science 51(4):641-654.http://dx.doi.org/10.1287/mnsc.1040.0343
Full terms and conditions of use: http://pubsonline.informs.org/page/terms-and-conditions
This article may be used only for the purposes of research, teaching, and/or private study. Commercial useor systematic downloading (by robots or other automatic processes) is prohibited without explicit Publisherapproval. For more information, contact [email protected].
The Publisher does not warrant or guarantee the article’s accuracy, completeness, merchantability, fitnessfor a particular purpose, or non-infringement. Descriptions of, or references to, products or publications, orinclusion of an advertisement in this article, neither constitutes nor implies a guarantee, endorsement, orsupport of claims made of that product, publication, or service.
© 2005 INFORMS
Please scroll down for article—it is on subsequent pages
INFORMS is the largest professional society in the world for professionals in the fields of operations research, managementscience, and analytics.For more information on INFORMS, its publications, membership, or meetings visit http://www.informs.org
MANAGEMENT SCIENCEVol. 51, No. 4, April 2005, pp. 641–654issn 0025-1909 �eissn 1526-5501 �05 �5104 �0641
informs ®
doi 10.1287/mnsc.1040.0343©2005 INFORMS
The Corporate Digital Divide:Determinants of Internet Adoption
Chris FormanTepper School of Business, Carnegie Mellon University, Pittsburgh, Pennsylvania 15213, [email protected]
The diffusion of Internet technology among firms is widely considered to be one of the primary factors behindthe rapid economic growth of the 1990s. However, little systematic study has examined the variation in firm
decisions to adopt the Internet. I explore the sources of this variation by examining Internet adoption decisionsin a very large sample of organizations in the finance and services sector in 1998.I show how prior information technology (IT) investments and workplace organization decisions affect the
returns to adopting simple and complex Internet technologies. I show that recent investments in client/server(C/S) networking applications have competing effects on the likelihood of Internet adoption. Such investmentscan slow adoption by acting as a short-run substitute or by creating “switching costs.” Geographic dispersionof employees is complementary with Internet adoption, suggesting that Internet technology lowered internalcoordination costs. Increases in organization size and external pressure also increase the likelihood of adoption.
Key words : adoption; Internet; discrete choiceHistory : Accepted by Rajiv D. Banker, information systems; received September 5, 2002. This paper was withthe author 4 months for 2 revisions.
1. IntroductionThe diffusion of Internet technology is widely consid-ered to be one of the primary factors behind the rapideconomic growth of the late 1990s and responsible fortransforming the way many firms now conduct busi-ness. In part because of the Internet’s growth, indus-try spending on information technology (IT) rose from$142 billion in 1993 to $233 billion in 1998 (Margherioet al. 1998). Despite the importance of this technol-ogy, however, a surprising number of firms still hadnot adopted the Internet, even several years after itscommercialization. According to my findings, 78% oforganizations had adopted basic Internet access by1998, and only 29% had adopted advanced applica-tions such as e-commerce (Figure 1). What was respon-sible for this variation in firm decisions to adopt theInternet? Despite the wealth of research on the Inter-net, this question has not been widely explored.Recent research in the information systems (IS) and
economics literatures has emphasized how prior ITinvestments and new forms of workplace organi-zation may be complementary with investments innew IT (e.g., Bresnahan et al. 2002). In this paper,I examine the importance of such complementari-ties in a particular environment: how prior IT invest-ments and workplace organization decisions affectedthe returns to adopting simple and complex Internettechnologies.This research makes important contributions to two
fields of research. First, it represents a contribution tothe diffusion of innovations (DOI) literature (Rogers
1995) by developing and testing unique hypotheses.I explore the possibility that recent IT investment canreduce the returns to adopting new technology. Exist-ing IS research has argued that recent IT investmentswould lower technical and organizational barriersto adopting new IT (e.g., Raymond and Paré 1992,Swanson 1994), thereby leading to a complementaritybetween recent IT investments and adoption of newtechnologies. However, such investments could alsoslow adoption by acting as a short-run substitute orby creating switching costs (Klemperer 1995) if theorganization has made complementary technical ororganizational investments that are specific to the oldtechnology. Moreover, by observing the adoption pat-terns of geographically concentrated and dispersedfirms, I examine whether the Internet helped firms toreduce communication and coordination costs createdby geographic distance, a result that would suggestthe presence of complementarity between geographicdispersion and Internet adoption.Second, this work contributes to the literature
on commercial Internet adoption. Prior research hasstudied commercial Internet adoption (e.g., Tan andTeo 1998, Zhu et al. 2002) and diffusion (e.g.,Whinston et al. 2001). However, this study is uniquein its use of detailed microdata in a sample of morethan 6,000 organizations in the United States. Thislarge, yet highly detailed, data set permits me to testhypotheses related to complementary organizational
641
Dow
nloa
ded
from
info
rms.
org
by [
140.
120.
135.
222]
on
12 A
pril
2014
, at 0
8:21
. Fo
r pe
rson
al u
se o
nly,
all
righ
ts r
eser
ved.
Forman: Determinants of Internet Adoption642 Management Science 51(4), pp. 641–654, © 2005 INFORMS
Figure 1 Percentage of Organizations Adopting Internet Technologies
0
20
40
60
80
100
1996 1997 1998
Access Applications
investments that have been unexplored by otherauthors. Moreover, unlike prior authors, I focus onadoption of simple Internet technologies such as basicaccess, which represent the bulk of Internet invest-ments over my sample period.To predict whether organizations adopt the Inter-
net, I develop a set of hypotheses relating to the costsand benefits of adoption. To investigate the causes ofvariation of Internet adoption, I estimate a discretechoice model of organizational decisions to adoptsimple and complex Internet technologies. I then usethese results to determine whether the empirical evi-dence supports each hypothesis. I analyze a sampleof more than 6,000 organizations that were surveyedby Harte Hanks Market Intelligence in 1998 and areconcentrated primarily in the finance, insurance, realestate (FIRE), and services sectors.Overall, I find that the net impact of recent IT
investments on Internet adoption was mixed anddepended on the complexity of the installed base oftechnologies. For many organizations with complexIT infrastructures, I show that recent client/server(C/S) investments reduced the likelihood of Internetadoption. Moreover, I provide evidence of com-plementarities between geographic dispersion andInternet adoption. Consistent with prior work in theDOI literature, I further show that Internet adop-tion was increasing in organization size and externalpressure. Overall, I show that there was significantvariation in the presence of complementary IT invest-ments and workplace organization practices in thelate 1990s. This variation, in turn, led to an unevenpattern of adoption across firms.
2. Framework and HypothesesAs a general purpose technology (GPT) (Bresnahanand Trajtenberg 1995), Internet technology wasapplied in different ways across heterogeneous orga-nizational contexts. I examine the simultaneous deci-sion to adopt two types of Internet technologies:one simple and one complex. The simple technol-ogy, basic Internet access, was technologically matureand required little adaptation of business processesby organizations. The second type of technology,which included applications such as business-to-business and business-to-consumer e-commerce, wasmuch more complex and technically difficult to imple-ment. As such, it involved costly changes to existing
business processes. Because this second type repre-sented applications of Internet technology to commer-cial practices, I label this more complex technology“Internet applications.”As with other GPTs, organizations faced idiosyn-
cratic short-run circumstances that affected their costsand benefits of adopting the new technology. Thesecircumstances varied based on prior technologicalinvestments and workplace decisions. I observe asnapshot of adoption decisions as of 1998 and exa-mine how variation in complementary organizationalinvestments affected organizations’ short-run demandfor these two sets of technologies. Because mostInternet investments during this period involved sim-ple Internet access (Figure 1), I focus primarily onhypotheses that affect the returns to adopting access.Although other factors may have been important,prior network investments and the geographic spreadof employees proved to be among the most importantfactors affecting adoption of a new communicationtechnology. Because of data limitations, I am unable toobserve how certain organizational factors—for exam-ple, managerial influences (e.g., Leonard-Barton andDeschamps 1988) or group norms (e.g., Webster andTravino 1995)—may have influenced adoption.My statistical identification strategy relies on the
fact that the proposed adoption hypotheses make dif-ferent behavioral predictions for access than they dofor applications. To test my hypotheses, I examinewhether the observed adoption decisions conform tothese behavioral predictions. Accordingly, in the fol-lowing section, I state the various hypotheses in termsof their effect on both access and application adop-tion decisions. Because organizations had to adoptaccess in order to adopt applications, all applicationshypotheses are expressed as conditional on the accessdecision.
2.1. Complementarities with IT Investments
Compatibility and Technological Sophistication.Prior research in the DOI literature has shown thatcompatibility with existing practices, values, or normscan be a key factor in the decision to adopt newinnovations (Tornatzky and Klein 1982). Internettechnology represents an extension of C/S comput-ing principles, so prior investments in C/S oughtto increase the net benefits of adopting Internettechnology (Bernard 1996). Furthermore, adoptionof decentralized C/S involved significant invest-ments in organizational change (e.g., Bresnahan andSaloner 1999), thereby reducing the incremental orga-nizational learning (Attewell 1992) or co-invention(Bresnahan and Greenstein 1996) costs associated withInternet adoption.Prior investments in C/S should also increase
the technological sophistication of the organization.
Dow
nloa
ded
from
info
rms.
org
by [
140.
120.
135.
222]
on
12 A
pril
2014
, at 0
8:21
. Fo
r pe
rson
al u
se o
nly,
all
righ
ts r
eser
ved.
Forman: Determinants of Internet AdoptionManagement Science 51(4), pp. 641–654, © 2005 INFORMS 643
Technological sophistication reflects the number anddiversity of information technologies used by organi-zations, and is a key component of IT sophistication(Raymond and Paré 1992). Iacovou et al. (1995) notethat organizations with high levels of IT sophistica-tion are less likely to feel intimidated by technologyand are more likely to have access to the technologi-cal and managerial resources necessary to adopt newtechnologies.Compatibility with the legacy networking platform
ought to be more important for access than for theconditional applications decision: once compatibil-ity with Internet protocols is obtained by adoptingaccess, the marginal effect of improvements in com-patibility on the applications decision ought to besmall. Similarly, increases in IT sophistication gainedthrough investment in C/S are unlikely to affect anorganization’s technological readiness to adopt appli-cations, which involve technological and organiza-tional changes far beyond those of ordinary C/Stechnology. Thus, we have the following hypotheses.
Hypothesis 1a. Prior investments in C/S will increasethe likelihood of adopting basic access.
Hypothesis 1b. Conditional on the decision to adoptaccess, prior investments in C/S will have no effect on thedecision to adopt applications.
Competing Effects of Installed Base. Although,in general, investments in C/S make IT more com-patible and are a signal of IT sophistication, cer-tain C/S investments can reduce the net benefitsto adoption if they are specific to a particular pro-prietary C/S platform. Some prior C/S softwareinvestments in network operating systems (NOS)and system/communication applications—such asfile and print servers, directory services, and localarea network (LAN) management, maintenance, andbackup—were initially incompatible with Internettechnologies (Orfali et al. 1999, p. 116). For example,Novell’s NetWare, the leading NOS, was closely tiedto its proprietary protocols and was slow to incorpo-rate Internet features (McCarthy 1996).Such “platform-specific” network investments (e.g.,
Bresnahan and Greenstein 1996) can reduce thereturns to Internet adoption in two ways. To begin,they can act as a short-run substitute for Internettechnology. In this instance, organizations with pro-prietary C/S investments revealed a preference forthe backup, reliability, and security that was absentfrom networks based on the Internet’s TransmissionControl Protocol/Internet Protocol (TCP/IP), knownas intranets (Korzeniowski 1996).1 NOS vendors likeNetWare were slow to integrate Internet protocols
1 Thanks to an anonymous referee who suggested this interpre-tation.
into the core features of their products. Many oftheir customers valued these features highly and,as a result, delayed their adoption of Internet tech-nology (Gow 1996). Moreover, management infor-mation system departments may have preferred themore centralized control that proprietary C/S offersover intranets, where control of network functionswas more dispersed to users (Baynton 1996). Invest-ments in proprietary NOS may have indicated orga-nizational differences that suggested a preference fortraditional large-scale enterprise networking systems.Taken together, these effects may lead firms with priorinvestments in proprietary C/S technology to be lesslikely to adopt Internet technology.Prior platform-specific network investments can
reduce the net benefits of adopting basic access inanother way. Incompatibilities between systems appli-cations and Internet technology can create switch-ing costs (e.g., Klemperer 1995) if organizations havemade complementary technical and organizationalinvestments that are incompatible with Internet tech-nology. These switching costs may have reduceddemand for the Internet by firms with certain typesof prior IT investment.As noted above, compatibility with the installed
base will be very important for the adoption of basicnetworking technologies such as access. However,once access is adopted, the effect on the applicationsdecision will be small. As a result, I expect platform-specific investments to affect access, but not applica-tions, decisions.
Hypothesis 2a. Investments in platform-specific net-work applications will reduce the likelihood of adoptingbasic access.
Hypothesis 2b. Conditional on the decision to adoptaccess, prior investments in platform-specific network appl-ications will have no effect on the likelihood of adoptingapplications.
2.2. Complementarities with EstablishmentLocation
It has long been accepted that coordination costsincrease with the geographic dispersion of organiza-tion establishments (e.g., Chandler 1962, Williamson1975). Researchers on virtual teams have argued thatby reducing these communications costs, Internetinvestments reduce the costs of having geograph-ically dispersed employees (Boudreau et al. 1998,Saunders 2000).The Internet offered potentially significant savings
in communication costs between geographically dis-persed establishments. Prior to the Internet, an organi-zation had two alternatives for wide area networking(WAN). For one, an organization could set up point-to-point circuits, or leased lines, between establish-ments. Alternatively, it could run a leased line from
Dow
nloa
ded
from
info
rms.
org
by [
140.
120.
135.
222]
on
12 A
pril
2014
, at 0
8:21
. Fo
r pe
rson
al u
se o
nly,
all
righ
ts r
eser
ved.

Forman: Determinants of Internet Adoption644 Management Science 51(4), pp. 641–654, © 2005 INFORMS
its establishments to a telecommunications carrier’snearest access point. Under this second alternative,packets were carried over the public switched datanetwork (PSDN), and the carrier handled all packetswitching and maintenance. Both of these alterna-tives involved high fixed costs, long-distance charges,or both. Adopters of Internet technology gainedthe option of employing a virtual private network(VPN). VPNs allow communication among estab-lishments over the Internet backbone, maintainingprivacy through the use of tunneling protocols andsecurity procedures (Panko 2001). VPNs offered or-ganizations a WAN alternative that was cheaper thaneither leased lines or PSDN.In brief, prior literature suggests that geographic
dispersion is complementary to adoption of new com-munications technology like Internet access. In con-trast, geographic dispersion should have little effecton applications adoption.
Hypothesis 3a. Increases in geographic dispersionwill increase the likelihood of access adoption.
Hypothesis 3b. Conditional on the decision to adoptaccess, increases in geographic dispersion will have no effecton the likelihood of applications adoption.
2.3. SizePrior research in the DOI literature has consistentlyshown a positive relationship between organizationsize and innovativeness (Rogers 1995). The mostcommon reasons offered for this relationship areeconomies of scale (Kimberly and Evanisko 1981),slack resources (Eveland and Tornatzky 1990), accessto outside resources (Attewell 1992), and ability tobear adoption risks (Hannan and McDowell 1984).I include variables on organization size as a controlfor these characteristics and to demonstrate consis-tency with prior DOI literature. Because adoption ofapplications involves high technical hurdles and com-plementary changes to business processes, I expectthe importance of organization size in mitigatingthese barriers will be more important for applicationsadoption.
Hypothesis 4a. Increases in organization size willincrease the likelihood of access adoption.
Hypothesis 4b. Conditional on access adoption,increases in organization size will increase the likelihoodof applications adoption.
2.4. External EnvironmentRobertson and Gatignon (1986) describe several mar-ket characteristics that may affect the rate of newinnovation diffusion across industries: heterogeneityof industry participants, industry concentration, anddemand uncertainty. Although I am unable to mea-sure these factors explicitly, I control for industry
differences with industry (SIC) dummies. Organiza-tions that are located in different locations also faceheterogeneous markets for labor, third-party services,and complementary technological inputs (Tornatzkyand Fleisher 1990, pp. 171–173). Forman et al. (2003)explore the sources of geographic variation in Internetuse; in this paper, I control for differences in pooledresources through an urban/rural dummy.External pressure to adopt Internet technology
can come from the organization’s environment inseveral ways. For one, competitive pressure ariseswhen industry diffusion causes firms to adopt newinnovations to maintain their competitive position(e.g., Iacovou et al. 1995). Moreover, industry dif-fusion may facilitate adoption through knowledgespillovers. Knowledge spillovers may be localizedwithin industries (Irwin and Klenow 1994) or geo-graphic regions (Goolsbee and Klenow 2002).2
I expect competitive pressure and knowledgespillovers to be more important for application tech-nologies, which are more likely to be perceived asa source of competitive advantage (Porter 2001) andhave higher knowledge barriers than will access tech-nologies. Empirically identifying the role of com-petitive pressure or spillovers is inherently difficult,however, as constructs for these hypotheses may pickup unobserved heterogeneity across industries andregions. Thus, tests of these hypotheses should beconsidered preliminary and will await confirmationby future authors.
Hypothesis 5a. Increases in intraindustry access dif-fusion will increase the likelihood of adopting access.
Hypothesis 5b. Conditional on access adoption, in-creases in intraindustry applications diffusion will increasethe likelihood of adopting applications.
Hypothesis 6a. Increases in intraregion access diffu-sion will increase the likelihood of adopting access.
Hypothesis 6b. Conditional on access adoption, in-creases in intraregion applications diffusion will increasethe likelihood of adopting applications.
3. Empirical ModelI use discrete choice (e.g., McFadden 1981) to modelan organization’s joint decision to adopt access and
2 If competitors and suppliers are involved in business-to-businesstrading networks, organizations may also feel pressure from trad-ing partners to adopt e-commerce systems. This mechanism hasbeen studied recently in papers that examine adoption of interorga-nizational electronic data interchange systems (e.g., Iacovou et al.1995, Chwelos et al. 2001), although it is probably less important toInternet adoption over this sample because of the slow diffusion ofbusiness-to-business e-commerce.
Dow
nloa
ded
from
info
rms.
org
by [
140.
120.
135.
222]
on
12 A
pril
2014
, at 0
8:21
. Fo
r pe
rson
al u
se o
nly,
all
righ
ts r
eser
ved.
Forman: Determinants of Internet AdoptionManagement Science 51(4), pp. 641–654, © 2005 INFORMS 645
applications.3 In this adoption model, I examine anorganization’s decision to invest in access or appli-cations by a particular date, rather than looking atthe change in investment status. Each organization, i,associates some utility, Uij , with a choice, j , wherej = 1 denotes a decision not to adopt any form ofthe Internet, j = 2 denotes a decision to adopt accessonly, and j = 3 denotes a decision to adopt accessplus applications. Utility takes the form of a ran-dom utility model, Uij = uij + �ij . An organization’sutility for a choice has two components: (1) a deter-ministic component, uij , that is a function of organi-zational characteristics and choice-specific attributesand (2) a random error term, �ij , that captures theeffects of unmeasured variables.Researchers commonly use the multinomial logit
model in discrete choice analysis. However, the multi-nomial logit is unattractive in this setting because ofthe well-known independence of irrelevant alterna-tives property. This property imposes independenceon the error terms of individual alternatives andplaces severe restrictions on the substitution patternsin the model.To allow for correlation in the unobservables,
I employ a nested logit model. I assume the treeshown in Figure 2 describes the adoption decision foran organization and assume that utility is additivelyseparable into components that vary with the decisionto adopt access and the decision to adopt applications
Uij = Vik +Wij + �ij
Vik depends only on variables that affect the accessdecision, k, while Wij depends only on variables thataffect the application decision, j . Following the nestedlogit literature (e.g., McFadden 1981), I assume theerror term, �ij , follows a generalized extreme valuedistribution. Under this distribution, errors within anest are positively correlated and errors across nestsare uncorrelated.The joint probability of a choice j is Pij = PikPij�k,
where Pij represents the joint probability of anaccess/applications decision, Pik is the marginal prob-ability of an access choice, and Pij�k is the probabil-ity of an applications choice conditional on an accessdecision.The generalized extreme value distribution implies
that the marginal and conditional probabilities can bewritten as
Pik =exp�Vik+�Iik�∑l∈C exp�Vil+�Iil�
and
Pij�k =exp�Wij �
∑h∈Ck
exp�Wih�� (3.1)
3 I have also estimated panel data discrete choice models; the resultsare qualitatively the same.
Figure 2 Two-Level Nested Logit Tree for Internet Adoption Choice
AccessNoAccess
E-commerceNoNo Applications Applications
where Ck denotes the set of choices available at node kin the tree and Iik = log�
∑h∈Ck
exp�Wih�� is the inclu-sive value, the expected aggregate value of choice k.4
The coefficient on the inclusive value, �, measuresthe dissimilarity of alternatives available to the buyergiven different choices, k. I estimate the model usingfull information maximum likelihood.The nested logit model imposes a very particular
covariance structure on the error terms. One commonalternative to the nested logit is the multinomial pro-bit model. However, the multinomial probit presentsidentification problems for this study because themajority of my explanatory variables do not varyby choice. As shown by Keane (1992), identificationin the multinomial probit model is tenuous in theabsence of choice-specific variables. Movements in thecoefficients mimic changes in the covariance parame-ters. I estimated a version of the multinomial probitmodel with and without the restriction that the errorterms are i.i.d. N�0�1�, and a likelihood ratio test wasunable to reject this constraint. Because of these con-cerns, I present only the nested logit estimates.
4. Data4.1. SampleI obtained data over the 1996–1998 period from theHarte Hanks Computer Intelligence (CI) TechnologyDatabase. The CI database contains establishment-level data on (1) establishment characteristics such asnumber of employees, industry, and location; (2) useof technology hardware and software such as com-puters, networking equipment, printers, and otheroffice equipment; and (3) use of Internet applica-tions and other networking services. Harte Hanks sur-veys establishments throughout the calendar year; my
4 In practice, because I do not observe organizations adopting appli-cations without access, I constrain the marginal probability of appli-cations adoption conditional on no access to be equal to one.
Dow
nloa
ded
from
info
rms.
org
by [
140.
120.
135.
222]
on
12 A
pril
2014
, at 0
8:21
. Fo
r pe
rson
al u
se o
nly,
all
righ
ts r
eser
ved.
Forman: Determinants of Internet Adoption646 Management Science 51(4), pp. 641–654, © 2005 INFORMS
sample of annual data contains the most current infor-mation as of December of each year.To keep the analysis of manageable size, I obtained
data from the CI database on SIC codes 60–67, 73,87, and 27. These SIC codes correspond to the indus-trial groupings of Finance, Insurance, and Real Estate(60–67); Business Services (73); Engineering, Account-ing, Research, Management, and Related Services (87);and Printing and Publishing (27). I selected theseindustries because they are heavy IT users. The sam-ple contains data from the CI database on all estab-lishments of over 100 employees in these industries.All establishments are from the United States.The unit of observation in the CI database is an
establishment-year. Roughly speaking, an establish-ment refers to a particular branch or location of afirm. Thus, I often observe data on multiple estab-lishments from the same firm. The establishment isan inappropriate unit of observation in this setting,however, because the technology adoption decisionfor an establishment likely depends on observableand unobservable attributes of other establishmentswithin the same organization. To avoid these prob-lems, I aggregate across establishments and conductall analyses at the organization level.I use 1998 adoption data to estimate the models
described in §3. In the baseline model, I use prioryear characteristics data as explanatory variables. Asa result, each observation requires two consecutiveyears of data. Because establishments enter and exitthe database, I define an organization as the set ofestablishments that has been in the database for both1997 and 1998. I drop some establishments because ofmissing data. The establishment-level data originallyobtained from the CI database contained 18,725 estab-lishments in 1998; the final analysis sample contains6,156 organizations.
4.2. Variables Measuring Internet AdoptionEstablishments that have indicated use of an Internetservice provider are counted as adopting Internetaccess. An establishment is counted as adoptingapplications if it responded positively to adopting anyof the following: business-to-business e-commerce,business-to-consumer e-commerce, e-commerce, cus-tomer service, education, extranet, publishing, pur-chasing, or technical support. An organization iscoded as adopting a technology if the technology wasacquired by at least one establishment within thatorganization by 1998.
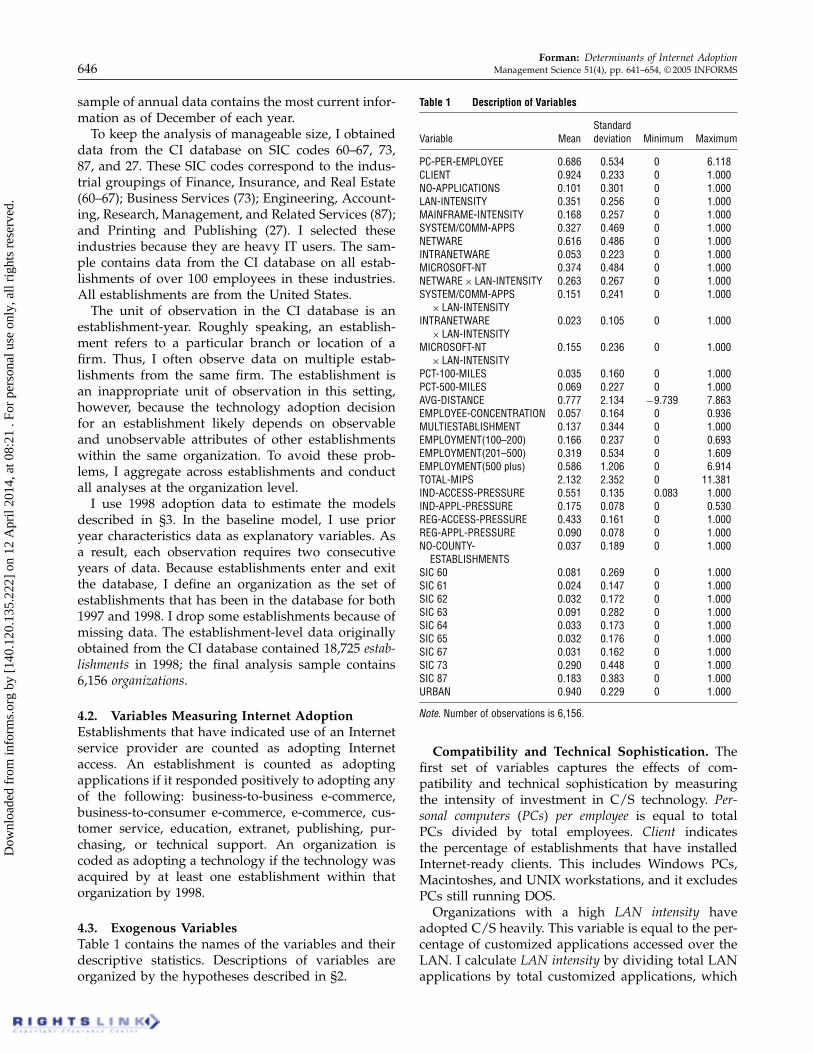
4.3. Exogenous VariablesTable 1 contains the names of the variables and theirdescriptive statistics. Descriptions of variables areorganized by the hypotheses described in §2.
Table 1 Description of Variables
StandardVariable Mean deviation Minimum Maximum
PC-PER-EMPLOYEE 0.686 0.534 0 6�118CLIENT 0.924 0.233 0 1�000NO-APPLICATIONS 0.101 0.301 0 1�000LAN-INTENSITY 0.351 0.256 0 1�000MAINFRAME-INTENSITY 0.168 0.257 0 1�000SYSTEM/COMM-APPS 0.327 0.469 0 1�000NETWARE 0.616 0.486 0 1�000INTRANETWARE 0.053 0.223 0 1�000MICROSOFT-NT 0.374 0.484 0 1�000NETWARE× LAN-INTENSITY 0.263 0.267 0 1�000SYSTEM/COMM-APPS 0.151 0.241 0 1�000
× LAN-INTENSITYINTRANETWARE 0.023 0.105 0 1�000
× LAN-INTENSITYMICROSOFT-NT 0.155 0.236 0 1�000
× LAN-INTENSITYPCT-100-MILES 0.035 0.160 0 1�000PCT-500-MILES 0.069 0.227 0 1�000AVG-DISTANCE 0.777 2.134 −9�739 7�863EMPLOYEE-CONCENTRATION 0.057 0.164 0 0�936MULTIESTABLISHMENT 0.137 0.344 0 1�000EMPLOYMENT(100–200) 0.166 0.237 0 0�693EMPLOYMENT(201–500) 0.319 0.534 0 1�609EMPLOYMENT(500 plus) 0.586 1.206 0 6�914TOTAL-MIPS 2.132 2.352 0 11�381IND-ACCESS-PRESSURE 0.551 0.135 0�083 1�000IND-APPL-PRESSURE 0.175 0.078 0 0�530REG-ACCESS-PRESSURE 0.433 0.161 0 1�000REG-APPL-PRESSURE 0.090 0.078 0 1�000NO-COUNTY- 0.037 0.189 0 1�000
ESTABLISHMENTSSIC 60 0.081 0.269 0 1�000SIC 61 0.024 0.147 0 1�000SIC 62 0.032 0.172 0 1�000SIC 63 0.091 0.282 0 1�000SIC 64 0.033 0.173 0 1�000SIC 65 0.032 0.176 0 1�000SIC 67 0.031 0.162 0 1�000SIC 73 0.290 0.448 0 1�000SIC 87 0.183 0.383 0 1�000URBAN 0.940 0.229 0 1�000
Note. Number of observations is 6,156.
Compatibility and Technical Sophistication. Thefirst set of variables captures the effects of com-patibility and technical sophistication by measuringthe intensity of investment in C/S technology. Per-sonal computers (PCs) per employee is equal to totalPCs divided by total employees. Client indicatesthe percentage of establishments that have installedInternet-ready clients. This includes Windows PCs,Macintoshes, and UNIX workstations, and it excludesPCs still running DOS.Organizations with a high LAN intensity have
adopted C/S heavily. This variable is equal to the per-centage of customized applications accessed over theLAN. I calculate LAN intensity by dividing total LANapplications by total customized applications, which
Dow
nloa
ded
from
info
rms.
org
by [
140.
120.
135.
222]
on
12 A
pril
2014
, at 0
8:21
. Fo
r pe
rson
al u
se o
nly,
all
righ
ts r
eser
ved.
Forman: Determinants of Internet AdoptionManagement Science 51(4), pp. 641–654, © 2005 INFORMS 647
includes applications from mainframes, midrangesystems, and workstations.5 I code organizationswithout customized applications as zero. In contrast,mainframe intensity will indicate heavy investment inapplications that are incompatible with the Internet. Itis equal to the percentage of customized applicationsaccessed over a mainframe or minicomputer and iscalculated in a manner identical to the LAN intensityvariable. As a control, I also include a variable, “noapplications,” that is one when an organization reportsno software applications.Several variables indicate whether an organization
has made platform-specific investments in LAN oper-ating systems (OS) or system/communication appli-cations. Respondents to the Harte Hanks survey listonly those applications they feel are most important,so a value of one for any of these variables repre-sents heavy investments in C/S. However, becausethey are platform specific, their use may reduce thereturns to other C/S investments. The variable system/communication applications is one if an organizationreports the use of software for the management,maintenance, and backup of LANs. NetWare is adummy that indicates whether an organization usessome version of Novell’s NetWare. I use NetWareas my primary construct indicating platform-specificLAN OS investments for several reasons: ample evi-dence of incompatibilities between older NetWareversions and Internet protocols (e.g., McCarthy 1996);widespread use among large enterprise customerswho may be predisposed toward centralized ISs (e.g.,Orfali et al. 1999, p. 163); and a large installed basethat enables statistical identification. As a robustnesscheck, I include different vintages of NetWare and dif-ferent types of LAN OS. IntranetWare indicates thatan organization has invested in Novell’s IntranetWareoperating system, a more recent version of NetWarethat was more compatible with Internet protocols andapplications. Microsoft NT indicates that an organi-zation uses NT, a recent network operating systemdeveloped by Microsoft.
Competing Effects of Installed Base. To identifywhether system/communication applications or NetWareincrease or decrease the returns to investing in C/S,I interact each with LAN intensity. A negative coef-ficient on these interaction terms indicates that thepositive impact of C/S investments on Internet adop-tion is weakened if some C/S investments weredirected toward technologies that are incompatiblewith Internet protocols. This negative impact willincrease as system communication applications andNetWare are embedded in larger and more compli-cated networks. As a robustness check, I employ simi-lar interactions using IntranetWare and Microsoft NT.
5 All LAN applications are considered to be customized.
Both operating systems are younger and more com-patible with Internet protocols. In addition, they haveIP protocols integrated into some of the core featuresof the OS (Orfali et al. 1999, pp. 115–118).
Complementarities with Establishment Location.To identify whether geographic dispersion increasesthe returns to adopting the Internet for multiestablish-ment organizations, I identify the distance betweenorganization establishments. I use longitude, latitude,and the “great circle” formula to calculate the dis-tance between each establishment in the organization.I then calculate the percentage of pairwise establish-ment combinations that are within 100 miles in dis-tance, percent within 100 miles.The role of geographic dispersion on access adop-
tion is defined only for multiestablishment organiza-tions. To control for type of organization, I include avariable that indicates whether there is more than oneestablishment in the organization, multiestablishment.The effects of geographic dispersion may capture, inpart, the impact of employee dispersion across estab-lishments, rather than geographic dispersion per se.For example, an organization with employees spreadacross two establishments may have higher returns toadopting the Internet either from (1) decreased com-munication costs across a long geographic distance or(2) increased benefits of networking employees in twolocations. To control for employee dispersion, I cal-culate employee concentration by summing the squaredshares of employees in each establishment across allestablishments in the organization. A high value forthis variable indicates that employees are concen-trated within a small number of establishments, andthis should lower the probability of adoption.
Size. To control for the effects of organization sizeon the probability of adoption, I include the naturallogarithm of the total number of employees in theorganization. Because I expect the marginal effect ofincreases in the number of employees to vary withnumber of employees, I allow this coefficient to varybetween employment sizes of 100–200, 200–500, and500 plus employees.Another measure of size or slack resources is
the magnitude of an organization’s IT investments.To measure the scale of large-scale computing infras-tructure within the organization, I calculate the totalMIPS across an organization’s mainframes, mini-computers, and servers. This variable may also cap-ture the effects of IT sophistication.
External Environment. To capture the effects ofexternal pressure or industry spillovers, I calculateindustry access pressure and industry applications pres-sure, the percentage of competitors in the orga-nization’s three-digit SIC code that has adoptedaccess and applications. In the case of multi-industry
Dow
nloa
ded
from
info
rms.
org
by [
140.
120.
135.
222]
on
12 A
pril
2014
, at 0
8:21
. Fo
r pe
rson
al u
se o
nly,
all
righ
ts r
eser
ved.

Forman: Determinants of Internet Adoption648 Management Science 51(4), pp. 641–654, © 2005 INFORMS
organizations, I calculate the average of the adoptionrates across all of the organization’s industries.To capture the effects of geographic spillovers, I cal-
culate regional access pressure and regional applicationspressure, the percentage of establishments in the orga-nization’s county that has adopted access and applica-tions. For multicounty organizations, I average acrosscounties. My sample contains some counties that con-tain only one observation. In these cases, I normal-ize the regional pressure variables to equal zero andinclude a control indicating that there are no otherestablishments in the county.To control for industry effects, SIC 60–SIC 87 indi-
cate the percentage of an organization’s establish-ments in SIC codes 60–67, 73, and 87. SIC 27 is theomitted category. Last, to control for urban/rural dif-ferences in the propensity to adopt Internet technol-ogy, I include a variable that indicates the percentageof establishments located in a metropolitan statist-ical area.
4.4. Data LimitationsThe CI database offers one of the most comprehensivesources of data on microlevel commercial IT invest-ment, however, it does have significant limitations.To begin, not all companies respond to the survey.Moreover, those that do may not respond every year.Though there is no way to quantify precisely the mag-nitude and impact of this nonresponse bias, otherstudies (e.g., Forman et al. 2002, p. 38) have com-pared the CI database to Census data and found theCI database to be fairly representative along majordimensions such as size, industry composition, andgeographic composition.The external pressure variables that capture indus-
try and regional pressure are based on in-sampleestimates. Because the adoption decisions from thissample may not be representative of the adop-tion decisions of establishments in an organization’sindustry or county, the estimates based on these vari-ables should be interpreted with some caution.As noted above, the CI database does not con-
tain a complete census of hardware and softwareusage: establishments report only the hardware andsoftware they feel is most important. To control foran extreme version of nonresponse in IT questions,I drop establishments that do not report any use ofhardware or software.6 Moreover, as noted above,I include control variables for establishments that didnot report any software applications. There remains,however, a residual of establishments that respondedto some but not all IT questions. Though this may cre-ate an upward bias on variables capturing the directeffects of compatibility or technical sophistication
6 However, all of the results are robust to their inclusion.
(establishments that consider C/S to be “important”will be more likely to consider Internet use impor-tant), there is no reason to believe, a priori, that itwould create any systematic bias in the variables cap-turing organizational differences or lock-in.Another potential weakness arises because I am
able to observe only discrete adoption decisions. If thefactors affecting technology acquisition are differentfrom those affecting deployment, the analysis maynot provide a complete picture of the factors affect-ing organization implementation of Internet technol-ogy. However, this “assimilation gap” (Fichman andKemerer 1999) will be less of a factor for accessadoption than for applications, which require sub-stantial complementary change to business processes(Kalakota and Robinson 2001).A last issue relates to the aggregation of data to
the organization level. Because Harte Hanks doesnot survey all of the establishments in a firm, boththe endogenous variable and constructs are measuredwith error. However, there is no reason to believe thatthese unobserved factors will be systematically corre-lated with any of the independent variables.7
5. ResultsFigure 1 shows the adoption rates for access andapplications over the 1996–1998 period. As noted ear-lier, the two technologies diffused at very differentrates. In 1998, access achieved a penetration rate of77.9%, while applications had been adopted by only28.9% of organizations.8 These results support my ear-lier hypothesis that the fixed costs for access werefar lower than those for applications. What they failto identify, however, are the particular forces driv-ing heterogeneity in adoption behavior. Among firmswith C/S and NetWare, 84.0% and 84.3% had adoptedaccess in 1998. In unconditional statistics, these vari-ables reflect differences in compatibility and technicalsophistication. To separate the competing effects ofplatform-specific investments and to identify the fac-tors driving adoption, I require an econometric frame-work. To this end, I estimate the model describedabove based on Equation (3.1). In this model, the util-ity for access decision k in organization i is
Vik = �0k +�1kPC-PER-EMPLOYEEi +�2kCLIENTi
+�3kNO-APPLICATIONSi
7 Prior work has shown that measurement error in logit modelscan produce biased coefficient estimates. However, in cases wherethe measurement error is small and the sample size is large, themagnitude of this bias will be small and logit models will performsatisfactorily. See, for example, McFadden (1986) or Stefanski andCarroll (1985).8 This includes only establishments that were in the sample overthe 1996–1998 period.
Dow
nloa
ded
from
info
rms.
org
by [
140.
120.
135.
222]
on
12 A
pril
2014
, at 0
8:21
. Fo
r pe
rson
al u
se o
nly,
all
righ
ts r
eser
ved.
Forman: Determinants of Internet AdoptionManagement Science 51(4), pp. 641–654, © 2005 INFORMS 649
+�4kLAN-INTENSITYi
+�5kSYSTEM/COMM-APPSi +�6kNETWAREi
+�7kINTRANETWAREi
+�8kMAINFRAME-INTENSITYi
+�9kNETWAREi ×LAN-INTENSITYi
+�10kINTRANETWAREi ×LAN-INTENSITYi
+�11kSYSTEM/COMM-APPSi
×LAN-INTENSITYi
+�12kMULTIESTABLISHMENTi
+�13kEMPLOYEE-CONCENTRATIONi
+�14kPCT-100-MILESi
+ ∑
m∈Csizeclass
�m15kEMPLOYMENT�m�i
+�16TOTAL-MIPSi
+�17NO-COUNTY-ESTABLISHMENTSi
+�18REG-ACCESS-PRESSUREi
+�19IND-ACCESS-PRESSUREi
+ ∑
n∈Cindustries
�n20kSICin +�21kURBANi
This equation represents the utility from investing inaccess by the end of 1998. The utility for adoptingaccess plus applications is similar, but it substitutesREG-APPL-PRESSUREi and IND-APPL-PRESSUREi
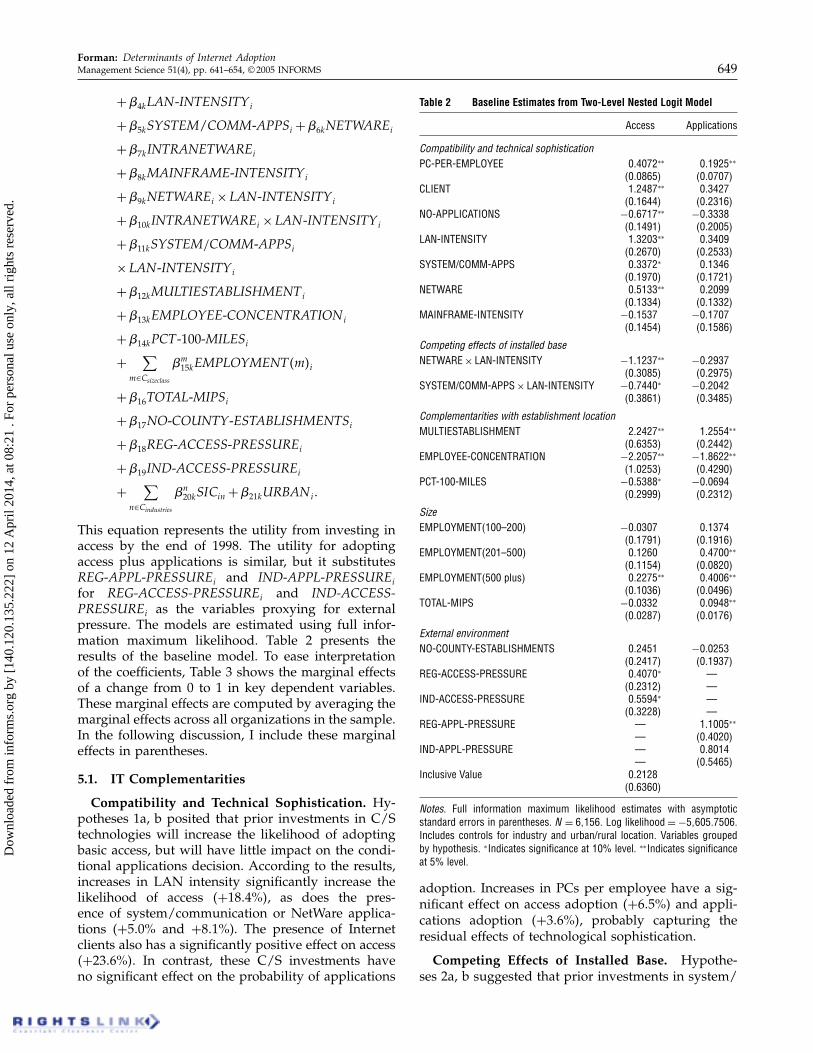
for REG-ACCESS-PRESSUREi and IND-ACCESS-PRESSUREi as the variables proxying for externalpressure. The models are estimated using full infor-mation maximum likelihood. Table 2 presents theresults of the baseline model. To ease interpretationof the coefficients, Table 3 shows the marginal effectsof a change from 0 to 1 in key dependent variables.These marginal effects are computed by averaging themarginal effects across all organizations in the sample.In the following discussion, I include these marginaleffects in parentheses.
5.1. IT Complementarities
Compatibility and Technical Sophistication. Hy-potheses 1a, b posited that prior investments in C/Stechnologies will increase the likelihood of adoptingbasic access, but will have little impact on the condi-tional applications decision. According to the results,increases in LAN intensity significantly increase thelikelihood of access �+184%�, as does the pres-ence of system/communication or NetWare applica-tions (+50% and +81%). The presence of Internetclients also has a significantly positive effect on access�+236%�. In contrast, these C/S investments haveno significant effect on the probability of applications
Table 2 Baseline Estimates from Two-Level Nested Logit Model
Access Applications
Compatibility and technical sophisticationPC-PER-EMPLOYEE 0�4072∗∗ 0�1925∗∗
�0�0865� �0�0707�CLIENT 1�2487∗∗ 0�3427
�0�1644� �0�2316�NO-APPLICATIONS −0�6717∗∗ −0�3338
�0�1491� �0�2005�LAN-INTENSITY 1�3203∗∗ 0�3409
�0�2670� �0�2533�SYSTEM/COMM-APPS 0�3372∗ 0�1346
�0�1970� �0�1721�NETWARE 0�5133∗∗ 0�2099
�0�1334� �0�1332�MAINFRAME-INTENSITY −0�1537 −0�1707
�0�1454� �0�1586�
Competing effects of installed baseNETWARE× LAN-INTENSITY −1�1237∗∗ −0�2937
�0�3085� �0�2975�SYSTEM/COMM-APPS× LAN-INTENSITY −0�7440∗ −0�2042
�0�3861� �0�3485�
Complementarities with establishment locationMULTIESTABLISHMENT 2�2427∗∗ 1�2554∗∗
�0�6353� �0�2442�EMPLOYEE-CONCENTRATION −2�2057∗∗ −1�8622∗∗
�1�0253� �0�4290�PCT-100-MILES −0�5388∗ −0�0694
�0�2999� �0�2312�
SizeEMPLOYMENT(100–200) −0�0307 0�1374
�0�1791� �0�1916�EMPLOYMENT(201–500) 0�1260 0�4700∗∗
�0�1154� �0�0820�EMPLOYMENT(500 plus) 0�2275∗∗ 0�4006∗∗
�0�1036� �0�0496�TOTAL-MIPS −0�0332 0�0948∗∗
�0�0287� �0�0176�
External environmentNO-COUNTY-ESTABLISHMENTS 0�2451 −0�0253
�0�2417� �0�1937�REG-ACCESS-PRESSURE 0�4070∗ —
�0�2312� —IND-ACCESS-PRESSURE 0�5594∗ —
�0�3228� —REG-APPL-PRESSURE — 1�1005∗∗
— �0�4020�IND-APPL-PRESSURE — 0�8014
— �0�5465�Inclusive Value 0�2128
�0�6360�
Notes. Full information maximum likelihood estimates with asymptoticstandard errors in parentheses. N = 6�156. Log likelihood=−5�605�7506.Includes controls for industry and urban/rural location. Variables groupedby hypothesis. ∗Indicates significance at 10% level. ∗∗Indicates significanceat 5% level.
adoption. Increases in PCs per employee have a sig-nificant effect on access adoption �+65%� and appli-cations adoption �+36%�, probably capturing theresidual effects of technological sophistication.
Competing Effects of Installed Base. Hypothe-ses 2a, b suggested that prior investments in system/
Dow
nloa
ded
from
info
rms.
org
by [
140.
120.
135.
222]
on
12 A
pril
2014
, at 0
8:21
. Fo
r pe
rson
al u
se o
nly,
all
righ
ts r
eser
ved.
Forman: Determinants of Internet Adoption650 Management Science 51(4), pp. 641–654, © 2005 INFORMS
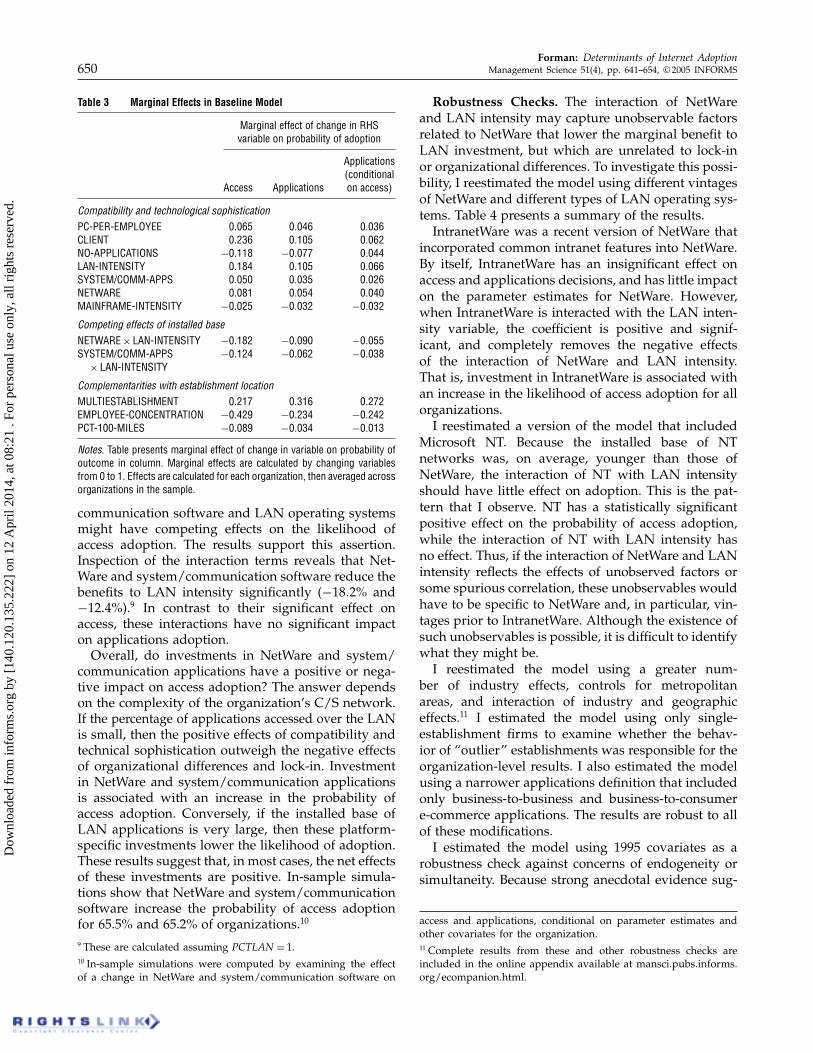
Table 3 Marginal Effects in Baseline Model
Marginal effect of change in RHSvariable on probability of adoption
Applications(conditional
Access Applications on access)
Compatibility and technological sophisticationPC-PER-EMPLOYEE 0�065 0�046 0�036CLIENT 0�236 0�105 0�062NO-APPLICATIONS −0�118 −0�077 0�044LAN-INTENSITY 0�184 0�105 0�066SYSTEM/COMM-APPS 0�050 0�035 0�026NETWARE 0�081 0�054 0�040MAINFRAME-INTENSITY −0�025 −0�032 −0�032
Competing effects of installed baseNETWARE× LAN-INTENSITY −0�182 −0�090 −0�055SYSTEM/COMM-APPS −0�124 −0�062 −0�038
× LAN-INTENSITY
Complementarities with establishment locationMULTIESTABLISHMENT 0�217 0�316 0�272EMPLOYEE-CONCENTRATION −0�429 −0�234 −0�242PCT-100-MILES −0�089 −0�034 −0�013
Notes. Table presents marginal effect of change in variable on probability ofoutcome in column. Marginal effects are calculated by changing variablesfrom 0 to 1. Effects are calculated for each organization, then averaged acrossorganizations in the sample.
communication software and LAN operating systemsmight have competing effects on the likelihood ofaccess adoption. The results support this assertion.Inspection of the interaction terms reveals that Net-Ware and system/communication software reduce thebenefits to LAN intensity significantly (−182% and−124%).9 In contrast to their significant effect onaccess, these interactions have no significant impacton applications adoption.Overall, do investments in NetWare and system/
communication applications have a positive or nega-tive impact on access adoption? The answer dependson the complexity of the organization’s C/S network.If the percentage of applications accessed over the LANis small, then the positive effects of compatibility andtechnical sophistication outweigh the negative effectsof organizational differences and lock-in. Investmentin NetWare and system/communication applicationsis associated with an increase in the probability ofaccess adoption. Conversely, if the installed base ofLAN applications is very large, then these platform-specific investments lower the likelihood of adoption.These results suggest that, in most cases, the net effectsof these investments are positive. In-sample simula-tions show that NetWare and system/communicationsoftware increase the probability of access adoptionfor 65.5% and 65.2% of organizations.10
9 These are calculated assuming PCTLAN = 1.10 In-sample simulations were computed by examining the effectof a change in NetWare and system/communication software on
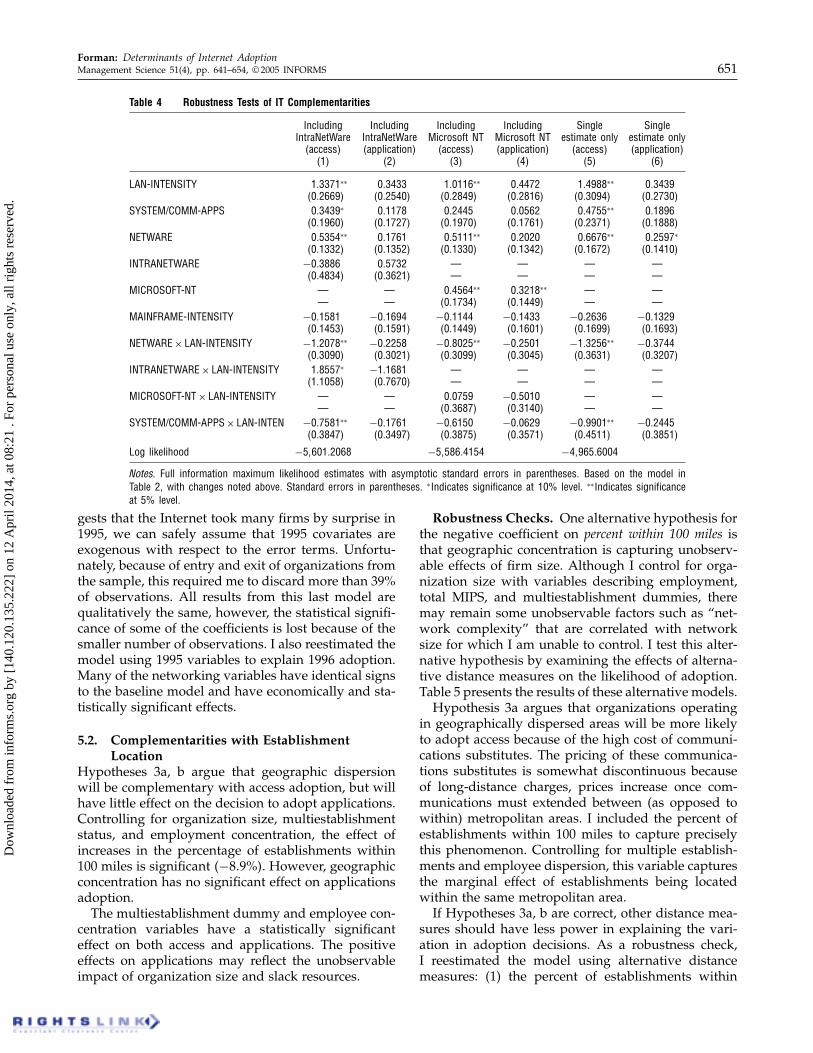
Robustness Checks. The interaction of NetWareand LAN intensity may capture unobservable factorsrelated to NetWare that lower the marginal benefit toLAN investment, but which are unrelated to lock-inor organizational differences. To investigate this possi-bility, I reestimated the model using different vintagesof NetWare and different types of LAN operating sys-tems. Table 4 presents a summary of the results.IntranetWare was a recent version of NetWare that
incorporated common intranet features into NetWare.By itself, IntranetWare has an insignificant effect onaccess and applications decisions, and has little impacton the parameter estimates for NetWare. However,when IntranetWare is interacted with the LAN inten-sity variable, the coefficient is positive and signif-icant, and completely removes the negative effectsof the interaction of NetWare and LAN intensity.That is, investment in IntranetWare is associated withan increase in the likelihood of access adoption for allorganizations.I reestimated a version of the model that included
Microsoft NT. Because the installed base of NTnetworks was, on average, younger than those ofNetWare, the interaction of NT with LAN intensityshould have little effect on adoption. This is the pat-tern that I observe. NT has a statistically significantpositive effect on the probability of access adoption,while the interaction of NT with LAN intensity hasno effect. Thus, if the interaction of NetWare and LANintensity reflects the effects of unobserved factors orsome spurious correlation, these unobservables wouldhave to be specific to NetWare and, in particular, vin-tages prior to IntranetWare. Although the existence ofsuch unobservables is possible, it is difficult to identifywhat they might be.I reestimated the model using a greater num-
ber of industry effects, controls for metropolitanareas, and interaction of industry and geographiceffects.11 I estimated the model using only single-establishment firms to examine whether the behav-ior of “outlier” establishments was responsible for theorganization-level results. I also estimated the modelusing a narrower applications definition that includedonly business-to-business and business-to-consumere-commerce applications. The results are robust to allof these modifications.I estimated the model using 1995 covariates as a
robustness check against concerns of endogeneity orsimultaneity. Because strong anecdotal evidence sug-
access and applications, conditional on parameter estimates andother covariates for the organization.11 Complete results from these and other robustness checks areincluded in the online appendix available at mansci.pubs.informs.org/ecompanion.html.
Dow
nloa
ded
from
info
rms.
org
by [
140.
120.
135.
222]
on
12 A
pril
2014
, at 0
8:21
. Fo
r pe
rson
al u
se o
nly,
all
righ
ts r
eser
ved.
Forman: Determinants of Internet AdoptionManagement Science 51(4), pp. 641–654, © 2005 INFORMS 651
Table 4 Robustness Tests of IT Complementarities
Including Including Including Including Single SingleIntraNetWare IntraNetWare Microsoft NT Microsoft NT estimate only estimate only(access) (application) (access) (application) (access) (application)
(1) (2) (3) (4) (5) (6)
LAN-INTENSITY 1�3371∗∗ 0�3433 1�0116∗∗ 0�4472 1�4988∗∗ 0�3439�0�2669� �0�2540� �0�2849� �0�2816� �0�3094� �0�2730�
SYSTEM/COMM-APPS 0�3439∗ 0�1178 0�2445 0�0562 0�4755∗∗ 0�1896�0�1960� �0�1727� �0�1970� �0�1761� �0�2371� �0�1888�
NETWARE 0�5354∗∗ 0�1761 0�5111∗∗ 0�2020 0�6676∗∗ 0�2597∗�0�1332� �0�1352� �0�1330� �0�1342� �0�1672� �0�1410�
INTRANETWARE −0�3886 0�5732 — — — —�0�4834� �0�3621� — — — —
MICROSOFT-NT — — 0�4564∗∗ 0�3218∗∗ — —— — �0�1734� �0�1449� — —
MAINFRAME-INTENSITY −0�1581 −0�1694 −0�1144 −0�1433 −0�2636 −0�1329�0�1453� �0�1591� �0�1449� �0�1601� �0�1699� �0�1693�
NETWARE× LAN-INTENSITY −1�2078∗∗ −0�2258 −0�8025∗∗ −0�2501 −1�3256∗∗ −0�3744�0�3090� �0�3021� �0�3099� �0�3045� �0�3631� �0�3207�
INTRANETWARE× LAN-INTENSITY 1�8557∗ −1�1681 — — — —�1�1058� �0�7670� — — — —
MICROSOFT-NT× LAN-INTENSITY — — 0�0759 −0�5010 — —— — �0�3687� �0�3140� — —
SYSTEM/COMM-APPS× LAN-INTEN −0�7581∗∗ −0�1761 −0�6150 −0�0629 −0�9901∗∗ −0�2445�0�3847� �0�3497� �0�3875� �0�3571� �0�4511� �0�3851�
Log likelihood −5�601�2068 −5�586�4154 −4�965�6004
Notes. Full information maximum likelihood estimates with asymptotic standard errors in parentheses. Based on the model inTable 2, with changes noted above. Standard errors in parentheses. ∗Indicates significance at 10% level. ∗∗Indicates significanceat 5% level.
gests that the Internet took many firms by surprise in1995, we can safely assume that 1995 covariates areexogenous with respect to the error terms. Unfortu-nately, because of entry and exit of organizations fromthe sample, this required me to discard more than 39%of observations. All results from this last model arequalitatively the same, however, the statistical signifi-cance of some of the coefficients is lost because of thesmaller number of observations. I also reestimated themodel using 1995 variables to explain 1996 adoption.Many of the networking variables have identical signsto the baseline model and have economically and sta-tistically significant effects.
5.2. Complementarities with EstablishmentLocation
Hypotheses 3a, b argue that geographic dispersionwill be complementary with access adoption, but willhave little effect on the decision to adopt applications.Controlling for organization size, multiestablishmentstatus, and employment concentration, the effect ofincreases in the percentage of establishments within100 miles is significant �−89%�. However, geographicconcentration has no significant effect on applicationsadoption.The multiestablishment dummy and employee con-
centration variables have a statistically significanteffect on both access and applications. The positiveeffects on applications may reflect the unobservableimpact of organization size and slack resources.
Robustness Checks. One alternative hypothesis forthe negative coefficient on percent within 100 miles isthat geographic concentration is capturing unobserv-able effects of firm size. Although I control for orga-nization size with variables describing employment,total MIPS, and multiestablishment dummies, theremay remain some unobservable factors such as “net-work complexity” that are correlated with networksize for which I am unable to control. I test this alter-native hypothesis by examining the effects of alterna-tive distance measures on the likelihood of adoption.Table 5 presents the results of these alternative models.Hypothesis 3a argues that organizations operating
in geographically dispersed areas will be more likelyto adopt access because of the high cost of communi-cations substitutes. The pricing of these communica-tions substitutes is somewhat discontinuous becauseof long-distance charges, prices increase once com-munications must extended between (as opposed towithin) metropolitan areas. I included the percent ofestablishments within 100 miles to capture preciselythis phenomenon. Controlling for multiple establish-ments and employee dispersion, this variable capturesthe marginal effect of establishments being locatedwithin the same metropolitan area.If Hypotheses 3a, b are correct, other distance mea-
sures should have less power in explaining the vari-ation in adoption decisions. As a robustness check,I reestimated the model using alternative distancemeasures: (1) the percent of establishments within
Dow
nloa
ded
from
info
rms.
org
by [
140.
120.
135.
222]
on
12 A
pril
2014
, at 0
8:21
. Fo
r pe
rson
al u
se o
nly,
all
righ
ts r
eser
ved.

Forman: Determinants of Internet Adoption652 Management Science 51(4), pp. 641–654, © 2005 INFORMS
Table 5 Nested Logit Estimates, Robustness Checks of Location Complementarities
PCT500 PCT500 AVG-DISTANCE AVG-DISTANCE 1996 1996(access) (application) (access) (application) (access) (application)
(1) (2) (3) (4) (5) (6)
MULTIESTABLISHMENT 2�1376∗∗ 1�2277∗∗ 1�6331∗∗ 1�5560∗∗ 2�7522∗∗ 1�2117∗∗
�0�6429� �0�2555� �0�7416� �0�3765� �0�3500� �0�3641�EMPLOYEE-CONCENTRATION −2�2592∗∗ −1�8943∗∗ −2�1752∗∗ −1�9857∗∗ −2�8975∗∗ −1�7740∗∗
�1�0220� �0�4268� �1�0422� �0�4353� �0�5669� �0�6248�PCT-100-MILES — — — — −0�7431∗∗ −0�3521
— — — — �0�2312� �0�4335�PCT-500-MILES −0�1204 0�0518 — — — —
�0�2975� �0�2043� — — — —AVG-DISTANCE — — 0�0791 −0�0472 — —
— — �0�0563� �0�0440� — —
N 6,156 6,156 5,239Log likelihood −5�607�3315 −5�605�9859 −3�912�3788
Notes. Full information maximum likelihood estimates with asymptotic standard errors in parentheses. Based on the model inTable 2, with changes noted above. ∗Indicates significance at 10% level. ∗∗Indicates significance at 5% level.
500 miles in distance and (2) the average distancebetween establishments. Both are unsuccessful inexplaining the variation in access adoption decisions.Organization location decisions could also be en-
dogenous with the cost of communications: the avail-ability of low-cost Internet services may cause or-ganizations to locate establishments farther apart. I ex-plored this possibility by reestimating the model using1996 adoption decisions and 1995 explanatory vari-ables. Organization location decisions made in 1995 orbefore were made prior to the widespread diffusionof the Internet; these location decisions will be exoge-nous with respect to Internet adoption.12 In this model,the effects of geographic location on access adop-tion are even stronger �+123%�. Last, I estimated themodel using the narrower “e-commerce” definitionfor applications. In this model, geographic dispersioncontinues to reduce the likelihood of adopting access,however, the results are significant only at the 23%level.
5.3. Size and External PressureTable 2 shows that employment has a significantimpact on applications adoption but relatively littleeffect on access, supporting Hypotheses 4a, b. Amongorganizations of more than 500 employees, a one stan-dard deviation increase in employment (equivalentto roughly 259 employees) increases the likelihood ofaccess by 3.3% and applications by 7.7%. Total MIPShas no effect on access and a small but significant effecton applications. A one standard deviation increase
12 I have also estimated the model using 1998 adoption deci-sions and 1995 covariates. This model is estimated on a muchsmaller sample because of entry and exit of organizations fromthe database. In this specification, the signs of the coefficients areidentical to those in the baseline model but statistical significanceis generally lost.
in total MIPS increases the likelihood of applicationsadoption by 4.4%.Table 2 indicates that, in general, the variables
capturing external industry and regional pressurehave a positive and statistically significant effecton access and applications adoption, supportingHypotheses 5a, b and Hypotheses 6a, b. However, asmentioned above, these variables may also be prox-ying for unobserved heterogeneity in net benefits toadoption across industries and counties.
6. DiscussionWhat factors separated adopters of the Internet from
nonadopters? These results suggest that the organi-zations that derived the greatest net benefits fromthe decreases in communications costs made possi-ble by early Internet technologies were more likelyto adopt the Internet. Organizations that had madecomplementary investments in information and com-munication technologies were more likely to adopt.Organizations that were geographically dispersed andbenefited from reductions in communications costsengendered by the Internet were also likely adopters.The results also suggest a common theme in
the pattern of Internet adoption. Organizations firstdemanded basic Internet technologies that were rela-tively inexpensive to adopt. These early technologieslowered communication costs through applicationssuch as e-mail and the World Wide Web, and wereadopted first by organizations with the most to gainfrom reductions in communications costs. These tech-nologies diffused rapidly. However, there remainedsome organizations for which these early technolo-gies had little value; these organizations responded bydelaying adoption.
How did recent IT investments influence adoption?Although prior investments in C/S software were
Dow
nloa
ded
from
info
rms.
org
by [
140.
120.
135.
222]
on
12 A
pril
2014
, at 0
8:21
. Fo
r pe
rson
al u
se o
nly,
all
righ
ts r
eser
ved.

Forman: Determinants of Internet AdoptionManagement Science 51(4), pp. 641–654, © 2005 INFORMS 653
complementary with Internet access, recent invest-ments in system software or LAN operating systemswere associated with a lower likelihood of adoptionfor some organizations. Moreover, the results suggestthat the costs of platform-specific software were great-est among those organizations with the most complexnetwork infrastructures. In other words, when organi-zations made platform-specific technical or organiza-tional investments that were deeply embedded in thecurrent IT infrastructure, these investments reducedthe net benefits to adopting the Internet.Prior DOI research has argued that organizations
with recent IT investments or complex IT infrastruc-ture are more likely to adopt new innovations (e.g.,Swanson 1994, Raymond and Paré 1992). However,this prior research fails to discuss how IT comesbundled with complementary technical and organiza-tional investments that may be incompatible with newtechnologies. This paper provides a unique way of dis-entangling the effects of IT sophistication and com-patibility from those of organizational differences andlock-in.Did the Internet help to break geographic bound-
aries? I focused on the relationship between geo-graphic dispersion and adoption because of the earlyuse of the Internet as a basic communications tech-nology. Relatively few studies have examined how thegeographic dispersion of the organization influencesthe adoption of new innovations. These results suggestthat geographic dispersion was complementary withaccess adoption and that Internet technology helps tolower coordination costs arising from geographic dis-persion. While prior research has shown how internalcoordination costs can lead to greater IT expenditures(e.g., Hitt 1999), this paper is unique in showing howcoordination costs may lead to more rapid adoption ofa new technology.
6.1. Implications for ManagersIn this paper, I examine organizations’ short-run reac-tions to a new communications technology. As a gen-eral purpose technology (Bresnahan and Trajtenberg1995), Internet technology diffused unevenly acrossorganizations based on exogenous factors often un-related to skill or IT sophistication. That is, organiza-tions’ short-run success in implementing Internet tech-nology for competitive advantage depended, in part,on conditions that may be largely uncorrelated withtheir past IT successes.This study suggests that early investment deci-
sions can have long-term consequences. Many orga-nizations in the sample made recent investments inC/S technologies that were incompatible with TCP/IP.These investments appeared to decrease the net bene-fits to early Internet adoption and temporarily lockedthese organizations into their earlier investments. The
analysis reinforces the point that managers investingin new IT need to consider how these investments willfit with planned acquisitions of future generations oftechnologies.The evidence suggests that Internet technology
helped to break down coordination costs related togeographic dispersion. Recent work (Forman et al.2003) has shown that basic Internet technology iscomplementary with rural location, possibly reducingexternal coordination costs with suppliers and cus-tomers. This suggests that Internet technology doeshelp to break down geographic barriers that raisecoordination costs. It remains for future work toshow whether firms modify their location decisions inresponse to these lower coordination costs.
6.2. ConclusionsOverall, these results suggest that the organizationsthat benefited most from the decreases in com-munications costs made possible by early Internettechnologies were more likely to adopt Internet tech-nologies. I find that recent IT investments may some-times have unintended consequences for the adoptionof new technologies. Moreover, these results suggestthat Internet technology helps to break down coor-dination costs related to geographic dispersion. Theresults confirm prior findings that size and externalpressure influence adoption of new IT.This study raises many new questions for future
research. For one, future work should examine howcompetition and knowledge spillovers affect Internetadoption, particularly for frontier technologies such ase-commerce, where this is likely to be most impor-tant. Moreover, additional work is needed to under-stand how Internet technology affects the long-runrelationship between advances in IT and the geo-graphic agglomeration of economic activity. Formanet al. (2003) is a step in this direction. In all, this paperhas taken a first look at understanding the forces driv-ing investment in early Internet technologies. Muchwork remains to be done in understanding how thesetechnologies have been implemented, and the impactof their usage.An online appendix to this paper is available at
http://mansci.pubs.informs.org/ecompanion.html.
AcknowledgmentsThis paper is based on chapter 4 of the author’s North-western University dissertation. The author is very grate-ful to Shane Greenstein for his guidance and support,and thanks Rajiv Banker (the Department Editor), DavidBesanko, Tim Bresnahan, Anne Gron, Ranjay Gulati, HarumiIto, Mike Mazzeo, Sandy Slaughter, Kristina Steffenson,Scott Stern, Marshall Van Alstyne, the associate editor, twoanonymous referees, and seminar participants at Berkeley,Carnegie Mellon, Georgia Tech, Harvard, Illinois, Mary-land, Northwestern, Rochester, Toronto, Texas, the Federal
Dow
nloa
ded
from
info
rms.
org
by [
140.
120.
135.
222]
on
12 A
pril
2014
, at 0
8:21
. Fo
r pe
rson
al u
se o
nly,
all
righ
ts r
eser
ved.
Forman: Determinants of Internet Adoption654 Management Science 51(4), pp. 641–654, © 2005 INFORMS
Reserve Board of Governors, the Federal Reserve Bank ofSan Francisco, the 2001 Workshop on Information Systemsand Economics, and the 2002 NBER Summer Institute formany helpful comments and suggestions. The author alsothanks the General Motors Strategy Center and the KelloggSchool of Management for generous financial support, aswell as Harte Hanks Market Intelligence for generously pro-viding the data. All errors are the author’s own.
ReferencesAttewell, P. 1992. Technology diffusion and organizational learn-
ing: The case of business computing. Organ. Sci. 3 1–19.Baynton, K. 1996. Biting the Intranet bullet. Telecommunication’s
(December) 39–42.Bernard, R. 1996. The Corporate Intranet: Create and Manage an
Internal Web for Your Organization. Wiley Computer Publishing,New York.
Boudreau, M.-C., K. Loch, D. Roby, D. Straub. 1998. Going global:Using information technology to advance the competitivenessof the virtual transnational organization. Acad. ManagementExecutive 12(4) 120–128.
Bresnahan, T., S. Greenstein. 1996. Technical progress andco-invention in computing and the uses of computers. Brook-ings Papers on Economic Activity: Microeconomics. Washington,D.C., 1–83.
Bresnahan, T., G. Saloner. 1999. Larger firms’ demand for computerproducts and services. David Yoffie, ed. Competing in the Ageof Digital Convergence. Harvard University Press, Boston, MA,265–300.
Bresnahan, T., M. Trajtenberg. 1995. General purpose technologies:“Engines of growth”? J. Econometrics 65(1) 83–108.
Bresnahan, T., E. Brynjolfsson, L. Hitt. 2002. Information technol-ogy, work organization, and the demand for skilled labor:Firm-level evidence. Quart. J. Econom. 117(February) 339–376.
Chandler, A. 1962. Strategy and Structure: Chapters in the History ofthe American Industrial Enterprise. MIT Press, Cambridge, MA.
Chwelos, P., I. Benbasat, A. Dexter. 2001. Research report: Empir-ical test of an EDI adoption model. Inform. Systems Res. 12(3)304–321.
Fichman, R., C. F. Kemerer. 1999. The illusory diffusion of inno-vation: An examination of assimilation gaps. Inform. SystemsRes. 10(3) 255–275.
Forman, C., A. Goldfarb, S. Greenstein. 2002. Digital dispersion:An industrial and geographic census of commercial Internetuse. NBER working paper 9761, Cambridge, MA.
Forman, C., A. Goldfarb, S. Greenstein. 2003. How did locationaffect adoption of the commercial Internet? Global village,urban leadership, and industry composition. NBER workingpaper 9979, Cambridge, MA.
Goolsbee, A., P. Klenow. 2002. Evidence on learning and net-work externalities in the diffusion of home computers. J. LawEconom. 45 317–343.
Gow, K. 1996. Special report: Electronic commerce: Intranets vs.Notes. Computerworld 30(76) 76, http://www.computerworld.com/news/1996/story/0,11280,16082,00.htm/.
Hannan, T., J. McDowell. 1984. The determinants of technologyadoption: The case of the banking firm. RAND J. Econom.15(Autumn) 328–335.
Hitt, L. 1999. Information technology and firm boundaries:Evidence from panel data. Inform. Systems Res. 10(2) 134–149.
Iacovou, C., I. Benbasat, A. Dexter. 1995. Electronic data inter-change and small organizations: Adoption and impact of tech-nology. MIS Quart. 19(4) 465–485.
Irwin, D., P. Klenow. 1994. Learning by doing spillovers in thesemiconductor industry. J. Political Econom. 102(6) 1200–1227.
Kalakota, R., M. Robinson. 2001. e-Business 2.0: Roadmap for Success.Addison-Wesley, Reading, PA.
Keane, M. 1992. A note on identification in the multinomial probitmodel. J. Bus. Econom. Statist. 10(April) 193–200.
Kimberly, J., M. Evanisko. 1981. Organizational innovation: Theinfluence of individual, organizational, and contextual factorson hospital adoption of technological and administrative inno-vations. Acad. Management J. 24(4) 689–713.
Klemperer, P. 1995. Competition when consumers have switchingcosts: An overview with applications to industrial organiza-tion, macroeconomics, and international trade. Rev. Econom.Stud. 62(October) 515–539.
Korzeniowski, P. 1996. Intranet 100: Ready for Prime Time. Informa-tionWeek (November 18), http://www.information.week.com/606/06/prime.htms.
Leonard-Barton, D., I. Deschamps. 1988. Managerial influence inthe implementation of new technology. Management Sci. 34(10)1252–1265.
Margherio, L., D. Henry, S. Cooke, S. Montes. 1998. The emergingdigital economy. Department of Commerce, Washington, D.C.,http://www.esa.doc.gov/reports.cfm.
McCarthy, V. 1996. Should you upgrade to Novell’s IntranetWare?Datamation (November) 82–86.
McFadden, D. 1981. Econometric models of probabilistic choice.Charles Manski, Daniel McFadden, eds. Structural Analy-sis of Discrete Data with Econometric Applications. MIT Press,Cambridge, MA, 198–272.
McFadden, D. 1986. The choice theory approach to marketresearch. Marketing Sci. 5(4) 275–297.
Orfali, R., D. Harkey, J. Edwards. 1999. The Essential Client/ServerSurvival Guide. Wiley Computer Publishing, New York.
Panko, R. 2001. Business Data Communications and Networking.Prentice-Hall, Upper Saddle River, NJ.
Porter, M. 2001. Strategy and the Internet. Harvard Bus. Rev.(March) 63–78.
Raymond, L., G. Paré. 1992. Measurement of information technol-ogy sophistication in small manufacturing businesses. Inform.Resources Management J. 5(2) 4–16.
Robertson, T., H. Gatignon. 1986. Competitive effects of technologydiffusion. J. Marketing 50(July) 1–12.
Rogers, E. M. 1995. Diffusion of Innovations. Free Press, New York.Saunders, C. 2000. Virtual teams: Piecing the puzzles together.
Robert Zmud, ed. Framing the Domains of IT Management: Pro-jecting the Future Through the Past. Pinnaflex, Cincinnati, OH,29–50.
Stefanski, L., R. Carroll. 1985. Covariate measurement error inlogistic regression. Ann. Statist. 13(4) 1335–1351.
Swanson, E. B. 1994. Information systems innovation among orga-nizations. Management Sci. 40(9) 1069–1092.
Tan, M., T. S. H. Teo. 1998. Factors influencing the adoption of theInternet. Internat. J. Electronic Commerce 2(Spring) 5–18.
Tornatzky, L., M. Fleisher. 1990. The Processes of Technological Inno-vation. Lexington Books, Lexington, MA.
Tornatzky, L., K. Klein. 1982. Innovation characteristics and inno-vation adoption-implementation: A meta-analysis of findings.IEEE Trans. Engrg. Management 29(1) 28–45.
Webster, J., L. Travino. 1995. Rational and social theories as comple-mentary explanations of communication media choices: Twopolicy-capturing studies. Acad. Management J. 38(6) 1544–1572.
Whinston, A., A. Barua, J. Shutter, B. Wilson. 2001. Measur-ing the Internet economy. http://www.internetindicators.com/jan_2001.pdf.
Williamson, O. 1975. Markets and Hierarchies: Analysis and AntitrustImplications. Free Press, New York.
Zhu, K., K. Kraemer, S. Xu. 2002. A cross-country study of elec-tronic business adoption using the technology-organization-environment framework. Proc. 23rd Internat. Conf. Inform. Sys-tems, Association for Information Systems, 337–348.
Dow
nloa
ded
from
info
rms.
org
by [
140.
120.
135.
222]
on
12 A
pril
2014
, at 0
8:21
. Fo
r pe
rson
al u
se o
nly,
all
righ
ts r
eser
ved.