determinants of deposit insurance adoption and design
TRANSCRIPT
Determinants of Deposit-Insurance
Adoption and Design*
Asli Demirgüç-Kunt (World Bank)
Edward J. Kane (Boston College and NBER)
Luc Laeven (World Bank and CEPR)
April 7, 2005
Abstract: This paper seeks to identify factors that influence decisions about a country’s financial safety net, using data on 170 countries covering the 1960-2003 period. Specifically, we focus on how outside influences, economic development, crisis pressures, and political institutions affect deposit-insurance adoption and design. Controlling for the influence of economic characteristics and events such as macroeconomic shocks, occurrence and severity of crises, and institutional development, we find that pressure to emulate developed-country regulatory frameworks and power-sharing political institutions dispose a country toward adopting design features that inadequately control risk-shifting.
Keywords: Deposit Insurance; Bank Regulation; Political Economy; Institutions
JEL Classifications: G21, G28, P51
* Demirgüç-Kunt: World Bank; Kane: Boston College and NBER; Laeven: World Bank and CEPR. We are grateful to Thorsten Beck, Stijn Claessens, Patrick Honohan, Ozer Karagedikli, and Loretta Mester for comments. We also want to thank seminar participants at the Reserve Bank of New Zealand, Victoria University of Wellington, and the 2005 AFA meetings in Philadelphia for valuable comments, Guillermo Noguera for providing excellent research assistance, and numerous colleagues at the World Bank for providing input for the deposit-insurance database. This paper’s findings, interpretations, and conclusions are entirely those of the authors and do not necessarily represent the views of the World Bank, its Executive Directors, or the countries they represent.

1
1. Introduction
Every country offers implicit deposit insurance, no matter how vigorously they may deny
it. This is because whenever a large or widespread banking insolvency occurs, pressure for
governmental relief of at least some bank stakeholders becomes politically too intense to resist,
even if no explicit deposit insurance system is in place. Adopting a system of explicit deposit
insurance does not eliminate implicit guarantees but simply supplements them with a system of
guarantees that contractually link the capitalization of a country’s private banks to the credit and
tax-collecting capacity of their chartering government.
When we code a map of the world as in Figure 1 for the year 2003, we see that countries
have no explicit deposit-insurance scheme (EDIS). However, the 1990s saw a rapid spread of
EDIS in the developing world. In January 1995 only 49 countries had an EDIS. However, by
yearend 2003, this number had surged to 87 countries, an increase of almost 80 percent.
Although a significant share of the surge can be attributed to transition countries of Eastern
Europe that were “encouraged” to adopt deposit insurance by the EU Directive on Deposit
Insurance, recent adopters can be found in all continents of the world.
This paper seeks to determine what factors influence safety-net design, focusing on a
country’s decision to adopt an EDIS and whether these same factors affect risk-shifting controls.
Our study examines data for 170 countries over 1960-2003. Our goal is to identify and interpret
how outside influences interact with domestic institutional and political factors, both in adopting
deposit insurance and in crafting the character and cost-effectiveness of the particular scheme a
country adopts.
Our interest in these questions stems from a suspicion that the spread of explicit deposit
insurance schemes across countries generates a presumption that, even when poorly designed, an
EDIS embodies a standard of best practice that is worth copying. We hypothesize that, in some
2
countries, the restraining influence of internal economic and political determinants may be
undermined by a desire to “emulate” developed-country safety-net arrangements without
adequately tailoring the design features to differences in their public and private contracting
environments. To test this hypothesis, we estimate models of deposit-insurance adoption and
design that enter proxies for outside pressure alongside a battery of domestic determinants of
regulatory decisions. Starting in the 1990s, IMF crisis-management advice recommended
erecting an EDIS as a way either of containing crises or of formally winding down crisis-
generated blanket guarantees (Folkerts-Landau and Lindgren, 1998; Garcia, 1999). This leads us
to test the complementary hypothesis that outside international pressure—i.e., an emulation
effect—might adversely influence design decisions in countries that experience a systemic crisis.
A particular focus of this paper is to explore how cross-country differences in political
systems affect decisions to adopt and design an EDIS. The presence of an EDIS and how well it
is designed affects many constituencies, especially banks, depositors, creditors, specialized
bureaucracies, and taxpayers. Because individual constituencies have conflicting interests, the
political process governing adoption and design decisions can be complex. Economists presume
that political decisionmaking promotes public and private interests. Purely public-interest
theories of regulation expect government interventions to serve society as a whole (Joskow and
Noll, 1981). Public-interest rationales for deposit insurance focus on protecting small,
uninformed depositors and assuring the stability of the banking system (Diamond and Dybvig,
1983).
Purely private-interest theories portray the public interest as an amusing fiction. Between
these extremes, theories of incentive-conflicted intervention conceive of regulatory decisions as
the outcome of interest-group competition, in which well-organized or powerful groups compete
with voters to pressure public-spirited, but opportunistic politicians and regulators for regulatory

3
interventions that authorize sponsoring groups to capture rents from other sectors (Stigler, 1971,
Peltzman, 1976, Becker, 1983).1
Deposit insurance is traditionally advocated by risky banks because they can
opportunistically exploit loopholes in the deposit-insurance system to extract net subsidies from
taxpayers and safer banks. In the United States, lobbying for deposit insurance with generous
design features has been characterized as rent-seeking behavior (Kroszner, 1998). For example,
Calomiris and White (1994) argue that federal deposit insurance benefited predominantly smaller
and poorly diversified unit banks and that, had not the Great Depression reduced confidence in
the banking system as a whole, their pleas for federal insurance could not have overcome the
opposition of politically stronger large banks. Kane and Wilson (1998) show that, in the face of
the Great Depression, large banks’ wish list changed and that large-bank share prices benefited
greatly from introducing deposit insurance precisely because depositors had lost confidence in
banks of all sizes.
Especially in the financial-services industry, political competition is strong. For this
reason, it is natural to suppose that differences in political systems would influence safety-net
design. Features of a country’s private and public contracting environments have been shown to
be important in deposit-insurance adoption and design (Demirgüç-Kunt and Kane, 2002).
Financial institutions regularly lobby for “reforms” that promise to increase their franchise value
(Kroszner and Stratmann, 1998). When a country’s political system is more democratic, the
voices of special interests can more easily be heard. This leads us to hypothesize that political
power sharing makes EDIS adoption and subsidy-generating design features more likely.
In testing this hypothesis, candidate economic control variables include macroeconomic
conditions and variation in the ownership structure of the banking system (as proxied by state-
1 See Kroszner and Strahan (2001) for a more detailed discussion of the alternative political-economy views of

4
owned banks’ market share). To establish the robustness of our results, we experiment with a
variety of statistical methods and alternative indices of economic, political, and cultural
influences.
A long literature analyzes the benefits and costs of explicit deposit insurance and
explores theoretically the challenges of designing an optimal deposit-insurance system.2 More
recently, a complementary body of empirical research has emerged. Using a cross-country
dataset, Demirgüç-Kunt and Detragiache (2002) and Demirgüç-Kunt and Huizinga (2004) study
how EDIS design features affect banking-system fragility and market discipline. In poor
institutional settings, generous design features tends to destabilize the banking system and to
undermine market discipline. Hovakimian, Kane and Laeven (2003) and Laeven (2002) show
that weak institutional environments undermine deposit-insurance design. Cull, Senbet and Sorge
(2004) produce evidence that, in weak institutional environments, an EDIS retards financial
development rather than fosters it. Looking only at crisis countries, Honohan and Klingebiel
(2003) and Kane and Klingebiel (2004) show that blanket deposit-insurance guarantees – when
adopted as a crisis-management strategy – increase the fiscal cost of resolving distress without
reducing either the cumulative output loss or the duration of the crisis.
Laeven (2004) studies how political processes influence coverage levels across countries.
We extend this analysis by simultaneously modelling the adoption decision and several other
design features. In the process, we compile a panel data set of evolving design features. The
novelty of our paper lies in: (i) providing cross-country evidence on the common determinants of
EDIS adoption and design; and (ii) updating and extending the deposit-insurance dataset
developed in earlier studies, tracking changes in EDIS design across time in each country.
deposit insurance. 2 See for example, Diamond and Dybvig (1983), Chari and Jagannathan (1988), Kane (1995), Calomiris (1996), Bhattacharya et al. (1998), and Allen and Gale (1998).

5
High-income, institutionally more advanced countries and those that experience a
financial crisis are also more likely to adopt an EDIS. Outside influences prove especially
important in the adoption decision, particularly during crisis periods. Even when we control for
income and institutional quality, external pressures and internal politics play significant roles.
Countries with more-democratic political systems prove more likely to adopt an EDIS and to
incorporate inadequate risk controls, all the more so if adoption occurs during or in the wake of a
crisis.
The rest of the paper is organized as follows. Section 2 reviews the dataset and the
sources used to construct it. It also presents summary statistics for all included variables.
Section 3 explores single-equation models of the adoption decision. Section 4 incorporates a
baseline adoption equation into simultaneous models of safety-net design. Section 5 summarizes
our findings and explains their policy implications.
2. Data
Our goal is to investigate the extent to which regression methods can explain whether and
when a country installs a system of explicit deposit insurance and, if so, how well that system is
designed. To this end, we construct a unique dataset covering all countries that have adopted
explicit deposit insurance through yearend 2003, relying on official country sources and
information provided by World Bank country specialists.
Our set extends the Demirgüç-Kunt and Sobaci (2001) database in two ways: first, we
update the endpoint to 2003 to include data on recent adopters; second, we create a time-series
dataset of individual-country design features. We compile data on coverage, not only for the
year 2000 but for every year in which an EDIS existed. For example, coverage levels in the
United States have been revised five times: from US$ 5,000 at adoption in 1934, to US$ 10,000

6
in 1950, to US$ 15,000 in 1966, to US$ 20,000 in 1969, to $40,000 in 1974, and to US$ 100,000
since 1980.
Table 1 partitions 181 sample countries for which we have per-capita income data into
four income groups and shows that the propensity to adopt an EDIS rises with income. Table 2
lists adopting countries and the year their EDIS was installed.
Table 3 lists the design features our dataset covers and the country characteristics our
regression experiments employ. The unit of observation is a country-year. The table presents
summary statistics for all variables. For each variable, detailed definitions and sources are
provided in Appendix Table 1.
In studying deposit-insurance adoption and design, the number of country-years to be
sampled is an element of research strategy. One natural starting point is 1934, when the U.S.
Federal Deposit Insurance Corporation opened its doors. If we begin in 1934, the maximum
sample size is 181 x 40 = 7,240. Later starting dates are more attractive because we want to
examine whether and how the occurrence of a financial crisis might influence deposit-insurance
adoption and design. As it happens, a cross-country dataset on crises (Caprio and Klingebiel,
1996) begins in 1970, although it is thought to be more reliable after 1975. If we begin in 1975,
the maximum sample size is 181 x 29 = 5,249. For the adoption models we fit, coefficient
estimates prove much the same whether we start the clock at 1934, 1970, or even 1980. Of
course, because observations are missing for some explanatory variables in many countries, the
number of usable observations is much less than these maximum values. The usable sample
increases markedly when we restrict the determinants of EDIS adoption and design to measures
of inflation, per capita GDP and GDP growth.
The first column of the first panel of Table 3 lists a series of endogenous deposit-
insurance design features. The mean value of the EDIS indicator variable, Deposit insurance,

7
states the proportion of country-years in which the countries in our sample included explicit
deposit guarantees in their safety net. This turns out to be 17 percent, since many countries
adopted EDIS relatively recently. The mean value of indicator variables for specific design
characteristics tells us what proportion of installed schemes incorporates each particular
characteristic. All variables are constructed so that higher values indicate an increased exposure
to risk shifting. Higher values indicate that, according to the empirical literature, moral hazard is
less effectively controlled by that particular design feature. Indicator variables take the value
one: if the administration is publicly managed (Administration), if membership is voluntary
(Membership), if foreign currency deposits and interbank deposits are covered (Foreign currency
deposits and Interbank deposits), if there is no coinsurance (Coinsurance), if a permanent fund
exists (Permanent fund), and if funding comes from only public sources (Funding). The last two
endogenous variables are: (1) the EDIS coverage ratio (Coverage ratio), which we define as the
ratio of the maximum insured value of individual account balances to per-capita GDP; and (2) a
proposed overall “moral hazard index” (Moral hazard), which we represent by the first principal
component of the variance-covariance matrix for the coverage ratio and indicator variables for
the six other features.
We represent outside influences in several different ways. External Pressure is a dummy
variable that takes the value one for the years 1999 on. In 1999, the IMF published a best-
practice paper on deposit insurance and its design, recommending explicit deposit insurance for
developing countries. The World Bank also recommended explicit deposit insurance for specific
developing countries during the sample period. World Bank Loan is an indicator variable that
moves from zero to one for individual countries starting in the year the World Bank began an
adjustment lending program that entailed EDIS installation. European Union directives also
encouraged deposit-insurance adoption. To capture this effect, we deploy two indicators: EU

8
Directive and EU Candidacy. In 1994, the EU’s directive encouraging countries to adopt deposit
insurance came into force. For EU member countries, EU Directive is set to one from 1994 on,
but is zero otherwise. Since the directive was aimed at candidate countries, EU candidacy takes
the value of one from 1994 on for EU candidate countries only and is zero otherwise. Finally,
we introduce a variable, Emulation, which is the interpretive name we assign to the nonlinear
trend that tracks the proportion of countries having EDIS systems at each point in time. As more
and more countries adopt an EDIS, Emulation increases in value. We interpret this ratio as a
proxy for the extent to which deposit insurance might be believed to be a universal best practice.
Our regressions use External Pressure as the main measure of outside influence, but check the
robustness of our results with the alternative indicators.
We also investigate whether and how the occurrence and fiscal cost of a financial crisis
might affect the timing and character of deposit-insurance decisions. Crisis dummy moves from
zero to one for countries that are experiencing a crisis in a given year. Post-crisis adoption
variable is an indicator variable that identifies countries that adopted EDIS up to three years after
a crisis. Fiscal cost/GDP expresses the fiscal cost of resolving a banking crisis as a percentage
of GDP. This variable lets us explore how crisis severity might influence safety-net decisions.
To represent the political character of a country, we focus on Executive constraints. This
index measures the extent to which institutionalized constraints on the decision-making powers
of the country’s chief executive create other “accountability groups.” The index ranges from 1 to
7. Higher values indicate increased restriction on executive authority. As alternative political
indicators, we also experiment with Polity score, Political competition, and Democratic
accountability. Polity score ranges from –10 to 10, with negative scores assigned to countries
that are autocracies and positive values to democracies. Political competition ranges from 1 to
10, with higher scores representing increased political competition. Finally, Democratic

9
accountability measures how responsive the government is to its people and whether changes
occur peacefully or violently. It ranges from 0 to 6, with values increasing with the extent of
democracy.
Macroeconomic variables controlling for differences in the economic environment
include Real interest rate, Inflation, GDP growth, Terms of trade change, and Credit growth.
Movement in these variables captures the extent of internal and external macroeconomic shocks
the countries experience. Real interest rate and Inflation are defined as the annual rates of real
interest and inflation, respectively. GDP growth is the growth rate in real GDP and Credit
growth is the growth rate in the amount of real credit extended to the private sector by financial
intermediaries. Terms-of-trade change states the annual percentage change in terms of trade.
To control for the effects of cross-country variation in the extent to which the government
is a bank owner, we include a government-ownership ratio. Government ownership states the
percentage of government ownership in the banking system. We also control for the importance
of banks in the economy by including Bank Deposits/GDP, which is total deposits in banks as a
share of GDP. When bank deposits represent a larger share of GDP, banks might prove more
powerful and better able to lobby for deposit-insurance subsidies.
To measure the institutional development of the country, we use GDP per capita, and
indices for Bureaucracy, Corruption, and Law and Order. Bureaucracy ranges from 0 to 4,
increasing in the strength and quality of the bureaucracy. Corruption measures how well bribery
is controlled in the country. It ranges from 0 to 6, with low scores indicating high levels of
corruption. Law and Order expresses the quality of country’s legal system and rule of law. It
ranges from 0 to 6, where high scores indicate a high level of law and order.
Table 4 reports the correlation matrix of deposit-insurance variables and country
characteristics across the years and countries for which data are available for both members of

10
each pair of variables. We find that the presence of explicit deposit insurance is positively
associated with economic development (as measured by GDP per capita), external-pressure
indicators, crisis experience, and constraints on executive authority. For countries with explicit
insurance, we find that coverage levels and exposures to moral hazard are higher when per capita
GDP and constraints on executive authority are low, and during periods of increased external
pressure. Coverage levels prove higher in countries where government ownership of banks is
more extensive. Because we expect the same variables to influence adoption and design, design
decisions must be modelled simultaneously with adoption. Because it ignores potential selection
bias, Table 4 probably overstates the bivariate correlation of deposit-insurance characteristics
with country variables. To avoid selection bias, regressions seeking to explain design decisions
are estimated simultaneously with an EDIS adoption equation whose relatively parsimonious
specification is based on evidence generated by first fitting alternative single-equation models of
the adoption decision.
3. Empirical Results of the Adoption Decision
A. Logit Models of the Adoption Decision
Tables 5 through 9 report on stepwise regression experiments aimed at developing a
benchmark model of the adoption decision. The first-cut model appears in the first column of
Table 5. It relates the indicator variable, Deposit insurance, to six macroeconomic variables:
Real interest rate, Inflation, GDP growth, Credit growth, Terms of trade, and GDP per capita.
This experiment establishes the baseline extent to which macroeconomic variables alone can
explain the presence or absence of explicit deposit guarantees. Consistent with our preliminary
analysis, GDP per capita shows the strongest influence. The second column shows that, except
for GDP per capita and Inflation, the estimated influence of macroeconomic forces becomes

11
negligible when year dummies are introduced. This experiment also confirms that individual-
country adoption decisions are significantly influenced by the spread of these schemes across
countries.
The third column steps in the External Pressure indicator. This variable proxies
encouragement from international entities to install explicit insurance. As expected, External
Pressure earns a significant and positive coefficient. The probability of adopting an EDIS
increases after the IMF endorsed such schemes as best practice.
The other seven experiments in Table 5 make use of our preferred political variable,
Executive constraints. The results indicate that political systems that more strongly constrain
their executive are more likely to adopt an EDIS. Regression 5 includes Executive constraints
with External Pressure and shows that both are significant. Columns 6 and 7 show that
coefficient values and significance patterns found for the GDP per capita, External Pressure and
Executive constraints are virtually unaffected by moving the starting date of the study forward
either to 1970 or to 1980.
Column 8 drops three consistently insignificant macro variables whose spotty availability
constrains the usable size of our sample. This relatively parsimonious model also serves as the
“benchmark” model for subsequent regression experiments. This experiment indicates that
inflation loses significance in the enlarged sample, while the coefficients of GDP per capita,
External Pressure, and Executive constraints remain much the same and model performance is
enhanced.
The logit models estimated in columns 1 through 8 assume that a country makes each
year a decision about changing its deposit-insurance status.3 However, once explicit insurance is
in place, countries rarely jettison it. In column 9, we investigate—by dropping all post-adoption

12
observations—how much including the period after the adoption decision biases estimates.
Coefficients of interest remain significant, but their magnitude declines.
To communicate the economic significance of these findings and to sharpen their
interpretation, it is helpful to calculate the marginal influence each regressor has on the
probability of adoption. Using the mean of each explanatory variable in regression 8, Column 10
reports each variable’s marginal effect (and standard error). For example, GDP per capita is
expressed in thousands of U.S. dollars. Its coefficient in column 10 implies that, on average, a
US$ 1000 increase in GDP per capita brings about a 0.01 increase in adoption probability. It is
particularly instructive to calculate the marginal effect of a one-standard-deviation increase in
each regressor. A one-standard-deviation increase in GDP per capita (or US$ 8660) is associated
with a 0.08 increase in the probability of deposit-insurance adoption; a one-standard-deviation
increase in emulation (or 0.32) is associated with a 0.09 increase in the probability of deposit-
insurance adoption; and a one-standard-deviation increase in executive constraints (2.34) is
associated with a 0.10 increase in the probability of deposit-insurance adoption. Relative to the
0.22 mean value the deposit-insurance variable in the column-10 sample, these incremental
effects are substantial. This exercise shows that one standard-deviation increases in GDP per
capita, Executive Constraints, and Emulation have similar impacts on adoption probability.
Table 6 introduces alternative proxies for external pressure. Panel A shows that whatever
measure we use—World Bank Loan, EU Directive/Candidacy, Emulation—outside forces
significantly influence adoption decisions. Indeed, the last column shows that, when entered
together, IMF, World Bank, and EU Directive influences are each significant.4 Panel B
replicates these results, controlling for a linear time trend. Even in the presence of this
3 However, we do allow for correlation among errors for each country by estimating Logit using clustered errors at the country level. 4 Because Emulation and External Pressure are very highly correlated at 80 percent, we exclude Emulation from Column 8.

13
uninterpreted trend, pressure from the three multinational organizations significantly influences
adoption decisions. In specifications that include the trend, World Bank Loan and EU Directive
remain significant at conventional levels, while External Pressure and Emulation prove
marginally significant at ten percent.
Table 7 investigates whether and how financial-crisis experience, bank ownership,
institutional quality, and bank dependence affect the adoption decision. The experiment depicted
in the first column supports the hypothesis that countries that experience a crisis are more likely
to adopt an EDIS. The second column confirms the hypothesis that an EDIS is likely to be
adopted as a way of unwinding a crisis, while the third column shows that the odds of adoption
increase with the fiscal burden the particular crisis poses.5
Columns 4 and 5 of Table 7 explore whether EDIS adoption and government ownership
are substitute ways of protecting depositors. The datasets used to generate the ownership data
cover a much smaller number of countries. Government ownership and privatization prove
insignificant, but their inclusion reduces the coefficient assigned to per-capita GDP. Although
Government ownership is itself a trend variable in many countries,6 the size and significance of
the External Pressure coefficient prove higher in this specification than in the benchmark model.
Columns 5 to 7 of Table 7 further explore the impact of institutional quality. By
institutional quality, we mean contractual enhancements generated by the institutional
environment in which banks and customers contract. Our benchmark specifications begin with
GDP per capita, which is a widely recognized correlate of institutional quality. We insert
5 Demirgüç-Kunt and Detragiache (2002) show that bank crisis probabilities increase with the adoption and generous design of an EDIS. Their results are robust to: (i) restricting the sample to countries that only adopted deposit insurance previous to crises and excluding crisis periods, and (ii) estimating a two-equation model where the emulation variable serves as the instrument for the first-stage adoption model. Thus, while EDIS is more likely to be adopted as a result of crises, adoption directly increases fragility. 6 In 1970, 29 countries out of 92 (31.5%) had more than 90% government ownership of banks. In 1995, 11 countries out of 92 (12.0%) had more than 90% government ownership of banks. In 1970, only one country (India)
14
Bureaucracy, Corruption, and Law and Order into the model to investigate whether variation in
these indices affects the adoption decision. We find weak evidence that more-corrupt countries
are more likely to adopt deposit insurance, but neither of the other institutional variables enter
significantly. Importantly, External Pressure and Executive constraints remain positive and
significant even after controlling for institutional quality.
Finally, column 8 controls for the importance of banks in the economy by introducing
Bank deposit/GDP. One might suppose that, when banks play a more important role, risky banks
more effectively might promote their interests. This hypothesis is rejected. The relevant
coefficient is insignificant and its inclusion does not affect the significance levels of other
regressors.
Table 8 introduces alternative proxies for political power-sharing. Columns 2 and 3
replace Executive constraints with two alternative measures: Polity score and Political
competition. Both variables come out of the University of Maryland’s INSCR Program. The
INSCR program covers more countries than the third index featured in the Table, which comes
from the International Country Risk Guide (ICRG) database. Both INSCR variables show a
similar effect: Countries with effective systems of political checks and balances are more likely
to adopt an EDIS than countries in which political power is more concentrated. Each variable
shows a positive and significant impact on the adoption decision. Introducing either one of them
reduces the GDP per capita coefficient by about a standard error, but has a negligible effect on
the coefficient of External Pressure. The last column introduces the ICRG’s measure of
Democratic accountability. This measure also enters significantly and reduces the external
pressure and per capita GDP coefficients more than the INSCR indices.
of the 29 countries with more than 90% government ownership of banks had an explicit deposit insurance system in place. In 1995, two of the 11 countries with more than 90% government ownership of banks had an EDIS.

15
Table 9 uses the baseline model to investigate how much the impact of External Pressure
and Executive constraints varies across regions and country types. The first three columns
investigate whether the European Union requirement that member countries adopt an EDIS
might be responsible for the significance of External Pressure, Executive constraints, and GDP
per capita. Although the coefficients of GDP per capita and External Pressure decline when
EU countries are excised from the sample, their effects remain sizeable and significant.
Executive Constraints shows a slightly larger effect in this sample. On the other hand, columns 4
to 6 show that deleting very small countries from the sample increases the coefficients of these
three variables. Finally, the last three columns establish that introducing a fixed effect for each
continent virtually halves the effect of variation in GDP per capita, intensifies the effect of
External Pressure, and lessens the effect of Executive constraints.
These regression experiments strongly support a role for External Pressure and Executive
constraints in EDIS adoption decisions. This finding is robust to numerous changes in
specification, such as introducing proxies for crisis pressures, macro shocks, institutional quality,
population size, and regional differences in culture. GDP per capita— a frequently used proxy
for economic and institutional development— remains significant in alternative specifications
and does not eliminate the significance of External Pressure and Executive constraints. The next
section demonstrates that these conclusions are robust to the use of an alternative statistical
method.
B. Hazard Models of the Adoption Decision
Another way to analyze the timing of adoption decisions would be to regress the duration
of a country’s stay in the non-EDIS state (state N) against subsets of the determinants we used in
the logit models. The difficulty with this approach is that countries that are in state N at yearend

16
2003 would give incomplete (i.e., downward-biased or right-censored) data on the length of their
stay.
Hazard models surmount this problem by focusing instead on the transitional probability
of staying in state N for a spell of exactly t years, where results for t>43 can be extrapolated from
the transitions observed. The hazard rate λ(t) may be interpreted as the probability of country’s
leaving state N in year t, given that it was in state N when the year began. The logit models
estimated in the previous section imply that this probability λ is a function of country
characteristics as well as time.
As a robustness test, Table 10 fits a series of hazard-rate models that let us examine how
different factors affect a country’s probability of transitioning to an EDIS. The first three
columns of the table estimate each of three widely used hazard models, using only the
benchmark macro determinants identified in Table 5. The Cox procedure models the hazard rate
as:
λi(t) = λ(t) exp (β'xi), (1)
where x is any specified vector of potential explanatory variables. The exponential procedure
imposes on (1) the restriction that λ(t) = λ. Finally, the Weibull model specifies that λ(t) in (1)
evolves as:
λ(t) = λαtα-1. (2)
The evolutionary parameter α determines whether the hazard rate is increasing (α > 1),
decreasing (α < 1), or constant (α = 1) over time. High and significant values of α (which
emerge in all of our Weibull specifications) denote positive duration dependence and can be
interpreted as evidence of external influence or emulation. Because our dataset reduces to a
cross section of durations when employing duration-model techniques, we compare alternative
specifications of the hazard model (focusing specifically on the values of α) to investigate the

17
presence of external influence rather than estimating a time trend or including Emulation as an
explanatory variable.
Because explanatory variables enter exponentially, the coefficients reported in Table 10
are the logarithms of the underlying relative hazard coefficients. The relative hazard coefficients
can be calculated as the antilog of the reported coefficients. The exponent of each coefficient
estimate shows the proportional increase in the hazard rate that occurs when the focal
explanatory variable increases by one unit. Regression 3 may serve as an example.
GDP per capita is denominated in thousands of U.S. dollars. The results show that: If
GDP per capita increases by one unit (i.e., by one-thousand dollars), then the hazard rate for
adopting deposit insurance increases by exp(0.069) = 1.071 fold (or an increase of about 7
percent). This tells us that countries with higher GDP per capita are more likely to adopt sooner.
On the other hand, countries with higher Inflation or more-rapid GDP growth are likely to delay
deposit-insurance adoption, although these restraining effects are not statistically significant.
In regression 3, the estimated value of α is 4.49 (positive and significant). This tells us
that the hazard function for adopting deposit insurance is increasing rapidly over our sample
period 1934 – 2003. To see just how quickly, we can compare the hazard rates for the years
1980 and 2003. Focusing on the estimate of α in column 3, we find that for a typical country:
.53.3)46/66()46/66()46()46()1980()66()66()2000( 149.41
1
1
======= −−
−
−α
α
α
λλαλλλλαλλ
YearYear
This tells us that such a country is 3½ times more likely to adopt deposit insurance in 2000 than
in 1980. This nonlinear trend approximates the Emulation effect that we estimate in our Logit
specifications.
The first three columns of Table 9 indicate that all three procedures for estimating the
hazard rate assign similar roles to the benchmarked macro variables, but only GDP per capita

18
shows a significant effect. The fourth column confirms that only the one macro variable is
significant.
Columns five through eight use the Cox or Weibull procedure and expand the set of
variables to include measures of government power-sharing and crisis experience. The
significant positive values of α in the Weibull models support our contention that external
influence is important: the likelihood of adoption (the “transforming event”) at time t,
conditional upon duration up to time t, increases over time. Among the external influence
variables, World Bank Loan, EU Directive and EU Candidacy are still significant and positive
confirming earlier results. External Pressure loses significance but as in the case of Emulation,
its impact is actually captured by the evolutionary trend α.
The significance of the Crisis dummy confirms the hypothesis that EDIS is more likely to
be adopted during crisis. Finally, the significantly positive sign captured by the government
power-sharing variable Executive constraints and the fact that its inclusion reduces the impact of
GDP per capita indicate that social capital plays an important role in adoption decisions:
democratic countries are more likely to adopt an EDIS, confirming again our initial findings.
The results are similar when using the Cox model rather than the Weibull procedure, except that
the Cox model excludes the possibility of time variation in the hazard rate.
Table 11 reports out-of-sample predictions of the year of adoption for countries that had
no deposit insurance by yearend 2002 – the end of our sample period. These estimates are based
on the Weibull duration model in column 9, Table 10. We also report estimates of the number of
years until each country without an EDIS can be expected to adopt deposit insurance given year
2002 circumstances. For a large number of countries, particularly poor countries in Africa, the
model predicts adoption not until more than a decade from now. For example, for Zimbabwe the
model predicts adoption in the year 2021. (In reality, Zimbabwe adopted deposit insurance

19
“prematurely” in the year 2003). Based on our model, one would have expected several other
countries to already have adopted deposit insurance (for example, rich countries like Australia
and New Zealand, but also China).
4. Explaining Deposit-Insurance Design
A credible EDIS builds and maintains depositor confidence even in dangerously fragile
and broken banks. For this reason, the fairness and efficiency of a country’s safety-net design
may be measured by the extent to which design features promise to preserve the system’s
financial integrity without either subsidizing or penalizing bank risk-taking. Theories of interest-
group interaction suggest that, in almost every country, society may count on bank clout and
lobbying activity to curtail unfair and inefficient restrictions on bank risk-taking. However,
these same theories suggest that, in many environments, weak and risky banks can use their clout
to persuade authorities to subsidize risk (Laeven, 2004.)
In Table 12, we investigate how outside influences and the political system influence the
generosity of the system design, controlling for macro shocks, crisis experience, and institutional
development. By the “generosity” of a design feature, we mean the extent to which empirical
evidence summarized in Demirgüç-Kunt and Kane (2002) indicates that its presence or size
promotes bank risk-taking (i.e., moral hazard). We investigate decisions about the coverage ratio
separately because: (i) coverage limits are is particularly important in controlling moral hazard,
and (ii) compared to other design features, our time-series data on coverage is of better quality.
However, to recognize that the particular combination of features chosen might mute or reinforce
the impact of some of the others, we introduce a variable we call Moral Hazard, defined as the
first principal component of the covariance matrix of the eight individual features listed in
section 2. We also explore an alternative Moral Hazard without coverage variable that focuses

20
on design features excluding coverage. In constructing the covariance matrix, all design features
are standardized to have a mean of zero and a standard deviation of one.
We estimate decisions about features in a two-stage Heckman selection framework. The
first stage is an EDIS selection model, using regressors that represent forces whose significance
was established in Sections II and III. We report both Heckman’s two-step estimates and
Maximum Likelihood (ML) estimates. In Panel A, the first and second-stage models have the
same variables, while in Panel B we exclude the GDP per capita variable in the second stage
equation for model identification purposes. Although not constrained to be the same across
features, first-stage coefficients are virtually identical in all columns. Second-stage regressions
incorporate a regressor (called the Heckman Lambda) that accounts for the sample-selection bias
that would emerge if a single-equation estimator were used. This regressor proves positive and
significant for all specifications, confirming that characteristics that promote adoption also
encourage generosity in design. Where significant, the second-stage coefficients for
determinants of particular features always show the same sign.
The first three specifications in Panel A, Table 12 explain (the logarithm of) coverage
ratios, while the last two model the moral-hazard composites. These regressions show that that
External Pressure is a significant determinant of EDIS adoption and the two moral-hazard
composites. External Pressure does not have a significant impact on the coverage ratio.
Executive Constraints exert a positive influence on the moral-hazard composites,
although this effect is marginally significant (at the 10% level). This means that countries with
more-democratic political systems prove not only more likely to adopt an EDIS, but also more
likely to install design features that entail substantial moral hazard. Again, the effect on coverage
ratios is not significant.
21
Crises dispose a country to design a more generous EDIS. This is indicated by the
positive and significant coefficients the Crisis dummy receives in both stages. These results
provide further evidence that systems adopted in crises tend to be poorly designed (Hovakimian,
Kane, and Laeven 2003).
Among the strictly economic variables, we find that GDP per capita increases the
probability of adoption, but has no significant impact on design. Interestingly, Inflation proves
significant in both stages, and it is the only determinant that seems both to restrain adoption and
to promote better design.
We find similar results when we exclude the GDP per capita variable in the second stage
equation (columns 1-2 in Panel B) and when we use the ML estimator instead of Heckman’s two
step procedure (columns 3-4 in Panel B). When we include fixed year effects, the External
pressure variable is no longer significant in the moral hazard regressions, but the Crisis dummy
variable still enters positive and significantly (columns 5-8 in panel B).
In Table 13, we report the model predictions of coverage ratios for countries with no
deposit insurance at yearend 2002. These predictions are based on the Heckman two-step model
in column 1 of Panel A, Table 12. The predicted coverage ratios for this sub-set of countries
ranges from 0.41 for Angola to 1.33 for China, well below the world average of actual coverage
ratios of existing deposit insurance schemes, which stood at 2.45 at yearend 2002. This is to be
expected given the below-average level of economic development of most countries that have
not yet adopted deposit insurance.
5. Summary and Implications
Because banks play a key role in pricing and constraining risk-taking in other sectors, a
well-regulated banking sector may be characterized as a cornerstone of a well-functioning

22
national economy. Regulatory systems are asked to establish and enforce efficient standards for
bank behavior. Deposit insurance is an important and potentially constructive element of a
country’s financial safety net.
To study the spread of explicit deposit insurance systems over the last decades, this paper
uses data on 170 countries to identify the determinants of a country’s decision to adopt and
design an EDIS. Specifically, we focus on how outside influences and internal political factors
feed into this decision-making process. Our results indicate that democratic political processes
and external pressure to emulate developed-country regulatory frameworks promote adoption
and dispose a country toward generous design. Adoption proves more likely during or after a
crisis, presumably because countries are more likely to undertake regulatory reform during
distressed times. Unhappily, crisis pressures are likely to result in design features that
inadequately control moral hazard. Robustness tests show that these findings survive a range of
different statistical methods, control variables, sample periods, and country types.
While we find that richer and more institutionally developed countries are more likely to
adopt explicit deposit insurance, such countries better manage the design features. Among the
controls, only inflation plays a restraining role.
Our major policy implication is not that deposit insurance is bad. It is that, ceteris
paribus, systems installed in crisis circumstances and in response to external pressures to
emulate other countries are apt to be poorly designed. We find it striking that democratic
systems—which allow sectoral interests to exert a stronger influence on policymakers—have a
greater tendency to adopt deposit insurance and (at least initially) to design it poorly.
Econometrically, finding that deposit-insurance selection and design decisions are
simultaneously determined implies that cross-country studies seeking to determine how the
presence or absence of an EDIS affects the performance of a country’s financial sector and

23
national economy ought to base their inferences on a multiple-equation system of safety-net
design.

24
References
Allen, Franklin, and Douglas Gale. 1998. “Optimal Banking Crises” Journal of Finance 53 (4),
1245-1284.
Barro, Robert J., and David B. Gordon. 1983. “A Positive Theory of Monetary Policy in a
Natural Rate Model.” Journal of Political Economy 91, 589-610.
Barth, James R., Gerard Caprio, and Ross Levine. 2004. “Bank Regulation and Supervision:
What Works Best?” Journal of Financial Intermediation, forthcoming.
Beck, Thorsten, George Clarke, Alberto Groff, Philip Keefer, and Patrick Walsh. 2001. “New
Tools in Comparative Political Economy: The Database of Political Institutions.” World
Bank Economic Review 15, 165-176.
Becker, Garry S. 1983. “A Theory of Competition among Pressure Groups for Political
Influence.” Quarterly Journal of Economics 98, 371-400.
Bhattacharya, Sudipto, Arnoud W.A. Boot, and Anjan V. Thakor. 1998.”The Economics of Bank
Regulation” Journal of Money, Credit and Banking 30 (4), 745-770.
Calomiris, Charles, 1996. “Building an incentive-compatible safety net: special problems for
developing countries. Mimeo, Columbia University.
Calomiris, Charles, and Eugene White. 1994. “The Origins of Federal Deposit Insurance,” In:
Claudia Goldin and Gary Libecap, eds., The Regulated Economy: A Historical Approach
to Political Economy. Chicago: University of Chicago Press, pp. 145-188.
Caprio, Gerard, and Daniela Klingebiel. 2002. “Episodes of Systemic and Borderline Financial
Crises.” World Bank: Mimeo.
Chari, Varadarajan V., and Ravi Jagannathan. 1988. Banking Panics, Information, and Rational
Expectations Equilibrium, Journal of Finance 43, 749-761.
Cull, Robert, Lemma Senbet and Marco Sorge, 2004, “Deposit Insurance and Financial
Development,” Journal of Money, Credit and Banking, forthcoming.
Demirgüç-Kunt, Asli, and Enrica Detragiache. 2002. “Does Deposit Insurance Increase Banking
System Stability? An Empirical Investigation.” Journal of Monetary Economics 49,
1373-1406.
Demirgüç-Kunt, Asli and Harry Huizinga. 2004. “Market Discipline and Deposit Insurance.”
Journal of Monetary Economics 51, 375-399.
Demirgüç-Kunt, Asli, and Edward Kane. 2002. “Deposit Insurance Around the World: Where
Does it Work?” Journal of Economic Perspectives 16, 175-195.

25
Demirgüç-Kunt, Asli, and Luc Laeven. 2005. Deposit Insurance Data, World Bank mimeo.
Demirgüç-Kunt, Asli, and Tolga Sobaci. 2001. “A New Development Database. Deposit
Insurance around the World.” World Bank Economic Review 15, 481-490.
Diamond, Douglas, and Philip Dybvig. 1983. “Bank Runs, Deposit Insurance and Liquidity.”
Journal of Political Economy 91, 401-419.
Economides, Nicholas, R. Glenn Hubbard, and Darius Palia. 1996. “The Political Economy of
Branching Restrictions and Deposit Insurance.” Journal of Law and Economics 29, 667-
704.
European Commission. 1994. Directive 94/19/EC of the European Parliament and of the
Council of 30 May 1994 on deposit-guarantee schemes, O.J., L135, pp.5-14.
Folkerts-Landau, David, and Carl-Johan Lindgren. 1998. “Toward a Framework for Financial
Stability.” Mimeo. International Monetary Fund, Washington, DC.
Garcia, Gillian G. 2000. “Deposit Insurance: Actual and Good Practices.” Occasional Paper No.
197, International Monetary Fund.
Giammarino, Ronald, Eduardo Schwartz, and Josef Zechner. 1989. “Market Valuation of Banks
Assets and Deposit Insurance in Canada.” Canadian Journal of Economics 22, 109-127.
Grossman, Gene, and Elhanan Helpman. 2001. Special Interest Politics. Cambridge MA: MIT
Press.
Honohan, Patrick and Daniela Klingebiel. 2003. “The Fiscal Cost Implications of an
Accommodating Approach to Banking Crises.” Journal of Banking and Finance 27 (8),
1539–1560.
Honohan, Patrick, and Luc Laeven. 2005. Systemic Financial Crises: Containment and
Resolution. Cambridge: Cambridge University Press, forthcoming.
Hovakimian, Armen, Edward Kane, and Luc Laeven. 2003. “How Country and Safety-Net
Characteristics Affect Bank Risk-Shifting.” Journal of Financial Services Research 23,
177-204.
International Monetary Fund. 1999. Report on the Observance of Standards and Codes:
Bulgaria. Section VI. System of Deposit Insurance. Washington, DC: International
Monetary Fund. http://www.imf.org/external/np/rosc/bgr/depos.htm
Joskow, Paul L., and Roger G. Noll. 1981. “Regulation in Theory and Practice: An Overview.”
In: G. Fromm, ed., Studies in Public Regulation. Cambridge: MIT Press, pp. 1-65.

26
Kane, Edward J. 1995. “Three Paradigms for the Role of Capitalization Requirements in Insured
Financial Institutions.” Journal of Banking and Finance, 19:3-4, pp. 431-59.
Kane, Edward J. 1996. “De Jure Interstate Banking: Why Only Now?” Journal of Money, Credit,
and Banking 28, 141-161.
Kane, Edward J., and Berry K. Wilson. 1998. “A Contracting-Theory Interpretation of the
Origins of Federal Deposit Insurance.” Journal of Money, Credit, and Banking 30, 573-
595.
Kane, Edward J., and Daniela Klingebiel, 2004. “Alternatives to Blanket Guarantees for
Containing a Systemic Crisis,” Journal of Financial Stability, 1, 31-63.
Kroszner, Randall S. 1998. “The Political Economy of Banking and Financial Regulatory
Reform in Emerging Markets.” Research in Financial Services 10, 33-51.
Kroszner, Randall S., and Philip Strahan. 1999. “What Drives Deregulation? Economics and
Politics of the Relaxation of Bank Branching Restrictions.” Quarterly Journal of
Economics 114, 1437-1467.
Kroszner, Randall S., and Philip Strahan. 2001. “Obstacles to Optimal Policy: The Interplay of
Politics and Economics in Shaping Bank Supervision and Regulation Reforms.” In:
Frederick S. Mishkin, ed., Prudential Supervision: What Works and What Doesn't.
Chicago: University of Chicago Press, pp. 233-273.
Kroszner, Randall S., and Thomass Stratmann. 1998. “Interest Group Competition and the
Organization of Congress: Theory and Evidence from Financial Services’ Political
Action Committees.” American Economic Review 88, 1163-1187.
Krueger, Anne O. 1974. “The Political Economy of the Rent-Seeking Society.” American
Economic Review 64, 291-303.
La Porta, Rafael, Florencio Lopez-de-Silanes, Andrei Shleifer, and Robert Vishny. 1999. “The
Quality of Government.” Journal of Law, Economics and Organization 15, 222-279.
La Porta, Rafael, Florencio Lopez-de-Silanes, and Andrei Shleifer. 2002. “Government
Ownership of Banks.” Journal of Finance 57, 265-301.
Laeven, Luc. 2002. “Bank Risk and Deposit Insurance.” World Bank Economic Review 16, 109-
137.
Laeven, Luc. 2004. “The Political Economy of Deposit Insurance”. Journal of Financial
Services Research 26(3), 201-224.

27
Merton, Robert. 1977. “An Analytical Derivation of the Cost of Deposit Insurance and Loan
Guarantees.” Journal of Banking and Finance 1, 3-11.
North, Douglass C. 1990. “A Transactions Cost Theory of Politics.” Journal of Theoretical
Politics 2, 355-367.
Pagano, Marco, and Paolo Volpin. 2001. “The Political Economy of Finance.” Oxford Review of
Economic Policy 17, 502-519.
Pagano, Marco, and Paolo Volpin. 2004. “The Political Economy of Corporate Governance.”
American Economic Review, Forthcoming.
Peltzman, Sam. 1976. “Toward a More General Theory of Regulation.” Journal of Law and
Economics 19, 109-148.
Persson, Torsten, and Guido Tabellini. 2000. Political Economics - Explaining Economic Policy.
Cambridge: MIT Press.
Poole, Keith T., and Howard Rosenthal. 1997. Congress: A Political-Economic History of Roll
Call Voting. Oxford: Oxford University Press.
Ronn, Ehud I., and Avinash K. Verma. 1986. “Pricing Risk-Adjusted Deposit Insurance: An
Option-Based Model.” Journal of Finance 41, 871-895.
Stigler, George. J. 1971. “The Theory of Economic Regulation.” Bell Journal of Economics and
Management Science 2, 3-21.
Tornell, Aaron, Frank Westermann, and Lorenza Martinez. 2004. “The Positive Link Between
Financial Liberalization Growth and Crises.” NBER Working Paper 10293.
White, Eugene. 1981. “State-Sponsored Insurance of Bank Deposits in the United States 1907-
1929.” Journal of Economic History 41, 537-557.
White, Eugene. 1998. “The Legacy of Deposit Insurance: The Growth, Spread and Cost of
Insuring Financial Intermediaries.” In: Michael Bordo, Claudia Goldin, and Eugene
White, eds., The Defining Moment: The Great Depression and the American Economy in
the Twentieth Century. Chicago: Chicago University Press.
World Bank. 2004. “Deposit Insurance – Reforms Supported by the World Bank during the
Period 1993-2004.” Mimeo. Operations Evaluation Department, World Bank.

28
Figure 1: Explicit and Implicit Deposit Insurance Around the World (Data as of end-2003)

29
Table 1. Distribution of Countries with and without explicit deposit insurance by income quartile at yearend 2003 This table tallies countries with and without explicit deposit insurance at yearend 2003. The data come from the World Bank Deposit Insurance Database (2004), compiled from the International Association of Deposit Insurers (IADI) and national sources. The total number of countries included is 181. Blanket guarantees are coded as explicit deposit insurance.
Income group Number of countries Number of countries with
explicit deposit insurance Number of countries with merely implicit deposit
insurance High income 41 32 (78.05%) 9 (21.95%) Upper middle income 28 16 (57.14%) 12 (42.86%) Lower middle income 51 29 (56.86%) 22 (43.14%) Low income 61 10 (16.39%) 51 (83.61%) Total 181 87 (48.07%) 94 (51.93%)

30
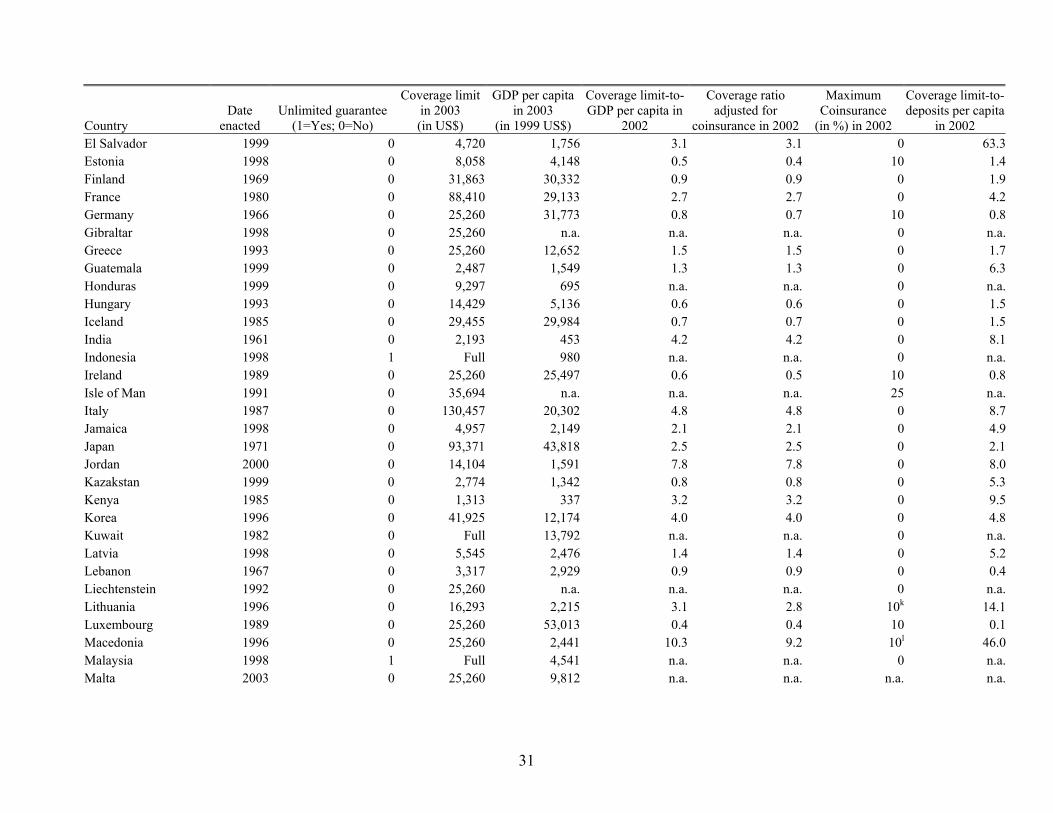
Table 2. Explicit deposit insurance systems at yearend 2003 This table lists the countries that adopted explicit deposit insurance systems by yearend 2003. The data come from an updated version of Demirguc-Kunt and Sobaci (2001) by Demirguc-Kunt and Laeven (2005). GDP and bank deposits per capita are from International Financial Statistics (IFS). The following “non-adopting” countries are included in our sample: Afghanistan, Angola, Armenia, Australia, Azerbaijan, Barbados, Belize, Benin, Bhutan, Boliviae, Botswana, Brunei, Burkina Faso, Burundi, Cambodia, Cameroong, Cape Verde, Central African Republicg, Chadg, China, Comoro Islands, Costa Rica, Cote d'Ivoire, Cuba, Djibouti, Egypt, Equatorial Guineag, Eritrea, Ethiopia, Fiji, Gabong, Gambia, Georgia, Ghana, Grenada, Guinea, Guinea-Bissau, Guyana, Haiti, Hong Kong (China), Iran, Iraq, Israel, Kiribati, Kyrgyz Republic, Laos, Lesotho, Liberia, Libya, Madagascar, Malawi, Maldives, Mali, Mauritania, Mauritius, Moldovad, Mongolia, Morocco, Mozambique, Myanmar, Namibia, Nepal, New Zealand, Niger, Pakistan, Panama, Papua New Guinea, Qatar, Republic of Congog, Rwanda, Saudi Arabia, Senegal, Seychelles, Sierra Leone, Singapore, Solomon Islands, Somalia, South Africa, St. Lucia, Sudan, Suriname, Swaziland, Syria, Tajikistan, Togo, Tunisia, United Arab Emirates, Uruguayf, Uzbekistan, Vanuatu, W. Samoa, Yemen, Zaire, Zambia. The total number of countries covered is 181.
Country Date
enacted Unlimited guarantee
(1=Yes; 0=No)
Coverage limit in 2003 (in US$)
GDP per capita in 2003
(in 1999 US$)
Coverage limit-to-GDP per capita in
2002
Coverage ratio adjusted for
coinsurance in 2002
Maximum Coinsurance
(in %) in 2002
Coverage limit-to-deposits per capita
in 2002 Albania 2002 0 6,568 914 3.3 3.0 15h n.a.Algeria 1997 0 8,263 1,592 4.2 4.2 0 n.a.Argentina 1979 0 10,327 8,076 3.6 3.6 0 16.0Austria 1979 0 25,260 32,049 0.8 0.7 10 0.9Bahamas 1999 0 50,000 13,485 n.a. n.a. 0 4.4Bahrain 1993 0 39,894 10,593 3.5 3.5 0 4.4Bangladesh 1984 0 1,021 358 5.0 5.0 0 14.6Belarus 1996 0 1,000 1,347 0.8 0.7 20i 5.8Belgium 1974 0 25,260 29,889 0.8 0.7 10 0.9Bosnia-Herzegovina 1998 0 3,228 1,551 1.8 1.8 0 n.a.Brazil 1995 0 6,925 4,486 2.6 2.6 0 8.9Bulgaria 1995 0 9,686 1,453 2.4 2.4 0 8.5Canada 1967 0 46,425 22,174 1.7 1.7 0 2.6Chile 1986 0 3,764 5,146 0.8 0.7 10i 2.1Colombia 1985 0 7,192 2,268 4.3 3.2 25 18.0Croatia 1997 0 16,343 4,943 2.5 2.5 0 4.1Cyprus 2000 0 25,260 13,467 2.5 2.2 10 2.0Czech Rep. 1994 0 31,575 5,207 3.6 3.2 10 5.3Denmarkc 1988 0 40,296 37,500 1.2 1.2 0 2.5Dominican Republic 1962 1 Full 1,946 n.a. n.a. 0 n.a.Ecuador 1999 1 Full 1,660 n.a. n.a. 0 n.a.
31
Country Date
enacted Unlimited guarantee
(1=Yes; 0=No)
Coverage limit in 2003 (in US$)
GDP per capita in 2003
(in 1999 US$)
Coverage limit-to-GDP per capita in
2002
Coverage ratio adjusted for
coinsurance in 2002
Maximum Coinsurance
(in %) in 2002
Coverage limit-to-deposits per capita
in 2002 El Salvador 1999 0 4,720 1,756 3.1 3.1 0 63.3Estonia 1998 0 8,058 4,148 0.5 0.4 10 1.4Finland 1969 0 31,863 30,332 0.9 0.9 0 1.9France 1980 0 88,410 29,133 2.7 2.7 0 4.2Germany 1966 0 25,260 31,773 0.8 0.7 10 0.8Gibraltar 1998 0 25,260 n.a. n.a. n.a. 0 n.a.Greece 1993 0 25,260 12,652 1.5 1.5 0 1.7Guatemala 1999 0 2,487 1,549 1.3 1.3 0 6.3Honduras 1999 0 9,297 695 n.a. n.a. 0 n.a.Hungary 1993 0 14,429 5,136 0.6 0.6 0 1.5Iceland 1985 0 29,455 29,984 0.7 0.7 0 1.5India 1961 0 2,193 453 4.2 4.2 0 8.1Indonesia 1998 1 Full 980 n.a. n.a. 0 n.a.Ireland 1989 0 25,260 25,497 0.6 0.5 10 0.8Isle of Man 1991 0 35,694 n.a. n.a. n.a. 25 n.a.Italy 1987 0 130,457 20,302 4.8 4.8 0 8.7Jamaica 1998 0 4,957 2,149 2.1 2.1 0 4.9Japan 1971 0 93,371 43,818 2.5 2.5 0 2.1Jordan 2000 0 14,104 1,591 7.8 7.8 0 8.0Kazakstan 1999 0 2,774 1,342 0.8 0.8 0 5.3Kenya 1985 0 1,313 337 3.2 3.2 0 9.5Korea 1996 0 41,925 12,174 4.0 4.0 0 4.8Kuwait 1982 0 Full 13,792 n.a. n.a. 0 n.a.Latvia 1998 0 5,545 2,476 1.4 1.4 0 5.2Lebanon 1967 0 3,317 2,929 0.9 0.9 0 0.4Liechtenstein 1992 0 25,260 n.a. n.a. n.a. 0 n.a.Lithuania 1996 0 16,293 2,215 3.1 2.8 10k 14.1Luxembourg 1989 0 25,260 53,013 0.4 0.4 10 0.1Macedonia 1996 0 25,260 2,441 10.3 9.2 10l 46.0Malaysia 1998 1 Full 4,541 n.a. n.a. 0 n.a.Malta 2003 0 25,260 9,812 n.a. n.a. n.a. n.a.

32
Country Date
enacted Unlimited guarantee
(1=Yes; 0=No)
Coverage limit in 2003 (in US$)
GDP per capita in 2003
(in 1999 US$)
Coverage limit-to-GDP per capita in
2002
Coverage ratio adjusted for
coinsurance in 2002
Maximum Coinsurance
(in %) in 2002
Coverage limit-to-deposits per capita
in 2002 Marshall Islands 1975 0 100,000 1,593 50.3 50.3 0 n.a.Mexico 1986 0 2,871,337 3,621 n.a.a n.a.a 0 n.a.a
Micronesia 1963 0 100,000 1,674 52.7 52.7 0 121.2Netherlands 1979 0 25,260 30,389 0.7 0.7 0 0.7Nicaragua 2001 0 20,000 n.a. 27.4 27.4 0 74.9Nigeria 1988 0 366 250 1.3 1.3 0 5.7Norway 1961b 0 299,401 37,369 6.0 6.0 0 11.3Oman 1995 0 52,016 5,766 6.5 4.9 25m 20.6Paraguay 2003 0 10,500 1,820 n.a. n.a. 0 n.a.Peru 1992 0 19,773 2,305 9.2 9.2 0 36.0Philippines 1963 0 1,800 1,133 2.0 2.0 0 3.8Poland 1995 0 28,418 3,536 3.6 3.5 10n 14.3Portugal 1992 0 31,575 12,499 1.9 1.9 0 2.1Romania 1996 0 3,842 1,451 1.6 1.6 0 13.9Russia 2003 0 6,098 2,255 n.a. n.a. n.a. n.a.Serbia and Montenegro 2001 0 87 n.a. 0.1 0.1 0 n.a.Slovak Republic 1996 0 25,260 4,180 2.8 2.8 10 4.8Slovenia 2001 0 26,931 11,160 1.6 1.6 0 3.0Spain 1977 0 25,260 16,824 1.2 1.2 10 1.4Sri Lanka 1987 0 1,034 863 1.2 1.2 0 3.5Sweden 1996 0 34,364 30,286 1.0 1.0 0 n.a.Switzerland 1984 0 24,254 45,680 0.5 0.5 0 0.4Taiwan 1985 0 29,420 15,023 2.3 2.3 0 n.a.Tanzania 1994 0 235 185 1.0 1.0 0 5.7Thailand 1997 1 Full 2,721 n.a. n.a. 0 n.a.Trinidad & Tobago 1986 0 7,937 4,951 1.1 1.1 0 2.7Turkey 1983 1 Full 2,887 n.a. n.a. 0 n.a.Uganda 1994 0 1,550 345 6.9 6.9 0 44.2Ukraine 1998 0 281 840 0.3 0.3 0 1.6United Kingdom 1982 0 19,611 21,616 2.0 1.8 10o n.a.United States 1934 0 100,000 30,956 2.8 2.8 0 8.7

33
Country Date
enacted Unlimited guarantee
(1=Yes; 0=No)
Coverage limit in 2003 (in US$)
GDP per capita in 2003
(in 1999 US$)
Coverage limit-to-GDP per capita in
2002
Coverage ratio adjusted for
coinsurance in 2002
Maximum Coinsurance
(in %) in 2002
Coverage limit-to-deposits per capita
in 2002 Venezuela 1985 0 6,258 3,260 2.3 2.3 0 16.5Vietnam 2000 0 1,948 351 4.5 4.5 0 n.a.Zimbabwe 2003 0 3,640 665 n.a. n.a. n.a. n.a.a In Mexico, a blanket guarantee was in place until end-2002. The guarantee has been gradually removed and the coverage limit is to be reduced from 10,000,000 Investment Units UDIs) in 2003 to 400,000 Investment Units (UDIs), or about US$ 110,000 at the current exchange rate, by the year 2005. b In Norway, a private guarantee fund for savings banks with voluntary membership had been in place since 1921, with membership becoming obligatory in 1924. A private guarantee fund for commercial banks was first introduced in 1938. Both guarantee funds were not pure deposit insurance schemes but had wide mandates to support member banks in liquidity or solvency crisis. c Banks in Greenland with Danish ownership are covered by the Danish deposit insurance scheme. d Moldova has adopted deposit insurance in 2004. e While Bolivia does not have a formal deposit insurance system, it has a Financial Restructuring Fund set up in December 2001 that acts as deposit insurance. f Uruguay has established a deposit insurance system in 2002 (Law on protection of bank deposits was enacted on December 27, 2002, creating a bank deposits collateral fund and a Superintendency of Bank Savings Protection), but it is not yet regulated. g A proposal for explicit deposit insurance was drafted in 1999 by these 6 Francophone African countries but the proposal has only been ratified by 2 out of the 6 Communauté Économique et Monétaire de l'Afrique Centrale (CEMAC) countries: Cameroon, Central African Republic, Chad, Equatorial Guinea, Gabon, and Republic of Congo. h Coinsurance of up to 15% (up to 350,000 Lek full insurance, and from 35,000 to 700,000 insurance at 85%). i The equivalent of USD 2000 (per person per bank) is fully covered by insurance. 80% coverage is provided for the next USD 3000 (that is from USD 2000 to USD 5000). Amounts exceeding the equivalent of USD 5000 per person per bank are not insured. j Full guarantee on time deposits; 90% coverage of savings deposits up to a limit of 120 Unidades de Fomento. (1 Unidad de Fomento = US$ 24). k Coverage of 100% up to LTL 10,000 and the balance at 90 percent. l Coverage of 100% up to 10,000 Euro; 90% next 10,000 Euro. m Coverage is RO 20,000 or 75% of net deposits, whichever is less. n Coverage is 100% of deposits up to 1000 Euro; and 90% from 1000 to 18000 Euro. o Coverage is 100% of the first ₤2000, and 90% of the next ₤33,000.

34
Table 3. Summary statistics This table presents summary statistics for the endogenous and explanatory variables used in the regressions. See Appendix Table 1 for a detailed explanation of variables and data sources.
Variable Mean Median Std. dev. Min Max No. obs
Endogenous Deposit Insurance (EI) 0.17 0.00 0.37 0.00 1.00 7783 Coverage ratio 6.24 2.45 13.73 0.05 117.86 919 Administration 0.55 1.00 0.50 0.00 1.00 1249 Membership 0.14 0.00 0.35 0.00 1.00 1249 Foreign currency deposits 0.75 1.00 0.43 0.00 1.00 1255 Interbank deposits 0.24 0.00 0.43 0.00 1.00 1255 Coinsurance 0.74 1.00 0.44 0.00 1.00 1220 Permanent fund 0.83 1.00 0.38 0.00 1.00 1256 Funding 0.01 0.00 0.12 0.00 1.00 1243 Moral-hazard composite 0.00 -0.04 1.00 -1.95 3.84 911 Explanatory Real Interest Rate -0.88 1.33 12.36 -98.83 44.62 3962 Inflation 47.96 6.51 532.72 -31.91 26762.02 5788 GDP Growth 3.64 3.89 5.82 -34.86 34.31 5811 Credit Growth 20.38 14.91 27.24 -99.84 249.04 4821 Terms-of-Trade Change 0.46 0.00 12.79 -64.35 139.60 4346 GDP per capita 5.48 1.56 8.62 0.05 56.51 5748 External pressure 0.12 0.00 0.32 0.00 1.00 7783 World Bank Loan 0.01 0.00 0.10 0.00 1.00 7783 EU Directive 0.03 0.00 0.18 0.00 1.00 7783 EU Candidacy 0.01 0.00 0.12 0.00 1.00 7783 Emulation 0.17 0.11 0.14 0.02 0.48 7783 Crisis Dummy 0.07 0.00 0.25 0.00 1.00 7783 Post-crisis adoption 0.10 0.00 0.30 0.00 1.00 7783 Fiscal cost / GDP 0.56 0.00 4.13 0.00 55.10 7501 Gov. Ownership 54.31 53.08 34.98 0.00 100.00 3128 Bank deposits / GDP 0.34 0.25 0.34 0.00 7.78 4149 Executive Constraints 3.88 3.00 2.34 1.00 7.00 5563 Polity Score -0.19 -3.00 7.64 -10.00 10.00 5563 Political Competition 4.88 3.00 3.77 1.00 10.00 5563 Bureaucracy 2.15 2.00 1.22 0.00 4.00 2464

35
Corruption 3.23 3.00 1.39 0.00 6.00 2464 Dem. Accountability 3.58 4.00 1.64 0.00 6.00 2464 Law & Order 3.65 4.00 1.56 0.00 6.00 2464

36
Table 4. Correlation matrix This table shows the bivariate correlation between the variables used in the regressions and the significance level of each correlation coefficient. * indicates significance at the 5% level.
Dep
osit
insu
ranc
e
Cov
erag
e ra
tio
Mor
al h
azar
d co
mpo
site
Rea
l Int
eres
t Rat
e
Infla
tion
GD
P G
row
th
Cre
dit G
row
th
Term
s of T
rade
Cha
nge
GD
P pe
r cap
ita
Exte
rnal
pre
ssur
e
Wor
ld B
ank
Loan
EU D
irect
ive
EU C
andi
dacy
Emul
atio
n
Cris
is D
umm
y
Post
-cris
is a
dopt
ion
Fisc
al c
ost /
GD
P
Gov
. Ow
ners
hip
Polit
y Sc
ore
Coverage ratio Moral hazard composite .65* Real Interest Rate .10* .01 -.05 Inflation -.03* -.04 -.01 -.43* GDP Growth -.02 .02 .06 -.02 -.14* Credit Growth -.04* -.05 .04 -.41* .45* .18* Terms of trade change .00 .02 .03 .00 -.01 .03 .00 GDP per capita .41* -.26* -.41* .09* -.08* -.11* -.26* -.04 External pressure .27* -.10* -.08* .08* -.05 -.04 -.08* .04 -.07* World Bank Loan .15* -.04 -.04 .04 -.01 .02 .03 -.01 -.17* .21*
EU Directive .34* -.15* -.37* .04 -.05 .00* -.09 -.01 .28* .23* .07*
EU Candidacy .16* -.08* -.15* .00 .03 .00 .10* .01 -.17* .19* .35* .39*
Emulation .37* -.11* -.12* .08* -.04 -.07* -.03 .03 -.05 .80* .23* .35* .23* Crisis Dummy .10* -.01 .09* -.04 .13* -.12* .02 -.02 -.14* -.04 -.04 -.13* -.02 .03 Post-crisis adoption .06* -.05 -.03 .00 -.01 -.01 .08* .01 -.29* .15* .23* .07* .22* .20* .25* Fiscal cost / GDP .12* -.03 .03 -.04 .07* -.15* .03 -.03 -.05 .09* -.05 -.10* -.05 .12* .78* .18* Gov. ownership -.24* .27* -.04 -.08* .11 .07 .25* .03 -.42* -.10* .03 -.13* .15* -.10* .05 .03 -.05 Polity score .41* -.22* -.24* .16* -.03 -.20* -.26* -.06 .46* -.02 .01 .26* .10* -.04 -.18* -.06 -.04 -.19* Exec. constraints .10* -.23* -.27* .14* -.03 -.19* -.26* -.06 .47* -.02 .00 .28* .14* -.04 -.17* -.02 -.04 -.22* .96*

37
Table 5. Alternative models of deposit-insurance adoption This table uses logit regressions to explain the adoption of explicit deposit insurance. The endogenous variable is the explicit deposit-insurance indicator. The regression in column 2 includes year dummies (not shown). Regression 3 is the same as 1 but includes the external pressure variable. Regression 4 is the same as regression 1 but adds the executive constraints variable. Regression 5 adds the executive constraints variable to regression 3. Regression 6 re-estimates model 5, restricting the sample to the post-1970 era. Regression 7 fits model 5 to the post-1980 era. Regression 8 fits model 5 and increases the sample size by excluding three macroeconomic explanatory variables. Regression 9 re-estimates model 8 but drops observations after deposit insurance is adopted in the country. Regression 10 presents the marginal effects and their standard errors of regression 8. An intercept is used but not shown. White standard errors are shown in brackets. The standard errors are adjusted for clustering at the country-level. *, **, *** indicate significance at the 10%, 5% and 1% level, respectively. 1 2 3 4 5 6 7 8 9 10
Marginal effects
Real interest rate 0.026** 0.008 0.019* 0.018* 0.012 0.010 0.004 (0.012) (0.008) (0.011) (0.011) (0.010) (0.009) (0.008) Inflation 0.014** 0.011* 0.014** 0.012* 0.012* 0.009 0.007 -0.000 -0.001 -0.000 (0.006) (0.006) (0.006) (0.007) (0.007) (0.007) (0.007) (0.000) (0.001) (0.000) GDP growth -0.023 -0.009 -0.021 -0.024 -0.021 -0.006 0.002 -0.004 -0.039* -0.000 (0.014) (0.016) (0.015) (0.018) (0.019) (0.019) (0.023) (0.013) (0.023) (0.002) Credit growth 0.001 0.002 0.003 0.002 0.004 0.003 0.003 (0.003) (0.003) (0.003) (0.003) (0.003) (0.003) (0.003) Terms of trade -0.001 -0.002 -0.002 0.001 -0.000 -0.001 0.002 (0.002) (0.003) (0.003) (0.003) (0.003) (0.003) (0.004) GDP per capita 0.098*** 0.125*** 0.110*** 0.069*** 0.084*** 0.086*** 0.102*** 0.078*** 0.045*** 0.010*** (0.020) (0.026) (0.022) (0.021) (0.025) (0.024) (0.025) (0.020) (0.015) (0.003) External pressure 1.476*** 1.557*** 1.422*** 1.244*** 1.579*** 0.813** 0.292*** (0.227) (0.245) (0.234) (0.215) (0.197) (0.339) (0.041) Executive constraints 0.263*** 0.255*** 0.268*** 0.260*** 0.325*** 0.240*** 0.042***
(0.081) (0.087) (0.089) (0.091) (0.070) (0.058) (0.010) Observations 3091 3091 3091 2831 2831 2517 1958 4685 3733 4685 Countries 136 136 136 123 123 123 122 147 144 147 % correct 78.62 78.58 78.55 77.71 79.90 79.02 77.57 84.27 78.23 84.27 Model χ2 32.61 238.87 60.12 45.15 66.71 64.00 71.54 112.13 41.33 112.13 Pseudo R2 0.15 0.24 0.19 0.18 0.22 0.23 0.24 0.25 0.07 0.25

38
Table 6. Robustness experiments investigating alternative external pressure variables This table compares alternative logit regressions seeking to explain the adoption of explicit deposit insurance. The endogenous variable is the explicit deposit insurance indicator. An intercept is used but not shown. White standard errors are shown in brackets. The standard errors are adjusted for clustering at the country-level. *, **, *** indicate significance at the 10%, 5% and 1% level, respectively. Panel A. Without time trend 1 2 3 4 5 6 7 8 Inflation -0.000 -0.000 -0.000 -0.001 -0.000 -0.000 -0.000 -0.000 (0.000) (0.001) (0.001) (0.001) (0.000) (0.000) (0.000) (0.000) GDP Growth -0.004 -0.007 -0.008 -0.008 -0.004 -0.005 -0.004 -0.005 (0.013) (0.012) (0.012) (0.012) (0.013) (0.013) (0.013) (0.013) GDP per capita 0.078*** 0.074*** 0.065*** 0.075*** 0.080*** 0.074*** 0.081*** 0.075*** (0.020) (0.018) (0.018) (0.018) (0.020) (0.020) (0.020) (0.020) External pressure 1.579*** 1.491*** 1.476*** 1.526*** 1.401*** (0.197) (0.193) (0.205) (0.196) (0.200) World Bank Loan 2.082*** 1.569*** 1.328** (0.486) (0.570) (0.593) EU Directive 2.221*** 1.961*** 1.862*** (0.467) (0.490) (0.488) EU Candidacy 1.645*** 1.353** (0.500) (0.545) Executive Constraints 0.325*** 0.325*** 0.294*** 0.306*** 0.319*** 0.291*** 0.303*** 0.288*** (0.070) (0.066) (0.066) (0.066) (0.070) (0.071) (0.071) (0.071) Observations 4685 4685 4685 4685 4685 4685 4685 4685 No. of countries 147 147 147 147 147 147 147 147 Model χ2 112.13 72.06 93.46 71.34 113.18 119.85 114.28 123.11 Pseudo R2 0.25 0.22 0.24 0.22 0.26 0.27 0.26 0.28

39
Panel B. With a linear time trend 1 2 3 4 5 6 7 8 Inflation -0.001 -0.000 -0.000 -0.000 -0.001 -0.001 -0.001 -0.000 (0.001) (0.000) (0.001) (0.001) (0.001) (0.001) (0.001) (0.001) GDP Growth 0.017 0.009 0.014 0.016 0.016 0.014 0.016 0.013 (0.013) (0.013) (0.013) (0.013) (0.013) (0.012) (0.013) (0.013) GDP per capita 0.086*** 0.088*** 0.088*** 0.087*** 0.088*** 0.083*** 0.088*** 0.084*** (0.023) (0.023) (0.023) (0.023) (0.023) (0.023) (0.023) (0.023) External pressure 0.325* 0.301 (0.197) (0.199) World Bank Loan 1.147** 0.994* (0.497) (0.524) EU Directive 1.232*** 1.169** (0.474) (0.474) EU Candidacy 0.749 (0.516) Executive Constraints 0.320*** 0.316*** 0.318*** 0.320*** 0.315*** 0.295*** 0.305*** 0.293*** (0.077) (0.077) (0.077) (0.078) (0.078) (0.078) (0.079) (0.079) Time trend 0.085*** 0.053* 0.078*** 0.083*** 0.078*** 0.083*** 0.070*** (0.016) (0.028) (0.017) (0.016) (0.015) (0.016) (0.016) Emulation 6.556*** 2.630 (0.975) (1.769) Observations 4685 4685 4685 4685 4685 4685 4685 4685 No. of countries 147 147 147 147 147 147 147 147 Model χ2 77.83 87.05 82.16 85.03 82.22 93.36 81.79 104.06 Pseudo R2 0.31 0.31 0.31 0.31 0.31 0.31 0.31 0.32

40
Table 7. Robustness experiments focused on the effects of crisis experience, government ownership of banks, and quality of institutions This table compares alternative logit regressions seeking to explain the adoption of explicit deposit insurance. The endogenous variable is explicit deposit insurance indicator. An intercept is used but not shown. White standard errors are shown in brackets. The standard errors are adjusted for clustering at the country-level. *, **, *** indicate significance at the 10%, 5% and 1% level, respectively.
1 2 3 4 5 6 7 8 9 Inflation -0.000 -0.000 -0.001 -0.000 -0.000 -0.000 -0.000 -0.000 -0.000 (0.000) (0.001) (0.001) (0.000) (0.000) (0.000) (0.000) (0.000) (0.000) GDP Growth 0.007 -0.002 -0.005 -0.044* -0.007 0.006 0.010 0.007 -0.021 (0.013) (0.013) (0.015) (0.026) (0.017) (0.018) (0.017) (0.017) (0.017) GDP per capita 0.084*** 0.087*** 0.078*** 0.049* 0.058*** 0.068*** 0.112*** 0.085*** 0.076*** (0.021) (0.022) (0.020) (0.027) (0.019) (0.025) (0.025) (0.023) (0.025) External pressure 1.640*** 1.604*** 1.565*** 0.266 1.753*** 1.078*** 0.853*** 1.040*** 1.582*** (0.214) (0.210) (0.216) (0.275) (0.227) (0.190) (0.232) (0.183) (0.220) Executive constraints 0.330*** 0.306*** 0.361*** 0.246** 0.283*** 0.260*** 0.336*** 0.287*** 0.259*** (0.071) (0.071) (0.073) (0.116) (0.080) (0.088) (0.090) (0.088) (0.083) Crisis dummy 1.234*** (0.279) Post-crisis adoption 0.867**
(0.387) Fiscal cost / GDP 0.043***
(0.017) Privatization 1.729***
(0.345) Gov. Ownership 0.003
(0.005) Bureaucracy 0.269 (0.191) Corruption -0.270* (0.143) Law & Order 0.043 (0.123) Bank deposits / GDP 0.334 (0.713) Observations 4685 4685 4439 1851 2513 2081 2081 2081 3527 Number of countries 147 147 147 47 85 125 125 125 132
Model χ2 116.39 104.73 105.87 56.49 83.49 67.26 85.56 72.68 85.28 Pseudo R2 0.27 0.26 0.28 0.24 0.21 0.24 0.25 0.24 0.23

41
Table 8. Robustness experiments investigating alternative political variables This table compares alternative logit regressions seeking to explain the adoption of explicit deposit insurance. The endogenous variable is the explicit deposit insurance indicator. An intercept is used but not shown. White standard errors are shown in brackets. The standard errors are adjusted for clustering at the country-level. *, **, *** indicate significance at the 10%, 5% and 1% level, respectively. 1 2 3 Inflation -0.000 -0.000 -0.000 (0.000) (0.000) (0.000) GDP Growth -0.005 -0.006 0.007 (0.013) (0.013) (0.016) GDP per capita 0.078*** 0.078*** 0.068*** (0.020) (0.019) (0.019) External pressure 1.530*** 1.482*** 1.069*** (0.203) (0.206) (0.177) Polity Score 0.103*** (0.021) Political Competition 0.201*** (0.039) Dem. Accountability 0.454*** (0.115) Observations 4685 4685 2275 No. of countries 147 147 133 Model χ2 118.28 118.97 84.17 Pseudo R2 0.26 0.25 0.23

42
Table 9. Robustness experiments focused on the influence of region and population size
This table compares alternative logit regressions seeking to explain the adoption of explicit deposit insurance. The endogenous variable is the explicit deposit-insurance indicator. Regressions in columns 1 to 2 exclude current European Union members. Regressions in columns 3 to 4 exclude countries with fewer than one-million inhabitants. Regressions in columns 5 and 6 include dummies by continent. An intercept is used but not shown. White standard errors are shown in brackets. The standard errors are adjusted for clustering at the country-level. *, **, *** indicate significance at the 10%, 5% and 1% level, respectively.
Excluding EU members Excluding countries with pop.< 1mil.
With dummies by continent
1 2 3 4 5 6 7 8 9 Inflation -0.000 -0.000 -0.000 -0.000 -0.000 -0.000 -0.001 -0.001 -0.001 (0.000) (0.000) (0.000) (0.001) (0.000) (0.000) (0.001) (0.001) (0.001) GDP Growth -0.006 -0.002 -0.000 -0.011 -0.008 -0.002 -0.015 -0.008 -0.008 (0.009) (0.009) (0.013) (0.010) (0.011) (0.013) (0.010) (0.011) (0.014) GDP per capita 0.083*** 0.087*** 0.065*** 0.103*** 0.110*** 0.074*** 0.057*** 0.062*** 0.059*** (0.021) (0.023) (0.024) (0.019) (0.021) (0.019) (0.016) (0.017) (0.020) External pressure 1.460*** 1.347*** 1.725*** 1.577*** 1.852*** 1.803*** (0.186) (0.213) (0.188) (0.203) (0.194) (0.228) Executive constraints 0.319*** 0.344*** 0.276*** (0.077) (0.071) (0.080) Observations 4757 4757 3958 4858 4858 4517 5609 5609 4541 Number of countries 145 145 124 143 143 140 170 170 143 Model χ2 16.50 74.61 83.78 32.49 95.62 107.66 114.41 170.91 168.30 Pseudo R2 0.08 0.12 0.19 0.15 0.20 0.26 0.22 0.27 0.32

43
Table 10. Hazard models of deposit-insurance adoption This table compares alternative hazard regressions seeking to explain the hazard rate of adopting explicit deposit insurance over the period 1934-2003. The model considers the adoption of deposit insurance as a “transforming event.” The endogenous variable is the number of years between 1934 and the adoption date. Columns 1, 5 and 7 use a proportional Cox (1972) hazard model. Columns 2 to 4, 6, and 8-11 estimate other parametric survival models. The assumed distributions of the hazard function in column 2 is exponential and in columns 3-4, 6, and 8-11 Weibull. The coefficients reported are the logarithms of the underlying relative-hazard coefficients. The number of adopting countries is the number of countries that have adopted deposit insurance during the observation period. An intercept is used but not shown. Lin and Wei (1989) standard errors are shown in brackets. The standard errors are adjusted for clustering at the country-level. *, **, *** indicate significance at the 10%, 5% and 1% level, respectively.
Cox Exponential Weibull Weibull Cox Weibull Cox Weibull Weibull Weibull Weibull Weibull 1 2 3 4 5 6 7 8 9 10 11 12
Inflation -0.001 -0.000 -0.001 0.002 -0.002 -0.002 -0.002 -0.002 -0.002 -0.002 -0.002 -0.002 (0.001) (0.000) (0.001) (0.008) (0.001) (0.001) (0.001) (0.002) (0.002) (0.002) (0.002) (0.002) GDP growth -0.007 -0.021 -0.001 -0.038 -0.031 -0.019 -0.019 -0.005 -0.005 -0.010 -0.012 -0.014 (0.020) (0.018) (0.020) (0.025) (0.026) (0.025) (0.025) (0.024) (0.024) (0.025) (0.024) (0.024) GDP per capita 0.072*** 0.068*** 0.069*** 0.075*** 0.051*** 0.048*** 0.062*** 0.058*** 0.058*** 0.062*** 0.059*** 0.059*** (0.011) (0.011) (0.011) (0.011) (0.013) (0.013) (0.012) (0.012) (0.012) (0.012) (0.012) (0.012) Real interest rate -0.010 (0.012) Credit growth 0.003 (0.006) Terms of trade 0.000 (0.006) Executive constraints 0.215*** 0.224*** 0.208*** 0.219*** 0.219*** 0.205*** 0.181*** 0.177*** (0.064) (0.064) (0.063) (0.064) (0.064) (0.064) (0.064) (0.064) Crisis dummy 1.265*** 1.246*** 1.247*** 1.129*** 1.158*** 1.128*** (0.304) (0.271) (0.284) (0.267) (0.279) (0.278) External pressure 0.007 (0.377) World Bank Loan 1.869*** (0.344) EU Directive 1.221*** (0.277) EU Candidacy 1.286*** (0.265) Observations 4567 4567 4567 2303 3730 3730 3730 3730 3730 3730 3730 3730 Number of countries 166 166 166 130 145 145 145 145 145 145 145 145 Number of adopting countries 74 74 74 57 68 68 68 68 68 68 68 68

44
Evolutionary parameter α (p-value)
4.48 (0.00)
4.26 (0.00)
4.49 (0.00)
4.26 (0.00)
4.00 (0.00)
4.05 (0.00)
4.02 (0.00)

45
Table 11. Predicted year of adoption for countries that have not adopted deposit insurance as of yearend 2002 Predicted year of adoption based on the Weibull duration model in column 9, Table 10, for countries with no deposit insurance in 2002. We also report estimates of the number of years until each country without an EDIS can be expected to adopt deposit insurance under year 2002 circumstances (the last year of our sample period). We could not estimate the expected adoption year for the following countries due to missing information for some of the model variables: Afghanistan, Barbados, Belize, Brunei, Cape Verde, Comoro Islands, Cuba, Democratic Republic of Congo, Grenada, Hong Kong, Iraq, Israel, Kiribati, Libya, Maldives, Malta, Myanmar, Qatar, Saudi Arabia, Seychelles, Solomon Islands, Somalia, St. Lucia, Suriname, United Arab Emirates, Vanuatu, and Western Samoa. Countries that have adopted deposit insurance since 2002 are marked with an asterisk. See notes for additional information about select countries.
Country Predicted adoption year Predicted years until adoption (from 2002) Australia 1981 -21 New Zealand 1985 -17 Singapore 1989 -13 China 1993 -9 Mauritius 1996 -6 Botswana 1996 -6 South Africa 1996 -6 Costa Rica 1996 -6 Paraguay* 1998 -4 Bolivia* 1999 -3 Papua New Guinea 1999 -3 Lesotho 1999 -3 Panama 1999 -3 Moldova* 1999 -3 Mongolia 2000 -2 Fiji 2000 -2 Senegal 2002 0 Ghana 2003 1 Namibia 2004 2 Russia* 2004 2 Guyana 2005 3 Madagascar 2006 4 Cote d'Ivoire 2006 4 Armenia 2006 4

46
Country Predicted adoption year Predicted years until adoption (from 2002) Guinea-Bissau 2006 4 Central African Rep. 2006 4 Georgia 2006 4 Benin 2006 4 Niger 2006 4 Zambia 2007 5 Sierra Leone 2007 5 Mali 2007 5 Iran 2009 7 Kyrgyz Republic 2010 8 Cambodia 2010 8 Malawi 2010 8 Tajikistan 2011 9 Mozambique 2011 9 Morocco 2013 11 Egypt 2013 11 Djibouti 2013 11 Syria 2013 11 Guinea 2014 12 Nepal 2014 12 Gabon 2014 12 Mauritania 2014 12 Haiti 2014 12 Ethiopia 2014 12 Laos 2014 12 Burkina Faso 2014 12 Burundi 2015 13 Tunisia 2016 14 Equatorial Guinea 2017 15 Swaziland 2017 15 Republic of Congo 2018 16 Cameroon 2018 16

47
Country Predicted adoption year Predicted years until adoption (from 2002) Togo 2018 16 Pakistan 2018 16 Gambia 2018 16 Angola 2018 16 Bhutan 2018 16 Azerbaijan 2019 17 Rwanda 2019 17 Yemen 2019 17 Eritrea 2019 17 Chad 2019 17 Liberia 2020 18 Zimbabwe* 2021 19 Sudan 2023 21 Uzbekistan 2024 22
Notes:
a. Albania and Uruguay have established deposit insurance systems in 2002.
b. Malta, Paraguay, Russia, and Zimbabwe have adopted deposit insurance in 2003.
c. Moldova has adopted deposit insurance in 2004.
d. While Bolivia does not have a formal deposit insurance system, it has a Financial Restructuring Fund set up in December 2001 that acts as deposit insurance.
e. A proposal for explicit deposit insurance was drafted in 1999 by these 6 Francophone African countries but the proposal has only been ratified by 2 out of the 6 Communauté Économique et Monétaire de l'Afrique Centrale (CEMAC) countries: Cameroon, Central African Republic, Chad, Equatorial Guinea, Gabon, and Republic of Congo.
f. To our knowledge, several countries have considered (or are considering) the adoption of deposit insurance: Australia, New Zealand, Singapore, China, South Africa, Namibia, and Pakistan.

48
Table 12. Heckman two-step selection model for deposit-insurance coverage and other design features This table reports a series of Heckman two-stage selection regressions for design features. The endogenous variable in the first-stage regression (selection equation) is the explicit deposit insurance indicator. The endogenous variable in the second-stage (design equation) is the logarithm of the indicated deposit-insurance coverage ratio. Coverage ratio is the ratio of coverage limit per person to GDP per capita. Coverage ratio adjusted for coinsurance is the ratio of the effective coverage per person (i.e., adjusting the coverage limit for the percentage of coinsurance) to GDP per capita, where effective coverage is calculated by adjusting the coverage limit by the amount of coinsurance. Coverage limit to deposits is the ratio of coverage limit per person to bank deposits per capita. Moral-hazard is an index based on the first principal component of the following design features: Coverage ratio, Administration, Membership, Foreign currency deposits, Interbank deposits, Coinsurance, Permanent fund, and Funding. All design features have been transformed to standardized variables (with mean zero and standard deviation of one) for the principal component calculations. Moral-hazard without coverage is an alternative moral-hazard index variable that focuses on design features excluding the coverage ratio. In Panel A, we report Heckman’s (1979) two-step efficient estimates. In panel B, we report Heckman’s (1979) two-step efficient estimates or maximum likelihood (ML) estimates. For the regressions in Panel B we exclude the GDP per capita variable in the design (second-stage) equation. Regressions 5-8 in Panel B include fixed year effects (not reported). Standard errors are shown in brackets and *, **, *** indicate significance at the 10%, 5% and 1% level, respectively. Panel A: Identical variables for selection (first-stage) and design (second-stage) equations
Coverage ratio Coverage ratio adjusted for coinsurance
Coverage limit to deposits Moral-hazard Moral-hazard without
coverage Second-stage: Design 1 2 3 4 5 Inflation -0.004*** -0.004*** -0.003*** -0.002*** -0.001** (0.001) (0.001) (0.001) (0.001) (0.000) GDP Growth -0.018* -0.016 -0.021* 0.006 0.006 (0.010) (0.010) (0.013) (0.010) (0.010) GDP per capita -0.000 0.002 -0.020 0.012 0.013 (0.011) (0.011) (0.015) (0.011) (0.010) External pressure 0.174 0.216 0.358 0.449** 0.465** (0.218) (0.223) (0.308) (0.217) (0.187) Executive constraints 0.061 0.071 0.059 0.089* 0.088* (0.054) (0.055) (0.075) (0.054) (0.051) Crisis dummy 0.605*** 0.676*** 0.564*** 0.631*** 0.702*** (0.155) (0.158) (0.207) (0.154) (0.153) Post-crisis adoption 0.207 0.190 0.452** 0.191 0.149 (0.154) (0.157) (0.212) (0.154) (0.134) Heckman Lambda 0.980*** 1.053*** 1.410*** 1.037*** 1.023*** (0.346) (0.353) (0.482) (0.349) (0.310)
First-stage: DI Inflation -0.001*** -0.001*** -0.001** -0.001** -0.000* (0.001) (0.001) (0.000) (0.001) (0.000) GDP Growth -0.001 -0.001 -0.004 -0.002 0.001 (0.006) (0.006) (0.006) (0.006) (0.005)

49
GDP per capita 0.050*** 0.050*** 0.048*** 0.051*** 0.054*** (0.003) (0.003) (0.003) (0.003) (0.003) External pressure 0.949*** 0.949*** 0.943*** 0.932*** 0.931*** (0.069) (0.069) (0.070) (0.070) (0.068) Executive constraints 0.178*** 0.178*** 0.181*** 0.177*** 0.183*** (0.013) (0.013) (0.013) (0.013) (0.013) Crisis dummy 0.488*** 0.488*** 0.472*** 0.476*** 0.618*** (0.087) (0.087) (0.089) (0.088) (0.080) Post-crisis adoption 0.510*** 0.510*** 0.515*** 0.507*** 0.441*** (0.073) (0.073) (0.074) (0.073) (0.072) Observations 4492 4492 4435 4484 4600 Censored observations 3665 3665 3665 3665 3665 Panel B: Exclude GDP per capita in design equation (second-stage) No year effects With year effects Heckman two-step estimator Heckman ML estimator Heckman two-step estimator Heckman ML estimator Coverage ratio Moral hazard Coverage ratio Moral hazard Coverage ratio Moral hazard Coverage ratio Moral hazard Second-stage: Design 1 2 3 4 5 6 7 8 Inflation -0.004*** -0.002*** -0.003*** -0.002** -0.004*** -0.002** -0.003*** -0.002** (0.001) (0.001) (0.001) (0.001) (0.001) (0.001) (0.001) (0.001) GDP Growth -0.018* 0.007 -0.015 0.008 -0.023** 0.004 -0.022** 0.003 (0.010) (0.010) (0.010) (0.010) (0.010) (0.010) (0.010) (0.010) External pressure 0.181* 0.243*** 0.007 0.177** -0.003 -0.300 -0.255 -0.362 (0.094) (0.083) (0.076) (0.076) (0.491) (0.509) (0.517) (0.515) Executive constraints 0.063** 0.038 -0.006 0.009 0.049* 0.011 -0.008 -0.005 (0.028) (0.027) (0.023) (0.023) (0.028) (0.026) (0.022) (0.024) Crisis dummy 0.609*** 0.524*** 0.524*** 0.497*** 0.607*** 0.540*** 0.536*** 0.528*** (0.113) (0.103) (0.106) (0.101) (0.111) (0.100) (0.105) (0.099) Post-crisis adoption 0.212** 0.050 0.177** 0.053 0.260*** 0.095 0.241*** 0.106 (0.088) (0.079) (0.083) (0.078) (0.086) (0.076) (0.081) (0.076) Heckman Lambda 0.994*** 0.669*** 0.681*** 0.541*** 0.951*** 0.573*** 0.691*** 0.503*** (0.103) (0.093) (0.062) (0.073) (0.102) (0.091) (0.061) (0.076)
First-stage: DI Inflation -0.001*** -0.001** -0.001** -0.001** -0.001*** -0.001** -0.001** -0.001** (0.001) (0.001) (0.000) (0.000) (0.001) (0.001) (0.000) (0.000) GDP Growth -0.001 -0.002 0.000 -0.001 -0.001 -0.002 0.000 -0.001

50
(0.006) (0.006) (0.006) (0.006) (0.006) (0.006) (0.006) (0.006) GDP per capita 0.050*** 0.051*** 0.052*** 0.053*** 0.050*** 0.051*** 0.052*** 0.052*** (0.003) (0.003) (0.003) (0.003) (0.003) (0.003) (0.003) (0.003) External pressure 0.949*** 0.932*** 0.960*** 0.925*** 0.949*** 0.932*** 0.962*** 0.926*** (0.069) (0.070) (0.069) (0.069) (0.069) (0.070) (0.069) (0.069) Executive constraints 0.178*** 0.177*** 0.170*** 0.172*** 0.178*** 0.177*** 0.171*** 0.174*** (0.013) (0.013) (0.013) (0.013) (0.013) (0.013) (0.013) (0.013) Crisis dummy 0.488*** 0.476*** 0.501*** 0.470*** 0.488*** 0.476*** 0.499*** 0.468*** (0.087) (0.088) (0.086) (0.087) (0.087) (0.088) (0.086) (0.087) Post-crisis adoption 0.510*** 0.507*** 0.526*** 0.488*** 0.510*** 0.507*** 0.519*** 0.484*** (0.073) (0.073) (0.072) (0.073) (0.073) (0.073) (0.072) (0.073) Observations 4492 4484 4492 4484 4492 4484 4492 4484 Censored observations 3665 3665 3665 3665 3665 3665 3665 3665 Joint significance of year effects (p-value)
0.00 0.00 0.00 0.00

51
Table 13. Predicted coverage ratios for countries that have not adopted deposit insurance as of yearend 2002 Predicted coverage ratio based on the Heckman two-step model in column 1, Panel A, Table 12, for countries with no deposit insurance in 2002. We could not estimate the expected coverage ratio for the following countries due to missing information for some of the model variables: Afghanistan, Barbados, Belize, Brunei, Cape Verde, Comoro Islands, Cuba, Democratic Republic of Congo, Grenada, Hong Kong, Iraq, Israel, Kiribati, Libya, Maldives, Malta, Myanmar, Qatar, Saudi Arabia, Seychelles, Solomon Islands, Somalia, St. Lucia, Suriname, United Arab Emirates, Vanuatu, and Western Samoa. Countries that have adopted deposit insurance since 2002 are marked with an asterisk. See notes for additional information about select countries. Country Predicted coverage ratio (2002) Angola 0.41 Zimbabwe* 0.57 Uzbekistan 0.57 Sudan 0.61 Chad 0.64 Liberia 0.64 Azerbaijan 0.65 Eritrea 0.66 Rwanda 0.67 Bhutan 0.67 Yemen 0.69 Tajikistan 0.69 Mozambique 0.70 Pakistan 0.71 Swaziland 0.72 Cameroon 0.73 Gabon 0.73 Iran 0.73 Laos 0.74 Republic of Congo 0.74 Togo 0.74 Armenia 0.74 Gambia 0.74 Burundi 0.74 Equatorial Guinea 0.75 Burkina Faso 0.75

52
Country Predicted coverage ratio (2002) Tunisia 0.75 Morocco 0.76 Guinea 0.77 Mauritania 0.77 Egypt 0.78 Mali 0.78 Syria 0.78 Ethiopia 0.78 Singapore 0.79 Djibouti 0.81 Cambodia 0.81 Haiti 0.82 Malawi 0.82 Russia* 0.82 Zambia 0.83 Sierra Leone 0.83 Nepal 0.84 Georgia 0.84 Benin 0.85 Ghana 0.85 Namibia 0.87 Central African Republic 0.87 Niger 0.88 Kyrgyz Republic 0.89 Moldova* 0.91 Fiji 0.92 Mongolia 0.92 Guyana 0.93 Cote d'Ivoire 0.94 Senegal 0.95 Mauritius 0.96 Lesotho 0.96 Costa Rica 0.97 South Africa 0.98

53
Country Predicted coverage ratio (2002) Australia 0.98 Botswana 0.98 Panama 0.98 New Zealand 0.99 Guinea-Bissau 0.99 Bolivia* 1.01 Papua New Guinea 1.06 Paraguay* 1.06 Madagascar 1.10 China 1.33
Notes:
a. Albania and Uruguay have established deposit insurance systems in 2002.
b. Malta, Paraguay, Russia, and Zimbabwe have adopted deposit insurance in 2003.
c. Moldova has adopted deposit insurance in 2004.
d. While Bolivia does not have a formal deposit insurance system, it has a Financial Restructuring Fund set up in December 2001 that acts as deposit insurance.
e. A proposal for explicit deposit insurance was drafted in 1999 by these 6 Francophone African countries but the proposal has only been ratified by 2 out of the 6 Communauté Économique et Monétaire de l'Afrique Centrale (CEMAC) countries: Cameroon, Central African Republic, Chad, Equatorial Guinea, Gabon, and Republic of Congo.

54
Appendix Table 1. Variable definitions and data sources Variable Definition Source Deposit Insurance Dummy that equals 1 if the country has explicit deposit insurance (including blanket
guarantees) and 0 if it has implicit deposit insurance. Demirguc-Kunt and Laeven (2005)
Coverage ratio Coverage limit of the EDIS in local currency divided by GDP per capita. Missing for countries with full coverage.
Demirguc-Kunt and Laeven (2005)
Coverage ratio adjusted for coinsurance
Coverage limit of the EDIS adjusted for coinsurance divided by GDP per capita. Missing for countries with full coverage.
Demirguc-Kunt and Laeven (2005)
Coinsurance Maximum coinsurance percentage of the EDIS. Zero for countries with full coverage. Demirguc-Kunt and Laeven (2005)
Coverage limit to deposits
Coverage limit of the EDIS in local currency divided by bank deposits per capita. Missing for countries with full coverage.
Demirguc-Kunt and Laeven (2005)
Moral hazard Principal component of the variables coverage ratio, administration, membership, foreign deposits, interbank deposits, coinsurance, permanent fund, and funding. All variables are standardized with mean of zero and standard deviation of one before conducting the principal component analysis.
Authors’ calculation
Moral hazard without coverage
Principal component of the variables administration, membership, foreign deposits, interbank deposits, coinsurance, permanent fund, and funding. All variables are standardized with mean of zero and standard deviation of one before conducting the principal component analysis.
Authors’ calculation
Administration Equals 0 if the administration of the EDIS is private or joint, 1 if it is public, and missing otherwise
Demirguc-Kunt and Laeven (2005)
Membership Equals 0 if membership to the EDIS is compulsory to all banks, 1 if it is voluntary, and missing otherwise.
Demirguc-Kunt and Laeven (2005)
Foreign currency deposits
Equals 0 if foreign deposits are not covered by the EDIS, 1 if they are covered, and missing otherwise.
Demirguc-Kunt and Laeven (2005)
Interbank deposits Equals 0 if interbank deposits are not covered by the EDIS, 1 if they are covered, and missing otherwise.
Demirguc-Kunt and Laeven (2005)
Coinsurance Equals 0 if EDIS has coinsurance, 1 if it has no coinsurance, and missing otherwise. Demirguc-Kunt and Laeven (2005)
Fund Equals 0 if EDIS but no permanent fund,1 if permanent fund, and missing otherwise. Demirguc-Kunt and Laeven (2005)
Funding Equals 0 if source of funding of the EDIS is private or joint, 1 if it is public, and missing otherwise.
Demirguc-Kunt and Laeven (2005)

55
Variable Definition Source Real Interest Rate Real interest rate (in %) equals nominal interest rate minus inflation rate. IFS (nominal interest rate is the treasury,
discount or deposit rate depending on availability – lines 60c, 60, or 60l) and WDI (inflation rate is the change in the consumer price index)
Inflation Inflation, GDP deflator (annual %). WDI
GDP Growth Real GDP growth rate (in %). WDI
Credit Growth Real private credit growth rate (divided by GDP deflator) (in %). IFS (private credit is line 32d) and WDI (GDP deflator)
Terms-of-Trade Change Percentage change in terms of trade. WDI
GDP per capita GDP per capita (constant 1995 thousands of US$). WDI
External pressure Dummy variable that takes a value of one for the years 1999 and onwards, the year 1999 being the year that the IMF endorsed deposit insurance by publishing a paper on best practices and guidelines in deposit insurance.
Garcia (2000)
World Bank Loan Dummy variable that takes the value of one during and following the year that the World Bank started an adjustment lending program with the country for reforms to establish deposit insurance (in addition to possibly other objectives), and zero otherwise. This variable takes a value of one for the following countries and periods (between brackets): Albania (2002 and onwards), Bolivia (1998 and onwards), Bosnia-Herzegovina (1996 and onwards), Croatia (1995 and onwards), El Salvador (1996 and onwards), Jordan (1995 and onwards), Lithuania (1996 and onwards), Nicaragua (2000 and onwards), Poland (1993 and onwards), Romania (1996 and onwards), Russia (1997 and onwards), Ukraine (1998 and onwards).
World Bank (2004)
EU Directive Dummy variable that takes a value of one for the years 1994 and onwards for EU member countries only (the EU-15), and zero otherwise. The year 1994 was the year when the EU Directive on Deposit Insurance came into force.
EU (1994)
EU Candidacy
Dummy variable that takes a value of one for the years 1994 and onwards for EU candidate countries only (i.e., Bulgaria, Cyprus, Czech Republic, Estonia, Hungary, Latvia, Lithuania, Malta, Poland, Romania, Slovak Republic, Slovenia), and zero otherwise. The year 1994 was the year when the EU Directive on Deposit Insurance came into force.
EU (1994)
Emulation Proportion of countries with explicit deposit insurance at a given year (in %). Authors’ calculation
Crisis Dummy Systemic banking crisis dummy equals 1 if the country experiences a systemic crisis in that year and 0 otherwise from 1976 to October 2003.
Caprio, Klingebiel, Laeven and Noguera (2005)

56
Variable Definition Source Post-crisis adoption Equals 1 if DIS was adopted between 0 and 3 years following a crisis, and 0 otherwise Caprio, Klingebiel, Laeven and Noguera (2005)
Fiscal cost / GDP Fiscal cost of banking crisis resolution (as % of GDP), values reported during the crisis period and 0 otherwise
Caprio, Klingebiel, Laeven and Noguera (2005)
Gov. Ownership Government ownership of banks in 1970 used for 1970 to 1994 and in 1995 onwards (in %). La Porta, Lopez-de-Silanes, and Shleifer (2002)
Privatization Bank privatization dummy equals 1 if first state-owned bank privatization took place. Boehmer, Nash, and Netter (2003)
Bank deposits / GDP Demand, time and saving deposits in deposit money banks as a share of GDP, calculated using the following deflation method: {(0.5)*[Dt/Pet + Dt-1/Pet-1]}/[GDPt/Pat], where D is demand and time and saving deposits, Pe is end-of period CPI, and Pa is average annual CPI, and t is year t.
Beck, Demirgüç-Kunt, and Levine (2003), Financial Structure Database. Raw data are from the electronic version of the IMF's International Financial Statistics (IFS lines 24 and 25). Data on GDP in local currency (lines 99) and annual CPI (line 64).
Polity Score Index combining democracy and autocracy scores. It ranges from –10 to 10, where negative scores are assigned to countries under autocracies and positive values to countries under democracies and –10 and 10 are the extreme cases of these two systems. Autocracies sharply restrict or suppress competitive political participation. Their chief executives are chosen in a regularized process of selection within the political elite, and once in office they exercise power with few institutional constraints. Democracy is conceived as three essential, interdependent elements. One is the presence of institutions and procedures through which citizens can express effective preferences about alternative policies and leaders. Second is the existence of institutionalized constraints on the exercise of power by the executive. Third is the guarantee of civil liberties to all citizens in their daily lives and in acts of political participation.
Polity IV, INSCR Program, CIDCM, University of Maryland, College Park
Executive Constraints Index measuring the extent of institutionalized constraints on the decision-making powers of chief executives. Such limitations may be imposed by any accountability group. The index ranges from 1 to 7, where 1 represents unlimited authority and 7 Executive parity or subordination.
Polity IV, INSCR Program, CIDCM, University of Maryland, College Park
Political Competition Index combining regulation of participation and competitiveness of participation scores. It ranges from 1 to 10, where higher scores represent more political competition. Participation is regulated to the extent that there are binding rules on when, whether, and how political preferences are expressed. One-party states and Western democracies both regulate participation but they do so in different ways, the former by channeling participation through a single party structure, with sharp limits on diversity of opinion; the latter by allowing relatively stable and enduring groups to compete nonviolently for political influence. The polar opposite is unregulated participation, in which there are no enduring national political organizations and
Polity IV, INSCR Program, CIDCM, University of Maryland, College Park

57
Variable Definition Source no effective regime controls on political activity. In such situations political competition is fluid and often characterized by recurring coercion among shifting coalitions of partisan groups. The competitiveness of participation refers to the extent to which alternative preferences for policy and leadership can be pursued in the political arena.
Bureaucracy Index measuring the institutional strength and quality of the bureaucracy. It ranges from 0 to 4. High points are given to countries where the bureaucracy has the strength and expertise to govern without drastic changes in policy or interruptions in government services. In these low-risk countries, the bureaucracy tends to be somewhat autonomous from political pressure and to have an established mechanism for recruitment and training. Countries that lack the cushioning effect of a strong bureaucracy receive low points because a change in government tends to be traumatic in terms of policy formulation and day-to-day administrative functions.
International Country Risk Guide (ICRG)
Corruption Index measuring the extent to which bribery is present within the political system. Forms of corruption considered are related to bribes in the areas of exchange controls, tax assessments, police protection, loans, and licensing of exports and imports. It ranges from 0 to 6, where low scores indicate high levels of corruption.
International Country Risk Guide (ICRG)
Dem. Accountability Index measuring how responsive government is to its people, on the basis that the less responsive it is, the more likely it is that the government will fall, peacefully in a democratic society, but possibly violently in a non-democratic one. It ranges from 0 to 6, where 0 is assigned to autarchies and 6 to alternating democracies.
International Country Risk Guide (ICRG)
Law & Order Index measuring a country’s legal system and rule of law. It ranges from 0 to 6, where a high score indicates high level of law and order. Law and order are assessed separately, with each sub-component comprising zero to three points. The law sub-component is an assessment of the strength and impartiality of the legal system while the order sub-component is an assessment of popular observance of law.
International Country Risk Guide (ICRG)