the construction of evidence in innovation...
TRANSCRIPT

The construction of evidence in innovation decisions
Caparica, 9th of December 2015
Nuno Filipe França Gouveia Boavida
PhD in Technology Assessment
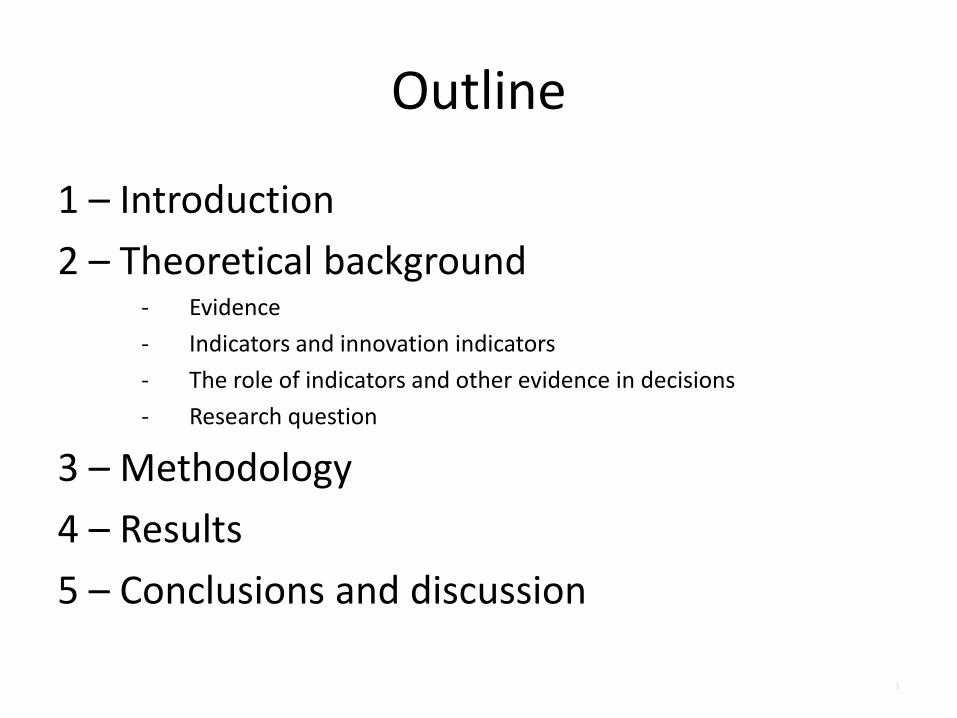
Outline
1 – Introduction
2 – Theoretical background‐ Evidence
‐ Indicators and innovation indicators
‐ The role of indicators and other evidence in decisions
‐ Research question
3 – Methodology
4 – Results
5 – Conclusions and discussion
1

1 ‐ Introduction• Objective: To understand the process of construction in decisions of
technology innovation
• Why?
– Evidence, and more specifically, indicators are important elements of innovation studies
– Evidence and indicators are central to technology assessment (TA) studies:
– A gap in literature about the process of construction of evidence in these decisions
2

2 – Theoretical background
• Significant body of literature about why and how scientifically based evidence should be used by decision makers
– Evidence: the body of facts or information that supports the strength of a proposition, and can assume various forms depending on the contexts where they are considered
– Examples of evidence: indicators, historical facts, statistics, results of experiments, texts, quotes from secondary sources, real experiences or histories, or opinions of individuals in one field
3
Evidence

2 – Theoretical background
• Increasing calls for decisions that use evidence based on the idea that the inclusion of evidence leads to the best‐informed decisions possible
• Evidence‐based policy‐making is a worthy aspiration that improves the quality of decision‐making (cf. C. Porter (2010) and others). This assumes that knowledge can be disseminated in the policy process through the introduction of scientific facts, concepts and theoretical perspectives (Weiss 1979)
• Evidence‐based policy is particularly attractive in countries with a political culture of transparency and rationality in the policy process, and with a research culture committed to rigorous methodologies using policy‐relevant evidence (Head 2010).
4
Evidence

2 – Theoretical background
• What counts as “evidence” in policy‐making can vary from “pure” scientific outputs to selected information used to create an argument
• This selection of “evidence” can depend on the controversies associated, can vary with the context of the policymaker, and is subject to a complex filtering process
• However, the use of evidence in policy‐making practice is poorly studied
“We know very little about where agencies seek information, and how they weight information from various sources in their decision process. And within that sphere, the prevalence of formal scientific evidence use in policy decision remains somewhat a
mystery” (Hall and Jennings 2010, 137)
5
Evidence
2 – Theoretical background
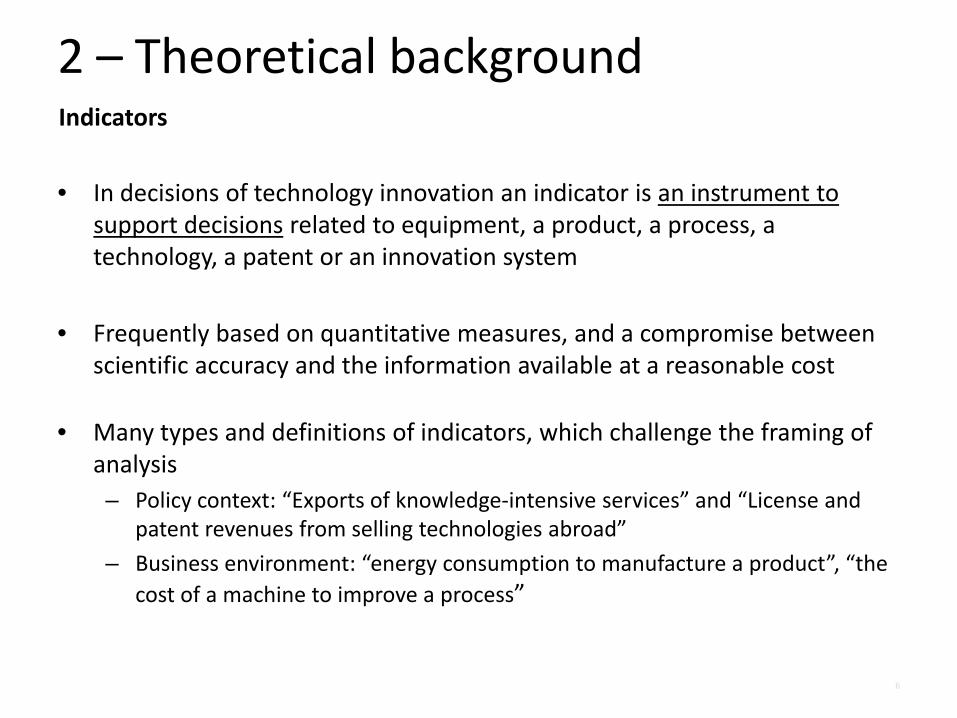
• In decisions of technology innovation an indicator is an instrument to support decisions related to equipment, a product, a process, a technology, a patent or an innovation system
• Frequently based on quantitative measures, and a compromise between scientific accuracy and the information available at a reasonable cost
• Many types and definitions of indicators, which challenge the framing of analysis– Policy context: “Exports of knowledge‐intensive services” and “License and
patent revenues from selling technologies abroad”
– Business environment: “energy consumption to manufacture a product”, “the cost of a machine to improve a process”
6
Indicators

2 – Theoretical background
• A significantly limited direct instrumental role and may be used but are not really influential. (from 2 case studies of of sustainable transport policy at national and EU‐level, by Gudmundsson and Sørensen 2012)
• Composite indicators were not systematically used directly, but had an indirect influence on policy‐making that needs to be better understood. The need to study the process of construction of evidence, rather than the technical quality of indicators and their independence from producers. (from 1 case study of sustainable policy at the EU institutions, by Sébastien and Bauler 2013)
7
The role of indicators in decisions of technology innovation

2 – Theoretical background
8
• (Q3) How are evidence and indicators used in decisions of technology innovation? – (H3) The type of decision helps to explain how indicators are used
– (H4) the phase of decision helps to explain how indicators are used
– (H5) the context helps to explain how indicators and other evidence are used
– (H6) the process of construction of evidence helps to explain how indicators and other evidence are used
The role of indicators and other evidence in these decisions

3 ‐MethodologyHow?
• Focused on 3 innovation groups:– Public researchers– Business R&D&I leaders– Policymakers
• Combination of methods to collect quantitative and qualitative information– Surveys– Case studies – Social network analyses
9

4 ‐ Results
10
(a) Context of the decision
• The Portuguese government supported sound policies towards renewable energies, and believed that they could technologically push for promotion of Portuguese development.
• A positive economic outlook of the country was balanced with an increasing dependence on costly oil imports.
• EMobi was a partnership between the government and Inteli, with other private companies. The qualifications of the members of the partnership were at Bachelors or, sometimes, a Masters level in engineering.
• By June 2011 EMobi implemented 1300 slow charging posts and 50 fast charging stations, through a public innovation fund (created as a counterpart for the granting of wind power licenses) and other initial investments and maintenance by EDP.
• The targets for installation of public chargers of EVs were ambitious with only 193 EVs sold in 2011, and only around 300 EVs used the EMobi service in 2012. The energy consumption in the EMobi system was equivalent to 11 vehicles in 2012 (only 4% of the fleet charged through infrastructure ).
(Q3) HOW ARE INDICATORS USED? – Case study EMobi

4 ‐ Results
11
(b) Social network
(Q3) HOW ARE INDICATORS USED? – Case study EMobi
4 ‐ Results
12
(c) Process of construction of evidence
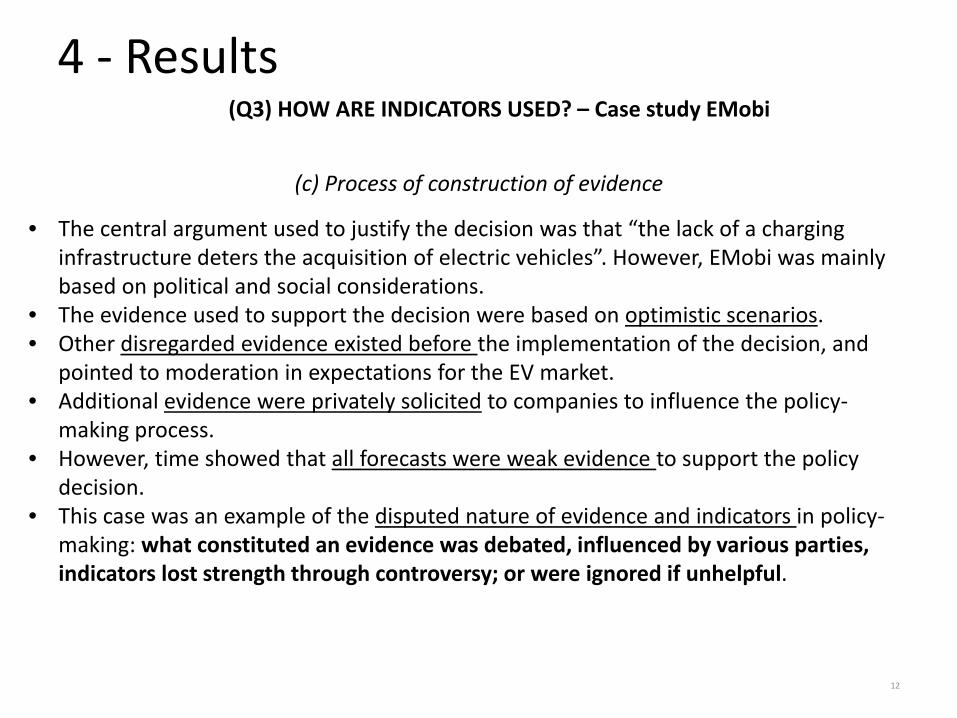
• The central argument used to justify the decision was that “the lack of a charging infrastructure deters the acquisition of electric vehicles”. However, EMobi was mainly based on political and social considerations.
• The evidence used to support the decision were based on optimistic scenarios. • Other disregarded evidence existed before the implementation of the decision, and
pointed to moderation in expectations for the EV market. • Additional evidence were privately solicited to companies to influence the policy‐
making process. • However, time showed that all forecasts were weak evidence to support the policy
decision. • This case was an example of the disputed nature of evidence and indicators in policy‐
making: what constituted an evidence was debated, influenced by various parties, indicators lost strength through controversy; or were ignored if unhelpful.
(Q3) HOW ARE INDICATORS USED? – Case study EMobi

4 ‐ Results
13
(a) Context of the decision
• Significant international investment in nanotechnology in the USA and Europe
• The idea to create a nanotechnology laboratory was initially defined in a policy briefing in a half a page briefing with political ideas and technical benefits
• Both the scientific area and the location of NanoLab were intentionally left open to allow negotiations between the two governments and discussions among government members
• The agreement reached in the Summit of 2005 agreeing on a bilateral technical committee, and an International Advisory Board to create the NanoLab
• An important co‐finance of the European Union (30M€) in a total cost of 100M€
• All members were scientists in possession of a PhD
(Q3) HOW ARE INDICATORS USED? – Case study NanoLab

4 ‐ Results
14
(b) Social network
(Q3) HOW ARE INDICATORS USED? – Case study NanoLab

4 ‐ Results
15
(c) Process of construction of evidence
Some evidence was collected during the decision process of NanoLab:• Evidence about the international context of investments in nanotechnology,
particularly in the USA but also at the EU level• Spain conducted a significantly detailed study to determine the activities and
necessities in the field, and to map and improve technical skills and infrastructures in the period 2005‐2010 (Correia, Hernández, and Domingo 2004). In fact, the study extensively included quantified indicators at regional, national and European levels. These indicators included cost of research projects, equipment and skills; number of researchers and technicians and skills; lists of equipment and projects existent in each laboratory; skills required to operate equipment that already existed, ordered and might be ordered in future; etc. Spain also produced other public reports framing the investments in nanotechnology within the S&T system. At the time, investments were planned for six Spanish laboratories (I26). To the central government, NanoLab was part of a larger set of investments requiring negotiation with the Spanish regions, their research communities, and with Portugal. The negotiations required evidence that could be introduced in the assessment of the situation and the distribution of the investments.
(Q3) HOW ARE INDICATORS USED? – Case study NanoLab

4 ‐ Results
16
(c) Process of construction of evidence
• Portugal did not produce extensive studies on nanotechnology, despite investments in two new associate laboratories (I25). In fact, only the technical committee preparing NanoLab collected elements to map existing research activities in the country (INL Technical Committee 2006). An interviewee argued that the need to justify the distribution of investments was lower than in Spain, and mostly directed at the Portuguese nanotechnology community (I24).
• No study found in either country demonstrating an explicit need to invest in nanotechnology and nanoscience as opposed to other S&T areas. In fact, the only justifications found were based on the idea that the USA and other developed countries were investing in this research area (I25 and I26).166 However, this argument is also true for other research areas. Another argument was the need to create the first international research centre in these countries. The argument was based on the scientific, technological and economic benefits to those countries of having an international R&D centres in a emerging field. Therefore, although both countries introduced evidence in the decision process, the collection of evidence was different in the two Iberian countries: In Spain there were detailed preparatory studies with quantified indicators and other evidence, and in Portugal there was an d h i f th ti iti f th i ti h
(Q3) HOW ARE INDICATORS USED? – Case study NanoLab

4 ‐ Results
17
Comparative analysis of the social networks
(Q3) HOW ARE INDICATORS USED? – Two case studies

4 ‐ Results
18
Comparative analysis of the social networks
Results suggest the existence of two different networks formed by a project (a decision) with diverse roles amongst the main actors. First, the EMobi case revealed a close interaction between companies and policymakers in a cohesive small network. The network shape was normally centralized in its middle and significantly centred in the Advisor to the Prime Minister and Consultancy company 1. The network was also closed shortly around its centre, and significantly dependent on the Advisor to the Prime Minister, and actors distant from the core had difficulties accessing information about decisions. Second, the NanoLab case revealed a small cohesive network of policymakers and scientists, centralized in two actors (i.e. Director, Sub‐Director) and exhibiting a flow of information distributed among three main actors (i.e. Director and Sub‐Director and Top advisor 2). To conclude, it can be argued that the social network analyses expanded the comprehension of the organizational context of these two decisions. They improved the description gathered through interviews and allowed a comparison between the two networks by depicting a spatial visualization of the actors and their relationships and by providing measures to compare the structure, cohesion and shape of the networks to understand the role of indicators.
(Q3) HOW ARE INDICATORS USED? – Two case studies

5 – Conclusions and discussionFour main explanatory factors for the role of indicators in these decisions:• Type of decision: In fact, each type of decision had different influences on
the way indicators are used, and each type of decision used different types of indicators. Results for policy‐making were particularly different from decisions of acquisition and development of products/technology.
• Phase of the decision: Results distinguished between two phases detected in all decisions – before and after the decision – as well as two other phases that can be used to complement the decision process and where indicators can be involved.
• Context of decision: the role of indicators can be influenced by the particular context of the decision maker, in which all types of evidence can be selected or downplayed. More importantly, the use of persuasive analytical evidence appears to be related with the dispute and controversies existent in the policy context.
• Process of construction of evidence: indicators and other evidence were brought to the decision processes according to their availability and capacity to support the different arguments and interests of the actors and stakeholders. In one case, an indicator lost much persuasion strength with the controversies that it went through during the decision process.
19

5 – Conclusions and discussion
• The minor instrumental role of indicators suggests that indicators are mostly a complementary instrument of decision.
• Limitations: in policy processes (and eventually in business) some differences can be expected in other countries, where cultures and other social and contextual settings might affect the process of decisions. – For example, the use of indicators in policy‐making was differentiated in the NanoLab case, precisely due to different national contexts (Germany/Rhine valley, the USA/Silicon Valley/Boston area and Japan)
20

5 – Conclusions and discussion
“Like models, whose prestige as a knowledge form rose rapidly from the early XX century, indicators offer truth or validity in an
abstracted or even fictionalized form, always presuming a sufficient degree of resemblance to a partly‐accessible reality”
(Porter (2015, 35)
21

Thank you
22

2 – Theoretical background
• The most frequent problem of indicators was their non‐use in policy‐making due to lack of interest; communication or information overload; or even opposition to what is being measured (MacRae 1985)
• In policy case studies, most indicators were often ignored or that their use was limited in policy decisions (MacRae 1985; Lehtonen 2013; Sébastien and Bauler 2013)
• Overall, policy indicators remain largely enigmatic regarding patterns of embeddedness in institutional decision‐making processes (Sébastien and Bauler 2013)
23
The role of indicators in decisions

2 – Theoretical background
• The extent of influence of indicators in decisions is largely unknown
• Most literature aims to develop indicators, analyse them or evaluate them
• Only a few studies on policy decisions, sectorial and based on case studies:
– MacRae (1985) Policy indicators: Links between social science and public debate
– Project POINT ‐ Policy Influence of Indicators (2008 to 2011)
– (Other aspects by Porter 1995, Pastille project, UN‐NYU, etc)
24
The role of indicators in decisions
4 ‐ Results
25
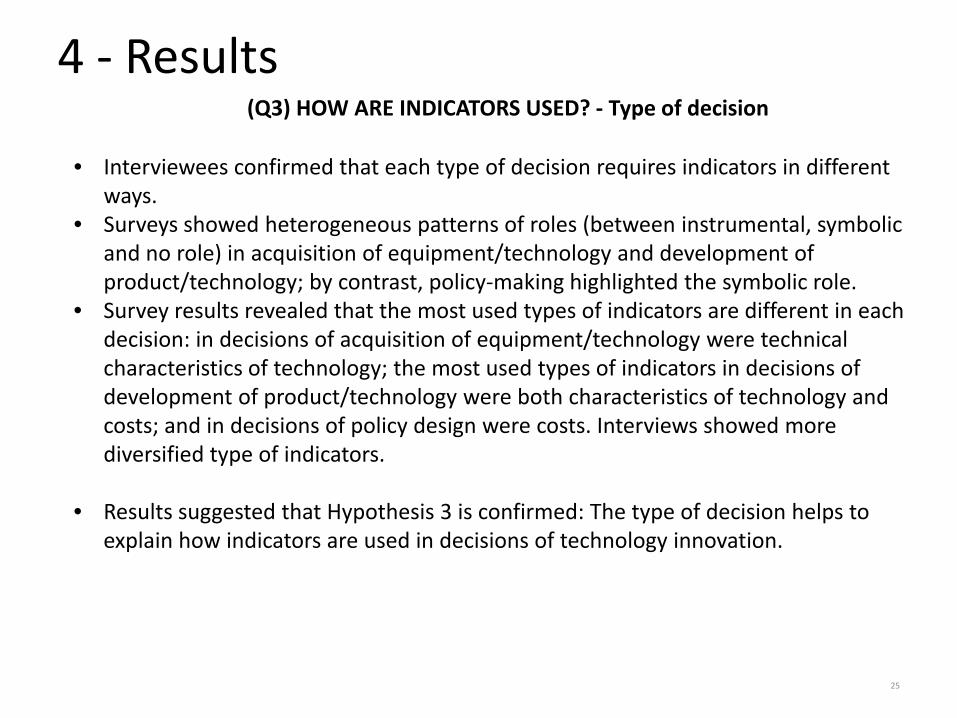
(Q3) HOW ARE INDICATORS USED? ‐ Type of decision
• Interviewees confirmed that each type of decision requires indicators in different ways.
• Surveys showed heterogeneous patterns of roles (between instrumental, symbolic and no role) in acquisition of equipment/technology and development of product/technology; by contrast, policy‐making highlighted the symbolic role.
• Survey results revealed that the most used types of indicators are different in each decision: in decisions of acquisition of equipment/technology were technical characteristics of technology; the most used types of indicators in decisions of development of product/technology were both characteristics of technology and costs; and in decisions of policy design were costs. Interviews showed more diversified type of indicators.
• Results suggested that Hypothesis 3 is confirmed: The type of decision helps to explain how indicators are used in decisions of technology innovation.
4 ‐ Results
26
(Q3) HOW ARE INDICATORS USED? ‐ Phase of decision
• Interviews confirmed two important moments ‐ before and after the decision – with a preliminary evaluation of the potential benefits of the decision in terms of knowledge, competitiveness or political assessments.
• These processes can include political‐behavioural methods before and/or after the final decision, such as discussion, negotiation, networking, consensus‐building and/or other social activities.
• The decision processes can also involve rational‐analytical activities before and/or after the final decision, such as collection of indicators, other evidence and/or other analyses.
• Furthermore, the use of indicators before making a decision was intensive in all types of decision, although less expressive in policy design. After the decision, there was one homogenous pattern in acquisitions of equipment/technology and two heterogeneous patterns among policy design and development of product/technology.
• Results confirm Hypothesis 4: the phase of decision helps to explain how indicators are used in decisions of technology innovation.

2 – Theoretical backgroundThe role of indicators• Why in innovation contexts?
– This gap in the innovation literature can be problematic for four main reasons. First, the role of indicators in innovation is important to understand how decisions are made and actors behave. In fact, literature should identify the ways indicators are included in the decision and, at the same time, capture the behaviour of different decision makers when using them. More knowledge of about the use of indicators is also important in innovation policies because they are intended to act upon the innovation system, changing the environment where private and public researchers develop their innovations. Additionally, innovation policies have obvious implications for socio‐economic growth and development through action upon the socio‐economic system, where innovations can interact and promote economic growth. Moreover, existing knowledge about the influence of indicators in sustainable policy is not enough to allow generalizations in other areas of innovation and actors of the innovation system. Therefore, there is the need for more research to enable a discerned use of indicators and to improve actions upon the innovation system.
27

2 – Theoretical backgroundThe role of indicators• Why in TA contexts• This gap in the literature is also problematic to technology assessment studies for several reasons. First,
technology assessment frequently relies on indicators to address relevant societal questions about technology (Barré 2001). For example, in a technology assessment study about the potential and impacts of cloud computing services, Leimbach et al. (2014) used indicators about the type of use and the type of cloud services in order to understand and explain the adoption and usage patterns of companies and consumers. Second, indicators are not neutral instruments to analyse technology problems, because they are selected by criteria that express values and interests of those who propose a specific description of a problem. For example, it is significantly different to observe an indicator of a CO2 footprint of a product than to analyse the whole chain of different risk factors associated with the use of a technology. Third, the description of complex problems and the strategies for their solution are heavily influenced by the use of indicators. For example, the use of an indicator of “security of livelihood” in a sustainability problem introduces a specific description of a selected problem, which is in this way placed as a key problem against which strategies for its solution are to be defined Fourth, technology assessment needs a transparent and thoughtful relation with indicators because it can not only lead to new alternative technology options, but also create space for controversies between stakeholders that use a limited set of indicators. For example, the debate about risks of nuclear power plants shifted in the moment the indicator of climate neutrality came in, because nuclear fission previously seemed to be an environmentally friendly technology. Fifth, the applicability of indicators used and proven in established fields needs reflection while transferring them to a new or emergent technology, as conditions can change significantly and there might be changes in methodology or new empirical test settings relevant for uncover possible harm or damage. Sixth and last, the study of how indicators are involved in policy‐making can help technology assessment practitioners to understand the policy process. This can also help to differentiate from the scientific and business processes, to develop public participation practices and to improve scientific communication of findings. These insights about the policy process can also help to identify stakeholders that influence the decisions, as well as to determine their role in the decision process. In essence, the knowledge gap is problematic to technology assessment because studies frequently rely on indicators, the selection of indicators is not neutral, they can open alternatives and controversies, and their study can improve knowledge about policy processes.
28