the carbon cycle: global to local ruth varner, phd
Post on 20-Dec-2015
219 views
TRANSCRIPT
The Carbon Cycle: Global to local
Ruth Varner, PhD

Atmospheric CO2 at Mauna Loa
Keeling, C.D. and T.P. Whorf. 2004. Atmospheric CO2 records from sites in the SIO air sampling network. In Trends: A Compendium of Data on Global Change. Carbon Dioxide Information Analysis Center, Oak Ridge National Laboratory, U.S. Department of Energy, Oak Ridge, Tenn., U.S.A.
An Impeccable Record of our AtmosphereAn Impeccable Record of our Atmosphere

The Earth System
• The Earth is a system made up of components.
• There are feedbacks between these components.
• These relationships can be used to predict past and future changes in the environment.
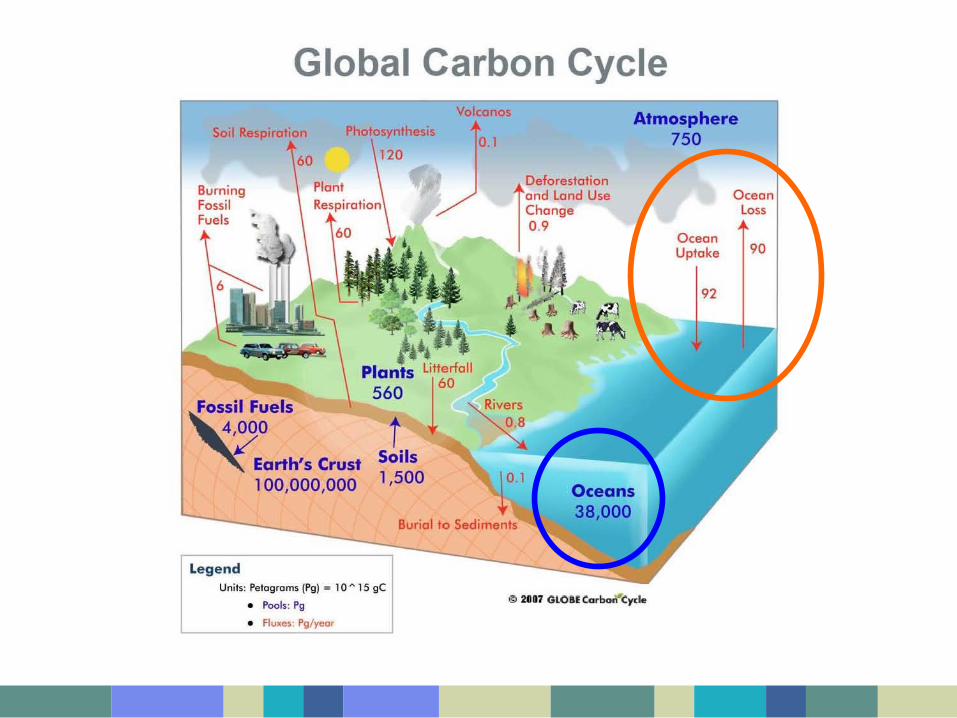
• The Carbon cycle is an important Earth System.

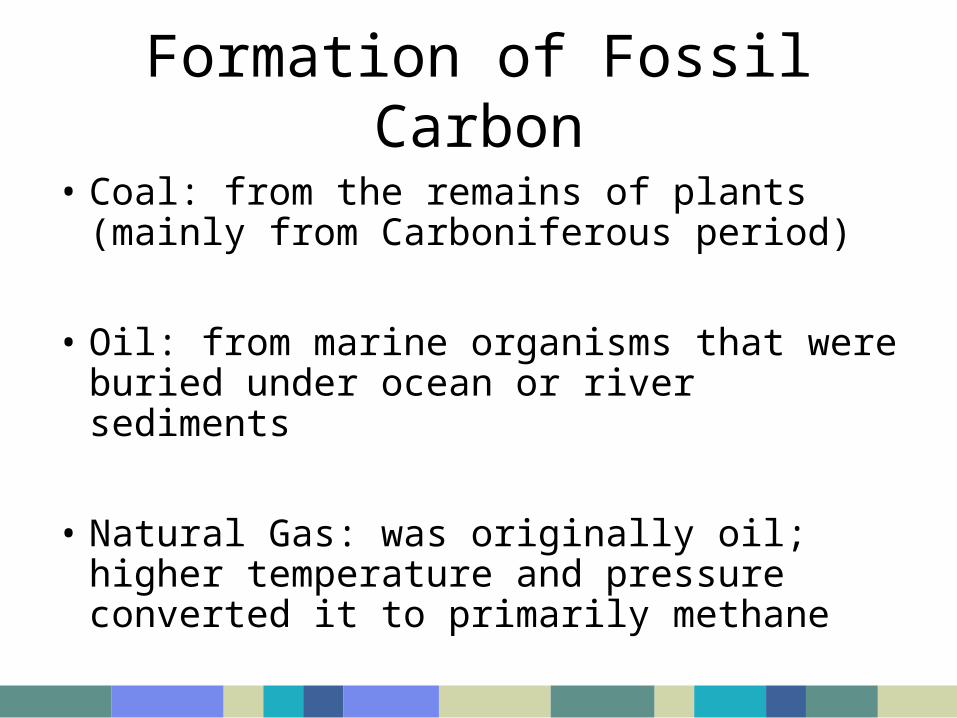
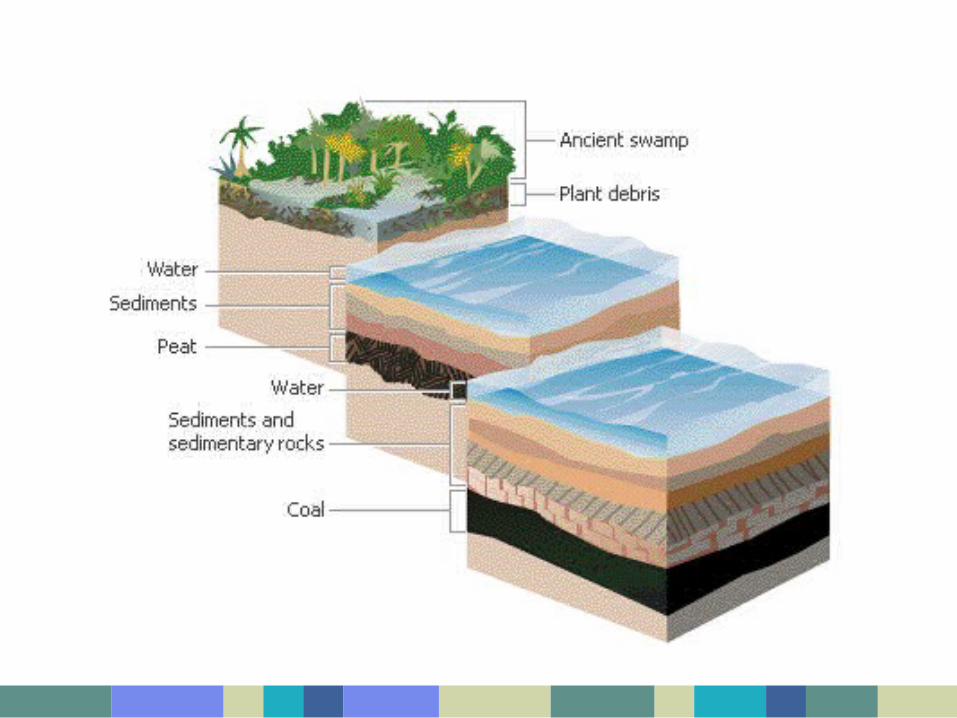
Formation of Fossil Carbon
• Coal: from the remains of plants (mainly from Carboniferous period)
• Oil: from marine organisms that were buried under ocean or river sediments
• Natural Gas: was originally oil; higher temperature and pressure converted it to primarily methane

Combustion
Burning hydrocarbons produces CO2 and CO:
CxHx + O2 CO2 + H2O(if enough O2) Complete combustion
Hydrocarbon + oxygen = carbon dioxide and water
CxHx + O2 CO2 + CO + H2O(if not enough O2) incomplete combustion
Hydrocarbon + oxygen = carbon dioxide and carbon monoxide and water
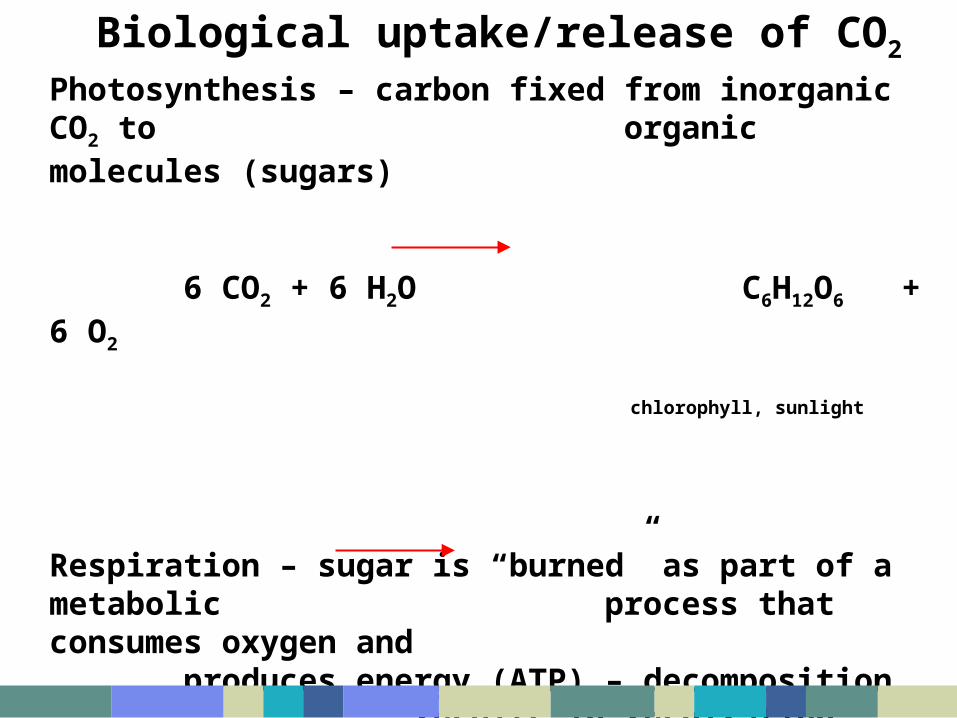
Photosynthesis – carbon fixed from inorganic CO2 to organic molecules (sugars)
6 CO2 + 6 H2O C6H12O6 + 6 O2
chlorophyll, sunlight
Respiration – sugar is “burned” as part of a metabolic process that consumes oxygen and produces energy (ATP) – decomposition results in respiration
C6H12O6 + 6 O2 6 CO2 + 6 H2O + energy
Biological uptake/release of CO2

From the Atmosphere: Inorganic C in the Ocean
CO2 (atm) ↔ CO2 (aq) ↔ HCO3- + H+ ↔ CO32- + H+ ↔ CaCO3 ↔ seds
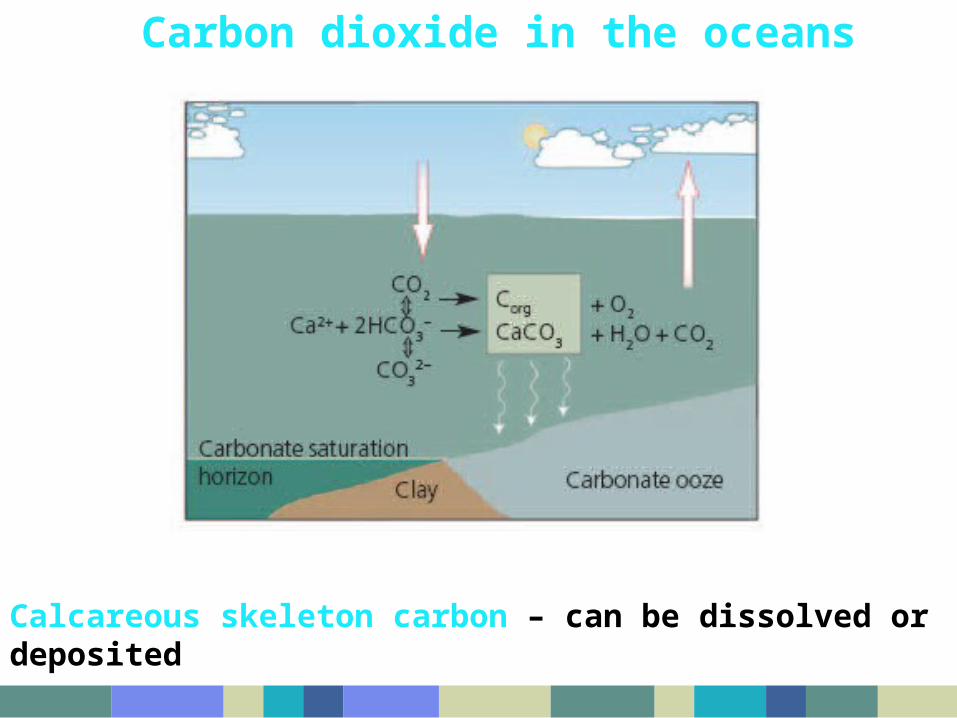
Carbon dioxide in the oceans
Calcareous skeleton carbon – can be dissolved or deposited

Figure 7.10

UNH/NOAA-PMEL CO2 Buoy in Gulf of Maine
In sea water
In overlying atmosphere


Terrestrial Carbon
• Soil carbon is released through respiration : root and microbial (decomposition)
• Plants respire CO2
• Plants also fix carbon through photosynthesis

Terrestrial Carbon
Biological uptake/release of CO2
Photosynthesis – carbon fixed from inorganic CO2 to organic molecules (sugars)
6 CO2 + 6 H2O C6H12O6 + 6 O2
chlorophyll, sunlight
Respiration – sugar is “burned” as part of a metabolic process that consumes oxygen and produces energy– decomposition
results in respiration
C6H12O6 + 6 O2 6 CO2 + 6 H2O + energy
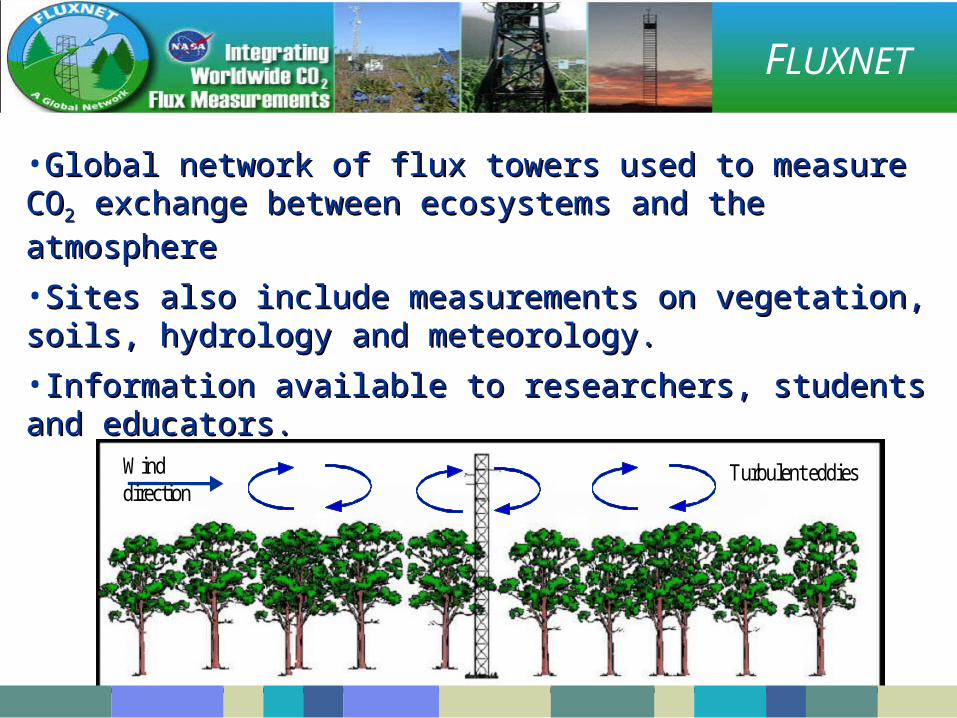
•Global network of flux towers used to measure COGlobal network of flux towers used to measure CO22 exchange between exchange between ecosystems and the atmosphereecosystems and the atmosphere•Sites also include measurements on vegetation, soils, hydrology and Sites also include measurements on vegetation, soils, hydrology and meteorology. meteorology. •Information available to researchers, students and educators.Information available to researchers, students and educators.
FLUXNET
Wind direction
Turbulent eddiesWind direction
Turbulent eddies

http://www.fluxnet.ornl.gov/fluxnet/index.cfm

Total ecosystem respiration =Rsoil + Rleaf + Rstem + Rcwd
Rsoil
Rstem
Rleaf
Rcwd

Rsoil = Rroot + Rdecomp
Soil CO2 efflux is a measurement of the Rsoil that reaches the atmosphere
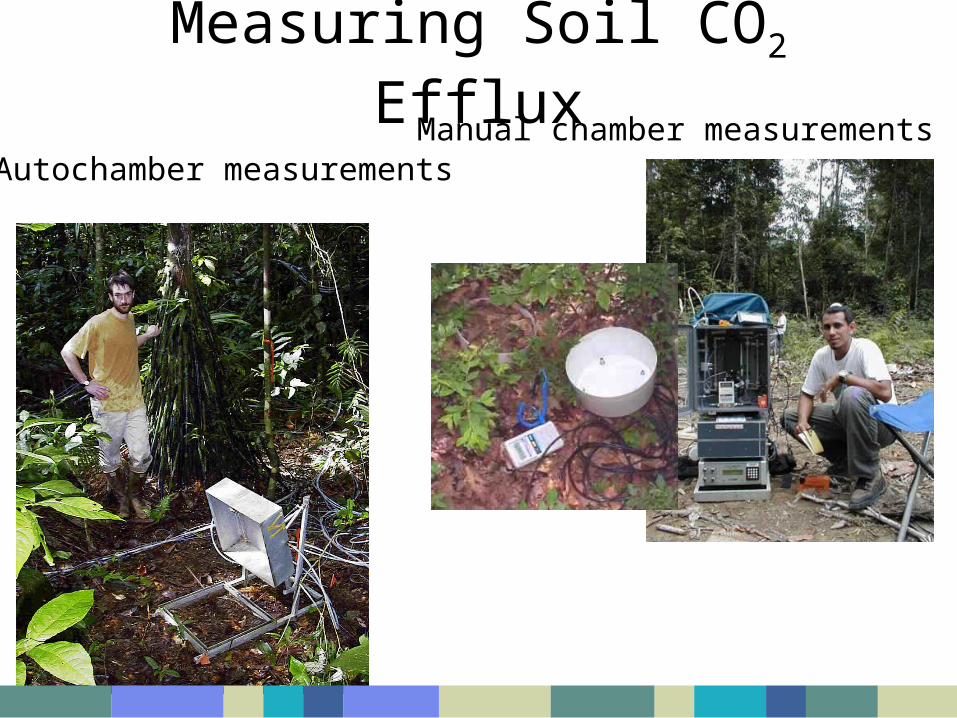
Measuring Soil CO2 EffluxManual chamber measurements
Autochamber measurements
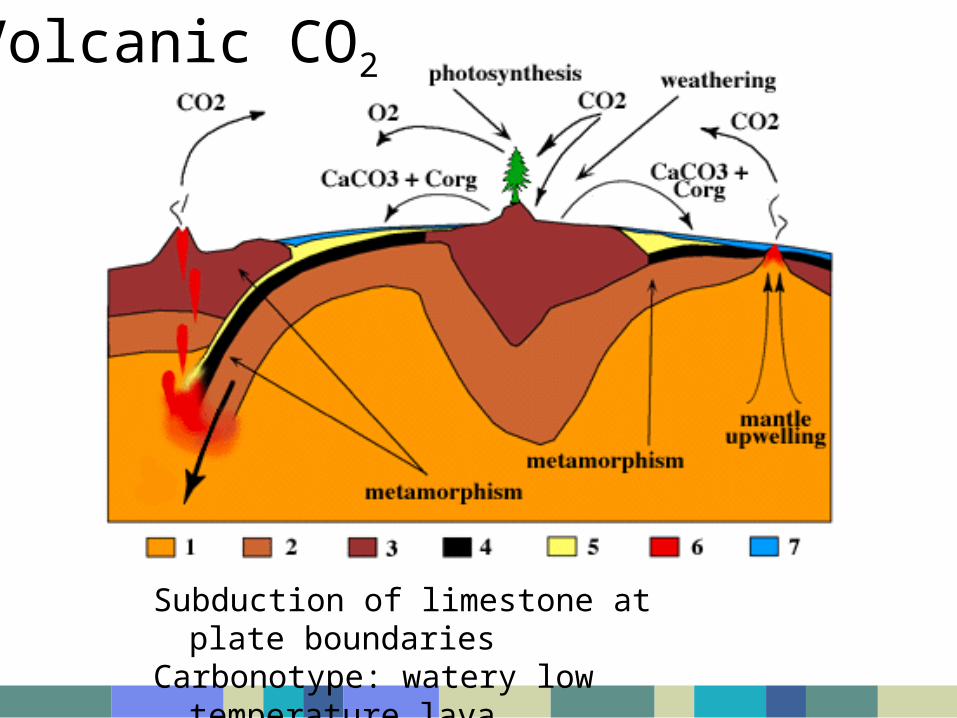
Volcanic CO2
Subduction of limestone at plate boundariesCarbonotype: watery low temperature lava

Oceans +2 Pg yr-1
Atmosphere +2 Pg yr-1

FACE Duke Forest, Chapel Hill, NC
Carbon Fertilization ?

FACE site locations

Carbon cycling in temperate ecosystems

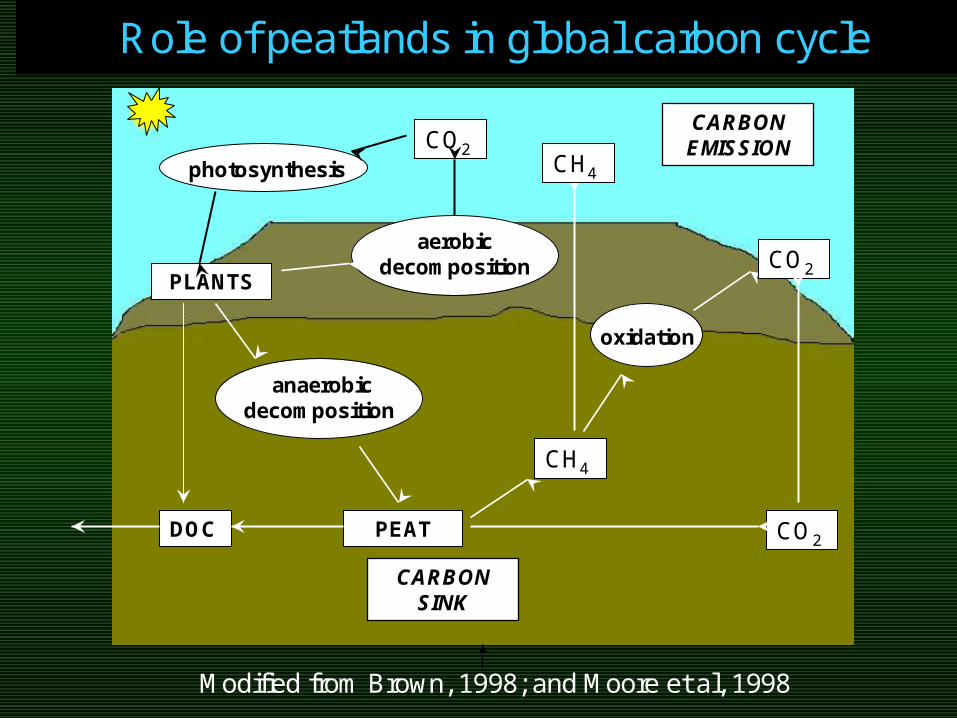
Role of peatlands in global carbon cycle
CARBON EMISSION
CARBON SINK
Modified from Brown, 1998; and Moore et al, 1998
PLANTS
PEAT
anaerobic decomposition
aerobic decomposition
oxidation
CO2
CH4
CH4
CO2
DOC
photosynthesisCO2
c1c2c3c4
c5
c6c7
c8
c9
c10c11
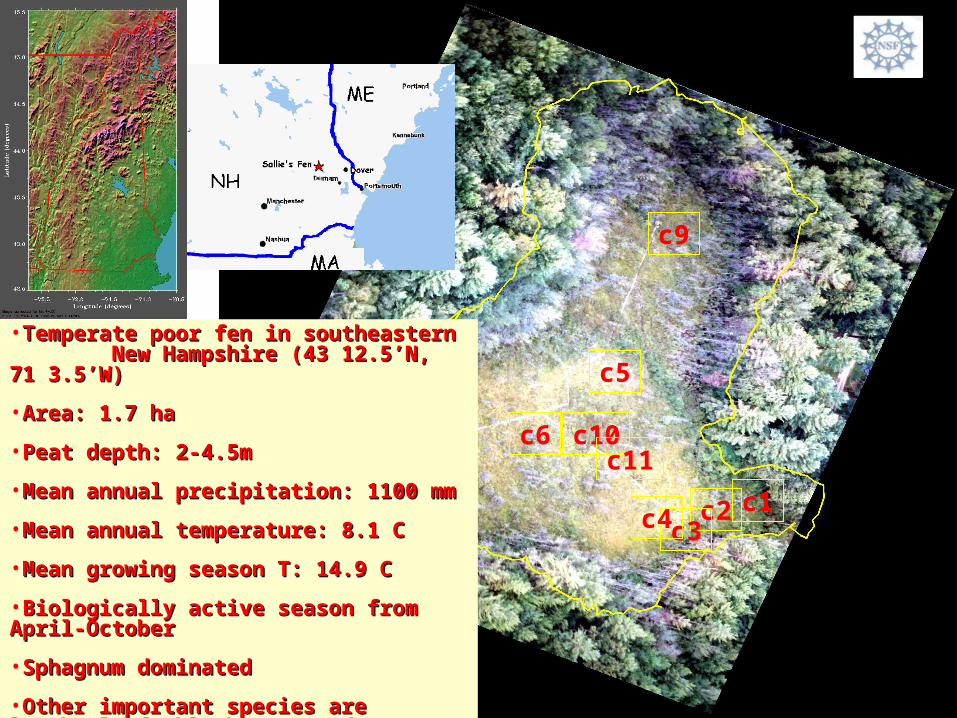
•Temperate poor fen in southeastern Temperate poor fen in southeastern New Hampshire (43 12.5’N, 71 New Hampshire (43 12.5’N, 71 3.5’W)3.5’W)
•Area: 1.7 haArea: 1.7 ha
•Peat depth: 2-4.5mPeat depth: 2-4.5m
•Mean annual precipitation: 1100 mmMean annual precipitation: 1100 mm
•Mean annual temperature: 8.1 CMean annual temperature: 8.1 C
•Mean growing season T: 14.9 CMean growing season T: 14.9 C
•Biologically active season from April-Biologically active season from April-OctoberOctober
•Sphagnum dominatedSphagnum dominated
•Other important species are Other important species are leatherleaf, blueberry, sedgeleatherleaf, blueberry, sedge

Select from chamber
IRGALI6262
Pump
MFC
Select to chamber
Control System
Box
Clear Lexan Boxes
0.07 – 0.08 m3 (5)0.14 – 0.16 m3 (5)
Automated Chamber Fluxes
Distributed Return Manifold
Fans mix headspace
A flux every 20 minutes
96 fluxes per day
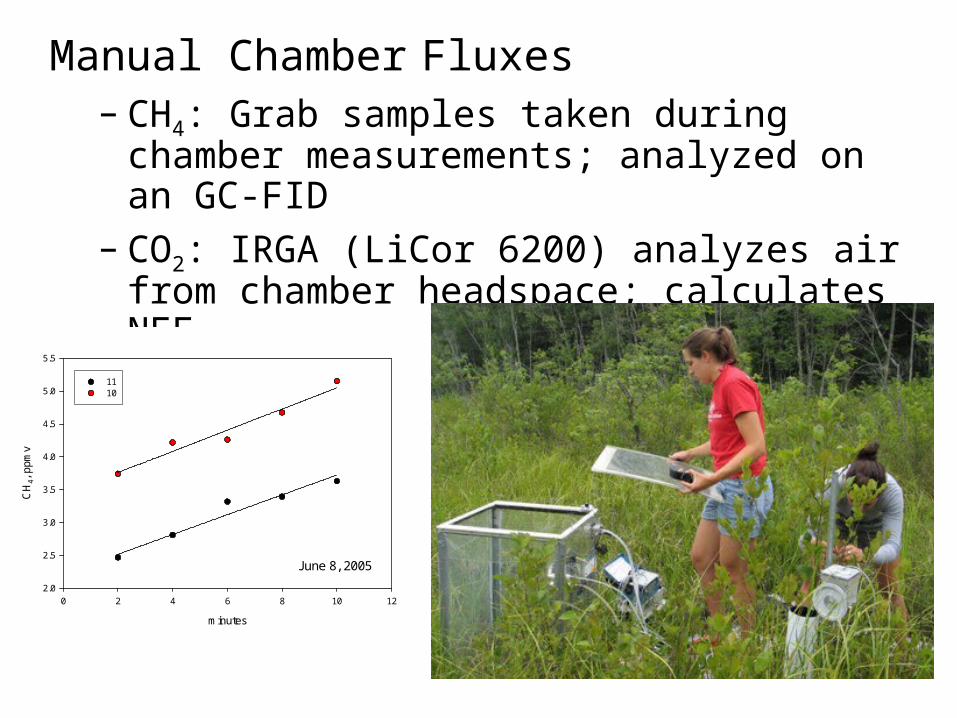
Manual Chamber Fluxes– CH4: Grab samples taken during
chamber measurements; analyzed on an GC-FID
– CO2: IRGA (LiCor 6200) analyzes air from chamber headspace; calculates NEE
June 8, 2005
minutes
0 2 4 6 8 10 12
CH
4, p
pm
v
2.0
2.5
3.0
3.5
4.0
4.5
5.0
5.5
1110

1995 2007
Vegetation survey maps of Sallie’s Fen from 1995 and 2007.

Research Questions?