the book of - evsm · pdf fileobjectives of this book · to identify common problems in...
TRANSCRIPT
Solutions to common value stream mapping
problems with example maps
By: Dilesh Patel, Herman Ranpuria, Jayesh Shah & Jonathan Fournier
Plant Level Maps for Discrete
Parts and Assemblies
The Book of
Value Stream Maps I
Supplier CustomerProcess
Foreword by René Aernoudts
Objectives of this book
· To identify common problems in value stream
mapping at the plant level, and show how you
can solve them to better support a lean
deployment.
· To provide mapping, calculation, and charting
support that complements the workbooks
“Learning to See,” “Creating Continuous
Flow,” “Making Materials Flow,” and “Creating
Level Pull” from the Lean Enterprise Institute.
Recommended Prerequisites
· A basic understanding of the VSM
methodology through training or a book such
as “Learning To See” (John Shook and Mike
Rother).

Copyright 2013 The eVSM Group
7577 Central Parke Boulevard, Suite 316
Mason, OH 45040
Tel: +1-513-258-8540
www.evsm.com
ISBN: 978-0-9888354-0-5
All rights to text and illustration reserved by
The eVSM Group
The Book of Value
Stream Maps IPlant Level Maps for Discrete Parts
and Assemblies
Solutions to common value stream mapping problems with
example maps
By Dilesh Patel, Herman Ranpuria, Jayesh Shah &
Jonathan Fournier
Foreword by René Aernoudts
The Book of Value
Stream Maps I
Plant Level Maps for Discrete
Parts and Assemblies

Acknowledgements 3
Foreword 5
PART I: LEAN & VSM OVERVIEW 7
Introduction 9
Lean and Value Stream Mapping – A Pictorial Review 10
Value Stream Improvement 12
Inventory Levels and Waste 17
Muda, Mura, and Muri 18
Muda, Mura, Muri 19
Visualizing Waste 21
Capacity, Lead Time, and Cost 22
PART II: MAPPING Q&A 27
Introduction 29
Discrete Parts VSM Terms 30
Capacity Q&A 36
Lead Time Q&A 58
Cost Q&A 70
Kaizen Q&A 82
PART III: DISCRETE PARTS VSM EXERCISES 85
APPENDICES 131
Appendix A: Mapping Icons 133
Appendix B: Waste Icons 134
Appendix C: Mapping Q&A 136
References 138
Index 140

2
Acknowledgements
The ideas in this book are a result of the many interactions and learning opportunities we have
had with the community of lean practitioners who have used our eVSM software. We have
discussed solutions to practical VSM problems with them, and they have helped us to understand
how to effectively leverage value stream maps.
Our group really began with the publication of the workbook “Learning To See” from the Lean
Enterprise Institute, and at a subsequent meeting at their office in Boston. Our understanding has
grown with each new workbook, with our work in value stream mapping at client sites, and with
our interaction with Kevin Henn and the large practitioner community at the eVSM LinkedIn
user group that he founded. The idea for this book germinated in discussion with the Lean
Management Instituut in the Netherlands in 2011 at their annual lean management summit. We
gratefully acknowledge their support throughout the process.
We thank Yelena Chuzhoy, Greg Falada, Peter Jahn, Joe Sabo, Fred Shamburg, Franck Vermet,
Susan Delrow, Scott Chase, Trent Wall, Greg Hume, Dave Levine, Cindy Jimmerson, Jeff Boss,
Brian Lange, Carl Hazzard, and many others in the lean community for the wonderful insights
and conversations over the years. We look forward to continuing the journey with them.
Last but not least, Rajvi Desai and Jamie Todd in our group have worked with great enthusiasm
to help us bring all the materials together within intense deadlines.
3Acknowledgements

4

Foreword
The launch of the book “Learning To See” by John Shook and Mike Rother back in 1998 gave
the Lean movement the powerful method of Value Stream Mapping. This method has shown to
be extremely useful in creating insight in processes by visualizing all the activities in the
information flow, the physical flow and the timeline. Many more work books have been
published by the Lean Enterprise Institute to build a strong series of useful methods based on this
first book. Back in those days when I started using Value Stream Mapping I sometimes struggled,
especially with difficult or complex value streams. Luckily Dilesh, Herman and their team came
up with their brilliant software eVSM which made life a lot easier while mapping value streams.
I still often map using paper and pencil, but many of my maps have been transferred in a digital
form for ease of use and communication purposes. eVSM has evolved over time and more and
more functions have been added and a useful support group on LinkedIn has been stimulating the
further development.
Value Stream Mapping sometimes looks easy, but the more you practice, the better you get. Not
all processes are easy to grasp and understand, so sometimes you need some support to be able to
solve the questions you run into. Some years ago the LMI team discussed this with Dilesh and
came up with the idea to create example maps based on questions and challenges that people
might have while mapping their processes. Dilesh got enthusiastic and as a result you see this
book in front of you with lots of great examples of maps for different industries in the process
sector (ranging from food to chemicals) and in the discrete parts and assembly sector. You will
find many examples of challenges you might run into, with the possible solutions and advice how
to work on these issues. Together with the eVSM software this book will be a valuable help for
all the Lean practitioners out there.
To Dilesh and the team: great job guys, keep up the good work, and thanks for the many years of
doing business with you. We are happy with the work you have done all these years.
To you as a reader: you can use this book with or without the eVSM software. It will provide you
with lots of insights in how to overcome many challenges while you map your processes. The
team of eVSM is happy to help out.
René Aernoudts
President, Lean Management Instituut, Zeist, Netherlands
Affiliate of the Lean Global Network
April 2013
5Foreword
How to Use This Book
Part I provides a pictorial review of the major concepts of lean and value stream mapping. It
links the idea of waste reduction to metrics of lead time, capacity and cost that can be visualized
on a map. It also illustrates mapping activities within a continuous improvement process.
This section is for you if you're already familiar with these concepts, but would like to quickly
refresh your understanding.
Part II looks at mapping questions organized by capacity, lead time and cost related to discrete
parts & assemblies. It includes example maps built in eVSM to go along with the questions to
understand them visually.
Appendix A shows pictures of the most commonly used value stream mapping icons. Appendix B
describes the seven kinds of waste and the associated icons. Appendix C shows a list of the
mapping questions from the book. Appendix D shows a list of figures from the book.
PART I: LEAN & VSM OVERVIEW
PART II: MAPPING Q&A
APPENDICES
PART III: VSM EXERCISES
Part III includes exercises that test your ability to analyze maps. This section contains problem
and solution maps about processes that are concerned with discrete parts & assemblies (scissors,
widgets, computers, and the like).
6
Le
an
&
V
SM
Ove
rvie
w
PART I: LEAN & VSM OVERVIEW
7PART I LEAN & VSM OVERVIEW
Le
an
&
V
SM
Ove
rvie
w
Part I: LEAN & VSM OVERVIEW
§ Introduction
§ Lean and VSM – A Pictorial Review
§ Value Stream Improvement
§ Inventory Levels and Waste
§ Muda, Mura, Muri
§ Waste & Metrics
§ Capacity
§ Lead Time
§ Cost
8
“A value stream is all the actions (both value-creating and nonvalue-creating) currently
required to bring a product through the main flows essential to every product…” (Rother and
Shook, “Learning to See”)
Ever since we were introduced to the concept of Value Stream Mapping (VSM) within a lean
deployment we have loved the simplicity and common sense behind the approach. Our
introduction came through the workbook “Learning To See”, in which the authors developed a
formal methodology based on the material and information flow diagrams and discussions they
had seen used in Toyota, and that were described as a piece of the overall improvement
methodology in the book “Lean Thinking” by Womack and Jones.
The Lean Enterprise Institute has published several subsequent workbooks that show how value
stream maps play into different aspects of a lean deployment. Our goal as a group is to support
both the mapping and related calculations recommended within this set of workbooks and make
them easier to accomplish.
This book looks at the key metrics, formulas, and visuals for understanding and improving plant
level value stream maps. It does not teach the basic concepts of value stream mapping. For that
we refer you to the excellent resources in the bibliography starting with “Learning to See.”
Part I is a pictorial refresher through lean concepts, the use of maps in a lean deployment, and the
metrics of capacity, lead time, and target cost used to analyze and visualize maps. Part II goes
straight to questions and answers related to each of these metrics using simple maps for
illustration.
Introduction
9PART I LEAN & VSM OVERVIEW
Non-Value
Added
(Waste)
Value
Added
Non-Value
Added but
Necessary
Waste
Waste
RemovalValue
Added
Non-Value
Added but
Necessary
Process
level
Single plant
(door to door)
Multiple plants
Across companies
Product family
Future-state
drawing
Current-state
drawing
Work plan &
implementation
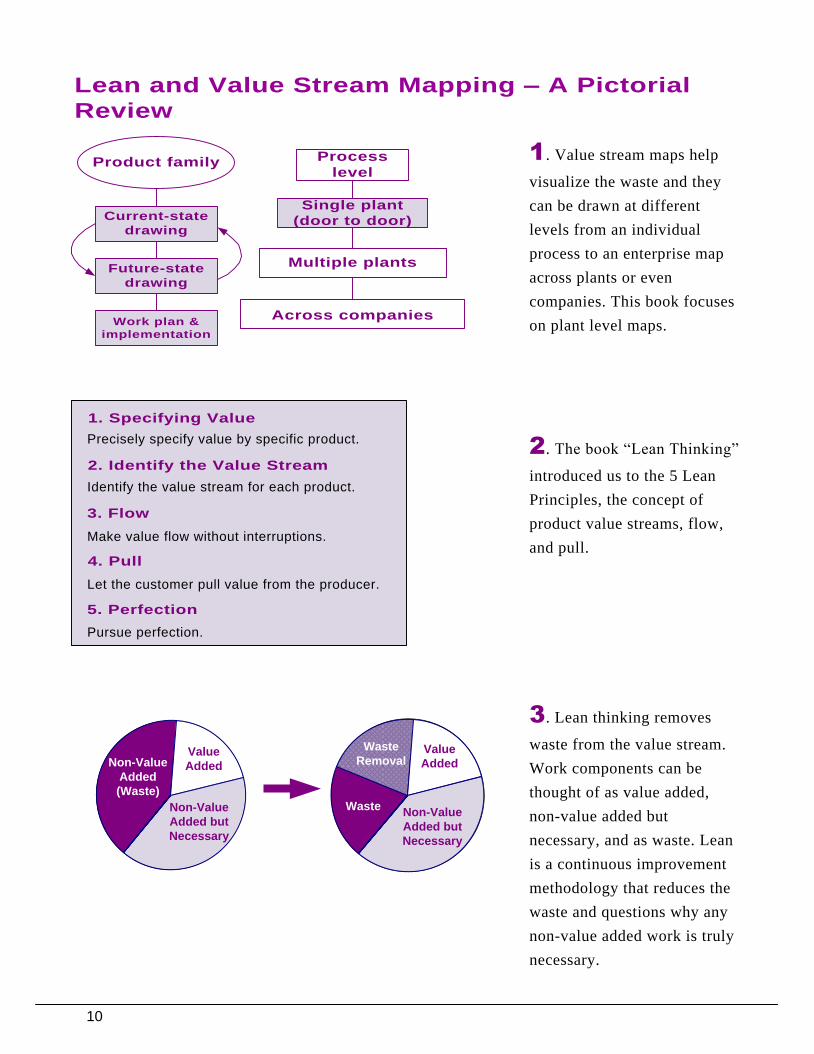
Lean and Value Stream Mapping – A Pictorial
Review
2. The book “Lean Thinking”
introduced us to the 5 Lean
Principles, the concept of
product value streams, flow,
and pull.
3. Lean thinking removes
waste from the value stream.
Work components can be
thought of as value added,
non-value added but
necessary, and as waste. Lean
is a continuous improvement
methodology that reduces the
waste and questions why any
non-value added work is truly
necessary.
1. Value stream maps help
visualize the waste and they
can be drawn at different
levels from an individual
process to an enterprise map
across plants or even
companies. This book focuses
on plant level maps.
1. Specifying Value
2. Identify the Value Stream
3. Flow
Let the customer pull value from the producer.
4. Pull
Make value flow without interruptions.
5. Perfection
Precisely specify value by specific product.
Identify the value stream for each product.
Pursue perfection.
10
Generating
Defective
Products
Machine
Breakdowns
ReworkDelay in
DeliveryMixed
Materials
Poor
Housekeeping
Long
Set ups
=Water
Level
Inventory
Amount
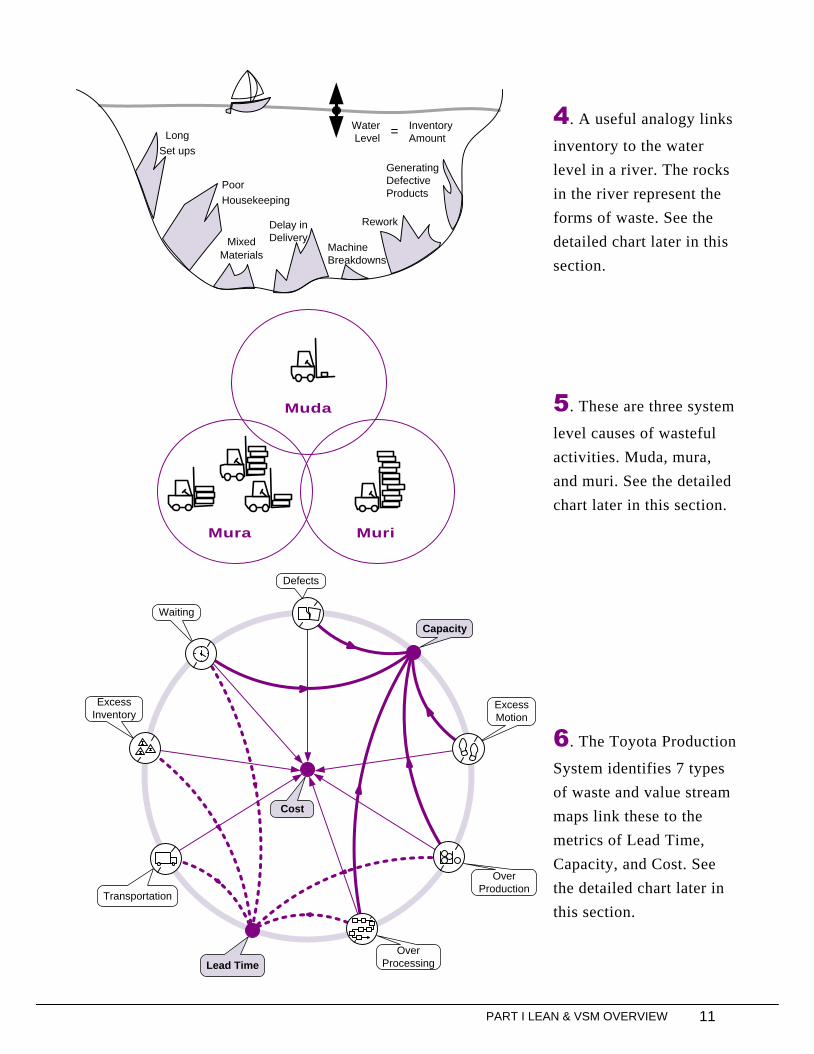
5. These are three system
level causes of wasteful
activities. Muda, mura,
and muri. See the detailed
chart later in this section.
6. The Toyota Production
System identifies 7 types
of waste and value stream
maps link these to the
metrics of Lead Time,
Capacity, and Cost. See
the detailed chart later in
this section.
4. A useful analogy links
inventory to the water
level in a river. The rocks
in the river represent the
forms of waste. See the
detailed chart later in this
section.
Muda
MuriMura
Excess
Inventory
Waiting
Defects
Over
ProductionTransportation
Excess
Motion
Over
Processing
Capacity
Lead Time
Cost
11PART I LEAN & VSM OVERVIEW

Value Stream Improvement
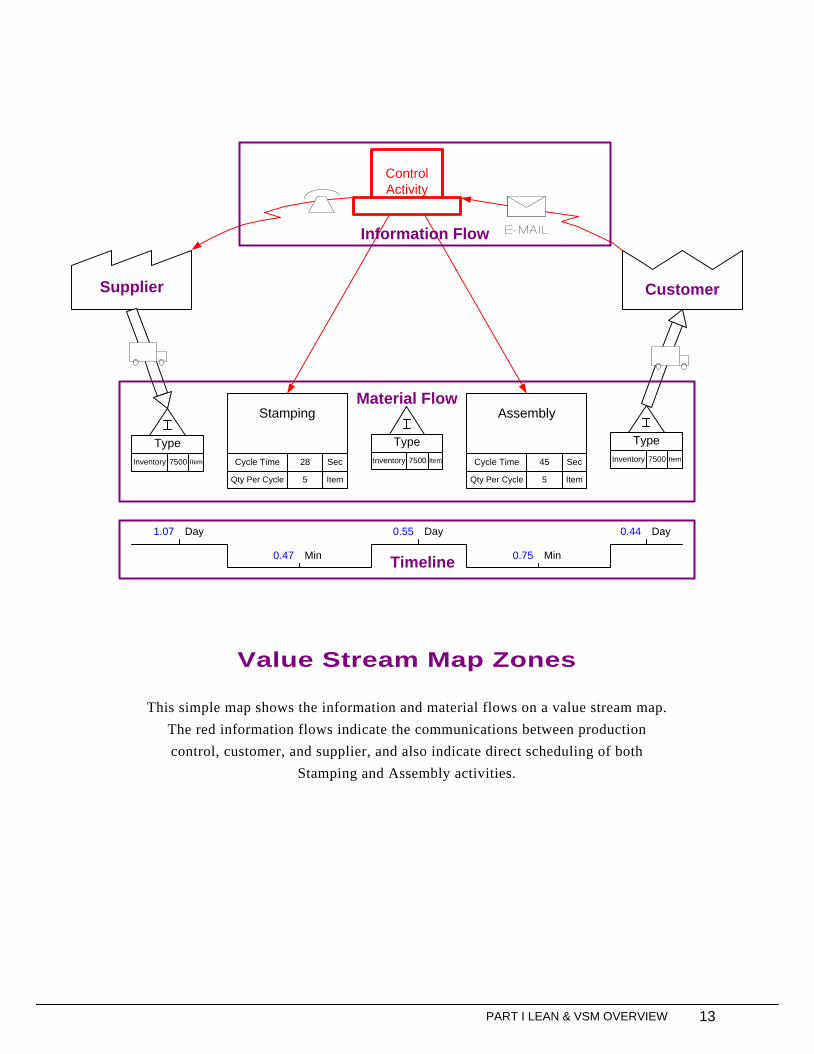
The Value Stream Map Zones diagram shows the information and material flows on the map.
The information flow shows how production is scheduled and the material flow shows the
physical inventories and movements of materials. The two flows are closely related and both
should be represented on the map. The timeline at the bottom is useful to understand the Lead
Time components as a part goes through the value stream.
The Value Stream Improvement Process diagram shows one approach to developing and using
maps in the Continuous Improvement Process. Mapping almost always begins with paper and
pencil, and then maps are (optionally) captured electronically to aid in sharing, analysis, and
visualization. Regardless of the format, mapping is followed by brainstorming towards a leaner
future state with projects being planned out and implemented. The future state is then realized
and the improvement cycle is repeated.
One of the lean practitioners in our community uses the following approach in creating
wall maps. First start with a large roll of white paper attached to the wall. Add 3x3 Post-
it Notes of different colors to document the various operations. Turn one of the Post-it
colors to a 45º angle to indicate inventory. Use a separate color for any notes or
questions, and post them in the corner of the paper.
12
Day1.07
Inventory Item7500
Min0.47
Qty Per Cycle Item5
Cycle Time Sec45
Supplier Customer
Type
Control
Activity
Stamping
Type
Assembly
Type
Day0.55
Min0.75
Day0.44
Cycle Time Sec28
Qty Per Cycle Item5
Inventory Item7500 Inventory Item7500
Material Flow
Timeline
Information Flow
Value Stream Map Zones
This simple map shows the information and material flows on a value stream map.
The red information flows indicate the communications between production
control, customer, and supplier, and also indicate direct scheduling of both
Stamping and Assembly activities.
13PART I LEAN & VSM OVERVIEW
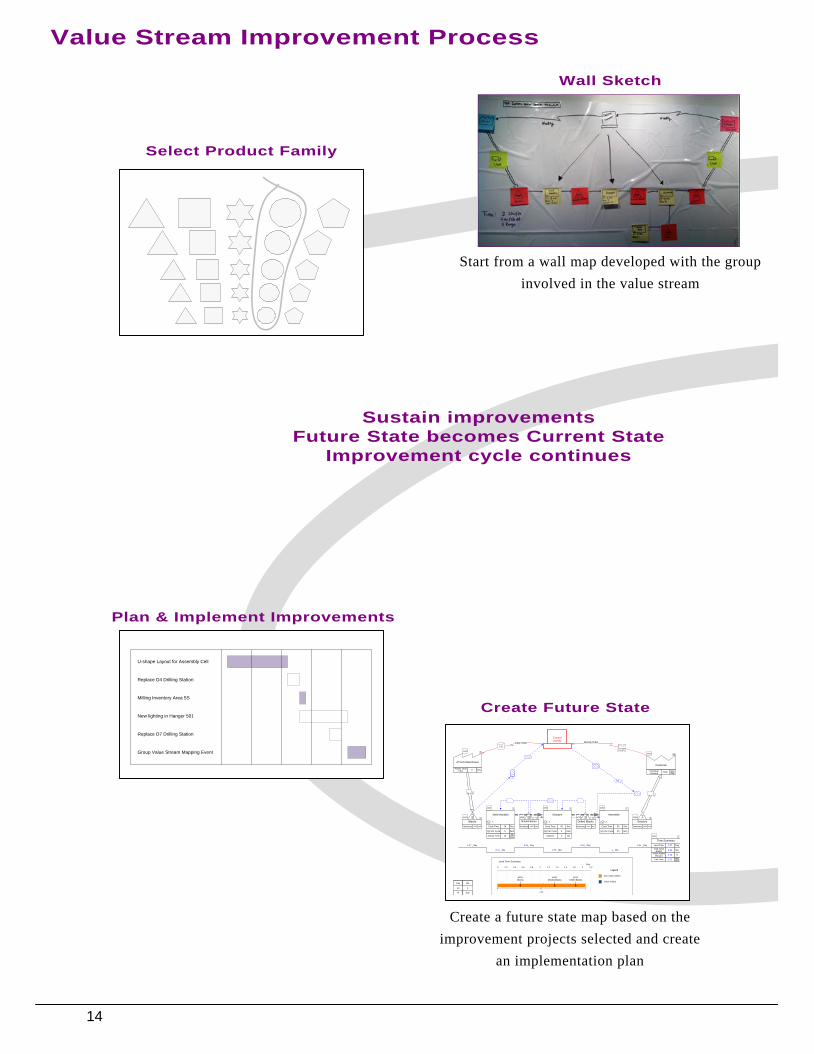
Start from a wall map developed with the group
involved in the value stream
Create a future state map based on the
improvement projects selected and create
an implementation plan
Create Future State
Select Product Family
14
Day
Hr
5
Wk
Day
all
Customer
Customer Demand
ItemDay
7000
A0101
ATLAS Warehouse
Activity Lead Time
Day0
A020
Control
Activity
1
Blanks
Day1.07
Inventory Item7500
A030
1
Mold Handles
Min0.47
Qty Per Cycle Item5
Cycle Time Sec28
1
A040
1
Molded Blanks
Day0.55
Inventory Item3850
A050
1
Sharpen
Min0.75
Qty Per Cycle Item5
Cycle Time Sec45
1
A060
1
Drilled Blanks
Day0.44
Inventory Item3100
A070
1
Assemble
Min1
Qty Per Cycle Item10
Cycle Time Sec60
2
A080
1
Scissors
Inventory Item9000
A090
Activity TimeHr
Day10 Stations Stn2
Daily Order Weekly Order
1
Day0.44
Time Summary
Takt TimeMinItem
0.12
Total Value Added
Min2.22
Lead Time Day2.07
Value Added Percent
%0.13
Z010
Lead Time Summary
Day
0 0.2 0.4 0.6 0.8 1 1.2 1.4 1.6 1.8 2 2.2
A030
Blanks
A050
Molded Blanks
A070
Drilled Blanks
2.06
Non Value Added
Legend
Value Added
Wall Sketch
Plan & Implement Improvements
U-shape Layout for Assembly Cell
Replace D4 Drilling Station
Milling Inventory Area 5S
New lighting in Hanger 501
Replace D7 Drilling Station
Group Value Stream Mapping Event
Sustain improvements
Future State becomes Current State
Improvement cycle continues
Value Stream Improvement Process
14
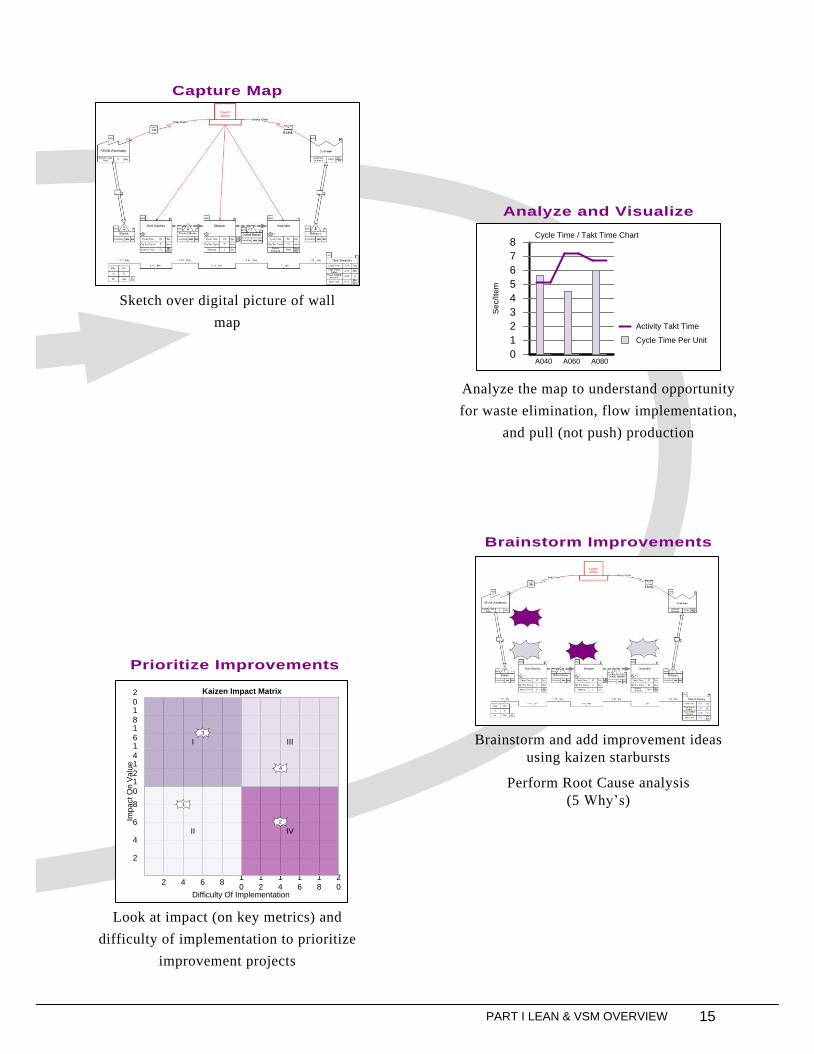
Brainstorm and add improvement ideas
using kaizen starbursts
Perform Root Cause analysis
(5 Why’s)
Look at impact (on key metrics) and
difficulty of implementation to prioritize
improvement projects
Capture Map
Cycle Time / Takt Time Chart
Se
c/I
tem
0
1
2
3
4
5
6
7
8
A040 A060 A080
Cycle Time Per Unit
Activity Takt Time
2
01
81
61
41
21
0
8
6
4
2
2 4 6 81
0
1
2
1
4
1
6
1
8
2
0
IV
I
II
III
Difficulty Of Implementation
Imp
act O
n V
alu
e
Kaizen Impact Matrix
1
2
3
4
Sketch over digital picture of wall
map
Analyze the map to understand opportunity
for waste elimination, flow implementation,
and pull (not push) production
Analyze and Visualize
Brainstorm Improvements
Prioritize Improvements
15PART I LEAN & VSM OVERVIEW
Generating
Defective
Products
Machine
Breakdowns
ReworkDelay in
DeliveryMixed
Materials
Poor
Housekeeping
Long
Set ups
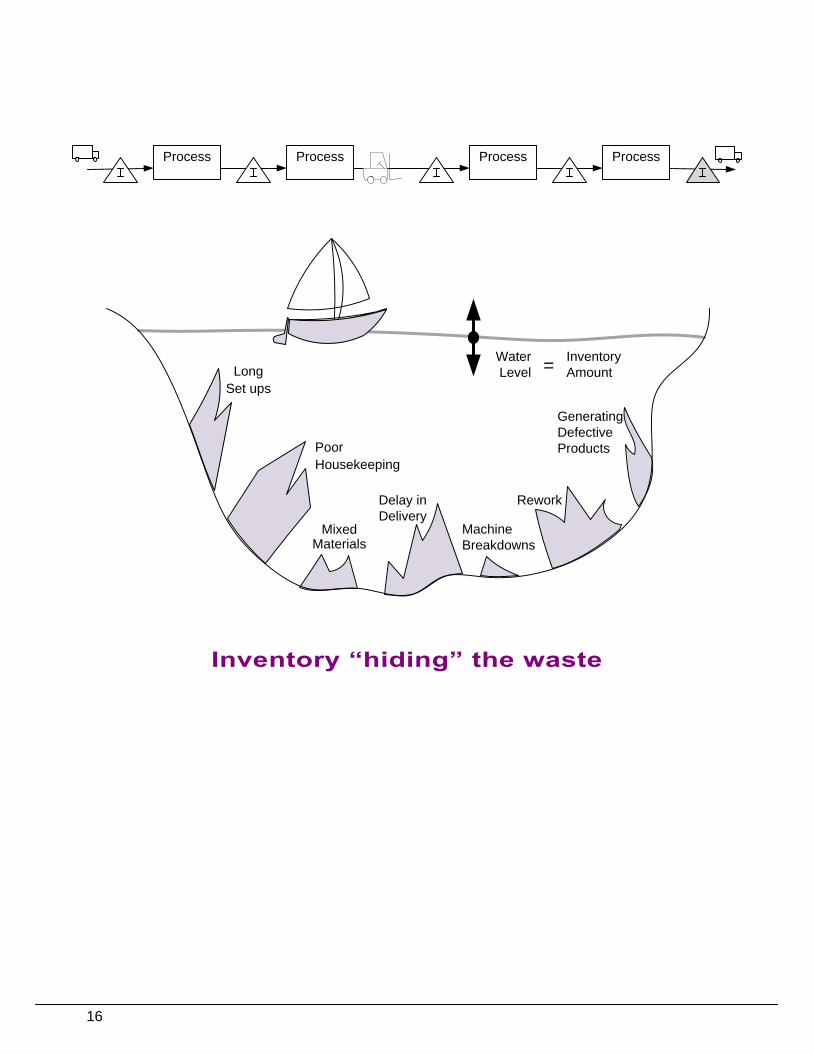
Inventory “hiding” the waste
=Water
Level
Inventory
Amount
Process Process Process Process
16

Because work items have to wait for existing inventory in the value stream to be processed
before new items can be processed, excess inventory levels are a major contributor to Lead
Times. However, for production managers, inventory is a valuable tool to make sure that they can
meet production and shipping targets in case of disruptions and changing demand. In practice,
inventory also has associated Carrying Costs.
The problem is sometimes illustrated as crossing a river with dangerous rocks below the surface
of the water.
§ Think of productions as crossing the river. This is reinforced by the value stream map
above the river, where inventory is represented by the letter “I” in a triangle. Inventory
can be unfinished parts between processing steps, and finished product (the gray triangle)
waiting to ship.
§ Think of the water level as the inventory represented by all the triangles in the value
stream. The higher the water level the longer it takes to cross the river.
§ Think of the variances and wastes as the rocks in the river. If you bring inventory levels
down too low, then production will hit one or more rocks. For smooth production you
have to maintain adequate inventory levels (water level). To reduce inventory levels,
costs, and waste, you have to break down the rocks.
Inventory Levels and Waste
17PART I LEAN & VSM OVERVIEW
Overburdening
of equipment
or people
Unevenness in
operation, or
uneven work
pace
Activities that
consume resources
without creating
value for the
customer
Mura and Muri
reduction require a
higher level of
management
participation
Muda
MuriMura
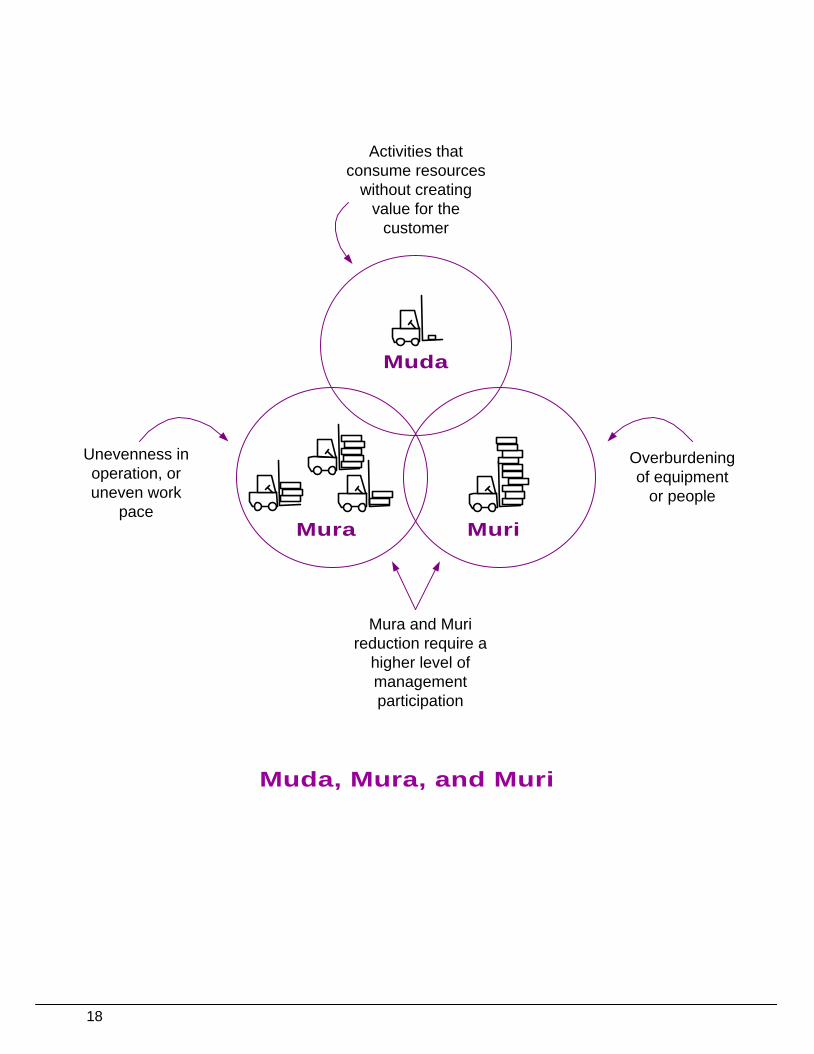
Muda, Mura, and Muri
18
Waste is termed as Muda and is impacted by Mura and Muri. In 2006, Jim Womack posted a
Lean forum article on Mura, Muri and Muda. He noted that often the Mura (unevenness of
operations) creates Muri (overburdening of people) that undercuts previous efforts to eliminate
Muda. The subject matter of this book (value stream mapping) is closely related to reduction in
Muda and involves the people undertaking the activities in the value stream. Efforts to reduce
Mura and Muri often require the engagement of management in the Lean effort, and in their
absence a pure Muda effort is doomed to failure. Publications such as Art Smalley's “Creating
Level Pull” talk about protecting production operations from Mura through the use of well
designed finished goods markets and pull systems.
Muda: Any activity that consumes resources without creating value for the customer. This is
illustrated by the large forklift carrying a very small package.
Mura: Unevenness in an operation. This is illustrated in the diagram by showing forklifts
transporting uneven quantities.
Muri: Overburdening equipment or operators by requiring them to run at a higher or harder
pace with more force and effort for a longer period of time than the equipment designs and
appropriate workforce management allow. This is illustrated by the overloaded fork lift.
Muda, Mura, Muri
19PART I LEAN & VSM OVERVIEW