the biomanufacturing capacity conundrum: matching …the biomanufacturing capacity conundrum:...
TRANSCRIPT

The Biomanufacturing Capacity Conundrum: Matching Supply and
Demand Over Space and Time
Delivery and Manufacturing of BiologicsSession ID #14010:00 – 11:30 AM
June 28, 2011

Agenda Howard L. Levine, Ph.D.
• President, BioProcess Technology Consultants, Inc.• Global Trends in Biomanufacturing: Separating the Haves from the Have-nots
William J. Fallon• Vice President Manufacturing and Operations, Halozyme Therapeutics, Inc.• Customer Perspective on Capacity Challenges and Needs
Roger Lias, Ph.D.• President, Eden Biodesign, Inc.• Acquisitions, Biosimilars, and CMO Consolidation: Food for Thought When
Planning for Long Term Biomanufacturing Requirements Parrish Galliher
• Founder and Chief Technology Office, Xcellerex, Inc.• The Biomanufacturing Capacity Conundrum: How to Manage Uncertainty of
Manufacturing Demand

BioProcess Technology Consultantswww.bptc.com
Global Trends in Biomanufacturing: Separating the Haves from the Have-nots
Howard L. Levine, Ph.D.President and Principal ConsultantBIO 2011 International ConventionWashington, DCJune 27 – 29, 2011

From Clone to Commercial®
Increasing Sales of Biopharmaceutical Products
‐
5,000
10,000
15,000
20,000
25,000
30,000
35,000
2010 2011 2012 2013 2014 2015 2016
Total D
emand (Kg/Year)
Year
Commercial BLA/NDA Phase 3Phase 2 Phase 1 Clincial
0125250375500625750875
2000
2001
2002
2003
2004
2005
2006
2007
2008
2009
Sales ($B
)
YearBiopharmaceuticalsTraditional Pharmaceuticals
From Clone to Commercial®
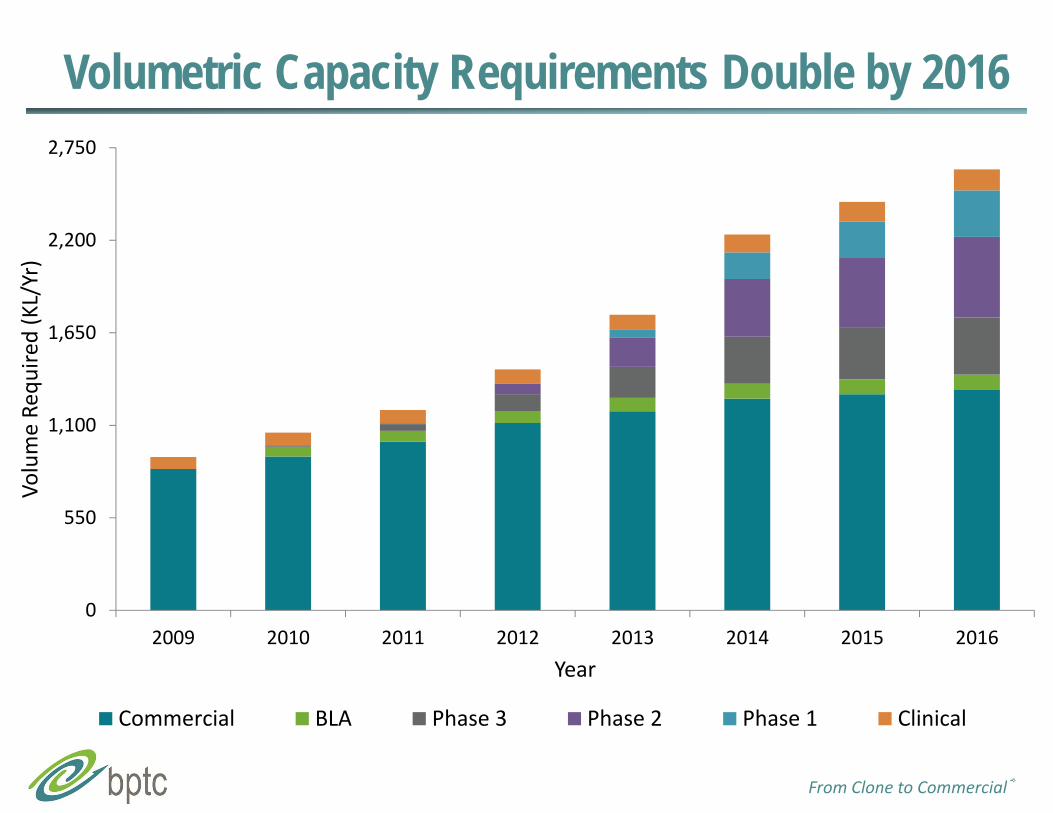
Volumetric Capacity Requirements Double by 2016
0
550
1,100
1,650
2,200
2,750
2009 2010 2011 2012 2013 2014 2015 2016
Volume Re
quire
d (KL/Yr)
Year
Commercial BLA Phase 3 Phase 2 Phase 1 Clinical

From Clone to Commercial®
North America Dominates Cell Culture Capacity
0
375
750
1,125
1,500
1,875
2,250
2010 2011 2012 2013 2014 2015 2016
Installed Capacity (K
L)
Year
Asia Europe North America

From Clone to Commercial®
Product Companies Control >65% of Capacity
0
900
1,800
2,700
3,600
4,500
2010 2011 2012 2013 2014 2015 2016
Total Vo
lume (KL)
Year
CMO Both Product Co.
From Clone to Commercial®
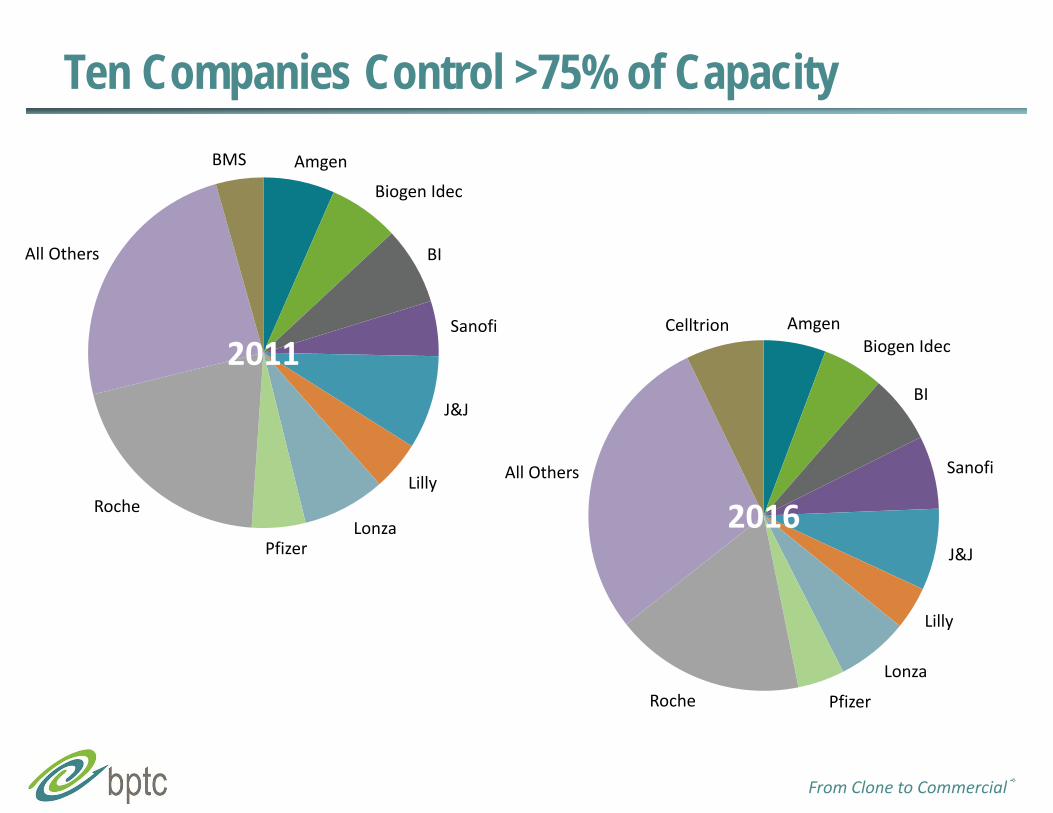
AmgenBiogen Idec
BI
Sanofi
J&J
Lilly
Lonza
PfizerRoche
All Others
Celltrion
Ten Companies Control >75% of CapacityAmgen
Biogen Idec
BI
Sanofi
J&J
Lilly
LonzaPfizer
Roche
All Others
BMS
2011
2016

From Clone to Commercial®
CMO Capacity Predominately at <10,000 L
0
5
10
15
20
25
30
<1,000 L 1,000 < 10,000 L 10,000 < 100,000 L >100,000 L
No. Com
panies
Total Volume (L)
Product (2010) Both (2010) CMO (2010) Product (2016) Both (2016) CMO (2016)
From Clone to Commercial®
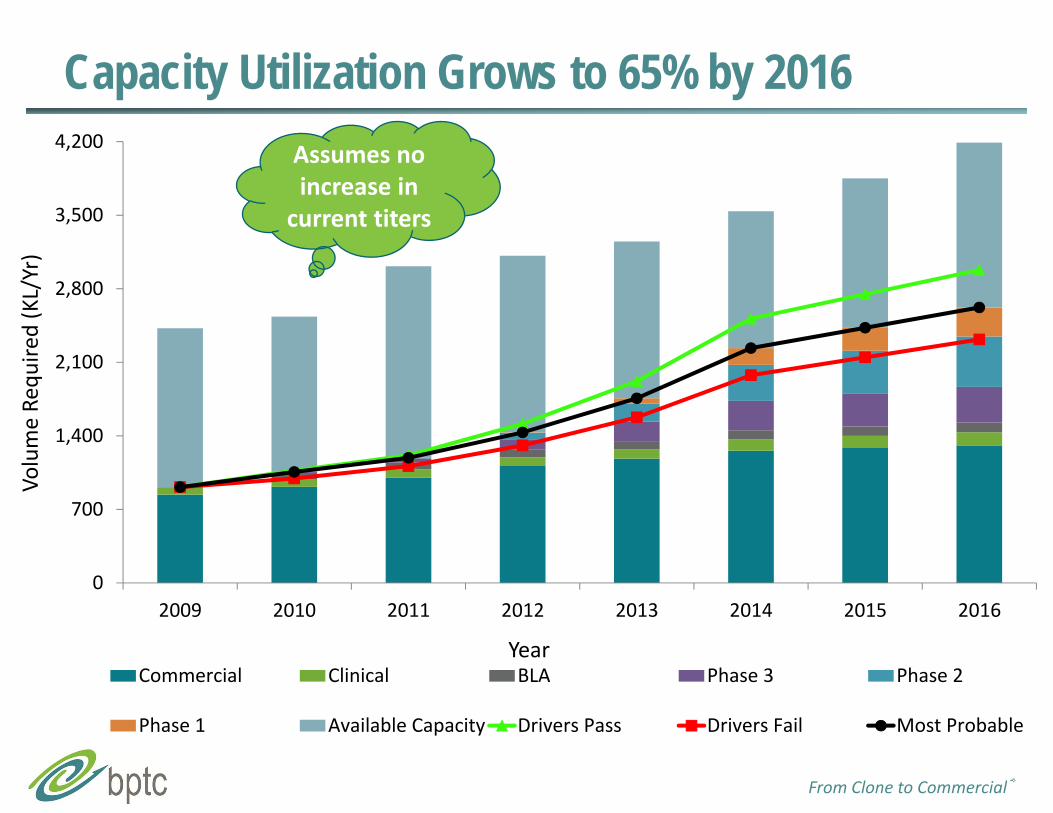
Capacity Utilization Grows to 65% by 2016
0
700
1,400
2,100
2,800
3,500
4,200
2009 2010 2011 2012 2013 2014 2015 2016
Volume Re
quire
d (KL/Yr)
YearCommercial Clinical BLA Phase 3 Phase 2
Phase 1 Available Capacity Drivers Pass Drivers Fail Most Probable
Assumes no increase in current titers

From Clone to Commercial®
Capacity Utilization at Top 5 Product CompaniesReaches 50% by 2016
0
400
800
1,200
1,600
2,000
2009 2010 2011 2012 2013 2014 2015 2016
Installed Capacity (K
L)
YearCommercial Clinical BLAPhase 3 Phase 2 Phase 1Available Capacity
44% 43% 43% 48% 49% 52% 50% 47%
Includes Sanofi, Roche, Amgen, J&J, Pfizer

From Clone to Commercial®
Utilization Pushes 75% for the Rest of the Industry
0
500
1,000
1,500
2,000
2,500
2009 2010 2011 2012 2013 2014 2015 2016
Installed Capacity (K
L)
Year
Commercial Clinical BLA Phase 3 Phase 2 Phase 1 Available Capacity
32% 40% 37% 58%45% 74%72% 75%

From Clone to Commercial®
Trends That Will Impact Future Capacity Utilization Success or failure of a limited number of high volume products currently in
late stage clinical development• Acquisition of “volume driver” product candidates by product
companies having significant capacity may free up CMO capacity Mergers and acquisitions, resulting in redundant facilities
• Companies moth‐balling or not starting up facilities due to excess capacity include Pfizer, Roche, Amgen, Lilly, and others…
Personalized medicine will put greater focus on smaller markets and niche products• Fewer “blockbuster” drugs with high volume demand
Introduction of biosimilars will result in wider demand for capacity but not necessarily an increase in industry‐wide demand
Increases in process productivity and overall facility utilization…• 2X increase in productivity will reduce overall capacity requirements by
approximately 25% by 2013

From Clone to Commercial®
Increases in Titer and Facility Utilization…Lowers Demand for Capacity
20092010201120122013201420152016
0
600
1,200
1,800
2,400
3,000
3,600
4,200
0.5x 1x 1.5x 2x
Volume Re
quire
ments (K
L)
Titer Increase
20092010201120122013201420152016
0%
10%
20%
30%
40%
50%
60%
70%
80%
90%
100%
0.5x 1x 1.5x 2x
Capacity Utiliza
tion (%
)
Titer Increase

From Clone to Commercial®
Manufacturing Facilities of the Future
Designed for modern, state‐of‐the art processes• Cell culture titers of titer >5 g/L• Platform purification with overall yields of >70%
Expanded use of single‐use and disposable technologies to reduce capital investment and operating costs
Incorporate greater DSP space and capabilities• Ratio of USP to DSP space will decrease
Smaller bioreactors to produce similar quantities to today’s facilities• Reduced capital requirements may enable smaller companies to
construct their own facilities rather than outsource

Thank You!
BioProcess Technology Consultants, Inc.12 Gill Street, Suite 5450Woburn, MA 01801
+1.781.281.2703
Howard L. Levine, Ph.D.

Customer Perspective on Capacity Challenges and Needs
William J. FallonVP, Manufacturing & Operations
Halozyme Therapeutics, Inc.

Case Study: Halozyme Therapeutics, Inc.• Mid-Size biotechnology company
•~100 employees•Founded 1998•Listed on NASDAQ (HALO)
•~$650M Market Cap•Develops products based on biology of extracellular matrix
•Drug delivery•Route of administration change
•Endocrinology•Diabetes
•Oncology•Solid tumors
•Dermatology•Commercial and clinical products
San Diego, CA

Development Strategy has Three Anchors
• First platform technology (Enhanze™)•Recombinant human hyaluronidase (rHuPH20, PH20)•Supplied to partners under collaboration agreements
•Roche, Baxter, ViroPharma, Intrexon•Development of proprietary therapeutics
•PH20-Insulin formulations•PEGPH20•rHu-cathepsin-L
•Commercial Products•HYLENEX®
•Cumulase™
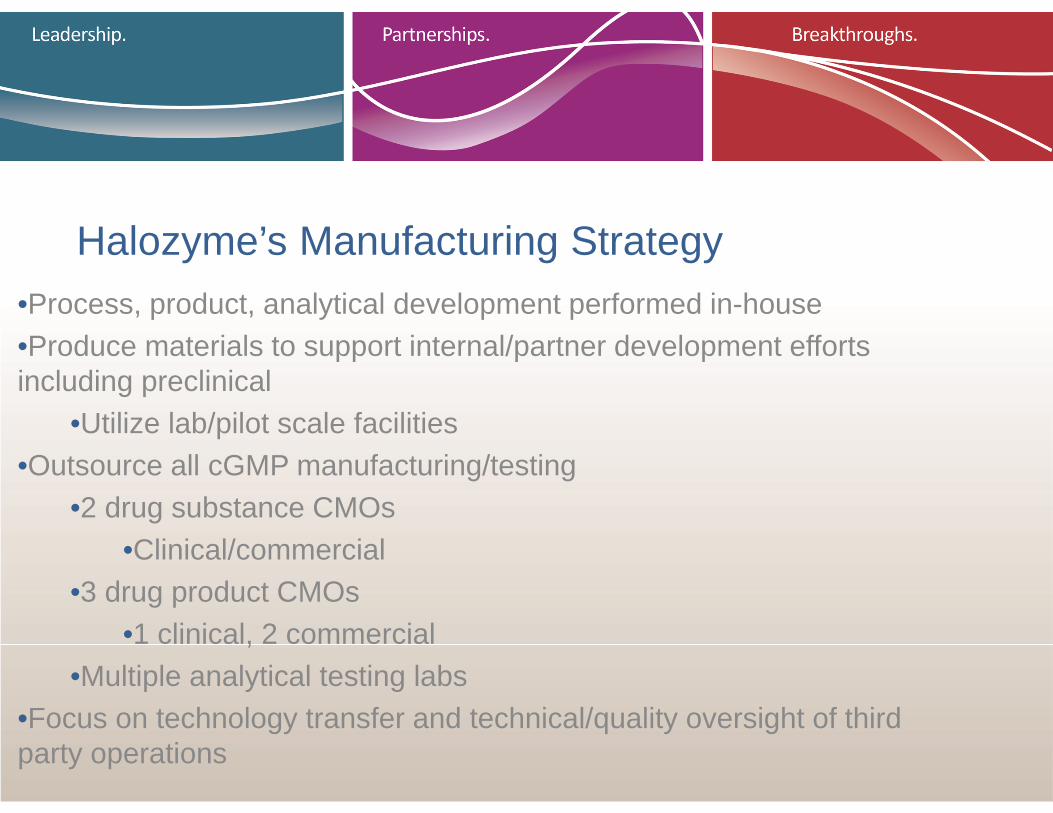
Halozyme’s Manufacturing Strategy•Process, product, analytical development performed in-house•Produce materials to support internal/partner development efforts including preclinical
•Utilize lab/pilot scale facilities•Outsource all cGMP manufacturing/testing
•2 drug substance CMOs•Clinical/commercial
•3 drug product CMOs•1 clinical, 2 commercial
•Multiple analytical testing labs•Focus on technology transfer and technical/quality oversight of third party operations

Critical Manufacturing Needs (Bulk DS)• Access to flexible capacity
•Low volume for clinical stage products•100’s L/yr (sporadic demand)
•Larger volume for commercial/partnered products•50,000+ L/Yr (demand forecast driven)
•Standard process technology = portability•Stirred tank bioreactors, column chromatography, filtration•Ability to transfer technology to multiple sites
•Not encumbered with CMO IP•Costs: Modest start-up fees and low COGS
Manufacturing Capacity Challenges• Access to suitable capacity (clinical/commercial)
•Better now than 5+ years ago•More clinical stage CMOs available to work with smaller companies
•Lack of experience (operations, regulatory) can pose risks•Larger, established CMOs willing to work with smaller companies
•Cost and flexibility can be issues•Multiple sites needed for supply assurance
•Avoid IP barriers•Costs
•High start-up costs/time (mitigated by disposables technology)•Reducing/optimizing COGS (productivity and yield improvements)

Summary Observations• Access to suitable capacity (clinical/commercial) currently exists for volumes in the range of up to ~50,000 L/yr
•Plan on lead time of 6-9 months for confirmed slots•Recent purchases by CMOs of product company approved commercial facilities provides for new capacity opportunities
• CMOs typically allow for portability of processes•Care must be taken to avoid IP or non-standard process technologies
• Use of disposable equipment can reduce initial capital costs, validation costs and minimize lead time to production
•Although it does increase materials cost• Productivity improvements and process yield optimization remain primary mechanism for reducing COGS
Thank You
William J. FallonVP, Manufacturing & Operations
Halozyme Therapeutics, Inc.
AcquisitionsBiosimilars andCMO Consolidation
Food for Thought When Planning for Long Term Biomanufacturing Requirements
Roger Lias, Ph.D.President, Eden Biodesign, Inc.
A Watson Group Company
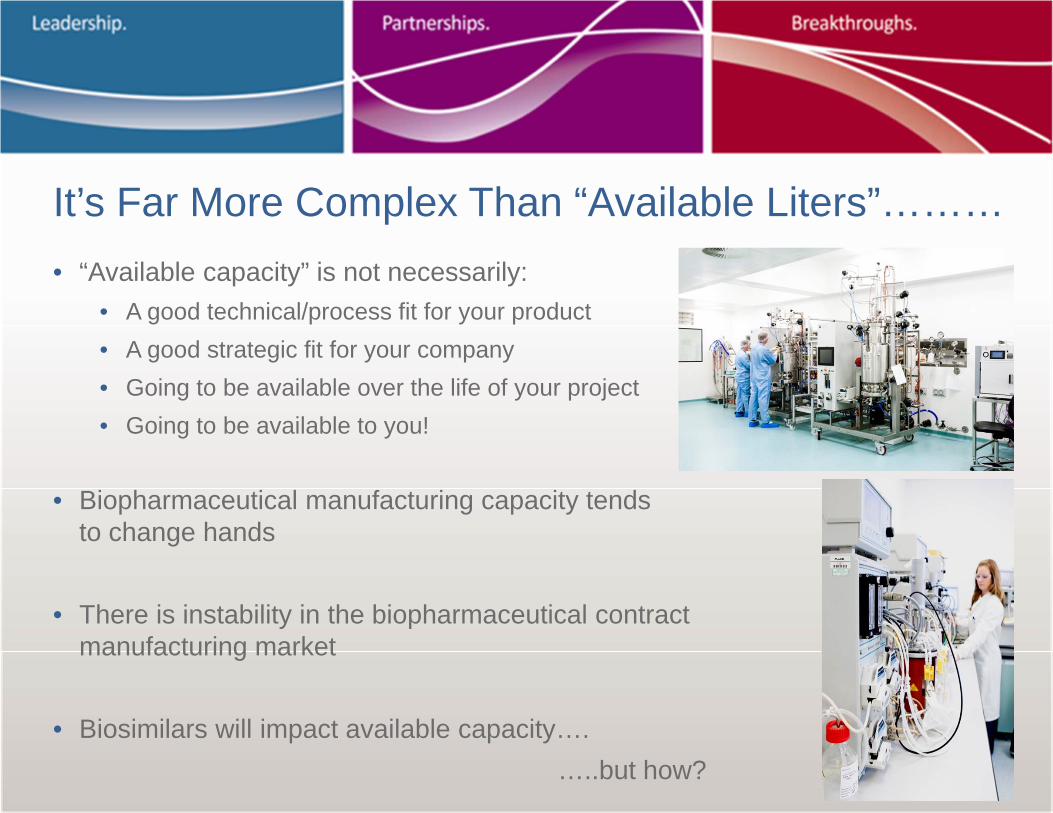
It’s Far More Complex Than “Available Liters”………• “Available capacity” is not necessarily:
• A good technical/process fit for your product• A good strategic fit for your company• Going to be available over the life of your project• Going to be available to you!
• Biopharmaceutical manufacturing capacity tends to change hands
• There is instability in the biopharmaceutical contract manufacturing market
• Biosimilars will impact available capacity….…..but how?

Eden Biodesign
• Founded in 2000 as a consultancy• Awarded bid to run UK’s National Biomanufacturing Centre in 2003• Licensed cGMP manufacturing facility in Liverpool, UK• Until January 2010 an independent private company offering process
development and cGMP manufacturing services to the global market• Mammalian cell culture; microbial fermentation; viral production platforms
• Acquired by Watson Pharmaceuticals (NYSE: WPI) in January 2010• Now designated as Watson’s “Center of Excellence for Biologics”• Continuing significant legacy third party projects, but no longer
seeking new “fee-for-service” clients• Formally withdrawing from the biopharmaceutical contract
manufacturing market at this event.
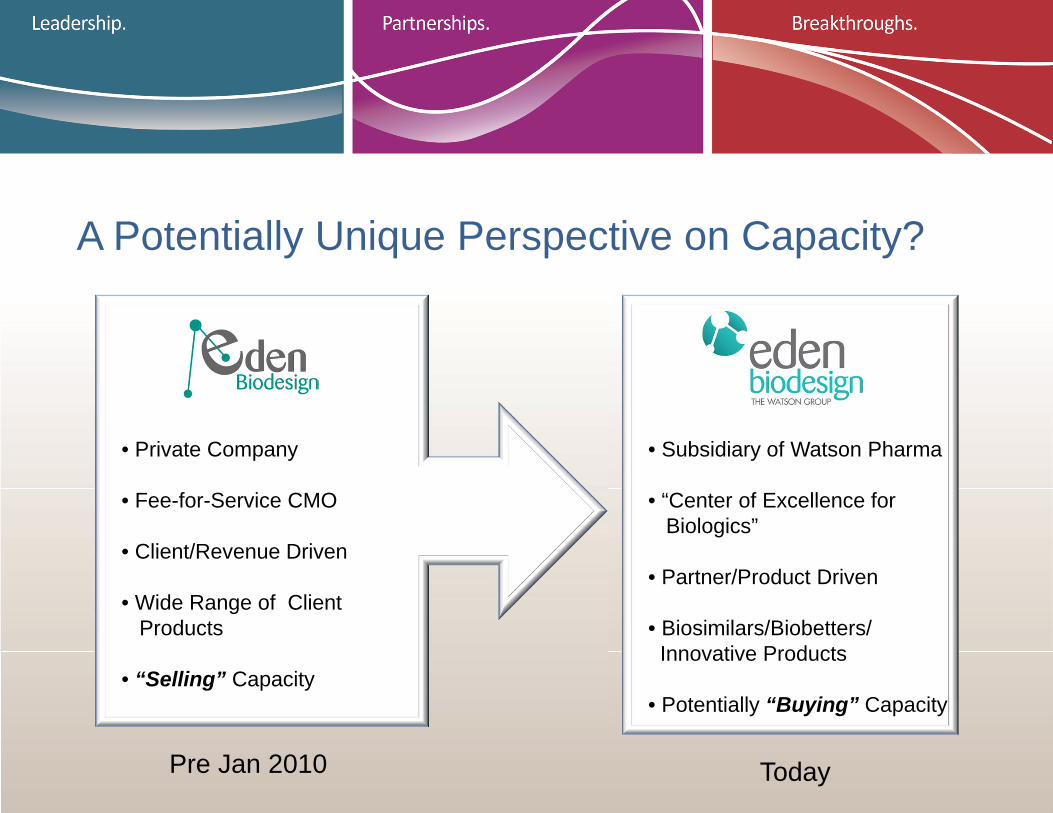
A Potentially Unique Perspective on Capacity?
F
Pre Jan 2010 Today
• Private Company
• Fee-for-Service CMO
• Client/Revenue Driven
• Wide Range of Client Products
• “Selling” Capacity
• Subsidiary of Watson Pharma
• “Center of Excellence for Biologics”
• Partner/Product Driven
• Biosimilars/Biobetters/Innovative Products
• Potentially “Buying” Capacity
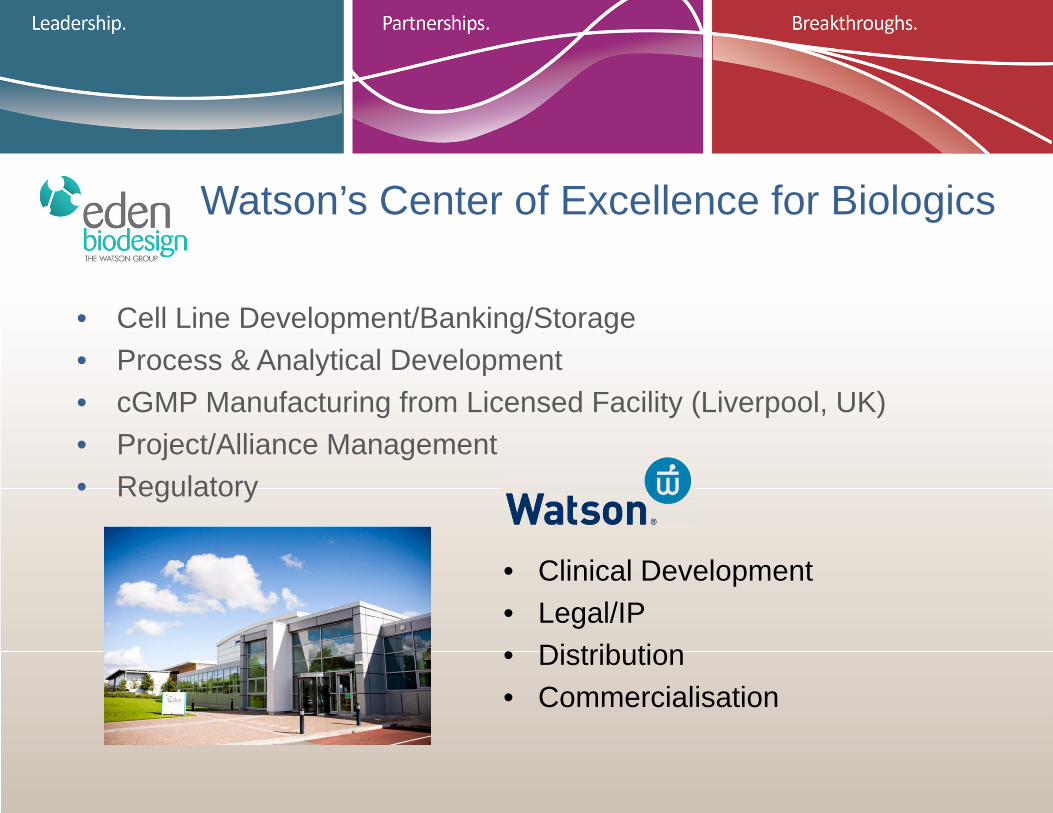
Watson’s Center of Excellence for Biologics
• Cell Line Development/Banking/Storage• Process & Analytical Development• cGMP Manufacturing from Licensed Facility (Liverpool, UK)• Project/Alliance Management• Regulatory
• Clinical Development• Legal/IP• Distribution• Commercialisation

Capacity Planning Options• Build Capacity• Buy Capacity• Partner• Outsource
• Traditional CMO • Excess Capacity Provider
………………..Historically and currently a “volatile” marketplace

Change and Consolidation in the CMO & “Excess Capacity” Space• A “tough market” in recent years
Out of Business
• Fewer “standalone” independent CMOs
• Consolidation & change

“Excess Capacity Players”
• Clinical failures & pipeline uncertainty mean that “excess capacity” can become available because of “over build”, but the world changes quickly!
Offered capacity but now needed for internal projects
Still offer contract manufacturing services
Freemont facility to Boehringer Ingelheim…………… ?
The Potential Impact of Biosimilars
• Huge current international interest in biosimilars• Improving EU market and potential US market opening• Many products currently in development
• Significant investment in cGMP manufacturing infrastructure by biosimilar players• India, China, Korea, Eastern Europe• E.g. 2009 Samsung announcement of $389 million investment in biosimilars
and 2011 announcement of $266 million partnership with Quintiles Transnational to develop biomanufacturing infrastructure that will be offered on a contract basis (30,000L of cell culture capacity planned).
But……• Rumors of Celltrion pulling out of contract manufacturing space to focus on
biosimilar portfolio (partnered with Hospira)
Biosimilar Impact….. Supply or Demand?
• How many biosimilar products will make it to market in highly regulated markets and what will penetration be?• Improved productivity over innovator targets?• Demand = only a percentage of innovator capacity requirements• Essentially “replacement capacity” – may even free-up capacity at innovator?
• Likely biosimilar major players (presumably) have capacity secured • E.g. Sandoz (in-house); Teva/Lonza; Hospira/Celltrion; Pfizer? Merck?
• Will facilities currently being built by global biosimilar players become broadly available?• Designed for supply to highly regulated markets or to serve domestic markets?• Appropriate quality standards?• Success of biosimilar portfolio?• Made available to third parties?

Observations For Discussion• Clinical scale cGMP capacity remains “broadly available” via CMOs
• Availability of disposable technologies; platform processes and a maturing pool of expertise makes in-house cGMP infrastructure investment more attractive
• Large scale capacity remains available from CMO majors, who continue to make market-driven investment in manufacturing infrastructure• E.g. Lonza, Boehringer Ingelheim
• “Excess capacity providers” continue to make capacity available• But careful long term planning required to ensure future and long-term availability. • May require unconventional relationships to secure capacity over the long term.• Improving process titers may continue to “release” capacity
• Significant international investments in cGMP infrastructure (esp. in Asia) –driven, in part, by biosimilars. Impact to be determined……
• Will it become available?• Appropriate quality for highly regulated markets?

The Biomanufacturing Capacity Conundrum: How to Manage Uncertainty of Manufacturing Demand
Parrish M. GalliherXcellerex. Inc.
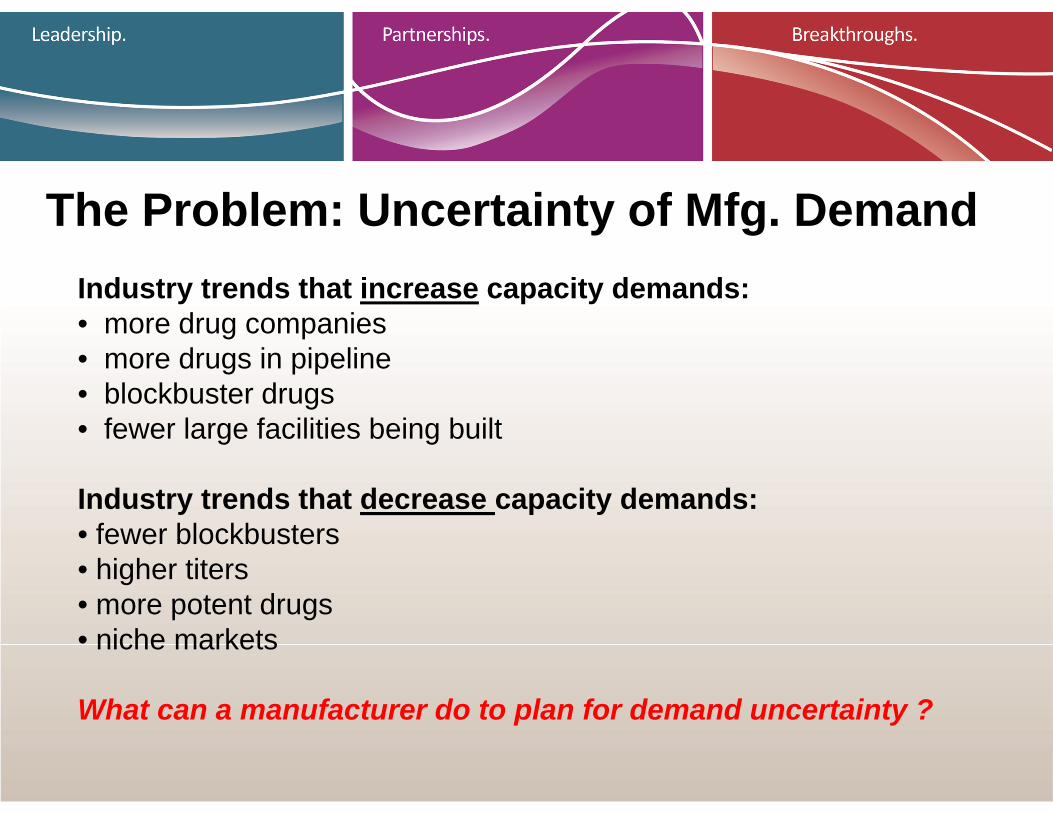
The Problem: Uncertainty of Mfg. DemandIndustry trends that increase capacity demands:• more drug companies• more drugs in pipeline• blockbuster drugs• fewer large facilities being built
Industry trends that decrease capacity demands:• fewer blockbusters• higher titers• more potent drugs• niche markets
What can a manufacturer do to plan for demand uncertainty ?

Future Kg demand/Biologic is decreasing:single use becomes commercial scale
Time
Man
ufac
turin
g Sc
ale
Smaller markets Improved
potencyImprovingtiter / yields
Single Use Scale
Stainless steel scale
2000L
20,000L
20L
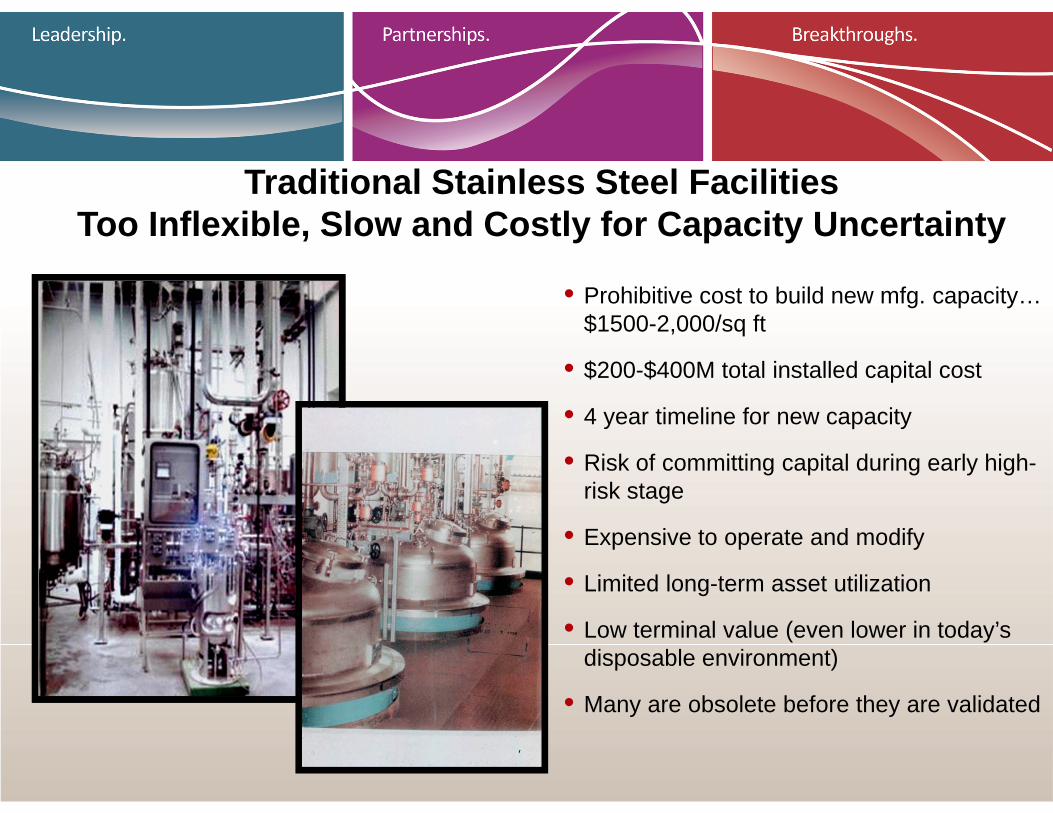
Traditional Stainless Steel Facilities Too Inflexible, Slow and Costly for Capacity Uncertainty
• Prohibitive cost to build new mfg. capacity… $1500-2,000/sq ft
• $200-$400M total installed capital cost
• 4 year timeline for new capacity
• Risk of committing capital during early high-risk stage
• Expensive to operate and modify
• Limited long-term asset utilization
• Low terminal value (even lower in today’s disposable environment)
• Many are obsolete before they are validated

Previous Drivers for Drug Development Ignored Capacity Uncertainty
ScheduleCost
Quality

New Drivers for Capacity Uncertainty
Speed
Flexibility
- Higher titers- More potent drugs- Excess capacity
Asian competitionBiosimilars
- 90% drugs fail in clinic- Fewer blockbusters- Consolidation
Quality
Cost
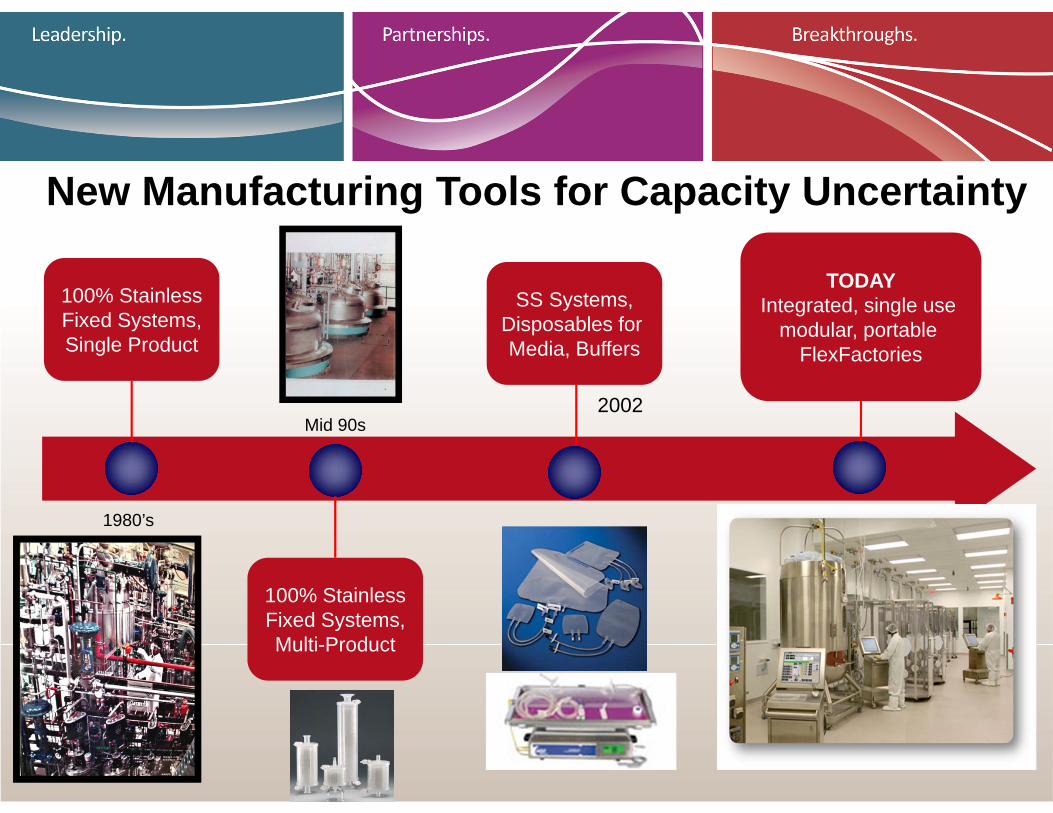
100% StainlessFixed Systems,Single Product
New Manufacturing Tools for Capacity Uncertainty
1980’s
100% StainlessFixed Systems,Multi-Product
Mid 90s
TODAYIntegrated, single use
modular, portable FlexFactories
SS Systems,Disposables for Media, Buffers
2002

Many Flexible, Proven Single Use Components

Reductions in:
• Cleaning
• Sterilization
• Engineering cost
• Equipment lead time
• Utility requirements
• Validation
• Quality / Regulatory burden
• Space
• Labor
• Waste generation
Single Use Speed and Flexibility: A Solution for Capacity Uncertainty
Lead to
Improvements in:
• 50% reduced facility build out time
• Much faster setup time
• Turnaround cycle time in hours
• Multi-product flexibility
• 20% reduced capital
• 15% reduced COGs
• 20% reduction in plant footprint
• Quality – eliminate cross contamination
• > 55% reduced environmental impact
• Media storage bags
• Media mixers
• Small seed train bioreactors
• Midscale production reactors – 2000L
• Sensors – dissolved O2, pressure, pH, temperature
• Tubing welders / connectors / sealers
• Integrating stainless and disposables connectors
Established Upstream Single Use Technologies
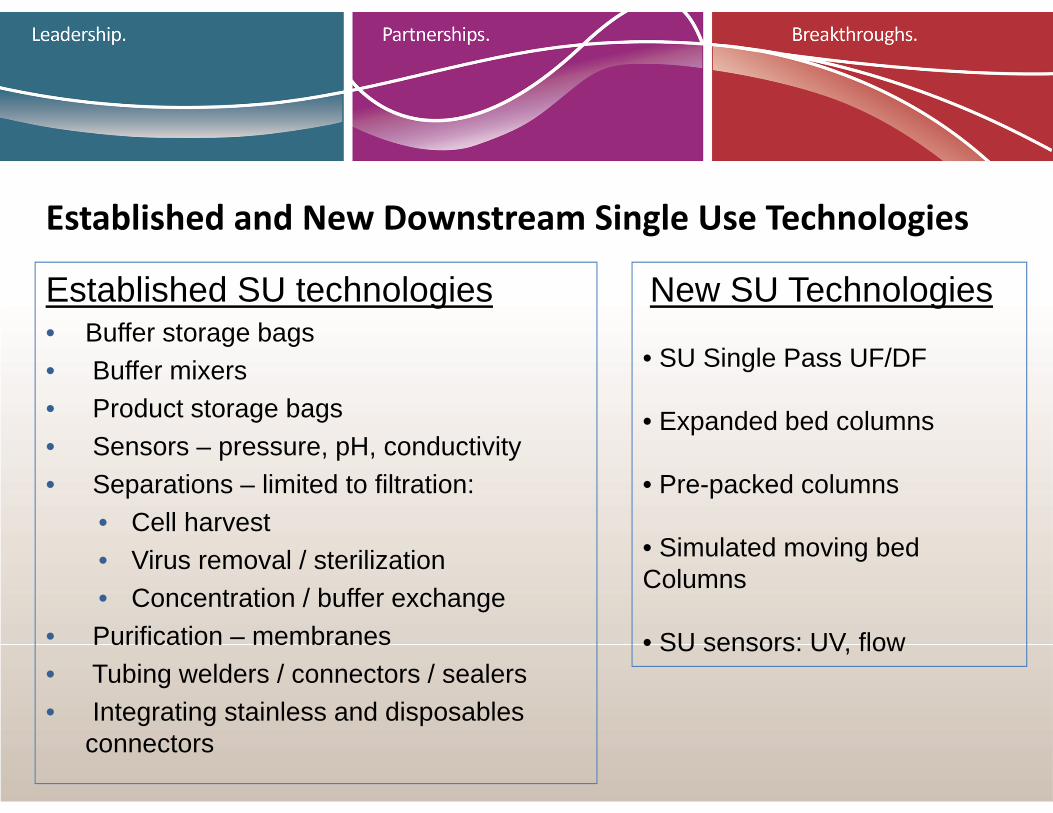
Established and New Downstream Single Use Technologies
Established SU technologies• Buffer storage bags• Buffer mixers• Product storage bags• Sensors – pressure, pH, conductivity• Separations – limited to filtration:
• Cell harvest• Virus removal / sterilization• Concentration / buffer exchange
• Purification – membranes • Tubing welders / connectors / sealers• Integrating stainless and disposables
connectors
New SU Technologies
• SU Single Pass UF/DF
• Expanded bed columns
• Pre-packed columns
• Simulated moving bedColumns
• SU sensors: UV, flow
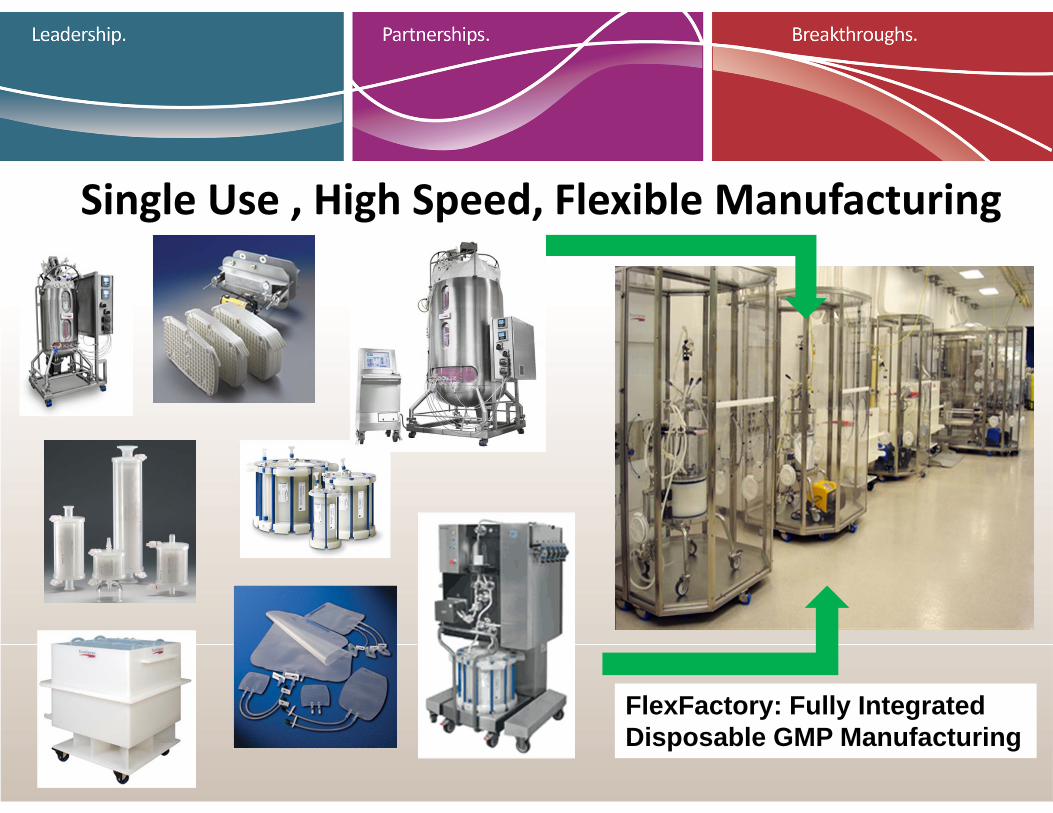
Single Use , High Speed, Flexible Manufacturing
FlexFactory: Fully IntegratedDisposable GMP Manufacturing
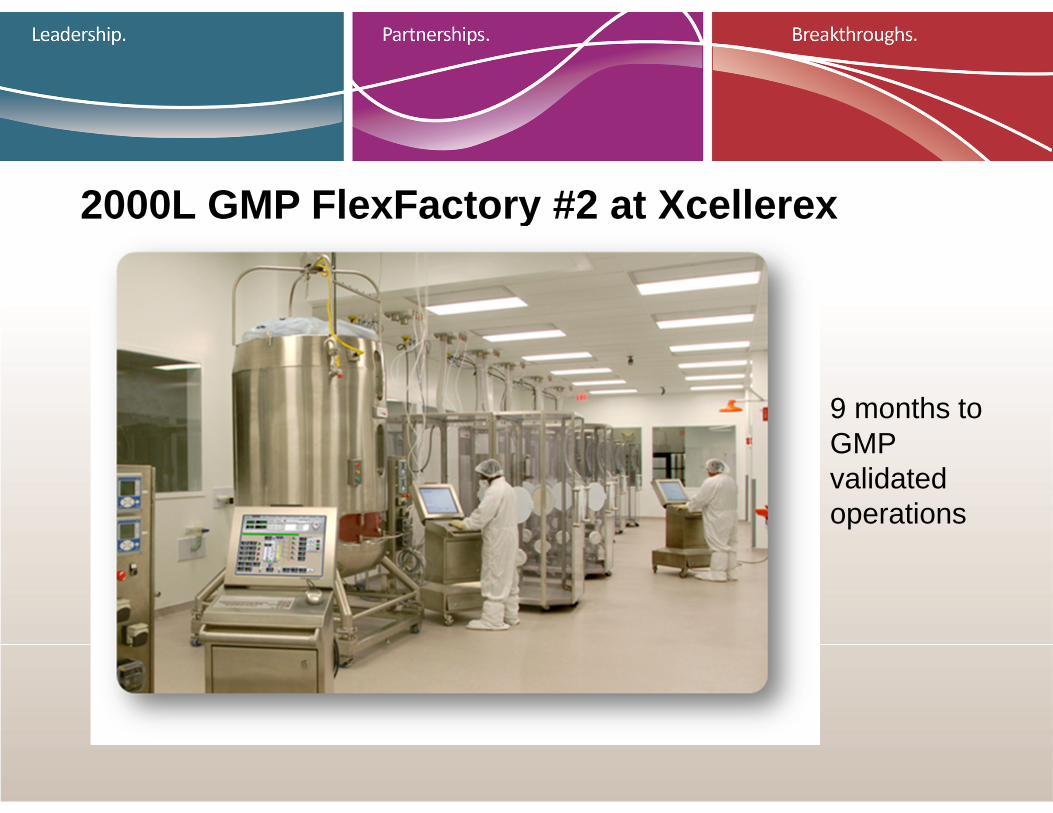
2000L GMP FlexFactory #2 at Xcellerex
9 months to GMP validated operations