the aquaculture genetics and breeding technology’s oyster ... · the oyster breeding program in...
TRANSCRIPT
The Aquaculture Genetics
and Breeding Technology’s
Oyster Breeding Program
Table of Contents
Preface . . . . . . . . . . . . . . . . . . . . . . . . . . . . . . . . . . . . . . . . . . . . . . . . . . . . . . . . . . . . . . . . . . . . . . . . . . . . 1
Introduction . . . . . . . . . . . . . . . . . . . . . . . . . . . . . . . . . . . . . . . . . . . . . . . . . . . . . . . . . . . . . . . . . . . . . . . . 2
A TROIKA OF APPROACHES Line Breeding Line testing up to 2008 . . . . . . . . . . . . . . . . . . . . . . . . . . . . . . . . . . . . . . . . . . . . . . . . . . . . . . . . . . 3 New strategy: 2008 . . . . . . . . . . . . . . . . . . . . . . . . . . . . . . . . . . . . . . . . . . . . . . . . . . . . . . . . . . . . . 3 New genetic material . . . . . . . . . . . . . . . . . . . . . . . . . . . . . . . . . . . . . . . . . . . . . . . . . . . . . . . . . . . 6 Family Breeding . . . . . . . . . . . . . . . . . . . . . . . . . . . . . . . . . . . . . . . . . . . . . . . . . . . . . . . . . . . . . . . . . . . . 7 Polyploidy . . . . . . . . . . . . . . . . . . . . . . . . . . . . . . . . . . . . . . . . . . . . . . . . . . . . . . . . . . . . . . . . . . . . . . . . . 8
EVIDENCE FOR IMPROVED PERFORMANCE
Line Breeding . . . . . . . . . . . . . . . . . . . . . . . . . . . . . . . . . . . . . . . . . . . . . . . . . . . . . . . . . . . . . . . . . . . . . . 10Family Breeding . . . . . . . . . . . . . . . . . . . . . . . . . . . . . . . . . . . . . . . . . . . . . . . . . . . . . . . . . . . . . . . . . . . . 12Triploidy – the spawnless advantage . . . . . . . . . . . . . . . . . . . . . . . . . . . . . . . . . . . . . . . . . . . . . . . . . . . . 13
BROOD STOCK RECOMMENDATIONS
Diploids – selected lines . . . . . . . . . . . . . . . . . . . . . . . . . . . . . . . . . . . . . . . . . . . . . . . . . . . . . . . . . . . . . . 15Triploids . . . . . . . . . . . . . . . . . . . . . . . . . . . . . . . . . . . . . . . . . . . . . . . . . . . . . . . . . . . . . . . . . . . . . . . . . . 16
BROOD STOCK DISTRIBUTION
Brood stock – lines . . . . . . . . . . . . . . . . . . . . . . . . . . . . . . . . . . . . . . . . . . . . . . . . . . . . . . . . . . . . . . . . . . 18Brood stock – tetraploids Distribution . . . . . . . . . . . . . . . . . . . . . . . . . . . . . . . . . . . . . . . . . . . . . . . . . . . . . . . . . . . . . . . . . . 19 Certification . . . . . . . . . . . . . . . . . . . . . . . . . . . . . . . . . . . . . . . . . . . . . . . . . . . . . . . . . . . . . . . . . . 21 Sampling . . . . . . . . . . . . . . . . . . . . . . . . . . . . . . . . . . . . . . . . . . . . . . . . . . . . . . . . . . . . . . . . . . . . 21
INTELLECTUAL PROPERTY AND LICENSING
Disease resistant lines . . . . . . . . . . . . . . . . . . . . . . . . . . . . . . . . . . . . . . . . . . . . . . . . . . . . . . . . . . . . . . . . 23Tetraploids . . . . . . . . . . . . . . . . . . . . . . . . . . . . . . . . . . . . . . . . . . . . . . . . . . . . . . . . . . . . . . . . . . . . . . . . . 24
FUTURE DIRECTIONS . . . . . . . . . . . . . . . . . . . . . . . . . . . . . . . . . . . . . . . . . . . . . . . . . . . . . . . . . . . . . 25
We originally intended to try to produce a brood stock “catalogue,” much like you would find for flowers or vegetable seeds or commercial crops . However, it turned into its current form largely because of a change in strategy that we began to adopt in 2008 . Essentially, the 15 or so oyster lines that were originally to be offered in the “catalogue” have been compressed to a strategic few . The story of how we got there seemed important, and so it is included in this document . All references to oyster refers to the Eastern oyster, Crassostrea virginica.
Originally meant to be a bulletin a page or two long, it quickly turned into a four-pager, then an eight-pager, and then larger until we began to call it our manifesto . Call it what you like, this document now contains a fairly complete summary of our program . It is the first such document since our inception that puts all the pieces together and signals our intentions for the future . The future, of course, is the continuing development of oyster aquaculture in Virginia, the Bay, and perhaps the region, spurred by highly improved
brood stock that accumulate improvements over time . Hopefully, with them the “bottom line” will improve as well .
The content of our program was the subject of a workshop held at VIMS on January 10, 2009: “Workshop on Oyster Breeding, Brood Stock Supply and Hatchery Development .” This meeting was primarily about ABC, but it was clear that an annual workshop of that sort – between ABC and industry – would be useful to 1) convey progress from generation to generation, 2) refine breeding goals, 3) exchange information about needed research emphases, and more . Look for an annual workshop in January each year .
The work described here could not be done without the dedicated employees, students, and volunteers of ABC . Our current employees are listed at right, but the list of past associates is much longer . For the purpose of “authorship” of this document, it should be cited ABC, 2009 .
Preface
Stan Allen
Director ABC
Katie Blackshear
Lab technician
Brian Callam
Field Technician
Amanda Chesler
Algal technician
Linda Crewe
Field manager (>2n)
Anu Frank-Lawale
Research Assistant Professor
Nate Geyerhahn
Field manager (brood stock)
Karen Hudson
Research coordinator
Adeline Lange
Field manager (research)
Debbrah Pelata
Business manager
Kate Ritter
Hatchery technician
Karen Sisler
Hatchery manager
Liz Walker
KAC manager
1
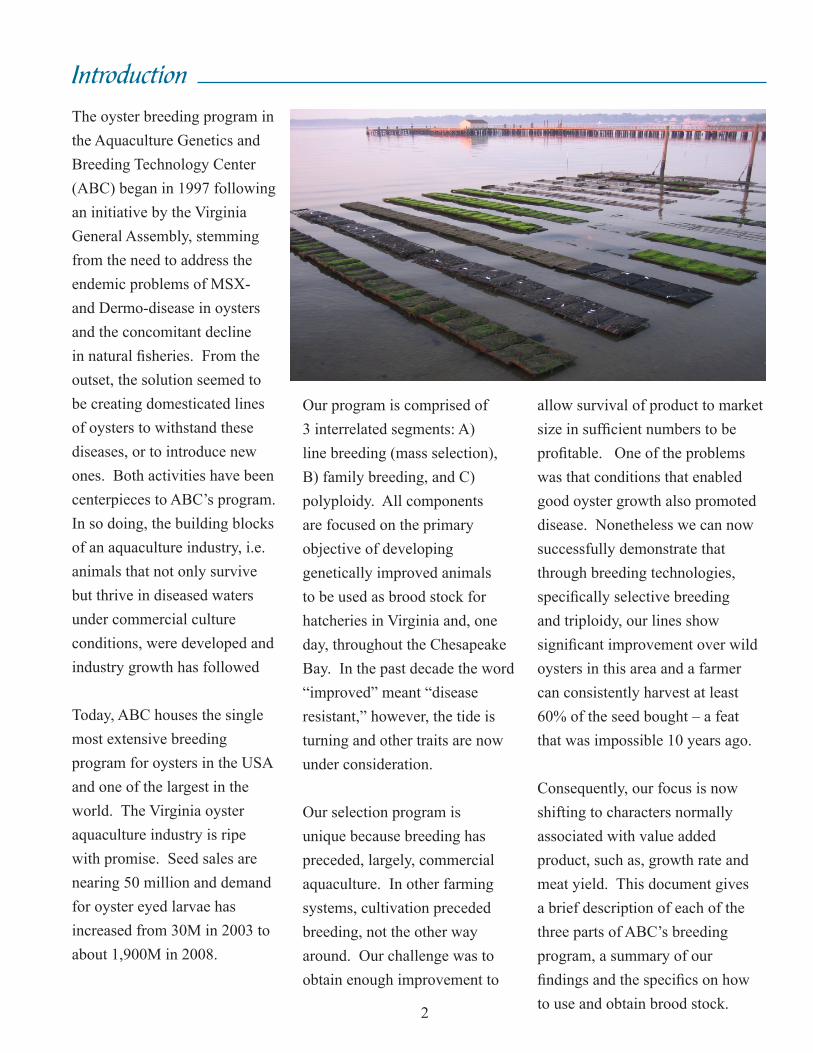
The oyster breeding program in the Aquaculture Genetics and Breeding Technology Center (ABC) began in 1997 following an initiative by the Virginia General Assembly, stemming from the need to address the endemic problems of MSX- and Dermo-disease in oysters and the concomitant decline in natural fisheries . From the outset, the solution seemed to be creating domesticated lines of oysters to withstand these diseases, or to introduce new ones . Both activities have been centerpieces to ABC’s program . In so doing, the building blocks of an aquaculture industry, i .e . animals that not only survive but thrive in diseased waters under commercial culture conditions, were developed and industry growth has followed
Today, ABC houses the single most extensive breeding program for oysters in the USA and one of the largest in the world . The Virginia oyster aquaculture industry is ripe with promise . Seed sales are nearing 50 million and demand for oyster eyed larvae has increased from 30M in 2003 to about 1,900M in 2008 .
Our program is comprised of 3 interrelated segments: A) line breeding (mass selection), B) family breeding, and C) polyploidy . All components are focused on the primary objective of developing genetically improved animals to be used as brood stock for hatcheries in Virginia and, one day, throughout the Chesapeake Bay . In the past decade the word “improved” meant “disease resistant,” however, the tide is turning and other traits are now under consideration .
Our selection program is unique because breeding has preceded, largely, commercial aquaculture . In other farming systems, cultivation preceded breeding, not the other way around . Our challenge was to obtain enough improvement to
allow survival of product to market size in sufficient numbers to be profitable . One of the problems was that conditions that enabled good oyster growth also promoted disease . Nonetheless we can now successfully demonstrate that through breeding technologies, specifically selective breeding and triploidy, our lines show significant improvement over wild oysters in this area and a farmer can consistently harvest at least 60% of the seed bought – a feat that was impossible 10 years ago .
Consequently, our focus is now shifting to characters normally associated with value added product, such as, growth rate and meat yield . This document gives a brief description of each of the three parts of ABC’s breeding program, a summary of our findings and the specifics on how to use and obtain brood stock .
Introduction
2
We define a “line” as a small population of oysters which receive no new individuals from the outside . Consequently, this “closed” population is continually under the influence of our selective breeding, because we take the best individuals from that population as parents for the next generation . You can roughly equate a “line” with a “variety” of farm crop or “breed” of animal .
The line development program at ABC started in 1998 with two test lines: DBY and CROSBreed (XB) . In the years leading up to 2006 the total number of lines increased from these two to fifteen, partly through the introduction of animals from Louisiana . These imports were crossed with our existing lines as well as wild Virginia oysters . The Louisiana oysters were incorporated because of
their demonstrated resistance to Dermo-disease – research done at ABC a number of years ago .
We first concentrated on disease resistance . For this, we grew lines in the field for more than two years and evaluated cumulative survival . Each new generation of a line was propagated by selecting survivors . Due to the fact that disease pressure is influenced by salinity, we expanded our line testing program in 2004 to include high, medium, low, and seaside sites . We observed that line performance was not consistent across all sites . The best line, in a low salinity site where disease pressure is low (e .g ., Kinsale), was not the same as in a medium salinity site (e .g ., York River) where we have the highest disease pressure, or on the seaside, where disease exposure is variable . We have concluded that it is
Line BreedingLine testing up to 2008
A Troika of Approaches
appropriate to concentrate selection in certain “growing zones” best categorized by the following:
• Low salinity (8-15 ppt), low or intermittent disease pressure, e .g ., Kinsale .
• Medium salinity (17-25 ppt), high consistent disease pressure, e .g ., York and Lynnhaven .
• Seaside with high salinity (28-35 ppt), intermittent disease pressure, e .g ., Chincoteague .
• As a result of our line testing program from 1998-2006, we ended up with multiple lines, selected regionally for survival . All lines, however, are derived from three basic sources: DBY, XB, and Louisiana (LA) . These formed the base of our new strategy started in 2008 .
The new strategy
Our new breeding strategy builds on the progress to date, and invokes the principles of animal breeding that have served agriculture so well . Basically, we
are collapsing our multiple lines into three major ones deriving from base populations of DBY, XB, or LA . A complete listing of the starting germ plasm for
these three major lines is shown in Table 1 .
3
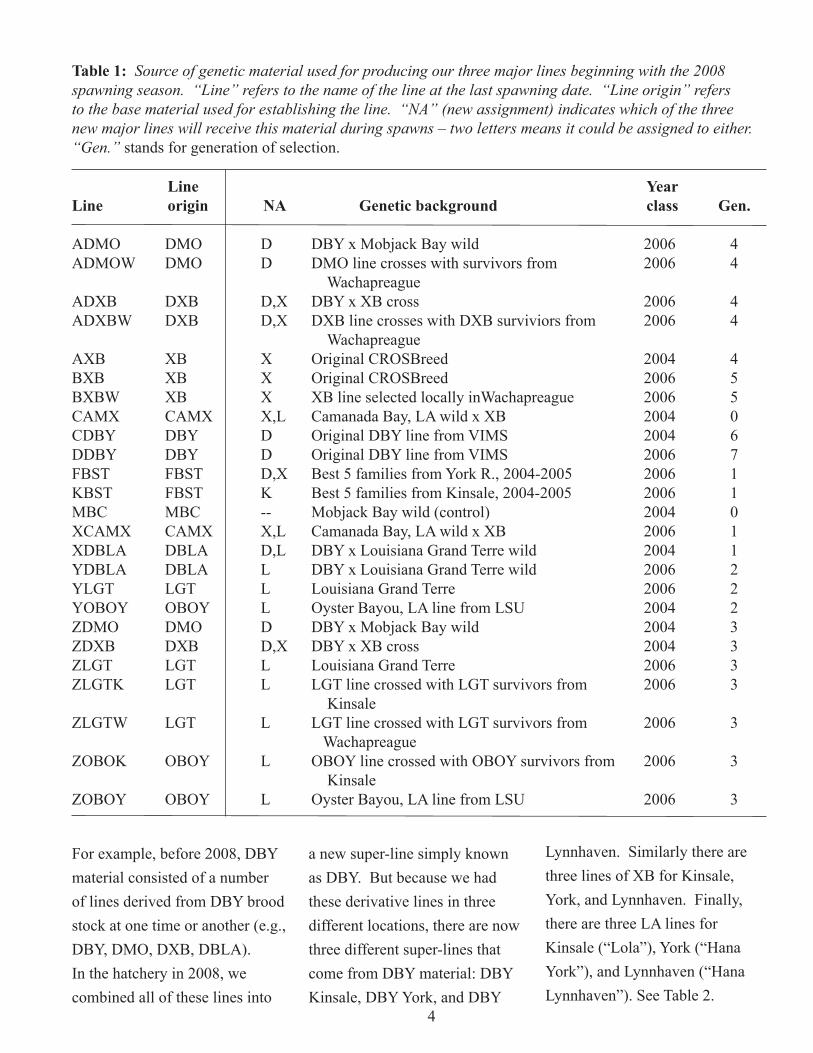
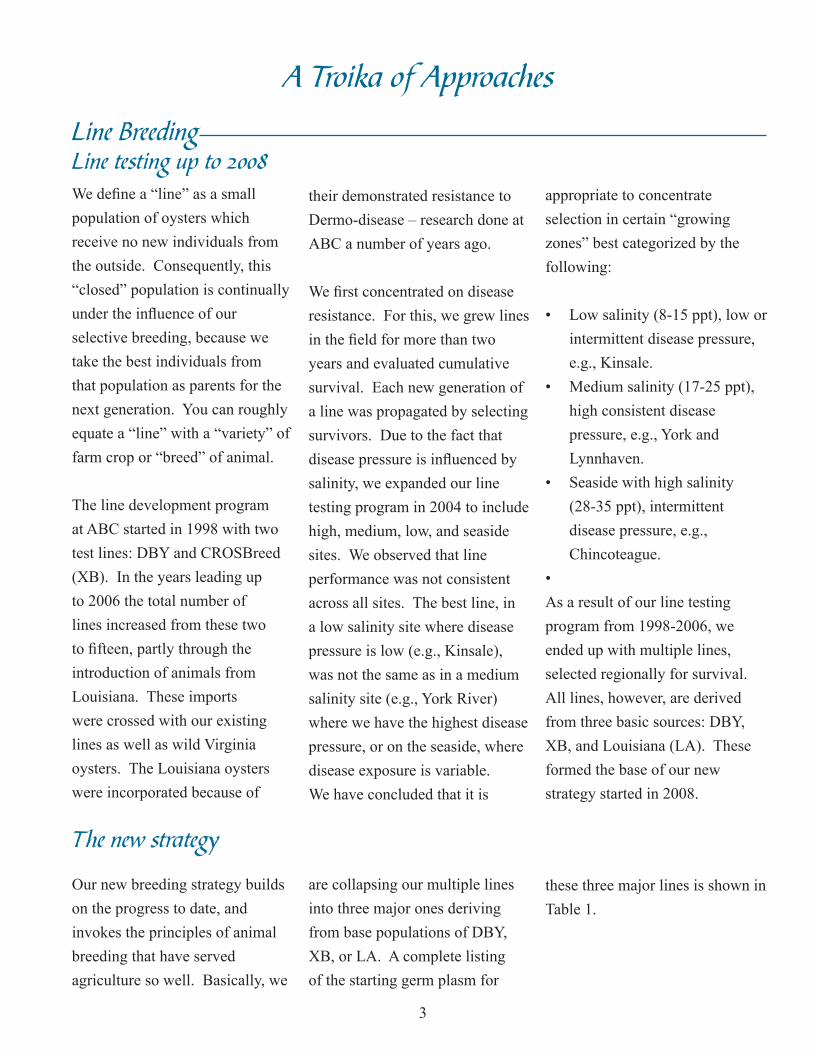
Table 1: Source of genetic material used for producing our three major lines beginning with the 2008 spawning season. “Line” refers to the name of the line at the last spawning date. “Line origin” refers to the base material used for establishing the line. “NA” (new assignment) indicates which of the three new major lines will receive this material during spawns – two letters means it could be assigned to either. “Gen.” stands for generation of selection .
Line Year Line origin NA Genetic background class Gen. ADMO DMO D DBY x Mobjack Bay wild 2006 4ADMOW DMO D DMO line crosses with survivors from 2006 4 WachapreagueADXB DXB D,X DBY x XB cross 2006 4ADXBW DXB D,X DXB line crosses with DXB surviviors from 2006 4 WachapreagueAXB XB X Original CROSBreed 2004 4BXB XB X Original CROSBreed 2006 5BXBW XB X XB line selected locally inWachapreague 2006 5CAMX CAMX X,L Camanada Bay, LA wild x XB 2004 0CDBY DBY D Original DBY line from VIMS 2004 6DDBY DBY D Original DBY line from VIMS 2006 7FBST FBST D,X Best 5 families from York R ., 2004-2005 2006 1KBST FBST K Best 5 families from Kinsale, 2004-2005 2006 1MBC MBC -- Mobjack Bay wild (control) 2004 0XCAMX CAMX X,L Camanada Bay, LA wild x XB 2006 1XDBLA DBLA D,L DBY x Louisiana Grand Terre wild 2004 1YDBLA DBLA L DBY x Louisiana Grand Terre wild 2006 2YLGT LGT L Louisiana Grand Terre 2006 2YOBOY OBOY L Oyster Bayou, LA line from LSU 2004 2ZDMO DMO D DBY x Mobjack Bay wild 2004 3ZDXB DXB D,X DBY x XB cross 2004 3ZLGT LGT L Louisiana Grand Terre 2006 3ZLGTK LGT L LGT line crossed with LGT survivors from 2006 3 KinsaleZLGTW LGT L LGT line crossed with LGT survivors from 2006 3 WachapreagueZOBOK OBOY L OBOY line crossed with OBOY survivors from 2006 3 KinsaleZOBOY OBOY L Oyster Bayou, LA line from LSU 2006 3
For example, before 2008, DBY material consisted of a number of lines derived from DBY brood stock at one time or another (e .g ., DBY, DMO, DXB, DBLA) . In the hatchery in 2008, we combined all of these lines into
a new super-line simply known as DBY . But because we had these derivative lines in three different locations, there are now three different super-lines that come from DBY material: DBY Kinsale, DBY York, and DBY
Lynnhaven . Similarly there are three lines of XB for Kinsale, York, and Lynnhaven . Finally, there are three LA lines for Kinsale (“Lola”), York (“Hana York”), and Lynnhaven (“Hana Lynnhaven”) . See Table 2 .
4
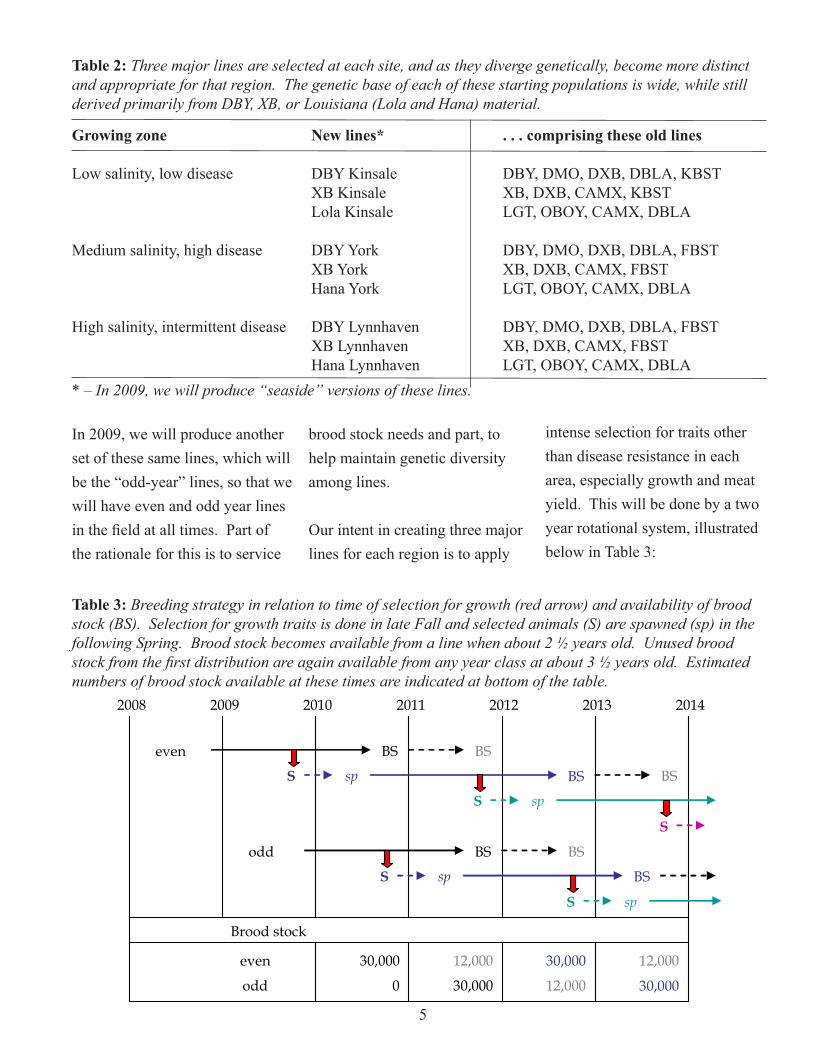
Table 2: Three major lines are selected at each site, and as they diverge genetically, become more distinct and appropriate for that region. The genetic base of each of these starting populations is wide, while still derived primarily from DBY, XB, or Louisiana (Lola and Hana) material.
Growing zone New lines* . . . comprising these old lines Low salinity, low disease DBY Kinsale DBY, DMO, DXB, DBLA, KBST XB Kinsale XB, DXB, CAMX, KBST Lola Kinsale LGT, OBOY, CAMX, DBLA
Medium salinity, high disease DBY York DBY, DMO, DXB, DBLA, FBST XB York XB, DXB, CAMX, FBST Hana York LGT, OBOY, CAMX, DBLA
High salinity, intermittent disease DBY Lynnhaven DBY, DMO, DXB, DBLA, FBST XB Lynnhaven XB, DXB, CAMX, FBST Hana Lynnhaven LGT, OBOY, CAMX, DBLA* – In 2009, we will produce “seaside” versions of these lines.
In 2009, we will produce another set of these same lines, which will be the “odd-year” lines, so that we will have even and odd year lines in the field at all times . Part of the rationale for this is to service
brood stock needs and part, to help maintain genetic diversity among lines .
Our intent in creating three major lines for each region is to apply
intense selection for traits other than disease resistance in each area, especially growth and meat yield . This will be done by a two year rotational system, illustrated below in Table 3:
Table 3: Breeding strategy in relation to time of selection for growth (red arrow) and availability of brood stock (BS). Selection for growth traits is done in late Fall and selected animals (S) are spawned (sp) in the following Spring. Brood stock becomes available from a line when about 2 ½ years old. Unused brood stock from the first distribution are again available from any year class at about 3 ½ years old. Estimated numbers of brood stock available at these times are indicated at bottom of the table.
Brood stock
odd
even
0
30,000
30,000
12,000
12,000
30,000
30,000
12,000
2008 2009 2010 2011 2012 2013 2014
even BS
S sp BS
BS
S sp
S
BS
odd BS
S sp BS
BS
S sp
5
We will have even and odd year lines, both of which have genetic contributions from the nine regional lines listed in the Table 2 above . Spawns are done in late Spring and selection for growth is accomplished in late Fall, about 18 months later (Table 3) . These highly selected individuals then become the brood stock
for spawning in the following Spring that gives rise to the next generation of the selected line .
The remainder of a year class, after selection, is available as brood stock for the industry . Because each year class of a line will contain upwards of 30,000 oysters, and we only need to
select about 1,000 for the next generation, there should be ample brood stock for distribution (Figure 1) . The brood stock then will be obtained from the upper 2/3 of the selected population, reflecting the genetic gains achieved in succeeding generations .
Figure 1: The distribution of sizes of oysters in a generation produces roughly a normal distribution (left). From that population, ABC will select the top performers (red), leaving the bulk of the population. Those oysters clustered about the mean, which should be better performers than the previous generation, will be distributed as brood stock and the lower end of the distribution, discarded.
In 2007, we collected wild brood stock from five rivers systems in the Virginia portion of the Chesapeake Bay: Rappahanock River, Great Wicomico River, Mobjack Bay, York River, and James River . Some of these populations have shown evidence of obtaining natural disease resistance (VIMS Shellfish Pathology Lab), and some not . More importantly, these wild populations contain genes yet exploited for breeding . We spawned each of these groups to form the first wild generation of seed for testing, but also to develop new lines . These new lines then will be a source
of future new genetic material themselves, or by crossing them into the already selected lines . In this way, we are assuring genetic variation for the future .
New genetic material
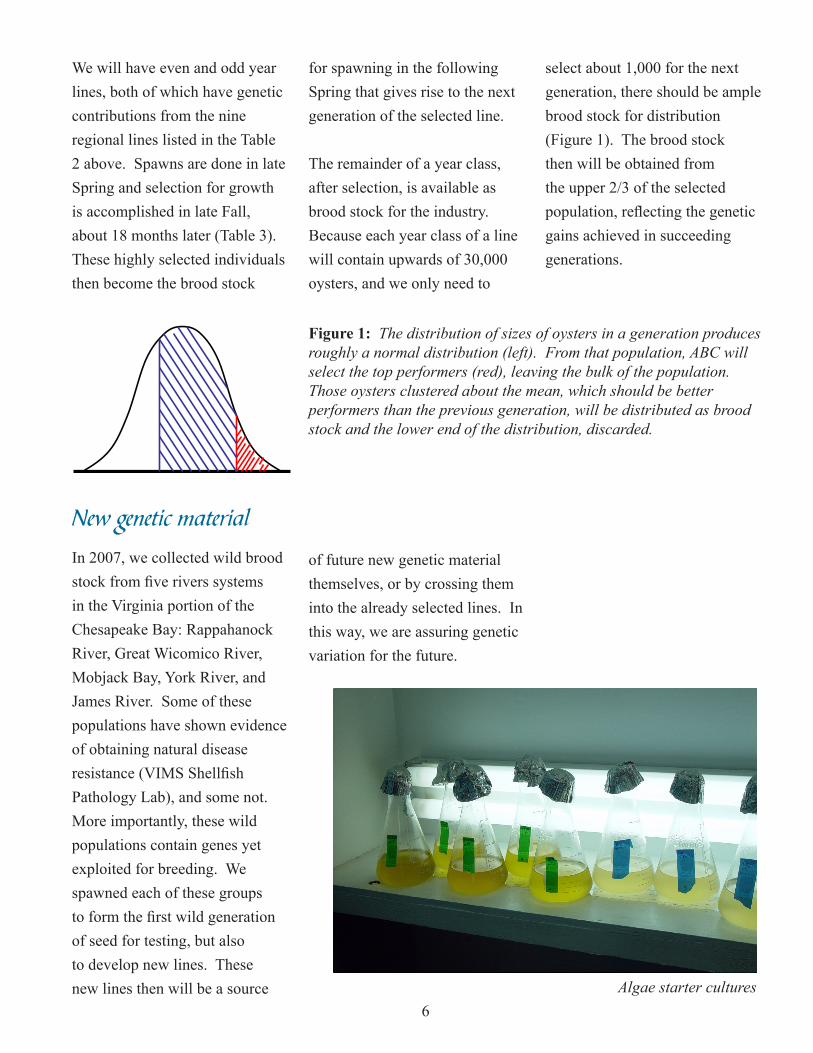
Algae starter cultures6
A family is produced by mating of one female with one male to create a group of individuals that share approximately half of all their genes, in various combinations (i .e ., your siblings don’t look exactly alike) . Because oysters have high fecundity, we can obtain many individuals from one mating . The fact that they are related allows us to obtain information about how strongly commercial traits are controlled by their genes and the relationships among these traits, information not available in mass selection (for lines, above) . Conversely, it allows us to determine which traits are not genetically influenced, which is important because it may lead to clues about how to manipulate the culture environment to obtain additional performance . Larval performance is a good example . Are early setters better oysters, and can grow out benefit from manipulation of larval setting, or is this simply a genetic trait with no relationship to later grow out? In short, with our families we are learning which traits we can improve, how to select for them and how to improve the structure and
management practices of our line breeding program to optimise genetic gain while maintaining genetic variation .
To date we have deployed 4 year classes (2004, 2005, 2006, and 2007), each with a minimum of 50 families . (A family consists of seed obtained by mating of a single male with a single female . A year-class is a set of families spawned at the same time in the same year and planted in the field together in a huge comparative test) . We started by deploying these year classes of families at two sites: Kinsale and York River . In 2007, we added another site, Lynnhaven . Initially, comparisons among families were centered on disease resistance .
We found strong evidence that, in Virginia, superior performance is dependant on where the animals are grown because the best families in Kinsale (low disease) are not the best families in York (high disease) . It was in fact these data that led us to alter our line breeding approach and adopt a site specific selection strategy where we focus on improving performance within salinity zones . Our data also indicates that there is significant potential for selection for “faster growth,” which will lend to significant improvements in commercial traits, such as, meat yield and time to market .
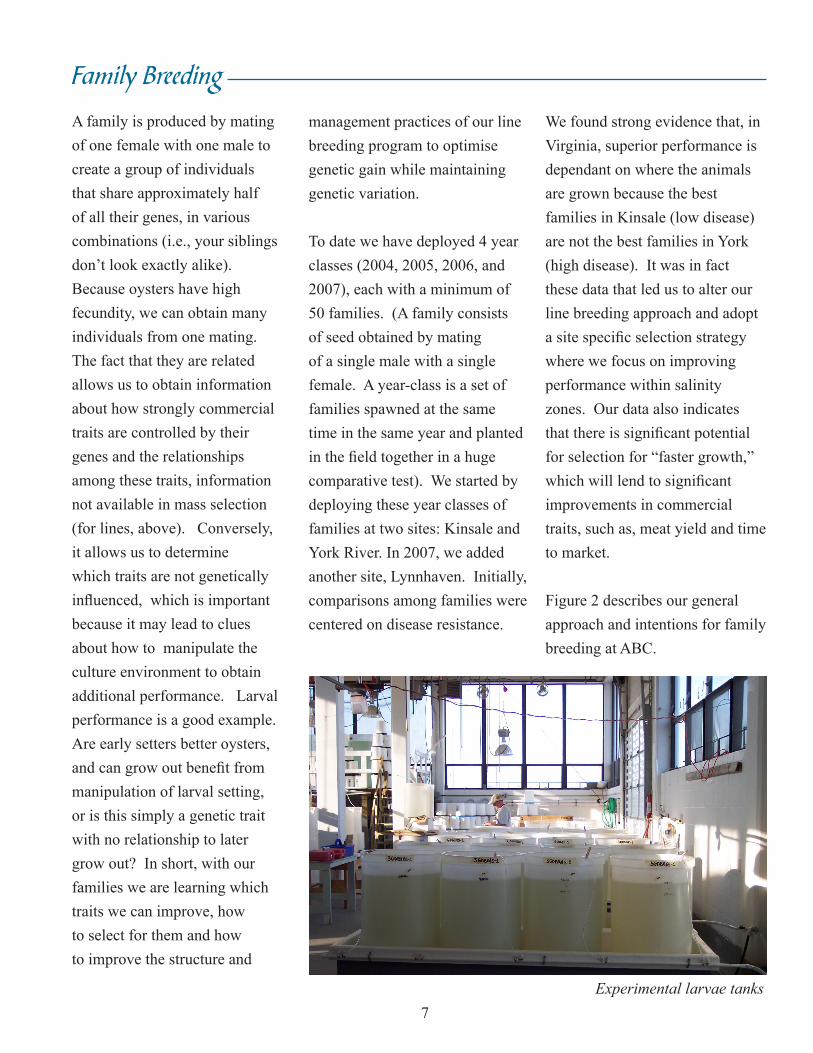
Figure 2 describes our general approach and intentions for family breeding at ABC .
Family Breeding
Experimental larvae tanks7
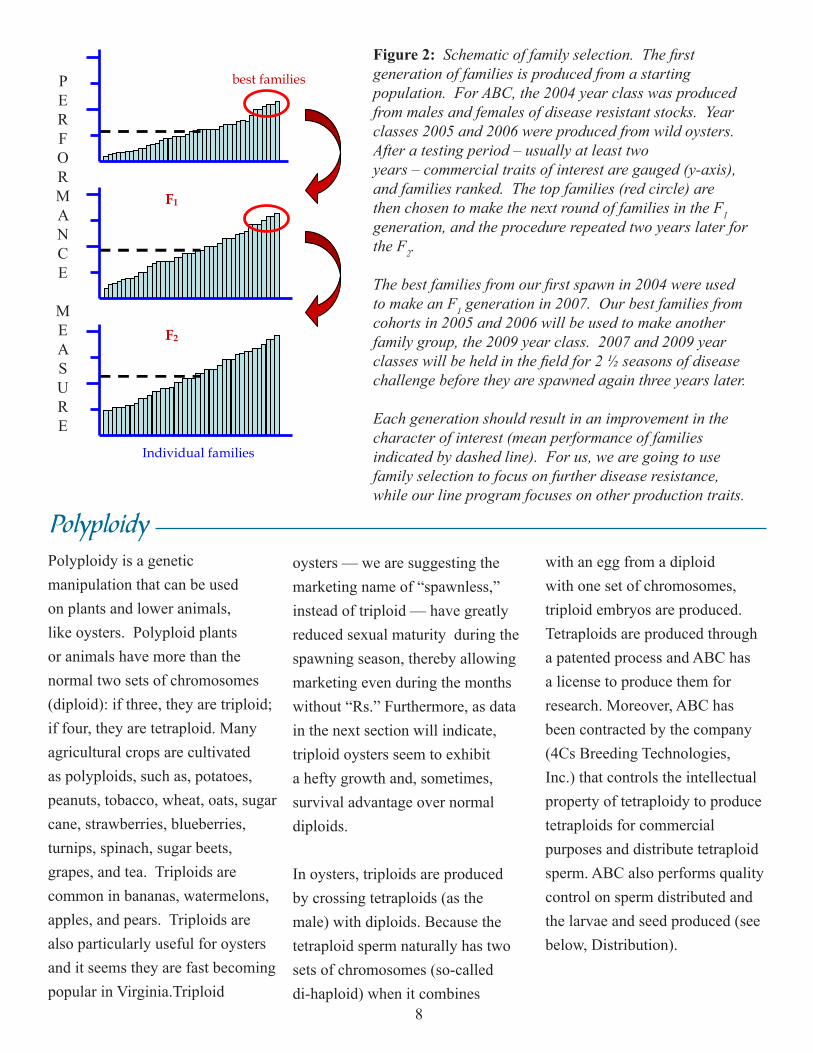
Figure 2: Schematic of family selection. The first generation of families is produced from a starting population. For ABC, the 2004 year class was produced from males and females of disease resistant stocks. Year classes 2005 and 2006 were produced from wild oysters. After a testing period – usually at least two years – commercial traits of interest are gauged (y-axis), and families ranked. The top families (red circle) are then chosen to make the next round of families in the F1 generation, and the procedure repeated two years later for the F2.
The best families from our first spawn in 2004 were used to make an F1 generation in 2007. Our best families from cohorts in 2005 and 2006 will be used to make another family group, the 2009 year class. 2007 and 2009 year classes will be held in the field for 2 ½ seasons of disease challenge before they are spawned again three years later.
Each generation should result in an improvement in the character of interest (mean performance of families indicated by dashed line). For us, we are going to use family selection to focus on further disease resistance, while our line program focuses on other production traits.
Individual families
best families
F1
F2
PERFORMANCE
MEASURE
PolyploidyPolyploidy is a genetic manipulation that can be used on plants and lower animals, like oysters . Polyploid plants or animals have more than the normal two sets of chromosomes (diploid): if three, they are triploid; if four, they are tetraploid . Many agricultural crops are cultivated as polyploids, such as, potatoes, peanuts, tobacco, wheat, oats, sugar cane, strawberries, blueberries, turnips, spinach, sugar beets, grapes, and tea . Triploids are common in bananas, watermelons, apples, and pears . Triploids are also particularly useful for oysters and it seems they are fast becoming popular in Virginia .Triploid
oysters — we are suggesting the marketing name of “spawnless,” instead of triploid — have greatly reduced sexual maturity during the spawning season, thereby allowing marketing even during the months without “Rs .” Furthermore, as data in the next section will indicate, triploid oysters seem to exhibit a hefty growth and, sometimes, survival advantage over normal diploids .
In oysters, triploids are produced by crossing tetraploids (as the male) with diploids . Because the tetraploid sperm naturally has two sets of chromosomes (so-called di-haploid) when it combines
with an egg from a diploid with one set of chromosomes, triploid embryos are produced . Tetraploids are produced through a patented process and ABC has a license to produce them for research . Moreover, ABC has been contracted by the company (4Cs Breeding Technologies, Inc .) that controls the intellectual property of tetraploidy to produce tetraploids for commercial purposes and distribute tetraploid sperm . ABC also performs quality control on sperm distributed and the larvae and seed produced (see below, Distribution) .
8
We believe that the potential for further improvements to triploid oysters is vast . Presently, we have focused on providing sufficient numbers of tetraploids to satisfy hatchery demand for triploid larvae and seed . But we have also begun
a major research project to further test the value of triploids . We will produce a number of lines of tetraploids, similar to having lines of diploids as described above . These lines will vary in their genetic origin and therefore,
perhaps, their traits when used to make triploids . Ultimately, we intend to test the breeding value of tetraploids by making combinations of crosses between tetraploids and diploids (see Figure 3) .
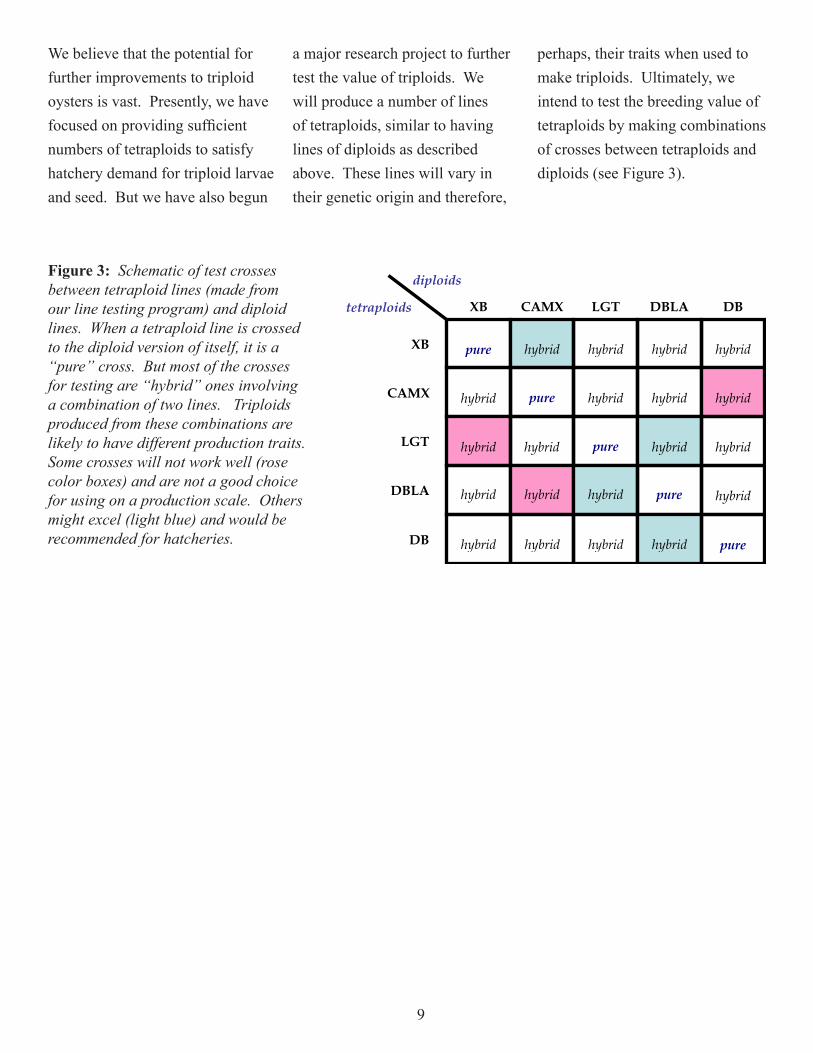
Figure 3: Schematic of test crosses between tetraploid lines (made from our line testing program) and diploid lines. When a tetraploid line is crossed to the diploid version of itself, it is a “pure” cross. But most of the crosses for testing are “hybrid” ones involving a combination of two lines. Triploids produced from these combinations are likely to have different production traits. Some crosses will not work well (rose color boxes) and are not a good choice for using on a production scale. Others might excel (light blue) and would be recommended for hatcheries.
diploids
tetraploids
XB
DB
CAMX
DBLA
LGT
XB CAMX LGT DBLA DB
pure
pure
pure
pure
pure hybrid hybrid hybrid hybrid
hybrid hybrid hybrid hybrid
hybrid hybrid hybrid
hybrid hybrid
hybrid
hybrid hybrid
hybrid hybrid hybrid
hybrid
9
Evidence for Improved Performance
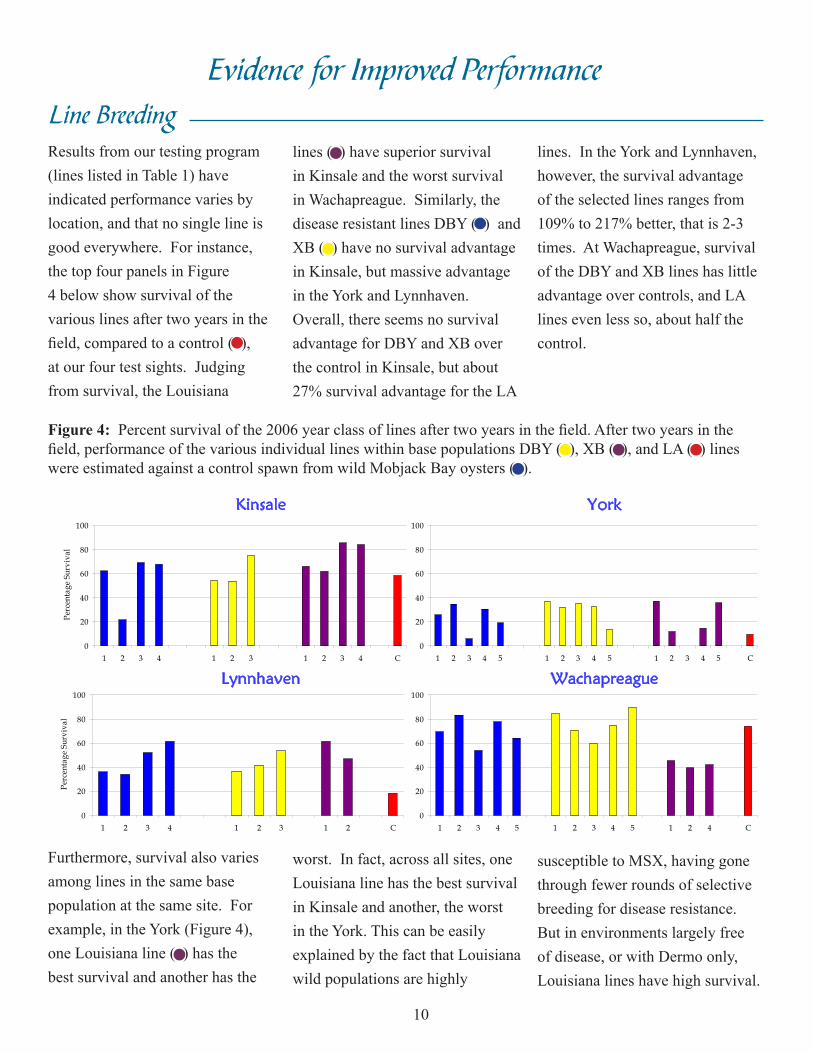
Results from our testing program (lines listed in Table 1) have indicated performance varies by location, and that no single line is good everywhere . For instance, the top four panels in Figure 4 below show survival of the various lines after two years in the field, compared to a control ( ), at our four test sights . Judging from survival, the Louisiana
lines ( ) have superior survival in Kinsale and the worst survival in Wachapreague . Similarly, the disease resistant lines DBY ( ) and XB ( ) have no survival advantage in Kinsale, but massive advantage in the York and Lynnhaven . Overall, there seems no survival advantage for DBY and XB over the control in Kinsale, but about 27% survival advantage for the LA
lines . In the York and Lynnhaven, however, the survival advantage of the selected lines ranges from 109% to 217% better, that is 2-3 times . At Wachapreague, survival of the DBY and XB lines has little advantage over controls, and LA lines even less so, about half the control .
Line Breeding
Figure 4: Percent survival of the 2006 year class of lines after two years in the field . After two years in the field, performance of the various individual lines within base populations DBY ( ), XB ( ), and LA ( ) lines were estimated against a control spawn from wild Mobjack Bay oysters ( ) .
worst . In fact, across all sites, one Louisiana line has the best survival in Kinsale and another, the worst in the York . This can be easily explained by the fact that Louisiana wild populations are highly
susceptible to MSX, having gone through fewer rounds of selective breeding for disease resistance . But in environments largely free of disease, or with Dermo only, Louisiana lines have high survival .
0
20
40
60
80
100
1 2 3 4 5 1 2 3 4 5 1 2 3 4 5 C
0
20
40
60
80
100
1 2 3 4 1 2 3 1 2 C
Perc
enta
ge S
urvi
val
0
20
40
60
80
100
1 2 3 4 5 1 2 3 4 5 1 2 4 C
Kinsale York
Lynnhaven Wachapreague
0
20
40
60
80
100
1 2 3 4 1 2 3 1 2 3 4 C
Perc
enta
ge S
urvi
val
Furthermore, survival also varies among lines in the same base population at the same site . For example, in the York (Figure 4), one Louisiana line ( ) has the best survival and another has the
10
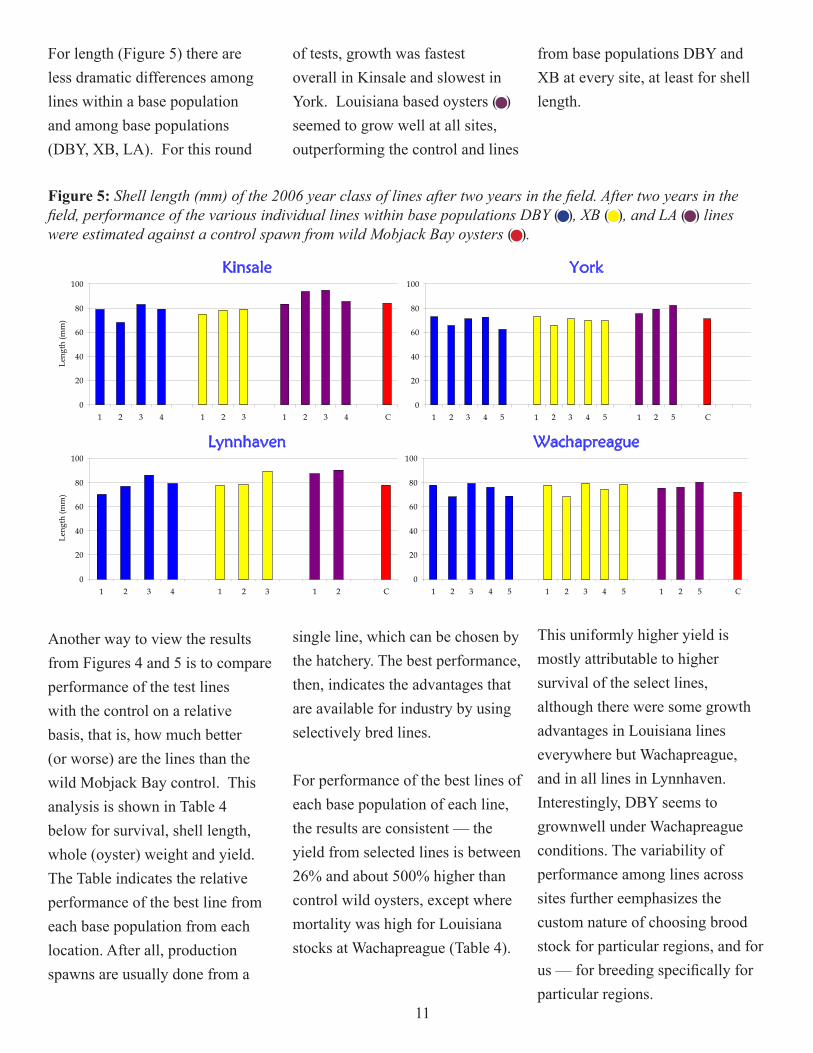
For length (Figure 5) there are less dramatic differences among lines within a base population and among base populations (DBY, XB, LA) . For this round
of tests, growth was fastest overall in Kinsale and slowest in York . Louisiana based oysters ( ) seemed to grow well at all sites, outperforming the control and lines
from base populations DBY and XB at every site, at least for shell length .
Figure 5: Shell length (mm) of the 2006 year class of lines after two years in the field. After two years in the field, performance of the various individual lines within base populations DBY ( ), XB ( ), and LA ( ) lines were estimated against a control spawn from wild Mobjack Bay oysters ( ).
York
0
20
40
60
80
100
1 2 3 4 5 1 2 3 4 5 1 2 5 C
0
20
40
60
80
100
1 2 3 4 1 2 3 1 2 3 4 C
Leng
th (m
m)
0
20
40
60
80
100
1 2 3 4 1 2 3 1 2 C
Leng
th (m
m)
Kinsale
Lynnhaven Wachapreague
0
20
40
60
80
100
1 2 3 4 5 1 2 3 4 5 1 2 5 C
Another way to view the results from Figures 4 and 5 is to compare performance of the test lines with the control on a relative basis, that is, how much better (or worse) are the lines than the wild Mobjack Bay control . This analysis is shown in Table 4 below for survival, shell length, whole (oyster) weight and yield . The Table indicates the relative performance of the best line from each base population from each location . After all, production spawns are usually done from a
single line, which can be chosen by the hatchery . The best performance, then, indicates the advantages that are available for industry by using selectively bred lines .
For performance of the best lines of each base population of each line, the results are consistent — the yield from selected lines is between 26% and about 500% higher than control wild oysters, except where mortality was high for Louisiana stocks at Wachapreague (Table 4) .
This uniformly higher yield is mostly attributable to higher survival of the select lines, although there were some growth advantages in Louisiana lines everywhere but Wachapreague, and in all lines in Lynnhaven . Interestingly, DBY seems to grownwell under Wachapreague conditions . The variability of performance among lines across sites further eemphasizes the custom nature of choosing brood stock for particular regions, and for us — for breeding specifically for particular regions .
11
The overall results are telling us the following . Our lines have bona fide disease tolerance, if not resistance, and survival is much higher as a result . But there are no similar remarkable
advances in growth except in some circumstances, mostly with Louisiana lines . These are the general observations that led us to our new strategy to concentrate on intense selection for growth traits
in certain regions, using the base populations of DBY, XB, and LA . Our immediate goal is market size for the bulk of the crop in no more than 18 months .
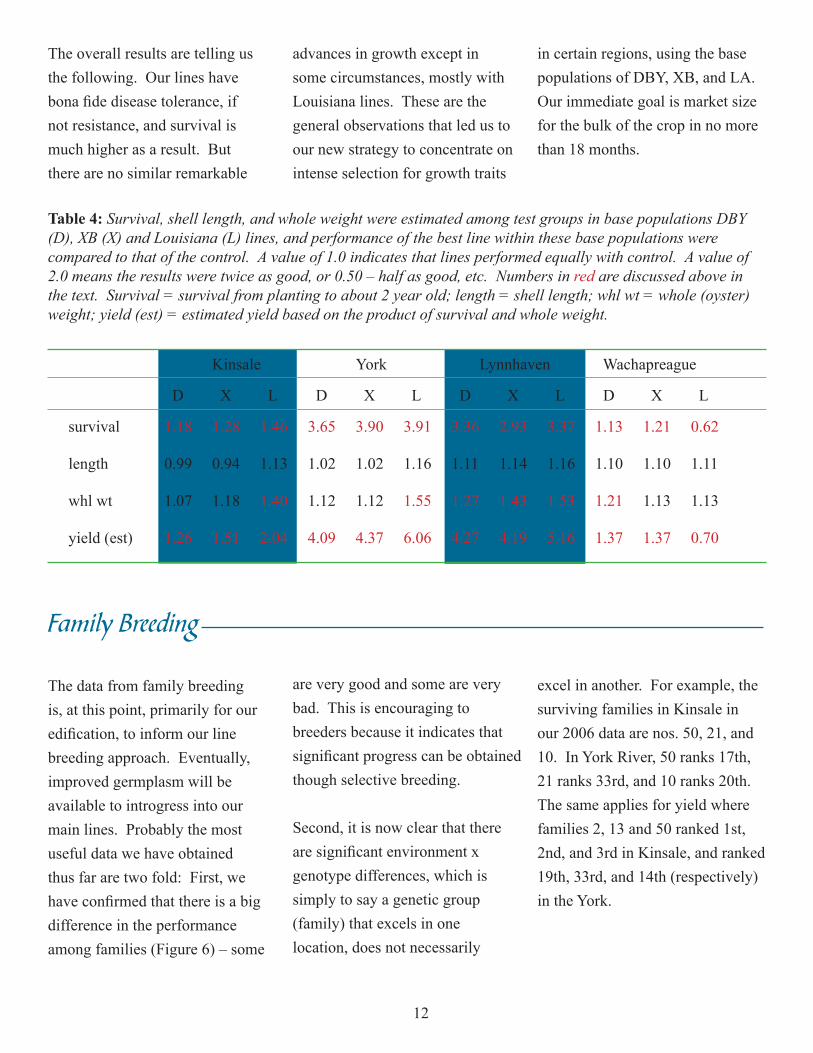
Table 4: Survival, shell length, and whole weight were estimated among test groups in base populations DBY (D), XB (X) and Louisiana (L) lines, and performance of the best line within these base populations were compared to that of the control. A value of 1.0 indicates that lines performed equally with control. A value of 2.0 means the results were twice as good, or 0.50 – half as good, etc. Numbers in red are discussed above in the text. Survival = survival from planting to about 2 year old; length = shell length; whl wt = whole (oyster) weight; yield (est) = estimated yield based on the product of survival and whole weight.
Kinsale York Lynnhaven Wachapreague
D X L D X L D X L D X L
survival 1 .18 1 .28 1 .46 3 .65 3 .90 3 .91 3 .36 2 .93 3 .37 1 .13 1 .21 0 .62
length 0 .99 0 .94 1 .13 1 .02 1 .02 1 .16 1 .11 1 .14 1 .16 1 .10 1 .10 1 .11
whl wt 1 .07 1 .18 1 .40 1 .12 1 .12 1 .55 1 .27 1 .43 1 .53 1 .21 1 .13 1 .13
yield (est) 1 .26 1 .51 2 .04 4 .09 4 .37 6 .06 4 .27 4 .19 5 .16 1 .37 1 .37 0 .70
Family Breeding
The data from family breeding is, at this point, primarily for our edification, to inform our line breeding approach . Eventually, improved germplasm will be available to introgress into our main lines . Probably the most useful data we have obtained thus far are two fold: First, we have confirmed that there is a big difference in the performance among families (Figure 6) – some
are very good and some are very bad . This is encouraging to breeders because it indicates that significant progress can be obtained though selective breeding .
Second, it is now clear that there are significant environment x genotype differences, which is simply to say a genetic group (family) that excels in one location, does not necessarily
excel in another . For example, the surviving families in Kinsale in our 2006 data are nos . 50, 21, and 10 . In York River, 50 ranks 17th, 21 ranks 33rd, and 10 ranks 20th . The same applies for yield where families 2, 13 and 50 ranked 1st, 2nd, and 3rd in Kinsale, and ranked 19th, 33rd, and 14th (respectively) in the York .
12
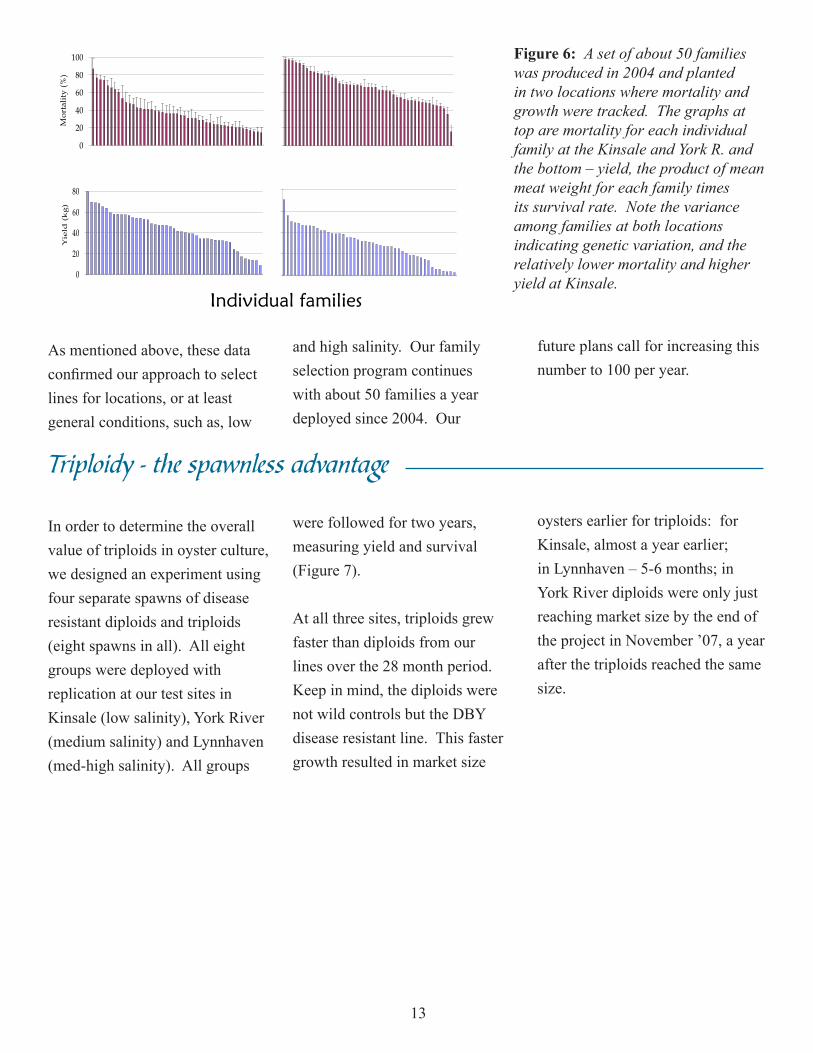
Figure 6: A set of about 50 families was produced in 2004 and planted in two locations where mortality and growth were tracked. The graphs at top are mortality for each individual family at the Kinsale and York R. and the bottom – yield, the product of mean meat weight for each family times its survival rate. Note the variance among families at both locations indicating genetic variation, and the relatively lower mortality and higher yield at Kinsale.
0
20
40
60
80
100
12
31
15
49
24
37
33
36
53
18
3 9 32
13
21
11
34
30
20
51
43
41
2 16
52
45
5 10
46
22
50
25
35
44
7 48
4 6 39
40
47
38
19
27
54
55
42
0
20
40
60
80
42
55
27
7 47
44
54
40
5 2 22
30
52
10
20
43
13
21
3 36
33
37
49
12
0
20
40
60
80
100
2
5
3
1
1
9
2
4
3
3
3
7
4
1
4
7
4
9
1
5
4
5
1
2
3
4
2
7
4
8
5
3
4 1
8
5
2
4
4
2
2
6 4
6
5
4
4
0
9 4
2
3
9
3 3
0
5
5
3
5
2
0
7 4
3
1
1
1
3
3
2
1
6
5
1
2 3
8
5 3
6
1
0
2
1
5
0
Mor
talit
y (%
)
0
20
40
60
80
2 5
0
3
6
3
0
3
5
2
1
3
8
1
6
9 1
2
2
0
4
8
2
7
4
2
4
0
4
4
2
2
3
9
4
9
5
4
1
9
3
7
3
1
2
5
Yie
ld (
kg
)
Individual families
As mentioned above, these data confirmed our approach to select lines for locations, or at least general conditions, such as, low
and high salinity . Our family selection program continues with about 50 families a year deployed since 2004 . Our
future plans call for increasing this number to 100 per year .
Triploidy - the spawnless advantage
In order to determine the overall value of triploids in oyster culture, we designed an experiment using four separate spawns of disease resistant diploids and triploids (eight spawns in all) . All eight groups were deployed with replication at our test sites in Kinsale (low salinity), York River (medium salinity) and Lynnhaven (med-high salinity) . All groups
were followed for two years, measuring yield and survival (Figure 7) .
At all three sites, triploids grew faster than diploids from our lines over the 28 month period . Keep in mind, the diploids were not wild controls but the DBY disease resistant line . This faster growth resulted in market size
oysters earlier for triploids: for Kinsale, almost a year earlier; in Lynnhaven – 5-6 months; in York River diploids were only just reaching market size by the end of the project in November ’07, a year after the triploids reached the same size .
13
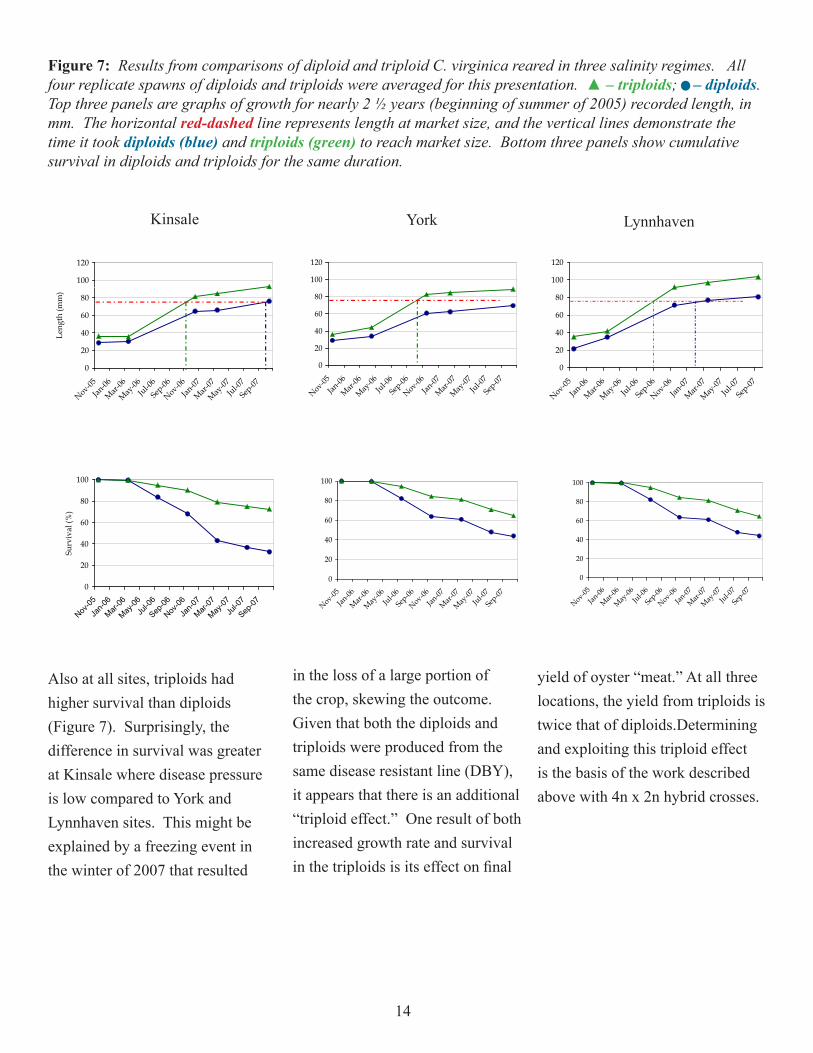
Figure 7: Results from comparisons of diploid and triploid C. virginica reared in three salinity regimes. All four replicate spawns of diploids and triploids were averaged for this presentation. ▲ – triploids; – diploids. Top three panels are graphs of growth for nearly 2 ½ years (beginning of summer of 2005) recorded length, in mm. The horizontal red-dashed line represents length at market size, and the vertical lines demonstrate the time it took diploids (blue) and triploids (green) to reach market size. Bottom three panels show cumulative survival in diploids and triploids for the same duration.
0
20
40
60
80
100
120
Nov-05Jan
-06
Mar-06
May-06
Jul-06
Sep-06
Nov-06Jan
-07
Mar-07
May-07
Jul-07
Sep-07
Leng
th (m
m)
0
20
40
60
80
100
120
Nov-05Jan
-06
Mar-06
May-06
Jul-06
Sep-06
Nov-06Jan
-07
Mar-07
May-07
Jul-07
Sep-07
0
20
40
60
80
100
120
Nov-05Jan
-06
Mar-06
May-06
Jul-06
Sep-06
Nov-06Jan
-07
Mar-07
May-07
Jul-07
Sep-07
0
20
40
60
80
100
Nov-05
Jan-06
Mar-06
May-06Jul-06
Sep-06
Nov-06
Jan-07
Mar-07
May-07Jul-07
Sep-07
Surv
ival
(%)
0
20
40
60
80
100
Nov-05Jan
-06
Mar-06
May-06
Jul-06
Sep-06
Nov-06Jan
-07
Mar-07
May-07
Jul-07
Sep-07
0
20
40
60
80
100
Nov-05Jan
-06
Mar-06
May-06
Jul-06
Sep-06
Nov-06Jan
-07
Mar-07
May-07
Jul-07
Sep-07
Also at all sites, triploids had higher survival than diploids (Figure 7) . Surprisingly, the difference in survival was greater at Kinsale where disease pressure is low compared to York and Lynnhaven sites . This might be explained by a freezing event in the winter of 2007 that resulted
in the loss of a large portion of the crop, skewing the outcome . Given that both the diploids and triploids were produced from the same disease resistant line (DBY), it appears that there is an additional “triploid effect .” One result of both increased growth rate and survival in the triploids is its effect on final
yield of oyster “meat .” At all three locations, the yield from triploids is twice that of diploids .Determining and exploiting this triploid effect is the basis of the work described above with 4n x 2n hybrid crosses .
Kinsale York Lynnhaven
14
Diploids - selected lines
Brood Stock Recommendations
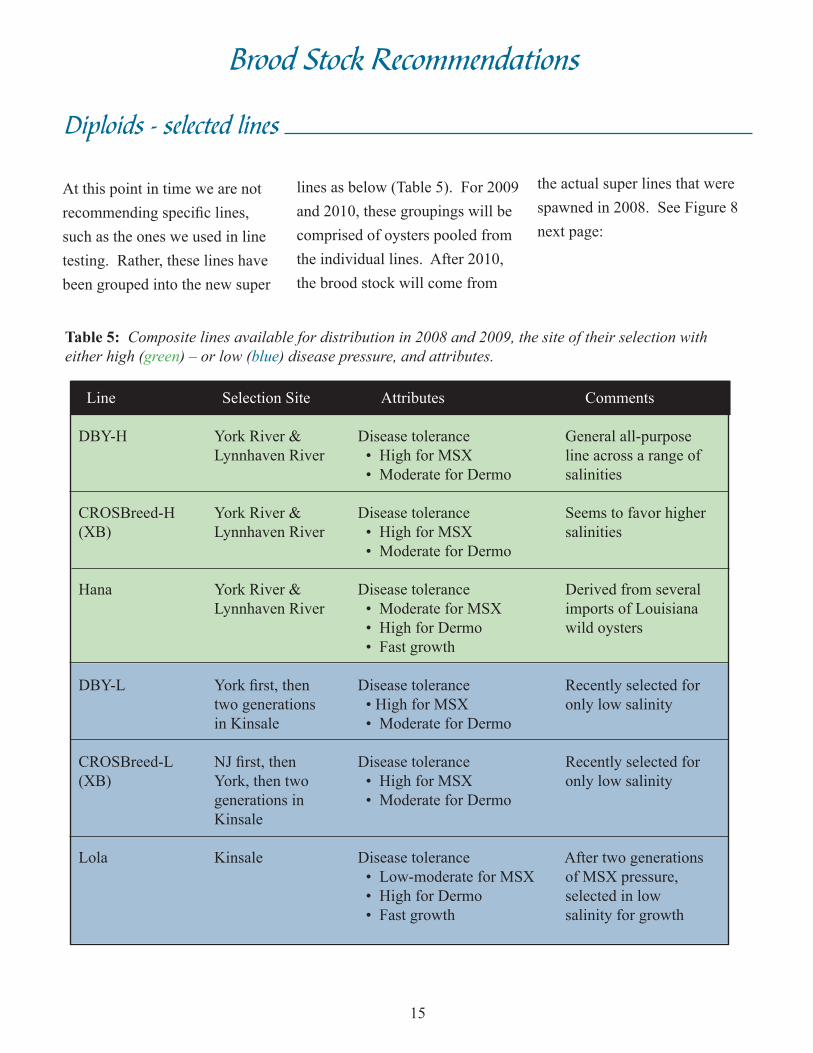
At this point in time we are not recommending specific lines, such as the ones we used in line testing . Rather, these lines have been grouped into the new super
lines as below (Table 5) . For 2009 and 2010, these groupings will be comprised of oysters pooled from the individual lines . After 2010, the brood stock will come from
the actual super lines that were spawned in 2008 . See Figure 8 next page:
Table 5: Composite lines available for distribution in 2008 and 2009, the site of their selection with either high (green) – or low (blue) disease pressure, and attributes.
Line Selection Site Attributes Comments
DBY-H York River & Disease tolerance General all-purpose Lynnhaven River • High for MSX line across a range of • Moderate for Dermo salinities
CROSBreed-H York River & Disease tolerance Seems to favor higher (XB) Lynnhaven River • High for MSX salinities • Moderate for Dermo
Hana York River & Disease tolerance Derived from several Lynnhaven River • Moderate for MSX imports of Louisiana • High for Dermo wild oysters • Fast growth
DBY-L York first, then Disease tolerance Recently selected for two generations • High for MSX only low salinity in Kinsale • Moderate for Dermo
CROSBreed-L NJ first, then Disease tolerance Recently selected for (XB) York, then two • High for MSX only low salinity generations in • Moderate for Dermo Kinsale
Lola Kinsale Disease tolerance After two generations • Low-moderate for MSX of MSX pressure, • High for Dermo selected in low • Fast growth salinity for growth
15
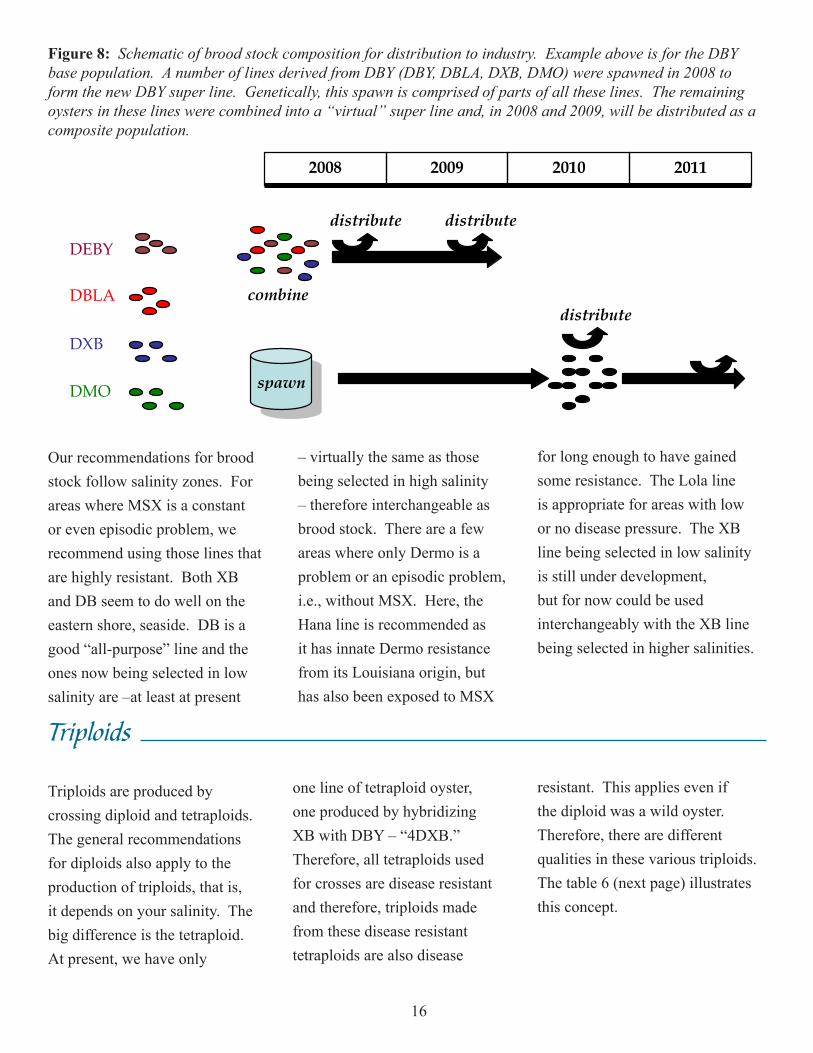
Figure 8: Schematic of brood stock composition for distribution to industry. Example above is for the DBY base population. A number of lines derived from DBY (DBY, DBLA, DXB, DMO) were spawned in 2008 to form the new DBY super line. Genetically, this spawn is comprised of parts of all these lines. The remaining oysters in these lines were combined into a “virtual” super line and, in 2008 and 2009, will be distributed as a composite population.
DBLA
DMO
DXB
DEBY
2009 2010 2011 2008
combine
distribute distribute
spawn
distribute
Our recommendations for brood stock follow salinity zones . For areas where MSX is a constant or even episodic problem, we recommend using those lines that are highly resistant . Both XB and DB seem to do well on the eastern shore, seaside . DB is a good “all-purpose” line and the ones now being selected in low salinity are –at least at present
– virtually the same as those being selected in high salinity – therefore interchangeable as brood stock . There are a few areas where only Dermo is a problem or an episodic problem, i .e ., without MSX . Here, the Hana line is recommended as it has innate Dermo resistance from its Louisiana origin, but has also been exposed to MSX
for long enough to have gained some resistance . The Lola line is appropriate for areas with low or no disease pressure . The XB line being selected in low salinity is still under development, but for now could be used interchangeably with the XB line being selected in higher salinities .
Triploids
Triploids are produced by crossing diploid and tetraploids . The general recommendations for diploids also apply to the production of triploids, that is, it depends on your salinity . The big difference is the tetraploid . At present, we have only
one line of tetraploid oyster, one produced by hybridizing XB with DBY – “4DXB .” Therefore, all tetraploids used for crosses are disease resistant and therefore, triploids made from these disease resistant tetraploids are also disease
resistant . This applies even if the diploid was a wild oyster . Therefore, there are different qualities in these various triploids . The table 6 (next page) illustrates this concept .
16
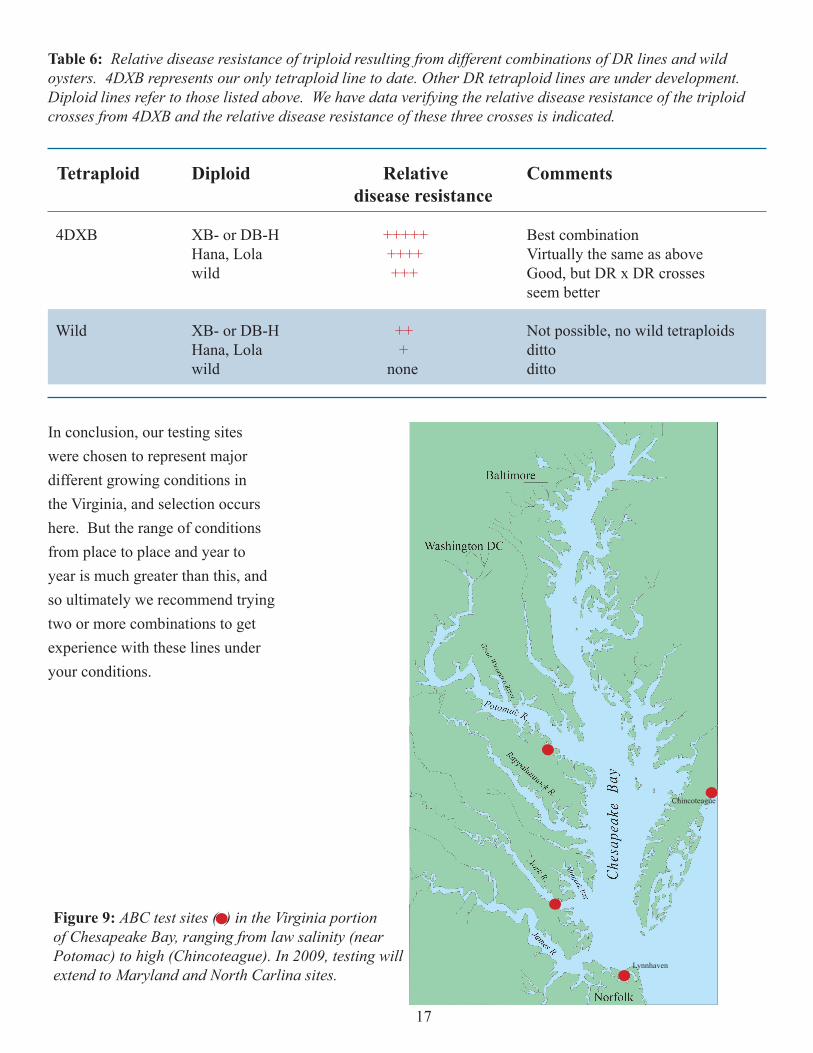
Table 6: Relative disease resistance of triploid resulting from different combinations of DR lines and wild oysters. 4DXB represents our only tetraploid line to date. Other DR tetraploid lines are under development. Diploid lines refer to those listed above. We have data verifying the relative disease resistance of the triploid crosses from 4DXB and the relative disease resistance of these three crosses is indicated.
Tetraploid Diploid Relative Comments disease resistance
4DXB XB- or DB-H +++++ Best combination Hana, Lola ++++ Virtually the same as above wild +++ Good, but DR x DR crosses seem better
Wild XB- or DB-H ++ Not possible, no wild tetraploids Hana, Lola + ditto wild none ditto
In conclusion, our testing sites were chosen to represent major different growing conditions in the Virginia, and selection occurs here . But the range of conditions from place to place and year to year is much greater than this, and so ultimately we recommend trying two or more combinations to get experience with these lines under your conditions .
Figure 9: ABC test sites ( ) in the Virginia portion of Chesapeake Bay, ranging from law salinity (near Potomac) to high (Chincoteague). In 2009, testing will extend to Maryland and North Carlina sites.
Lynnhaven
17
Chincoteague
Brood stock - lines
Brood Stock Distribution -- 2009From our start in 1998, the hallmark of our program has been the release of brood stock to hatcheries for propagation of seed and eyed larvae . We have always felt that this is the culmination of our breeding efforts . Because progress is continuous in a
breeding program, we expect to release lines yearly that are better than the previous generations . The numbers of brood stock released in the past five years have been climbing steadily: 100, 200, 500, 1000, then 7000 for the 2008 season . Consequently we have
been learning what to do and what not to do . We have adopted the following principles and policies for the distribution of diploids and tetraploids that seem to be most serviceable for all .
In the Fall of each year, we will query hatcheries about their expected needs for brood stock . The contact at ABC for this is Nate Geyerhahn . At that time, we prefer to learn of the total estimated requirements for brood stock for the upcoming year .
Sometimes it will be impossible to predict the entire season, we understand . At the very least, a hatchery should know what is needed for the early season so it can attend to early conditioning .
Brood stock managementNate Geyerhan
ABC, VIMS1208 Greate Road
Gloucester Point, VA 23062804 .684 .7864
nateg@vims .edu
General Principles
• Timing – We prefer to release all the brood stock in late Fall of the year prior to spawning season . For example, for the 2009, spawning season, we released brood stock to hatcheries in late—November or December of 2008 . It’s possible that a hatchery will not know their entire brood stock needs that early . In that case, there likely will be additional brood stock available later in the following spawning season .
• Strategic timing – We recommend that hatcheries receive the brood stock needed for early season spawns in the Fall delivery . This will assure that conditioning (see below) and salinity adjustments are within their control . For mid-spring spawns, it is possible to get brood stock, but they will still have to be conditioned . During the spawning season, oysters will be ripe, of course, up until they spawn out . We can not hold brood stock back from natural spawning . In the
late season, all of our brood stock will be spawned out and therefore useless to hatcheries . If a hatchery needs brood stock late in the season, the hatchery must make their own provisions to attain them and hold them for late season use .
• Availability – To reiterate the points in Table 3, because we have changed the very nature of our breeding program, we expect to have ample brood stock of any specific line available by 2011 . In the
18

meantime, we will distribute a line upon request if we have it available, otherwise we will provide the next best thing according to our experience .
• Fecundity – For now – until our new brood stock come on line – it is best to estimate the number of females needed based on an average fecundity of 5,000,000 eggs per female . This is a conservatively small number . Unfortunately, we can not predict sex ratio, which can change from year to year and site to site .
• Conditioning – We do not have the resources to get oysters sexually mature for commercial hatcheries, by
conditioning . For early spawns, where conditioning is needed, we release brood stock early .
• Cost – Starting with the 2009 release of brood stock (for the 2010 season), there will be a charge for the number of animals distributed . This cost is being determined, but we estimate that $2-3 per female is probably about right . Obviously, we do not know how many females there are when the brood stock are first released . Therefore, we will ask the hatcheries to record the number of females used over the course of the season .
(See “Intellectual Property and Licensing”) .
• Retaining brood stock – Any unused brood stock at the end of the spawning season may be retained by the hatchery (in their own grow out) for the ensuing spawning season . These inventories should be communicated to Nate Geyerhahn so that future needs are adjusted accordingly . Alternatively, brood stock should be returned to ABC . Brood stock may not be propagated for quality control reasons .
Brood stock - tetraploidsDistributionAs a rule, we do not release tetraploid oysters (exception, see “Timing” below) . Rather, we have been successful in distributing live sperm from tetraploid males prior to a planned spawn . This works well even if the hatchery is remote from us, because the sperm is viable for up to 3-4 days .
For tetraploid sperm, we have on hand populations of
tetraploids from various year classes (and in the future from various lines) . A hatchery notifies us that it is planning a triploid spawn(s) . Our contact person for this is Karen Hudson . ABC personnel open putative tetraploids and find the males . We then certify that the male is indeed tetraploid and that the sperm is 100% di-haploid . The tetraploid male is then strip spawned and the sperm placed in 1 .5mL Eppendorf tubes . The
tubes containing the sperm from tetraploids are then packed in a cooler with ice for storage, delivery, or shipment . When possible, we try to include sperm from at least two males .
ABC is contracted to provide quality control on triploid production in commercial hatcheries . We do this by flow cytometry . Below, we outline the process of certification sampling and procedures . Please contact Karen Hudson if you have any
19
concerns or questions regarding the certification or sampling procedures . Any questions regarding the certification requirements, allowable percentage triploidy, or charges
should be directed to 4Cs Breeding Technologies, Inc . (4Cs) (See “Intellectual Property and Licensing”) .
Tetraploid managementKaren Hudson
ABC, VIMS1208 Greate Road
Gloucester Point, VA 23062804 .684 .7742
khudson@vims .edu
General Principles
• Timing – ABC will make every effort to have conditioned tetraploids by late March, extending to at least Aug 15th – this is the period of time live sperm will be available from ABC .
• Strategic timing – If there are plans to spawn earlier than March, we will make arrangements for the transfer of limited numbers of tetraploid oysters for conditioning at the hatchery facility . These tetraploid are “on loan” and records of oysters sacrificed or dead must be kept . All remaining tetraploids must be returned . Remember, that if you are stripping tetraploids at your hatchery, the sperm still should be certified . See certification and sampling below .
If there are plans to use tetraploids later in the season
than mid-August, we need to know about these plans by early Spring, and we will try to negotiate a solution . It is increasingly difficult to keep fecund tetraploids late into the season .
• Availability – We have been successful in expanding our tetraploid stocks and do not anticipate any problems with availability of sperm from tetraploids .
• Fecundity – Roughly speaking, one tube of sperm should be sufficient to fertilize about 50,000,000 eggs . We recommend using a higher sperm to egg ratio in 4n x 2n crosses because tetraploid sperm are somewhat less active . Probably, it should be double your normal application . Another way to put it is that to obtain 10 sperm per egg, you will need about twice as much
sperm as you would use from diploid oysters . To assure sufficient quantity of sperm, it would be best to specify the approximate numbers of fertilized eggs you are shooting for .
• Conditioning – For tetraploids ABC does the conditioning, unless very early spawns are anticipated .
• Cost – There is no cost associated with ABC’s distribution of sperm to hatcheries . Other costs, such as licensing fees and certification costs are described in “Intellectual Property and Licensing” .
• Retaining brood stock – Unused tetraploid brood stock at the end of the spawning season must be returned to ABC . Tetraploids may not be propagated .
20
CertificationCertification steps 1 . sperm to assure it is 100% di-haploid 2 . 2-7 day old larvae to assure they are triploid 3 . “pre-sale” (eyed larvae or seed) to assure no contamination in handling
4Cs requires certification of triploid spawns in the early larval stage and in the stage at which they are sold (eyed larvae or spat), and ABC is contracted to do this work . Certification of the sperm before the spawn assures
that there is no contamination from the tetraploid(s) . The early larvae sample is for the benefit of the hatchery to ensure that time and effort is not wasted on a spawn contaminated with diploids . There is no set day to
sample early larvae, but the earlier the better (days 2-7) . The “before sale” certification is to assure that no mishandling has occurred during the larvae or seed process . These certifications were put into place to assure that growers are getting high quality triploids .
SamplingSperm certification – ABC is responsible for providing di-haploid sperm on request . Certification occurs in our labs prior to shipment . Pick-up can also be arranged through Karen Hudson . ABC will be responsible for shipping costs of sperm, with reimbursement from 4Cs .
If tetraploids are being used at hatcheries early in the season, then it will be necessary to send a sample of the sperm from the hatchery to ABC . There are several options for doing this . One, tetraploids can be spawned and a sample of sperm saved in the refrigerator . It can be returned to ABC for certification with 2-day old larvae (but not older since the sperm
may degrade for testing) . Two, tetraploids may be opened in the hatchery and strip spawned . Sperm can be held in tubes in the refrigerator while a sample is sent to ABC (overnight) . Spawning could be done immediately after the sample is certified . Results will be phoned in to the hatchery on the day the sample is delivered to ABC . Three, tetraploids may be opened in the hatchery and sampled, but not strip spawned . In this case, after sampling, the top shell should be replaced and the whole oyster wrapped in moistened toweling and stored
in the refrigerator . Again, results will be phoned in to the hatchery on the day the sample is delivered to ABC .
ABC will provide sampling materials for these early sampling needs . Remember, this is an exception for early production only, otherwise hatcheries will receive already certified sperm from ABC . Instructions for sampling will be sent with tetraploid oysters .
Early larvae certification – The hatchery is responsible for sending early larvae samples . About 2000-5000 larvae should be collected during a drop, and volume condensed so the larvae can fit into a small tube . Larvae should be shipped in seawater and kept cold (not frozen) during
Samples for certificationKaren Hudson
ABC, VIMS1208 Greate Road
Gloucester Point, VA 23062804 .684 .7742
khudson@vims .edu
21
storage and shipping . Labeling needs to include the culture name and/or unique code, or date, to identify that specific cohort in the future . Shipment should be overnight .
“Before sale” certification (larvae) – For eyed larvae sales, the same procedure can be used as for early larvae certification,
except that only about 1000 larvae are needed . Each major batch of larvae, even if it is from the same spawn over a number of days, should have its own certification .
“Before sale” certification (spat) – For spat, ~200 1-2mm spat should be shipped in damp toweling, cold (not frozen) overnight (or delivered for local hatcheries) . There will be
a minimum certification of 50 spat, and if there are more than three diploids, another 50 will be run to get to a final sample size of 100 .
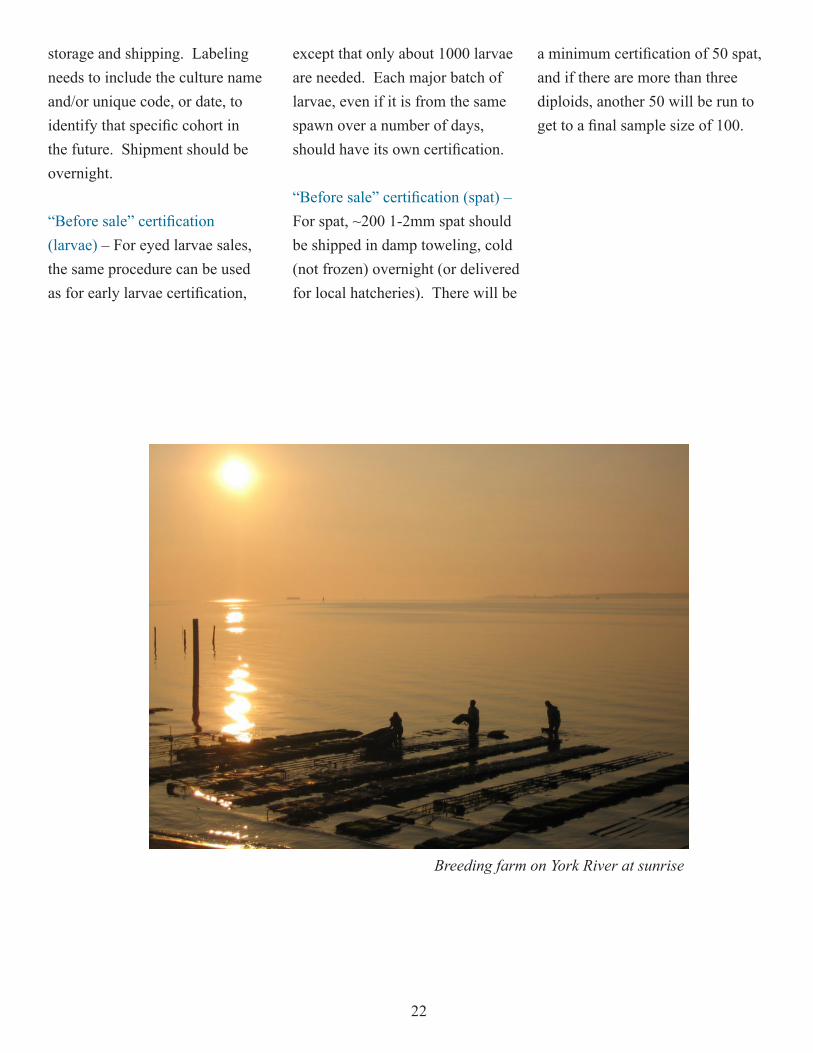
Breeding farm on York River at sunrise
22

Intellectual Property and Licensing
Disease resistant lines
Both the disease resistant lines and the tetraploids represent intellectual property that is being exploited by different groups, one for the diploid DR lines and one for the tetraploids . Both technologies were developed from a combination of Federal
and State funds at both Rutgers University and VIMS . According to the Bayh-Dole Act (also known as the University and Small Business Patent Procedures Act), US universities, small businesses, and non-profits
may retain control over their inventions and other intellectual property that resulted from their inventions . Consequently, it is common for universities and the like to exploit this intellectual property in various ways .
The disease resistant lines have been developed by a combination of efforts by VIMS and Rutgers, and to some degree, University of Maryland . These three universities have formed a Consortium to deal with this intellectual property among them . At this writing (Feb . 2009), discussions are ongoing about how to deal with this intellectual property over the long term, that is, whether to license it out to another company or to retain it within the Consortium . For 2008-9, it is the Consortium that hatcheries must deal with to license the use of the DR lines, or Improved Oyster Lines, as they have come to be called .
Licenses for use of the DR lines are sent out through the Office
of Corporate Liaison and Technology Transfer at Rutgers, and the contact person for these licensing agreements is Greg DeBrosse of the Haskin Shellfish Research Lab, Rutgers . These licensing agreements need to be in place for the upcoming spawning season before the distribution of brood stock . The Consortium charges a straight 7% maintenance fee on both seed and eyed larvae deriving from DR lines .
The funds that obtain from the licenses for DR lines return to an account at Rutgers and get reallocated to the various programs in the Consortium . In other words, it supports the breeding, ultimately .
Licensing for diploid lines* Greg DeBrosse
Haskin Shellfish Research LabRutgers University
6959 Miller AvenuePort Noris, NJ 08349
609 .463 .0633debrosse@rci .rutgers .edu
* for 2009 only . Licensing after 2009 subject to change
23
Tetraploids
Tetraploid were “invented” at Rutgers in 1993 and are subject to US Patent no . 5824841 . Rutgers gave an exclusive license for the worldwide use of tetraploid shellfish to a start-up company, 4Cs Breeding Technologies, Inc . 4Cs now sub-licenses the technology to end users, currently, hatcheries . Before tetraploid sperm or tetraploids themselves are released, a hatchery must have an active license for the upcoming spawning season .
The funds obtained from licenses for tetraploids go to 4Cs, who must in turn make arrangements for the production and care of tetraploids at both Rutgers and VIMS . Questions concerning licensing, royalty fees, or other charges should be addressed to Tom Rossi at 4Cs .
Licensing for tetraploidsTom Rossi
4Cs Breeding Technologies, Inc .605 Commonwealth Avenue
Strathmere, NJ 08248609 .425 .2475
24
Future Directions
ABC was developed to harness the power of genetic technology and selective breeding, and to promote economic development on behalf of the oyster industry in Virginia . From inception, this challenge was centered on addressing the mass mortalities caused by MSX and Dermo . As we have progressed towards this goal we have started applying resources not only to salvage winnowing numbers of oysters in the bay but also to add great value, just as it has in other cultivated species . In the coming years this “value added” will become increasingly important . A farmer should be able to harvest his crop in a shorter amount of time increasing his turnover, and, for the shucking market, should recoup more revenue per crop from larger animals .
To date the focus of genetic improvement has been placed on the field grow out alone, but relatively few studies have examined the genetic potential in the hatchery . We are going to address this by conducting a
series of experiments starting in March 2009 . Our objective is to explore and quantify the genetic basis for larval performance (growth, competence, and setting success) and their correlations with other (field) breeding goals for juvenile and adult oysters . Our goal is to determine whether larval performance can be improved through selective breeding and the effects this can have in the field . Seldom has the hatchery environment been considered in the light of a production environment with predefined traits that can be improved .
It appears that triploids have high value to the farmer . We would like to try to establish the underlying genetic mechanisms that cause this “triploid advantage” and to exploit it through breeding . We recently received funding and a graduate student will get this work off the ground starting 2009 . Our aim is to continually improve the performance of our triploid cross
by capturing the genetic progress of our diploid lines .
All ABC projects do not have to concern genetics per se . We have contributed to overall economic development of the industry in other ways, such as, tests of non-natives, spat-on-shell, and restoration . Implicit in our mission is the directive to help realize the vast potential that aquaculture has in our region . To this end, we will also be working on improving larval yield by optimising high density culture . High density culture has been variously incorporated around the world but seldom, if ever, on a commercial scale for C. virginica . Successfully harnessing high density culture and other hatchery innovations should help contribute to reducing the current shortfall in hatchery capacity .
25

26