impact of oyster aquaculture in virginia on waterfront
TRANSCRIPT

i
Impact of Oyster Aquaculture in Virginia on Waterfront Property Values
Katie Stump
Thesis submitted to the faculty of the Virginia Polytechnic Institute and State University in partial fulfillment of the requirements for the degree of
Master of Science in Agricultural and Applied Economics
Kevin J. Boyle, Committee Co-Chair
S. Kurt Stephenson, Committee Co-Chair
Jonathan van Senten
May 13, 2019
Blacksburg, VA

Impact of Oyster Aquaculture in Virginia on Waterfront Property Values
Katie Stump
ABSTRACT
Virginia is the east coast’s largest producer of eastern oysters and produces
more than any other state. As the industry grows to meet increasing demand, more
conflicts have arisen with other resource users, especially waterfront property
owners. Some landowners claim oysters impact recreational and aesthetic uses of
their property, therefore lowering the value of the home. Using a hedonic property
value model, this study examines the effect of oyster aquaculture on waterfront
properties by using 2,245 property sales from 16 counties and independent cities
and information on aquaculture activity from 2012-2016. The results suggest that
oyster aquaculture has a positive effect on waterfront property values, but a
negative effect when using cage equipment.

Impact of Oyster Aquaculture in Virginia on Waterfront Property Values
Katherine Stump
GENERAL AUDIENCE ABSTRACT
Virginia is the east coast’s largest producer of eastern oysters and produces
more than any other state. As the industry grows to meet increasing demand, more
conflicts have arisen with other resource users, especially waterfront property
owners. Some landowners claim oysters impact recreational and aesthetic uses of
their property, therefore lowering the value of the home. This study examines the
effect of oyster aquaculture on waterfront properties. The results suggest that
oyster aquaculture has a positive effect on waterfront property values, but a
negative effect when using cage equipment.
iv
Table of Contents
Abstract ..................................................................................................................... ii General Audience Abstract ...................................................................................... iii Introduction ................................................................................................................ 1 Oyster Leasing and Aquaculture ................................................................................ 3 Previous Research ...................................................................................................... 6 Data ..........................................................................................................................10 Model .......................................................................................................................22 Results ......................................................................................................................25 Discussion ................................................................................................................27 References ................................................................................................................31 Appendices ...............................................................................................................35
Appendix A. GIS Code .........................................................................................35 Appendix B. Map of Active Oyster (Purple) and Clam (Red) Leases .................52 Appendix C. Stata Code ........................................................................................53 Appendix D. Full Model Results ..........................................................................71 Appendix E. Alternate Model Results ..................................................................95

1
Introduction
The eastern oyster (Crassostrea virginica) and hard clams (Mercenaria
mercenaria) have been a major part of the culture, environment, and economy of
Chesapeake Bay communities for centuries. Oysters generally grow in shallow
areas in the Chesapeake Bay and its tributaries, and this is where aquaculture
leases are placed. However, this is near where many people live and enjoy the
water. Some members of waterfront communities argue that aquaculture sites
hinder boating, other recreational activities, and aesthetic uses of their property.
The equipment and markers associated with leases influences boating and
navigation and could be visible from the shore depending on the tide and time of
year. Additionally, aquaculturists do have to maintain the lease and harvest
shellfish, which could also affect aesthetics. They argue that this decreases the
value of waterfront properties [1]. If the presence of aquaculture operations does
lower property values, this can have impacts on Bay communities through reduced
property tax revenues. Residents of the Lynnhaven River system, near Virginia
Beach, attempted to restrict oyster aquaculture by making it more difficult to
obtain a lease in this area, which led to a temporary moratorium of new leases[2].
Much of these conflicts center around the use of cage equipment when growing
oysters [3]. While public opposition to aquaculture appears to be localized,

2
Virginia legislators have proposed bills to reduce such conflicts could affect
operations throughout the state. In January 2016, a proposed bill would have
increased the cost of oyster leases within 1,000 feet of a residential property.
According to the Virginia Marine Resources Commission (VMRC), this plan
would affect fifty to seventy percent of the 119,000 acres of waterways available
for leasing [4]. Other proposed legislation would make it easier for waterfront
property owners to lease water near their property so that area cannot be used for
commercial aquaculture [5]. Although neither of these bills passed, it shows that
some policymakers are listening to these concerned landowners.
Whether shellfish aquaculture operations affect property values is an open
question. The nearshore shellfish aquaculture may or may not impede recreational
and other uses of the water or affect visual aesthetics. If there is an effect, this in
turn could impact residential waterfront property values. A positive and significant
effect on property values could reflect the ecosystem services that shellfish
aquaculture provides, including water quality improvements by oysters. A negative
and significant effect on property values indicates a resource use conflict between
aquaculture growers and waterfront property owners that is reflected in lower
property prices. If there is no effect on property prices, this suggest property prices
are not influenced by nearby aquaculture operations.

3
This research will investigate the potential effects of aquaculture on
residential property prices, with a focus on oyster aquaculture. The investigation
will also consider if the use of cages and other aquaculture equipment affects
property prices differently than growing shellfish in clusters on the bottom of the
water. A hedonic property value study will be used to conduct these investigations
[6]. The study area is eastern mainland Virginia and will use data covering the
period from 2012 to 2016. The results show that active aquaculture leases have a
positive effect on nearby property values, but aquaculture with cage equipment has
a negative effect.
Oyster Leasing and Aquaculture
Historically, wild harvesting of oysters was more popular in Virginia than
aquaculture. However, disease and habitat loss contributed to a decline in wild
populations and wild harvest [7]. Improvements in production practices and
growing consumer demand have fueled growth, especially in planting and
harvesting oysters. Advances in oyster hatchery breeding techniques and
innovations in technology have increased mortality and growth rates and allow for
more efficient production. Clam aquaculture is a more well-established industry,
and aquaculture has been the main source of clams for over a decade [8].

4
Oyster aquaculture is the fastest growing sector of shellfish aquaculture in
Virginia and the state is the east coast’s largest producer of eastern oysters.
Virginia also produces more hard clams than any other state. Oysters are either
grown using intensive or extensive methods. Intensive aquaculture involves
growing oysters in a floating or on-bottom cage. In extensive, or spat-on-shell
aquaculture, oysters grow on the bottom of the water, like wild oysters. Clams are
normally grown in pots covered in netting [8].
Shellfish growers must obtain a lease to grow shellfish from VMRC. As part
of the application process, growers must specify the location where they wish to
lease, what species they will plant, and what equipment they plan to use.
Equipment that extends more than one foot from the bottom requires additional
documentation. Bottom cages do not need this additional documentation, but floats
and other water column equipment do. Once a lease is assigned, the lease lasts for
ten years [9]. Application fees range from $300 to $1,000 depending on the size of
the lease. These same fees apply when the lease is transferred. These fees are one-
time and there are additional fees associated with leasing application, including
surveying fees, a $50 fee to harvest oysters for commercial use, and a $1.50 yearly
rental fee [10]. A leaseholder can renew the lease if VMRC receives another
application from them. When considering a lease renewal, the commission can
consider to the public benefits of the aquaculture activity and whether continuation

5
of the lease is in the public interest. If there has been no significant production,
VMRC will not approve the renewal. A recent law directs VMRC to create a lease
renewal fee up to $300 [11]. Each month, aquaculture growers are required to
report harvest information to VMRC, including date of harvest, location,
equipment used, species and amount harvested, and number of crew members [12].
The boundaries of active lease grounds and any equipment must be marked with
markers or buoys [13].
Certain measures exist in the leasing process to help resolve conflicts
between leaseholders and other parties, including nearby property owners. When a
grower applies for a new lease, residents are notified by newspaper advertisements
and public flyer postings. A map of all leases and pending applications is publicly
available online, so a homebuyer can find out if a property is near any oyster
leases. There is no information at this source on whether the lease is active [14]. If
the application is protested within 30 days of lease assignment and no initial
compromise can be reached, VMRC must hold a public hearing on the application
[10]. Protests can come from nearby property owners, adjacent leaseholders, public
harvesters of oysters, or others.
Expansion of shellfish aquaculture provides several ecosystem services
similar to naturally occurring ones. Oysters continuously filter water, which

6
improves water quality through biosequestration and other removal pathways [15].
Oysters can also improve water clarity and promote growth of submerged aquatic
vegetation [16]. Since oysters are removed from the water before they die and can
spread certain diseases, aquaculture can also help limit the spread of disease to
wild populations [17]. Further, by providing a financially viable alternative to wild
harvesting, aquaculture offers the potential to enhance shellfish restoration in the
Bay. The aquaculture industry also employs hundreds of Virginia residents [8].
Previous Research
More research has been done on the subject using stated preference methods.
A survey of west coast residents did suggest a potential negative effect on
communities, but the results also indicated this was the result of a lack of public
knowledge of shellfish production [18]. In Washington State, the production of
Pacific geoduck clams has raised concerns among residents, businesses, and
nonprofits. The major concern is environmental impacts, but the aesthetic,
recreational, and economic impacts of the industry are also considered. Like in
Virginia, aquaculture permits are often challenged. Based on a series of
stakeholder interviews and analysis of current regulations, promoting aquaculture
best management practices and improving communication between stakeholders
could help improve the problem [19].

7
A 2010 study looked at residents’ perceptions of proposed aquaculture while
accounting for proximity to aquaculture sites and what recreational activities
residents use the water for. The authors found that residents that live closer to the
proposed sites and/or use the water more often were more likely to have more
negative perceptions of aquaculture sites, even if they agree the practice can
benefit the local economy [20]. A similar survey of stakeholders stressed the
importance of industry and the government communicating well with residents and
responding to their concerns. Residents of regions that overall had a more positive
perception of shellfish also had more awareness and knowledge of the industry
[21].
A recent report on challenges facing aquaculture included two case studies
on Virginia concerning the permitting processes and conflicts in the Lynnhaven
River. The authors stress the importance of developing trust between stakeholders,
public outreach, and working with stakeholders to evaluate the current permitting
process and regulations [3]. Other studies have stressed the need for more
valuation of coastal resources to support public decision-making [22,23].
Based on previous research and the concerns of some Virginia landowners,
production with cage equipment might have a different impact on property values

8
that spat-on-shell production, so a separate variable is included to evaluate these
effects.
Hedonic models are often used to determine the effects of property
characteristics on residential property prices, including the effects of coastal
resources [24,25]. Hedonic valuation is used to determine the implicit price of a
differentiated good, like a residential property. It uses the sale price of the good to
determine the value of individual characteristics, including those of the lot, house,
neighborhood, and environmental characteristics [6]. By observing consumer
choice and determining the implicit price of individual characteristics, the
willingness to pay for that characteristic can be found.
A few studies exist that discuss the potential effects of aquaculture on
residential property values, including one that found no significant effects of
aquaculture on property values in coastal Rhode Island. The results show that for
properties with a lot size of one acre or more, oyster aquaculture has a negative
effect on housing price. This suggests that wealthier landowners might consider
aquaculture as a factor when purchasing a home, while others do not. Distance
from the property to the nearest lease and if the property had a view of the water
were used to help determine the effect of aquaculture in the model [26].

9
Additional research examined the effect of Maine aquaculture on residential
property values. The study quantified the effect of oyster, salmon, cod, scallop, and
sea vegetable aquaculture on properties within two miles of an aquaculture lease.
The authors created an aquaculture index, incorporating information on number of
leases, intensity, and proximity to property sales, along with the water area within
a distance of the property. The results find limited effects, with the sign and
significance varying depending on the region. The area that showed a positive
impact has a long history of supporting the industry, and the region where it is
negative relies more on ecotourism and a more natural environmental state. This
suggests that localized attitudes of aquaculture could impact perceptions of
aquaculture and property values [27].
The proximity and intensity of environmental variables often have an impact
on property values. Hedonic models often include variables based on the area of an
environmental variable within a buffer distance of the property. These buffers are
either continuous circles or discrete bands. Both types of buffers are frequently
used in hedonic models to represent intensity of and proximity to environmental
variables, including tree cover, waterfront, and aquaculture [25,27,28].

10
Data
The hedonic model will use residential waterfront property sales from
mainland eastern Virginia from 2012 to 2016. Figure 1 indicates the counties and
independent cities included in the study area. Property sales are preferred over
other valuations like assessment values, so the model is based on market
transactions [6]. The data was purchased from University Data Portal to ensure the
uniformity which variables are included. Due to incomplete records of property
characteristics, property sales in Accomack, Northampton, Northumberland,
Richmond, Surry, and Westmoreland Counties could not be included. This time
frame was chosen since aquaculture activity before this point was not as
widespread and more complaints from landowners arose around this time [8]. The
data only includes single family homes sold in arms-length transactions. All sale
prices were converted to 2016 dollars using the Consumer Price Index. Property
values range from $12,167 and $3,500,000 with an average of $530,887. Any
property where a parcel edge is within 50 meters of the waterfront is included in
the model, and waterfront properties are indicated using a categorical variable.
Figure 2 is a map of sales observations, where each point represents the parcel
center of a property sold during the time frame.

11
Figure 1. Counties and Cities in Study Area

12
Figure 2. Location of Property Sales

13
Water quality has been shown to affect property values, including in the
Chesapeake Bay and its tributaries. Water clarity is one of the most visible water
quality measures and is often used in hedonic studies [25] It is influenced by other
measures, including dissolved oxygen and nitrogen levels. Lease location and
water quality are correlated, since growers consider it as a factor when choosing
where to lease [3] Oysters cannot be harvested for consumption in areas that are
too polluted since they filter water and are often consumed raw [29]. Water depth
is also a factor considered for lease location and could be correlated with lease
location, so average annual water depth is included as well.
The light attenuation coefficient (KD) is used in the model and represents
water clarity. The average light attenuation coefficient from the nearest monitoring
station for the spring and summer March-September) before the property was sold
is included in the model. The lower the coefficient, the clearer the water, so the
estimated coefficient in the model results is expected to be negative. Water clarity
and depth data was acquired from the Chesapeake Bay Program.
Oyster and clam aquaculture harvest data from 2012 to 2016 was obtained
from VMRC. A unique identifier distinguishes leases, called the lease number. If
any harvest on the lease occurred during a year, the lease is considered active and
could potentially affect a nearby property sold during that same year. This data

14
also includes information on species harvested and equipment used on each active
lease.
Table 1. Property Descriptive Statistics (n=2,245) Description Mean Std Dev Min Max Dependent
sale price 2016 dollars $530,887 $399,663 $12,167 $3,605,150 Independent
Structural
sqft living area 2,716 1,380 513 13,750 age age of house when sold 41 30 0 315 Lot
acres size of lot 1.67 2.95 0.06 67.80 waterfront =1 if waterfront 0.919 0.272 0 1 wqmean mean light attenuation (m-1) 1.161 0.800 0.504 6.757 depthmean mean annual depth (m) 9.003 4.712 1.097 18.222 Control
y2012 =1 if sold in 2012 0.163 0.369 0 1 y2013 =1 if sold in 2013 0.175 0.380 0 1 y2014 =1 if sold in 2014 0.193 0.395 0 1 y2015 =1 if sold in 2015 0.224 0.417 0 1 y2016 =1 if sold in 2016 0.245 0.430 0 1 block group 167 categorical variables for census block group.

15
The harvest data was merged, using lease number, with a current map of
shellfish aquaculture leases, also from VMRC. Some of the leases in the harvest
data were not successfully merged because there was no corresponding lease
number in the map data. This is most likely due to leases being assigned new lease
numbers between the active year and 2017, when the current map of aquaculture
leases was obtained. A new lease number is assigned when the lease transfers to a
new leaseholder or is re-surveyed. 925 leases were matched and active for at least
one year from 2012 to 2016. So, there is a chance that a lease that does not have
confirmed activity could still be active. Figure 3 shows the locations of all leases
and active leases, respectively. To better show both the leases and property sales,
Figure 4 shows all property sales and active leases near Suffolk City.

16
Figure 3. Maps of All Leases (Left) and Active Leases (Right)

17
Figure 4. Property Sales in Suffolk City and Active Leases within 500 Meters
The aquaculture data is used to calculate the percentage of the water area
within a buffer around each property is occupied by an aquaculture lease, in
buffers from 100 to 500 meters in radius, each with a radius 100 meters wider than
the previous one. The buffers are centered on the parcel center. These buffers are
smaller than the radius of buffers in similar studies. Smaller buffers were used
considering the geography of the Chesapeake Bay and nearby major rivers. Since

18
property owners are more concerned with cage equipment than spat-on-shell
operations, this method is repeated to find the percent area of water that includes
cage equipment and any lease regardless of activity. Figure 5 provides examples of
how the environmental variables were calculated. Categorical variables for
proximity to leases were also created to see if the presence of a lease has an effect.

19
Figure 5. Creating Environmental Variables1
1 See Appendix A for GIS Code Used to create lease variables
20
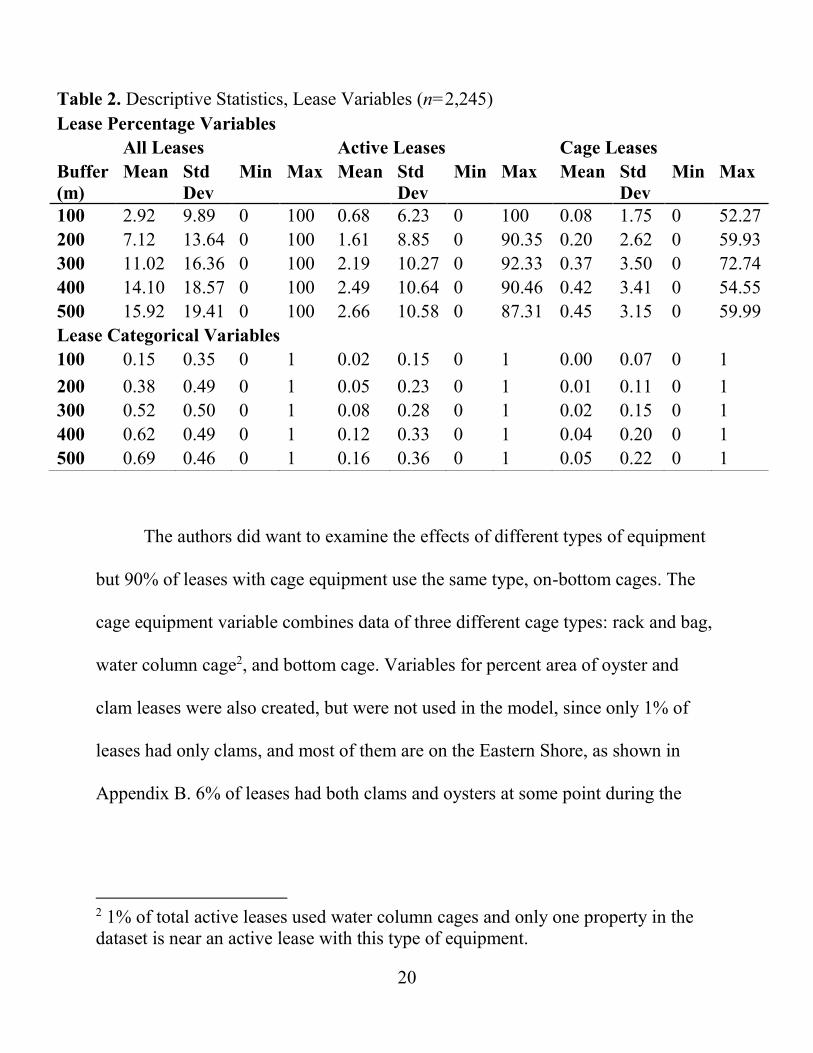
The authors did want to examine the effects of different types of equipment
but 90% of leases with cage equipment use the same type, on-bottom cages. The
cage equipment variable combines data of three different cage types: rack and bag,
water column cage2, and bottom cage. Variables for percent area of oyster and
clam leases were also created, but were not used in the model, since only 1% of
leases had only clams, and most of them are on the Eastern Shore, as shown in
Appendix B. 6% of leases had both clams and oysters at some point during the
2 1% of total active leases used water column cages and only one property in the dataset is near an active lease with this type of equipment.
Table 2. Descriptive Statistics, Lease Variables (n=2,245) Lease Percentage Variables
All Leases Active Leases Cage Leases Buffer (m)
Mean Std Dev
Min Max Mean Std Dev
Min Max Mean Std Dev
Min Max
100 2.92 9.89 0 100 0.68 6.23 0 100 0.08 1.75 0 52.27 200 7.12 13.64 0 100 1.61 8.85 0 90.35 0.20 2.62 0 59.93 300 11.02 16.36 0 100 2.19 10.27 0 92.33 0.37 3.50 0 72.74 400 14.10 18.57 0 100 2.49 10.64 0 90.46 0.42 3.41 0 54.55 500 15.92 19.41 0 100 2.66 10.58 0 87.31 0.45 3.15 0 59.99 Lease Categorical Variables 100 0.15 0.35 0 1 0.02 0.15 0 1 0.00 0.07 0 1 200 0.38 0.49 0 1 0.05 0.23 0 1 0.01 0.11 0 1 300 0.52 0.50 0 1 0.08 0.28 0 1 0.02 0.15 0 1 400 0.62 0.49 0 1 0.12 0.33 0 1 0.04 0.20 0 1 500 0.69 0.46 0 1 0.16 0.36 0 1 0.05 0.22 0 1

21
study period. Tables 3 and 4 contains more information about shellfish production
and lease location.
Table 3. Information on Lease Activity (n=925)
Cage Equipment Species
Equipment Type Num of Leases
Percent of Cage Leases
Percent of Total Leases Species
Num of Leases
Percent of Total Leases
rack and bag 12 6% 1% oysters 857 93% water column cage 8 4% 1% clams 11 1% bottom cage 185 90% 20% both 57 6% total 205 100% 22% total 925 100%
Table 4. Property Sales and Lease Types by County/City
City/County Property Sales
All Leasesa
Active Leases
Cage Leases
Oyster Leases
Clam Leases
Essex County 32 28 5 0 5 0 Gloucester County 297 562 71 14 68 3 Hampton City 257 118 26 5 26 0 Isle of Wight County 71 201 44 0 44 0 James City County 13 80 21 1 21 0 King and Queen County 11 83 29 2 28 1 King George County 27 16 3 2 3 0 Lancaster County 383 466 87 11 87 0 Matthews County 65 518 106 21 102 4 Middlesex County 236 332 53 19 52 1 New Kent County 4 26 3 1 3 0 Newport News City 102 63 14 0 14 0 Poquoson City 144 186 35 11 35 0 Suffolk City 106 141 23 1 23 0

22
Model
In a hedonic regression, the sale price of the property is the dependent
variable and the characteristics of the properties that affect that price are the
independent variables. The general function is specified as:
𝑠𝑎𝑙𝑒 𝑝𝑟𝑖𝑐𝑒 = 𝑓(𝑆, 𝐿, 𝑁, 𝐸), (1)
Where sale price is the sale price of the property, S is structural characteristics (e.g.
square feet, number of bathrooms, and age), L is lot characteristics (e.g. lot size
and slope), N is neighborhood and location characteristics (e.g. school district, and
census block group), and E is environmental characteristics (e.g. water depth,
water quality, and proximity to aquaculture).
There is little guidance on what functional form should be used for a hedonic
price function. Commonly used functional forms used include log-linear, double-
log, and quadratic. The log-linear functional for mis the most common form and is
used in this research [6].
Virginia Beach City 471 272 36 26 36 0 York County 26 233 57 8 56 1 Total 2,245 3,325 613 122 603 10 a. For any lease within 500m of a county or independent city. Leases within 500m of multiple counties are counted for both localities

23
The hedonic price function for this study is specified as:
ln(𝑠𝑎𝑙𝑒 𝑝𝑟𝑖𝑐𝑒)
= 𝛽0 + 𝛽1(𝑠𝑞𝑓𝑡) + 𝛽2(𝑎𝑐𝑟𝑒𝑠) + 𝛽3(𝑎𝑔𝑒) + 𝛽4(𝑎𝑐𝑡𝑙𝑒𝑎𝑠𝑒)
+ 𝛽5(𝑐𝑎𝑔𝑒𝑙𝑒𝑎𝑠𝑒) + 𝛽6(𝑤𝑞𝑚𝑒𝑎𝑛) + 𝛽6(𝑑𝑒𝑝𝑡ℎ𝑚𝑒𝑎𝑛)
+ 𝛽7(𝑤𝑎𝑡𝑒𝑟𝑓𝑟𝑜𝑛𝑡)+𝛽8(𝑦2013) + 𝛽9(𝑦2014)
+ 𝛽10(𝑦2015)+𝛽11(𝑦2016) + 𝛽 𝑏𝑔𝑟𝑜𝑢𝑝′ + 𝜀, (2)
where βi are coefficients to be estimated and used in analysis, actlease is the
percent area of water within a distance that contains an active lease, cagelease is
the percentage for active leases with equipment, bgroup’ represents census block
group categorical variables, and ε is a random error term. The model is estimated
five times, using buffers with different radiuses3.
Lot and structural characters included in the hedonic model are living square
footage (sqft), age of the house when sold (age), lot size in acres (acres), and a set
of categorical variables for the year the property was sold (y2013, y2014, y2015,
and y2016). Number of bedrooms and number of bathrooms were considered but
were not included in the model due to the high correlation between these variables
3 See Appendix C for Stata Code used for variable creation and modeling.

24
and square footage. The variables for years when sold and census block group are
control variables.
The effects, or implicit price of structural, neighborhood, and environmental
variables can be calculated by:
𝜕𝑠𝑎𝑙𝑒𝑝𝑟𝑖𝑐𝑒
𝜕𝑥𝑖= 𝛽𝑖 × 𝑠𝑎𝑙𝑒𝑝𝑟𝑖𝑐𝑒 (3)
The coefficients (βi) are equal to the percentage changes in sale price caused by an
increase of the variable by one unit. For example, increasing the square footage of
the home by one square foot will change the sale price by 𝛽𝑖 × 100 percent.
Omitted variable bias is a common concern for hedonic models. Many
factors can influence housing prices, and it is likely that an omitted variable is
correlated with ones that are included. This bias could lead to under- or over-
estimation of the effects of certain variables on sale prices. The unmatched leases
mentioned in the previous section are also a concern, since there could be
properties with active leases nearby that could not be accounted for. Additionally,
the lack of sales data for certain counties and cities in Virginia should be kept in
mind.

25
Results
The percent area of water within 300, 400, and 500 meters of the parcel
center that contains a shellfish aquaculture lease is significant and positive in the
results. For example, an increase of one percentage point of lease percentage
within 300 meters will increase the value of a property by 0.2%. The percent area
of water within 300, 400, and 500 meters of the parcel center is negative and
significant. A property would decrease in value by 1.1% if the cage lease
percentage increases by one percentage point. The cage lease percentage variable
for 100 meters is positive and significant.
Table 5. Model Results (n=2,245) Radius of Buffer (m)
100 200 300 400 500 sqft 0.00026*a 0.00026* 0.00026* 0.00026* 0.00026*
(0.00001)b (0.00001) (0.00001) (0.00001) (0.00001) acres 0.01811* 0.01842* 0.01883* 0.01864* 0.01851*
(0.00382) (0.00383) (0.00382) (0.00381) (0.00381) age 0.00034 0.00033 0.00030 0.00031 0.00032
(0.00038) (0.00038) (0.00038) (0.00038) (0.00038) actlease 0.00023 0.00135 0.00213*** 0.00253**c 0.00280**
(0.00179) (0.00137) (0.00124) (0.00121) (0.00123) cagelease 0.01015***d -0.00322 -0.01082* -0.01285* -0.01640*
(0.00590) (0.00411) (0.00323) (0.00330) (0.00356) wqmean -0.00136 -0.00225 -0.00400 -0.00580 -0.00225
(0.02958) (0.02960) (0.02956) (0.02956) (0.02954) depthmean 0.00530 0.00529 0.00510 0.00527 0.00525
(0.00448) (0.00449) (0.00448) (0.00447) (0.00447) waterfront 0.19534* 0.19586 0.19721* 0.19606* 0.19861*
(0.04119) (0.04121) (0.04111) (0.04107) (0.04101) R2 0.57910 0.57860 0.58070 0.58150 0.58280

26
a. Significant at 1% level b. Standard Error c. Significant at 5% level d. Significant at 10% level
The other major variables that show significance have an expected sign and
larger effect than the environmental variable. Both square footage and acreage are
positive and significant. Additionally, these coefficients do not change very much
between the five different models. For estimation results for the control variables,
see Appendix D.
Other models with different variables, including minimum and maximum
water quality and depth, and categorical variables for whether any lease is within a
distance of the property were considered for robustness. These models found
similar results as the results presented in Table 5. Models using discrete buffers
were also estimated, but these variables did not perform as well and do not make as
much sense in this application. Waterfront property owners observing leases are
looking out over the water and differences in distances might not matter as much
as it does in other applications. Results for these other models can be found in
Appendix E.
Table 6 shows the mean marginal willingness to pay for increasing a
variable by one unit, like one square foot of living space, one acre of land, or one

27
percentage point of lease area using mean sale price. For example, an increase of
one percentage point in cage lease percentage for the model with a 300-meter
buffer results in a decrease in mean sale price by $5,744.
Table 6. Mean Marginal Willingness to Pay (μ=$530,887) Radius of Buffer (m)
100 200 300 400 500 sqft 138 138 138 138 138 acres 9,615 9,782 9,997 9,896 9,826 age 181 177 161 166 169 actlease 121 718 1130 1344 1486 cagelease 5,387 -1,708 -5,744 -6,821 -8,706 wqmean -723 -1,193 -2,124 -3,077 -1,196 depthmean 2,815 2,808 2,708 2,800 2,790 waterfront 103,705 103,978 104,694 104,084 105,438
Discussion
The results show that active oyster aquaculture has a positive effect on
housing prices, while cage aquaculture has a negative effect.
The positive effect of oyster aquaculture, including the positive effect of
cage activity in the 100-meter buffer model, does not mean that landowners are
willing to pay to live near aquaculture. This positive effect could be caused by a
correlation between lease location and location of desirable waterfront properties.
Additionally, it could be the result of omitted variables that are highly correlated
with lease percentage. These could include bottom substrate, how well the area is

28
protected from storms, and the stability of the environment. Storms can damage
oyster operations and homes. Growers and homeowners might look for water with
more flushing and tidal changes, which create cleaner, fresher water. More
stagnant water is not as aesthetically pleasing and can also smell.
Although much of the conversation about aquaculture and residential
properties is centered on the waterfront, the presence of aquaculture could
influence the value of near-waterfront homes. Other hedonic studies of coastal
amenities include near-waterfront homes as well, and this could be examined with
properties that are farther from the waterfront [27]. The model could also be
expanded to include sales from other counties if more complete data can be
acquired.
Other factors of production and harvesting could also be considered in
another hedonic model. Since leaseholders report harvest data by month, the effect
of when during the year leases are harvested could be observed. Oyster harvest
activity might have a bigger impact on housing prices if harvest happens in the
spring and summer when residents are more likely to use the water for recreation.
However, there might not be enough variation in this information.
Recent collaboration among stakeholders have led to policy
recommendations and changes. In response to the 2016 legislation, a working

29
group of stakeholders in the Lynnhaven River area met and made several
recommendations to VMRC on potential policy changes, including requiring
leasing plans or permitting for cage equipment. No policy changes were made.
Lynnhaven residents also stressed the importance of better notifying nearby
residents of new lease applications [3].
The Virginia Secretary of Natural Resources formed the Clam and Oyster
Aquaculture Working Group composed of lawmakers and stakeholders to
collaborate in response to these conflicts and proposed legislation. The goal of the
working group is to address resource use conflicts. In 2019, two of their
recommendations were passed by the General Assembly and signed by the
governor. These measures focus on conflicts over dredging the Lynnhaven River
and other waterways in Virginia, but they do have implications on other concerns.
The bills increase transparency in the oyster leasing process and the creation of
riparian leases by waterfront landowners, which give landowners greater control of
the water adjacent to their property. They also increase leasing fees to discourage
leasing shellfish grounds by those who do not intend to grow clams and oysters
[30].
Regulators and those in the aquaculture industry often cite the lack of
evidence that aquaculture has any effect on property values, but agree that a

30
balance needs to be found among multiple resource users [31,32]. This study
provides evidence that cage aquaculture has a negative effect on nearby properties.
This evidence could support the claims that some landowners have about the
impact of oyster aquaculture. Stakeholders, policymakers, and others can use these
results to make better informed decisions and communicate better in the future
when considering changes and when discussing the resource use conflict.

31
References [1] A. Berleant, Proposed Surry oyster farm will change property values,
selectman holds, Wkly. Pack. (2013). http://weeklypacket.com/news/2013/jun/27/proposed-surry-oyster-farm-will-change-property-va/#.XNI2UI5KhPZ (accessed May 7, 2019).
[2] D. Mayfield, Virginia regulators leave Lynnhaven oyster rules unchanged, The Virginian-Pilot. (2016). https://pilotonline.com/news/local/environment/article_389aef82-3564-54f8-9fe3-ed7deb710c81.html (accessed May 7, 2019).
[3] National Sea Grant, Overcoming impediments to shellfish aquaculture through legal research and outreach: case studies, 2019.
[4] D. Mayfield, Virginia bill would dramatically increase cost of oyster, clam leases, The Virginian-Pilot. (2016). https://pilotonline.com/news/local/environment/article_82bfbfb0-788c-51a6-8d1d-e5ad4eb74688.html.
[5] D. Mayfield, Bills would enable more Virginia landowners to lease water off their properties, The Virginian-Pilot. (2017). https://pilotonline.com/news/local/environment/article_a850e5a1-3768-571b-b507-003c49468f99.html (accessed May 7, 2019).
[6] L.O. Taylor, Hedonics, in: P.A. Champ, K.J. Boyle, T.C. Brown (Eds.), A Prim. Nonmarket Valuat., 2017. doi:10.1007/978-94-007-7104-8.
[7] D.M. Schulte, History of the Virginia Oyster Fishery, Chesapeake Bay, USA, Front. Mar. Sci. 4 (2017) 127. doi:10.3389/fmars.2017.00127.
[8] K. Hudson, Virginia Shellfish Aquaculture Situation and Outlook Report. Results of the 2017 Virginia Shellfish Aquaculture Crop Reporting Survey, VIMS Mar. Resour. Rep. No. 2018-9. Virginia Sea Grant VSG-18-3. (2018) 20. www.vims.edu/map/aquaculture.
[9] Duration of lease, 1999. https://law.lis.virginia.gov/vacode/title28.2/chapter6/section28.2-613/ (accessed May 27, 2019).
[10] Virginia Marine Resources Commission, Application for oyster planting ground, (2019). https://webapps.mrc.virginia.gov/public/maps/chesapeakebay_map.php (accessed May 7, 2019).

32
[11] T.M. Mason, SB 1413 Oyster Planting Grounds; Lease Assignments, Virginia General Assembly, Richmond, VA, 2019. http://lis.virginia.gov/cgi-bin/legp604.exe?191+sum+SB1413 (accessed May 27, 2019).
[12] Mandatory Harvest Reporting., Virginia Administrative Code, 2013. https://law.lis.virginia.gov/admincode/title4/agency20/chapter610/section60/ (accessed May 27, 2019).
[13] Method and Manner of Marking., Virginia Administrative Code, 2016. https://law.lis.virginia.gov/admincode/title4/agency20/chapter290/section30/ (accessed May 27, 2019).
[14] Virginia Marine Resources Commission, Chesapeake Bay Map, (2019). https://webapps.mrc.virginia.gov/public/maps/chesapeakebay_map.php (accessed May 11, 2019).
[15] C.B. Higgins, K. Stephenson, B.L. Brown, Nutrient Bioassimilation Capacity of Aquacultured Oysters: Quantification of an Ecosystem Service, J. Environ. Qual. 40 (2010) 271. doi:10.2134/jeq2010.0203.
[16] J.H. Grabowski, R.D. Brumbaugh, R.F. Conrad, A.G. Keeler, J.J. Opaluch, C.H. Peterson, M.F. Piehler, S.P. Powers, A.R. Smyth, Economic Valuation of Ecosystem Services Provided by Oyster Reefs, Bioscience. 62 (2012) 900–909. doi:10.1525/bio.2012.62.10.10.
[17] T. Ben-Horin, C.A. Burge, D. Bushek, M.L. Groner, D.A. Proestou, L.I. Huey, G. Bidegain, R.B. Carnegie, Intensive oyster aquaculture can reduce disease impacts on sympatric wild oysters, Aquac. Environ. Interact. 10 (2018) 557–567. doi:10.3354/AEI00290.
[18] B. Hudson, Public Opinion of Shellfish Farming, 2016.
[19] C.M. Ryan, P.S. McDonald, D.S. Feinberg, L.W. Hall, J.G. Hamerly, C.W. Wright, Digging Deep: Managing Social and Policy Dimensions of Geoduck Aquaculture Conflict in Puget Sound, Washington, Coast. Manag. 45 (2016) 73–89. doi:10.1080/08920753.2017.1252628.
[20] C.S. Shafer, G.J. Inglis, V. Martin, Examining residents’ proximity, recreational use, and perceptions regarding proposed aquaculture development, Coast. Manag. 38 (2010) 559–574. doi:10.1080/08920753.2010.511700.
[21] N.A. Mazur, A.L. Curtis, Understanding community perceptions of aquaculture: Lessons from Australia, Aquac. Int. 16 (2008) 601–621.

33
doi:10.1007/s10499-008-9171-0.
[22] T. Börger, N.J. Beaumont, L. Pendleton, K.J. Boyle, P. Cooper, S. Fletcher, T. Haab, M. Hanemann, T.L. Hooper, S.S. Hussain, R. Portela, M. Stithou, J. Stockill, T. Taylor, M.C. Austen, Incorporating ecosystem services in marine planning: The role of valuation, Mar. Policy. 46 (2014) 161–170. doi:10.1016/j.marpol.2014.01.019.
[23] L. Pendleton, P. Atiyah, A. Moorthy, Is the non-market literature adequate to support coastal and marine management?, Ocean Coast. Manag. 50 (2007) 363–378. doi:10.1016/j.ocecoaman.2006.11.004.
[24] S. Gopalakrishnan, M.D. Smith, J.M. Slott, A.B. Murray, The value of disappearing beaches: A hedonic pricing model with endogenous beach width, J. Environ. Econ. Manage. 61 (2011) 297–310. doi:10.1016/j.jeem.2010.09.003.
[25] P. Walsh, C. Griffiths, D. Guignet, H. Klemick, Modeling the Property Price Impact of Water Quality in 14 Chesapeake Bay Counties, Ecol. Econ. 135 (2017) 103–113. doi:10.1016/j.ecolecon.2016.12.014.
[26] P.O. Sudhakaran, Three Essays on Shellfish Management in Rhode Island, 2015.
[27] K.S. Evans, X. Chen, C.A. Robichaud, Living in close quarters? A hedonic analysis of the impact of marine aquaculture on coastal housing prices in Maine, (2017).
[28] S.D. Siriwardena, K.J. Boyle, T.P. Holmes, P.E. Wiseman, The implicit value of tree cover in the U.S.: A meta-analysis of hedonic property value studies, Ecol. Econ. 128 (2016) 68–76. doi:10.1016/j.ecolecon.2016.04.016.
[29] Virginia Department of Health, Classification of Shellfish Growing Areas, (2019). http://www.vdh.virginia.gov/environmental-health/environmental-health-services/shellfish-safety/classification-of-shellfish-growing-areas/ (accessed May 11, 2019).
[30] M. Albiges, Virginia is cracking down on “bad actors” who lease oyster grounds to block dredging - Daily Press, Dly. Press. (2019). https://www.dailypress.com/news/virginia/dp-nws-oyster-dredging-vabeach-general-assembly-2019-story.html (accessed May 7, 2019).
[31] T.B. Wheeler, Bay Journal - Article: Lawyers not cannons the big guns in latest round of oyster wars, Bay J. (2019).

34
https://www.bayjournal.com/article/lawyers_not_cannons_the_big_guns_in_latest_round_of_oyster_wars (accessed May 7, 2019).
[32] A. Lefin, Report to understand the water uses of our bays, rivers, and seaside waters released, WSET Richmond. (2018). https://wset.com/news/local/report-to-understand-the-water-uses-of-our-bays-rivers-and-seaside-waters-released (accessed May 7, 2019).

35
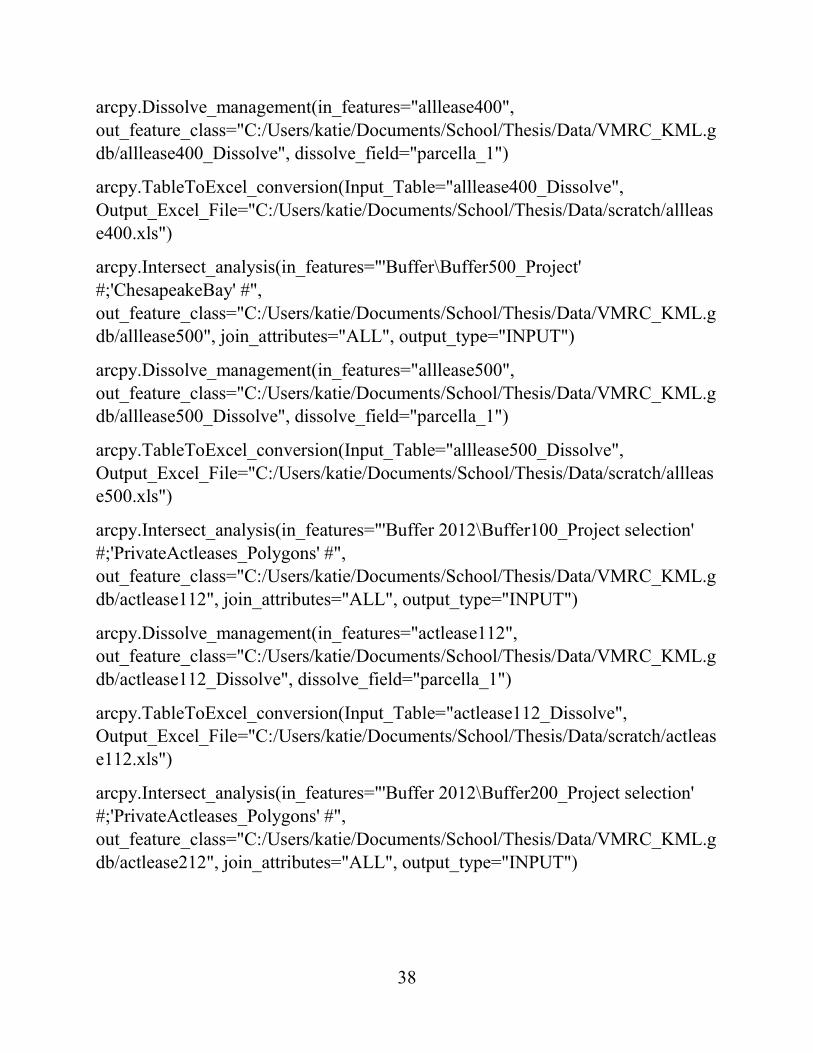
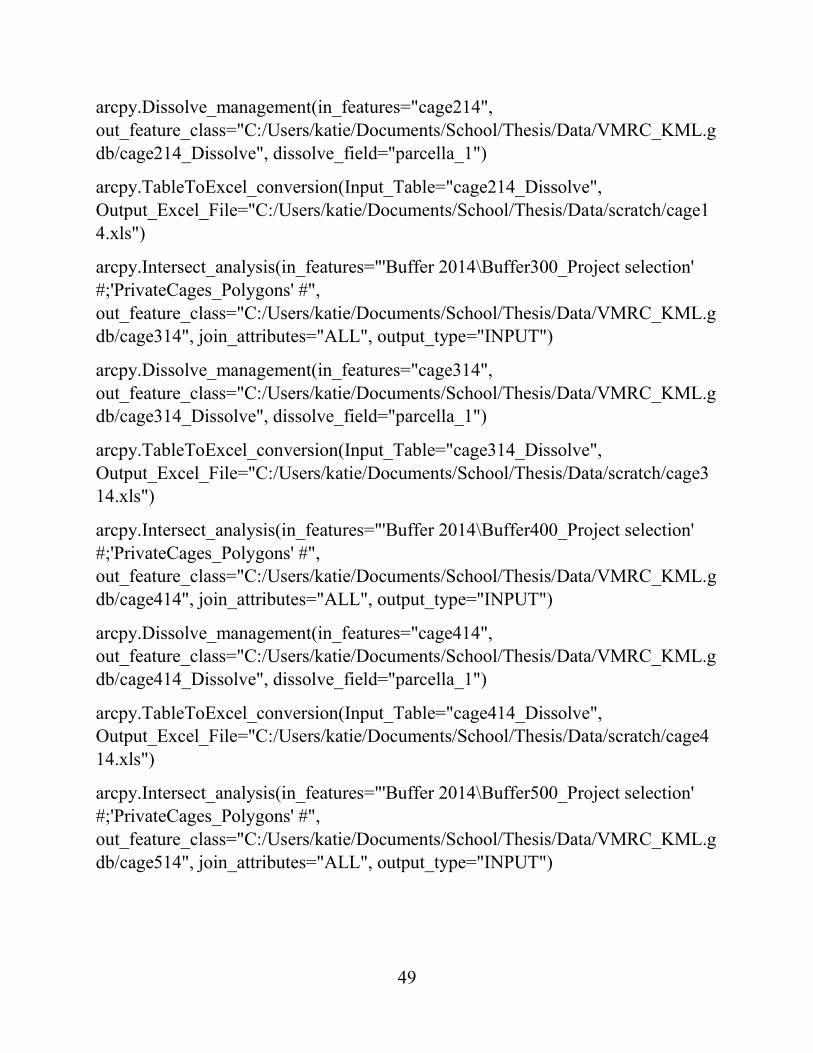
Appendices
Appendix A. GIS Code Code used in ArcMap 10.5 to calculate areas within buffers centered on the parcel center. The areas for water (water), any lease (alllease), active leases (actlease), and leases with cagement (cage) were calculated. The information was transferred to Microsoft Excel, then Stata.
import arcpy
arcpy.env.workspace= "C:\Users\Katie\Documents\School\Thesis\Data\VMRC_KML.gdb"
arcpy.Intersect_analysis(in_features="'Buffer\Buffer100_Project' #;'ChesapeakeBay' #", out_feature_class="C:/Users/katie/Documents/School/Thesis/Data/VMRC_KML.gdb/water100", join_attributes="ALL", output_type="INPUT")
arcpy.Dissolve_management(in_features="water100", out_feature_class="C:/Users/katie/Documents/School/Thesis/Data/VMRC_KML.gdb/water100_Dissolve", dissolve_field="parcella_1")
arcpy.TableToExcel_conversion(Input_Table="water100_Dissolve", Output_Excel_File="C:/Users/katie/Documents/School/Thesis/Data/scratch/water100.xls")
arcpy.Intersect_analysis(in_features="'Buffer\Buffer200_Project' #;'ChesapeakeBay' #", out_feature_class="C:/Users/katie/Documents/School/Thesis/Data/VMRC_KML.gdb/water200", join_attributes="ALL", output_type="INPUT")
arcpy.Dissolve_management(in_features="water200", out_feature_class="C:/Users/katie/Documents/School/Thesis/Data/VMRC_KML.gdb/water200_Dissolve", dissolve_field="parcella_1")
arcpy.TableToExcel_conversion(Input_Table="water200_Dissolve", Output_Excel_File="C:/Users/katie/Documents/School/Thesis/Data/scratch/water200.xls")
arcpy.Intersect_analysis(in_features="'Buffer\Buffer300_Project' #;'ChesapeakeBay' #",

36
out_feature_class="C:/Users/katie/Documents/School/Thesis/Data/VMRC_KML.gdb/water300", join_attributes="ALL", output_type="INPUT")
arcpy.Dissolve_management(in_features="water300", out_feature_class="C:/Users/katie/Documents/School/Thesis/Data/VMRC_KML.gdb/water300_Dissolve", dissolve_field="parcella_1")
arcpy.TableToExcel_conversion(Input_Table="water300_Dissolve", Output_Excel_File="C:/Users/katie/Documents/School/Thesis/Data/scratch/water300.xls")
arcpy.Intersect_analysis(in_features="'Buffer\Buffer400_Project' #;'ChesapeakeBay' #", out_feature_class="C:/Users/katie/Documents/School/Thesis/Data/VMRC_KML.gdb/water400", join_attributes="ALL", output_type="INPUT")
arcpy.Dissolve_management(in_features="water400", out_feature_class="C:/Users/katie/Documents/School/Thesis/Data/VMRC_KML.gdb/water400_Dissolve", dissolve_field="parcella_1")
arcpy.TableToExcel_conversion(Input_Table="water400_Dissolve", Output_Excel_File="C:/Users/katie/Documents/School/Thesis/Data/scratch/water400.xls")
arcpy.Intersect_analysis(in_features="'Buffer\Buffer500_Project' #;'ChesapeakeBay' #", out_feature_class="C:/Users/katie/Documents/School/Thesis/Data/VMRC_KML.gdb/water500", join_attributes="ALL", output_type="INPUT")
arcpy.Dissolve_management(in_features="water500", out_feature_class="C:/Users/katie/Documents/School/Thesis/Data/VMRC_KML.gdb/water500_Dissolve", dissolve_field="parcella_1")
arcpy.TableToExcel_conversion(Input_Table="water500_Dissolve", Output_Excel_File="C:/Users/katie/Documents/School/Thesis/Data/scratch/water500.xls")
arcpy.Intersect_analysis(in_features="'Buffer\Buffer100_Project' #;'ChesapeakeBay' #", out_feature_class="C:/Users/katie/Documents/School/Thesis/Data/VMRC_KML.gdb/alllease100", join_attributes="ALL", output_type="INPUT")

37
arcpy.Dissolve_management(in_features="alllease100", out_feature_class="C:/Users/katie/Documents/School/Thesis/Data/VMRC_KML.gdb/alllease100_Dissolve", dissolve_field="parcella_1")
arcpy.TableToExcel_conversion(Input_Table="alllease100_Dissolve", Output_Excel_File="C:/Users/katie/Documents/School/Thesis/Data/scratch/alllease100.xls")
arcpy.Intersect_analysis(in_features="'Buffer\Buffer200_Project' #;'ChesapeakeBay' #", out_feature_class="C:/Users/katie/Documents/School/Thesis/Data/VMRC_KML.gdb/alllease200", join_attributes="ALL", output_type="INPUT")
arcpy.Dissolve_management(in_features="alllease200", out_feature_class="C:/Users/katie/Documents/School/Thesis/Data/VMRC_KML.gdb/alllease200_Dissolve", dissolve_field="parcella_1")
arcpy.TableToExcel_conversion(Input_Table="alllease200_Dissolve", Output_Excel_File="C:/Users/katie/Documents/School/Thesis/Data/scratch/alllease200.xls")
arcpy.Intersect_analysis(in_features="'Buffer\Buffer300_Project' #;'ChesapeakeBay' #", out_feature_class="C:/Users/katie/Documents/School/Thesis/Data/VMRC_KML.gdb/alllease300", join_attributes="ALL", output_type="INPUT")
arcpy.Dissolve_management(in_features="alllease300", out_feature_class="C:/Users/katie/Documents/School/Thesis/Data/VMRC_KML.gdb/alllease300_Dissolve", dissolve_field="parcella_1")
arcpy.TableToExcel_conversion(Input_Table="alllease300_Dissolve", Output_Excel_File="C:/Users/katie/Documents/School/Thesis/Data/scratch/alllease300.xls")
arcpy.Intersect_analysis(in_features="'Buffer\Buffer400_Project' #;'ChesapeakeBay' #", out_feature_class="C:/Users/katie/Documents/School/Thesis/Data/VMRC_KML.gdb/alllease400", join_attributes="ALL", output_type="INPUT")
38
arcpy.Dissolve_management(in_features="alllease400", out_feature_class="C:/Users/katie/Documents/School/Thesis/Data/VMRC_KML.gdb/alllease400_Dissolve", dissolve_field="parcella_1")
arcpy.TableToExcel_conversion(Input_Table="alllease400_Dissolve", Output_Excel_File="C:/Users/katie/Documents/School/Thesis/Data/scratch/alllease400.xls")
arcpy.Intersect_analysis(in_features="'Buffer\Buffer500_Project' #;'ChesapeakeBay' #", out_feature_class="C:/Users/katie/Documents/School/Thesis/Data/VMRC_KML.gdb/alllease500", join_attributes="ALL", output_type="INPUT")
arcpy.Dissolve_management(in_features="alllease500", out_feature_class="C:/Users/katie/Documents/School/Thesis/Data/VMRC_KML.gdb/alllease500_Dissolve", dissolve_field="parcella_1")
arcpy.TableToExcel_conversion(Input_Table="alllease500_Dissolve", Output_Excel_File="C:/Users/katie/Documents/School/Thesis/Data/scratch/alllease500.xls")
arcpy.Intersect_analysis(in_features="'Buffer 2012\Buffer100_Project selection' #;'PrivateActleases_Polygons' #", out_feature_class="C:/Users/katie/Documents/School/Thesis/Data/VMRC_KML.gdb/actlease112", join_attributes="ALL", output_type="INPUT")
arcpy.Dissolve_management(in_features="actlease112", out_feature_class="C:/Users/katie/Documents/School/Thesis/Data/VMRC_KML.gdb/actlease112_Dissolve", dissolve_field="parcella_1")
arcpy.TableToExcel_conversion(Input_Table="actlease112_Dissolve", Output_Excel_File="C:/Users/katie/Documents/School/Thesis/Data/scratch/actlease112.xls")
arcpy.Intersect_analysis(in_features="'Buffer 2012\Buffer200_Project selection' #;'PrivateActleases_Polygons' #", out_feature_class="C:/Users/katie/Documents/School/Thesis/Data/VMRC_KML.gdb/actlease212", join_attributes="ALL", output_type="INPUT")

39
arcpy.Dissolve_management(in_features="actlease212", out_feature_class="C:/Users/katie/Documents/School/Thesis/Data/VMRC_KML.gdb/actlease212_Dissolve", dissolve_field="parcella_1")
arcpy.TableToExcel_conversion(Input_Table="actlease212_Dissolve", Output_Excel_File="C:/Users/katie/Documents/School/Thesis/Data/scratch/actlease12.xls")
arcpy.Intersect_analysis(in_features="'Buffer 2012\Buffer300_Project selection' #;'PrivateActleases_Polygons' #", out_feature_class="C:/Users/katie/Documents/School/Thesis/Data/VMRC_KML.gdb/actlease312", join_attributes="ALL", output_type="INPUT")
arcpy.Dissolve_management(in_features="actlease312", out_feature_class="C:/Users/katie/Documents/School/Thesis/Data/VMRC_KML.gdb/actlease312_Dissolve", dissolve_field="parcella_1")
arcpy.TableToExcel_conversion(Input_Table="actlease312_Dissolve", Output_Excel_File="C:/Users/katie/Documents/School/Thesis/Data/scratch/actlease312.xls")
arcpy.Intersect_analysis(in_features="'Buffer 2012\Buffer400_Project selection' #;'PrivateActleases_Polygons' #", out_feature_class="C:/Users/katie/Documents/School/Thesis/Data/VMRC_KML.gdb/actlease412", join_attributes="ALL", output_type="INPUT")
arcpy.Dissolve_management(in_features="actlease412", out_feature_class="C:/Users/katie/Documents/School/Thesis/Data/VMRC_KML.gdb/actlease412_Dissolve", dissolve_field="parcella_1")
arcpy.TableToExcel_conversion(Input_Table="actlease412_Dissolve", Output_Excel_File="C:/Users/katie/Documents/School/Thesis/Data/scratch/actlease412.xls")
arcpy.Intersect_analysis(in_features="'Buffer 2012\Buffer500_Project selection' #;'PrivateActleases_Polygons' #", out_feature_class="C:/Users/katie/Documents/School/Thesis/Data/VMRC_KML.gdb/actlease512", join_attributes="ALL", output_type="INPUT")

40
arcpy.Dissolve_management(in_features="actlease512", out_feature_class="C:/Users/katie/Documents/School/Thesis/Data/VMRC_KML.gdb/actlease512_Dissolve", dissolve_field="parcella_1")
arcpy.TableToExcel_conversion(Input_Table="actlease512_Dissolve", Output_Excel_File="C:/Users/katie/Documents/School/Thesis/Data/scratch/actlease512.xls")
arcpy.Intersect_analysis(in_features="'Buffer 2013\Buffer100_Project selection' #;'PrivateActleases_Polygons' #", out_feature_class="C:/Users/katie/Documents/School/Thesis/Data/VMRC_KML.gdb/actlease113", join_attributes="ALL", output_type="INPUT")
arcpy.Dissolve_management(in_features="actlease113", out_feature_class="C:/Users/katie/Documents/School/Thesis/Data/VMRC_KML.gdb/actlease113_Dissolve", dissolve_field="parcella_1")
arcpy.TableToExcel_conversion(Input_Table="actlease113_Dissolve", Output_Excel_File="C:/Users/katie/Documents/School/Thesis/Data/scratch/actlease113.xls")
arcpy.Intersect_analysis(in_features="'Buffer 2013\Buffer200_Project selection' #;'PrivateActleases_Polygons' #", out_feature_class="C:/Users/katie/Documents/School/Thesis/Data/VMRC_KML.gdb/actlease213", join_attributes="ALL", output_type="INPUT")
arcpy.Dissolve_management(in_features="actlease213", out_feature_class="C:/Users/katie/Documents/School/Thesis/Data/VMRC_KML.gdb/actlease213_Dissolve", dissolve_field="parcella_1")
arcpy.TableToExcel_conversion(Input_Table="actlease213_Dissolve", Output_Excel_File="C:/Users/katie/Documents/School/Thesis/Data/scratch/actlease13.xls")
arcpy.Intersect_analysis(in_features="'Buffer 2013\Buffer300_Project selection' #;'PrivateActleases_Polygons' #", out_feature_class="C:/Users/katie/Documents/School/Thesis/Data/VMRC_KML.gdb/actlease313", join_attributes="ALL", output_type="INPUT")

41
arcpy.Dissolve_management(in_features="actlease313", out_feature_class="C:/Users/katie/Documents/School/Thesis/Data/VMRC_KML.gdb/actlease313_Dissolve", dissolve_field="parcella_1")
arcpy.TableToExcel_conversion(Input_Table="actlease313_Dissolve", Output_Excel_File="C:/Users/katie/Documents/School/Thesis/Data/scratch/actlease313.xls")
arcpy.Intersect_analysis(in_features="'Buffer 2013\Buffer400_Project selection' #;'PrivateActleases_Polygons' #", out_feature_class="C:/Users/katie/Documents/School/Thesis/Data/VMRC_KML.gdb/actlease413", join_attributes="ALL", output_type="INPUT")
arcpy.Dissolve_management(in_features="actlease413", out_feature_class="C:/Users/katie/Documents/School/Thesis/Data/VMRC_KML.gdb/actlease413_Dissolve", dissolve_field="parcella_1")
arcpy.TableToExcel_conversion(Input_Table="actlease413_Dissolve", Output_Excel_File="C:/Users/katie/Documents/School/Thesis/Data/scratch/actlease413.xls")
arcpy.Intersect_analysis(in_features="'Buffer 2013\Buffer500_Project selection' #;'PrivateActleases_Polygons' #", out_feature_class="C:/Users/katie/Documents/School/Thesis/Data/VMRC_KML.gdb/actlease513", join_attributes="ALL", output_type="INPUT")
arcpy.Dissolve_management(in_features="actlease513", out_feature_class="C:/Users/katie/Documents/School/Thesis/Data/VMRC_KML.gdb/actlease513_Dissolve", dissolve_field="parcella_1")
arcpy.TableToExcel_conversion(Input_Table="actlease513_Dissolve", Output_Excel_File="C:/Users/katie/Documents/School/Thesis/Data/scratch/actlease513.xls")
arcpy.Intersect_analysis(in_features="'Buffer 2014\Buffer100_Project selection' #;'PrivateActleases_Polygons' #", out_feature_class="C:/Users/katie/Documents/School/Thesis/Data/VMRC_KML.gdb/actlease114", join_attributes="ALL", output_type="INPUT")

42
arcpy.Dissolve_management(in_features="actlease114", out_feature_class="C:/Users/katie/Documents/School/Thesis/Data/VMRC_KML.gdb/actlease114_Dissolve", dissolve_field="parcella_1")
arcpy.TableToExcel_conversion(Input_Table="actlease114_Dissolve", Output_Excel_File="C:/Users/katie/Documents/School/Thesis/Data/scratch/actlease114.xls")
arcpy.Intersect_analysis(in_features="'Buffer 2014\Buffer200_Project selection' #;'PrivateActleases_Polygons' #", out_feature_class="C:/Users/katie/Documents/School/Thesis/Data/VMRC_KML.gdb/actlease214", join_attributes="ALL", output_type="INPUT")
arcpy.Dissolve_management(in_features="actlease214", out_feature_class="C:/Users/katie/Documents/School/Thesis/Data/VMRC_KML.gdb/actlease214_Dissolve", dissolve_field="parcella_1")
arcpy.TableToExcel_conversion(Input_Table="actlease214_Dissolve", Output_Excel_File="C:/Users/katie/Documents/School/Thesis/Data/scratch/actlease14.xls")
arcpy.Intersect_analysis(in_features="'Buffer 2014\Buffer300_Project selection' #;'PrivateActleases_Polygons' #", out_feature_class="C:/Users/katie/Documents/School/Thesis/Data/VMRC_KML.gdb/actlease314", join_attributes="ALL", output_type="INPUT")
arcpy.Dissolve_management(in_features="actlease314", out_feature_class="C:/Users/katie/Documents/School/Thesis/Data/VMRC_KML.gdb/actlease314_Dissolve", dissolve_field="parcella_1")
arcpy.TableToExcel_conversion(Input_Table="actlease314_Dissolve", Output_Excel_File="C:/Users/katie/Documents/School/Thesis/Data/scratch/actlease314.xls")
arcpy.Intersect_analysis(in_features="'Buffer 2014\Buffer400_Project selection' #;'PrivateActleases_Polygons' #", out_feature_class="C:/Users/katie/Documents/School/Thesis/Data/VMRC_KML.gdb/actlease414", join_attributes="ALL", output_type="INPUT")

43
arcpy.Dissolve_management(in_features="actlease414", out_feature_class="C:/Users/katie/Documents/School/Thesis/Data/VMRC_KML.gdb/actlease414_Dissolve", dissolve_field="parcella_1")
arcpy.TableToExcel_conversion(Input_Table="actlease414_Dissolve", Output_Excel_File="C:/Users/katie/Documents/School/Thesis/Data/scratch/actlease414.xls")
arcpy.Intersect_analysis(in_features="'Buffer 2014\Buffer500_Project selection' #;'PrivateActleases_Polygons' #", out_feature_class="C:/Users/katie/Documents/School/Thesis/Data/VMRC_KML.gdb/actlease514", join_attributes="ALL", output_type="INPUT")
arcpy.Dissolve_management(in_features="actlease514", out_feature_class="C:/Users/katie/Documents/School/Thesis/Data/VMRC_KML.gdb/actlease514_Dissolve", dissolve_field="parcella_1")
arcpy.TableToExcel_conversion(Input_Table="actlease514_Dissolve", Output_Excel_File="C:/Users/katie/Documents/School/Thesis/Data/scratch/actlease514.xls")
arcpy.Intersect_analysis(in_features="'Buffer 2015\Buffer100_Project selection' #;'PrivateActleases_Polygons' #", out_feature_class="C:/Users/katie/Documents/School/Thesis/Data/VMRC_KML.gdb/actlease115", join_attributes="ALL", output_type="INPUT")
arcpy.Dissolve_management(in_features="actlease115", out_feature_class="C:/Users/katie/Documents/School/Thesis/Data/VMRC_KML.gdb/actlease115_Dissolve", dissolve_field="parcella_1")
arcpy.TableToExcel_conversion(Input_Table="actlease115_Dissolve", Output_Excel_File="C:/Users/katie/Documents/School/Thesis/Data/scratch/actlease115.xls")
arcpy.Intersect_analysis(in_features="'Buffer 2015\Buffer200_Project selection' #;'PrivateActleases_Polygons' #", out_feature_class="C:/Users/katie/Documents/School/Thesis/Data/VMRC_KML.gdb/actlease215", join_attributes="ALL", output_type="INPUT")

44
arcpy.Dissolve_management(in_features="actlease215", out_feature_class="C:/Users/katie/Documents/School/Thesis/Data/VMRC_KML.gdb/actlease215_Dissolve", dissolve_field="parcella_1")
arcpy.TableToExcel_conversion(Input_Table="actlease215_Dissolve", Output_Excel_File="C:/Users/katie/Documents/School/Thesis/Data/scratch/actlease15.xls")
arcpy.Intersect_analysis(in_features="'Buffer 2015\Buffer300_Project selection' #;'PrivateActleases_Polygons' #", out_feature_class="C:/Users/katie/Documents/School/Thesis/Data/VMRC_KML.gdb/actlease315", join_attributes="ALL", output_type="INPUT")
arcpy.Dissolve_management(in_features="actlease315", out_feature_class="C:/Users/katie/Documents/School/Thesis/Data/VMRC_KML.gdb/actlease315_Dissolve", dissolve_field="parcella_1")
arcpy.TableToExcel_conversion(Input_Table="actlease315_Dissolve", Output_Excel_File="C:/Users/katie/Documents/School/Thesis/Data/scratch/actlease315.xls")
arcpy.Intersect_analysis(in_features="'Buffer 2015\Buffer400_Project selection' #;'PrivateActleases_Polygons' #", out_feature_class="C:/Users/katie/Documents/School/Thesis/Data/VMRC_KML.gdb/actlease415", join_attributes="ALL", output_type="INPUT")
arcpy.Dissolve_management(in_features="actlease415", out_feature_class="C:/Users/katie/Documents/School/Thesis/Data/VMRC_KML.gdb/actlease415_Dissolve", dissolve_field="parcella_1")
arcpy.TableToExcel_conversion(Input_Table="actlease415_Dissolve", Output_Excel_File="C:/Users/katie/Documents/School/Thesis/Data/scratch/actlease415.xls")
arcpy.Intersect_analysis(in_features="'Buffer 2015\Buffer500_Project selection' #;'PrivateActleases_Polygons' #", out_feature_class="C:/Users/katie/Documents/School/Thesis/Data/VMRC_KML.gdb/actlease515", join_attributes="ALL", output_type="INPUT")

45
arcpy.Dissolve_management(in_features="actlease515", out_feature_class="C:/Users/katie/Documents/School/Thesis/Data/VMRC_KML.gdb/actlease515_Dissolve", dissolve_field="parcella_1")
arcpy.TableToExcel_conversion(Input_Table="actlease515_Dissolve", Output_Excel_File="C:/Users/katie/Documents/School/Thesis/Data/scratch/actlease515.xls")
arcpy.Intersect_analysis(in_features="'Buffer 2012\Buffer100_Project selection' #;'PrivateCages_Polygons' #", out_feature_class="C:/Users/katie/Documents/School/Thesis/Data/VMRC_KML.gdb/cage112", join_attributes="ALL", output_type="INPUT")
arcpy.Dissolve_management(in_features="cage112", out_feature_class="C:/Users/katie/Documents/School/Thesis/Data/VMRC_KML.gdb/cage112_Dissolve", dissolve_field="parcella_1")
arcpy.TableToExcel_conversion(Input_Table="cage112_Dissolve", Output_Excel_File="C:/Users/katie/Documents/School/Thesis/Data/scratch/cage112.xls")
arcpy.Intersect_analysis(in_features="'Buffer 2012\Buffer200_Project selection' #;'PrivateCages_Polygons' #", out_feature_class="C:/Users/katie/Documents/School/Thesis/Data/VMRC_KML.gdb/cage212", join_attributes="ALL", output_type="INPUT")
arcpy.Dissolve_management(in_features="cage212", out_feature_class="C:/Users/katie/Documents/School/Thesis/Data/VMRC_KML.gdb/cage212_Dissolve", dissolve_field="parcella_1")
arcpy.TableToExcel_conversion(Input_Table="cage212_Dissolve", Output_Excel_File="C:/Users/katie/Documents/School/Thesis/Data/scratch/cage12.xls")
arcpy.Intersect_analysis(in_features="'Buffer 2012\Buffer300_Project selection' #;'PrivateCages_Polygons' #", out_feature_class="C:/Users/katie/Documents/School/Thesis/Data/VMRC_KML.gdb/cage312", join_attributes="ALL", output_type="INPUT")

46
arcpy.Dissolve_management(in_features="cage312", out_feature_class="C:/Users/katie/Documents/School/Thesis/Data/VMRC_KML.gdb/cage312_Dissolve", dissolve_field="parcella_1")
arcpy.TableToExcel_conversion(Input_Table="cage312_Dissolve", Output_Excel_File="C:/Users/katie/Documents/School/Thesis/Data/scratch/cage312.xls")
arcpy.Intersect_analysis(in_features="'Buffer 2012\Buffer400_Project selection' #;'PrivateCages_Polygons' #", out_feature_class="C:/Users/katie/Documents/School/Thesis/Data/VMRC_KML.gdb/cage412", join_attributes="ALL", output_type="INPUT")
arcpy.Dissolve_management(in_features="cage412", out_feature_class="C:/Users/katie/Documents/School/Thesis/Data/VMRC_KML.gdb/cage412_Dissolve", dissolve_field="parcella_1")
arcpy.TableToExcel_conversion(Input_Table="cage412_Dissolve", Output_Excel_File="C:/Users/katie/Documents/School/Thesis/Data/scratch/cage412.xls")
arcpy.Intersect_analysis(in_features="'Buffer 2012\Buffer500_Project selection' #;'PrivateCages_Polygons' #", out_feature_class="C:/Users/katie/Documents/School/Thesis/Data/VMRC_KML.gdb/cage512", join_attributes="ALL", output_type="INPUT")
arcpy.Dissolve_management(in_features="cage512", out_feature_class="C:/Users/katie/Documents/School/Thesis/Data/VMRC_KML.gdb/cage512_Dissolve", dissolve_field="parcella_1")
arcpy.TableToExcel_conversion(Input_Table="cage512_Dissolve", Output_Excel_File="C:/Users/katie/Documents/School/Thesis/Data/scratch/cage512.xls")
arcpy.Intersect_analysis(in_features="'Buffer 2013\Buffer100_Project selection' #;'PrivateCages_Polygons' #", out_feature_class="C:/Users/katie/Documents/School/Thesis/Data/VMRC_KML.gdb/cage113", join_attributes="ALL", output_type="INPUT")

47
arcpy.Dissolve_management(in_features="cage113", out_feature_class="C:/Users/katie/Documents/School/Thesis/Data/VMRC_KML.gdb/cage113_Dissolve", dissolve_field="parcella_1")
arcpy.TableToExcel_conversion(Input_Table="cage113_Dissolve", Output_Excel_File="C:/Users/katie/Documents/School/Thesis/Data/scratch/cage113.xls")
arcpy.Intersect_analysis(in_features="'Buffer 2013\Buffer200_Project selection' #;'PrivateCages_Polygons' #", out_feature_class="C:/Users/katie/Documents/School/Thesis/Data/VMRC_KML.gdb/cage213", join_attributes="ALL", output_type="INPUT")
arcpy.Dissolve_management(in_features="cage213", out_feature_class="C:/Users/katie/Documents/School/Thesis/Data/VMRC_KML.gdb/cage213_Dissolve", dissolve_field="parcella_1")
arcpy.TableToExcel_conversion(Input_Table="cage213_Dissolve", Output_Excel_File="C:/Users/katie/Documents/School/Thesis/Data/scratch/cage13.xls")
arcpy.Intersect_analysis(in_features="'Buffer 2013\Buffer300_Project selection' #;'PrivateCages_Polygons' #", out_feature_class="C:/Users/katie/Documents/School/Thesis/Data/VMRC_KML.gdb/cage313", join_attributes="ALL", output_type="INPUT")
arcpy.Dissolve_management(in_features="cage313", out_feature_class="C:/Users/katie/Documents/School/Thesis/Data/VMRC_KML.gdb/cage313_Dissolve", dissolve_field="parcella_1")
arcpy.TableToExcel_conversion(Input_Table="cage313_Dissolve", Output_Excel_File="C:/Users/katie/Documents/School/Thesis/Data/scratch/cage313.xls")
arcpy.Intersect_analysis(in_features="'Buffer 2013\Buffer400_Project selection' #;'PrivateCages_Polygons' #", out_feature_class="C:/Users/katie/Documents/School/Thesis/Data/VMRC_KML.gdb/cage413", join_attributes="ALL", output_type="INPUT")

48
arcpy.Dissolve_management(in_features="cage413", out_feature_class="C:/Users/katie/Documents/School/Thesis/Data/VMRC_KML.gdb/cage413_Dissolve", dissolve_field="parcella_1")
arcpy.TableToExcel_conversion(Input_Table="cage413_Dissolve", Output_Excel_File="C:/Users/katie/Documents/School/Thesis/Data/scratch/cage413.xls")
arcpy.Intersect_analysis(in_features="'Buffer 2013\Buffer500_Project selection' #;'PrivateCages_Polygons' #", out_feature_class="C:/Users/katie/Documents/School/Thesis/Data/VMRC_KML.gdb/cage513", join_attributes="ALL", output_type="INPUT")
arcpy.Dissolve_management(in_features="cage513", out_feature_class="C:/Users/katie/Documents/School/Thesis/Data/VMRC_KML.gdb/cage513_Dissolve", dissolve_field="parcella_1")
arcpy.TableToExcel_conversion(Input_Table="cage513_Dissolve", Output_Excel_File="C:/Users/katie/Documents/School/Thesis/Data/scratch/cage513.xls")
arcpy.Intersect_analysis(in_features="'Buffer 2014\Buffer100_Project selection' #;'PrivateCages_Polygons' #", out_feature_class="C:/Users/katie/Documents/School/Thesis/Data/VMRC_KML.gdb/cage114", join_attributes="ALL", output_type="INPUT")
arcpy.Dissolve_management(in_features="cage114", out_feature_class="C:/Users/katie/Documents/School/Thesis/Data/VMRC_KML.gdb/cage114_Dissolve", dissolve_field="parcella_1")
arcpy.TableToExcel_conversion(Input_Table="cage114_Dissolve", Output_Excel_File="C:/Users/katie/Documents/School/Thesis/Data/scratch/cage114.xls")
arcpy.Intersect_analysis(in_features="'Buffer 2014\Buffer200_Project selection' #;'PrivateCages_Polygons' #", out_feature_class="C:/Users/katie/Documents/School/Thesis/Data/VMRC_KML.gdb/cage214", join_attributes="ALL", output_type="INPUT")
49
arcpy.Dissolve_management(in_features="cage214", out_feature_class="C:/Users/katie/Documents/School/Thesis/Data/VMRC_KML.gdb/cage214_Dissolve", dissolve_field="parcella_1")
arcpy.TableToExcel_conversion(Input_Table="cage214_Dissolve", Output_Excel_File="C:/Users/katie/Documents/School/Thesis/Data/scratch/cage14.xls")
arcpy.Intersect_analysis(in_features="'Buffer 2014\Buffer300_Project selection' #;'PrivateCages_Polygons' #", out_feature_class="C:/Users/katie/Documents/School/Thesis/Data/VMRC_KML.gdb/cage314", join_attributes="ALL", output_type="INPUT")
arcpy.Dissolve_management(in_features="cage314", out_feature_class="C:/Users/katie/Documents/School/Thesis/Data/VMRC_KML.gdb/cage314_Dissolve", dissolve_field="parcella_1")
arcpy.TableToExcel_conversion(Input_Table="cage314_Dissolve", Output_Excel_File="C:/Users/katie/Documents/School/Thesis/Data/scratch/cage314.xls")
arcpy.Intersect_analysis(in_features="'Buffer 2014\Buffer400_Project selection' #;'PrivateCages_Polygons' #", out_feature_class="C:/Users/katie/Documents/School/Thesis/Data/VMRC_KML.gdb/cage414", join_attributes="ALL", output_type="INPUT")
arcpy.Dissolve_management(in_features="cage414", out_feature_class="C:/Users/katie/Documents/School/Thesis/Data/VMRC_KML.gdb/cage414_Dissolve", dissolve_field="parcella_1")
arcpy.TableToExcel_conversion(Input_Table="cage414_Dissolve", Output_Excel_File="C:/Users/katie/Documents/School/Thesis/Data/scratch/cage414.xls")
arcpy.Intersect_analysis(in_features="'Buffer 2014\Buffer500_Project selection' #;'PrivateCages_Polygons' #", out_feature_class="C:/Users/katie/Documents/School/Thesis/Data/VMRC_KML.gdb/cage514", join_attributes="ALL", output_type="INPUT")

50
arcpy.Dissolve_management(in_features="cage514", out_feature_class="C:/Users/katie/Documents/School/Thesis/Data/VMRC_KML.gdb/cage514_Dissolve", dissolve_field="parcella_1")
arcpy.TableToExcel_conversion(Input_Table="cage514_Dissolve", Output_Excel_File="C:/Users/katie/Documents/School/Thesis/Data/scratch/cage514.xls")
arcpy.Intersect_analysis(in_features="'Buffer 2015\Buffer100_Project selection' #;'PrivateCages_Polygons' #", out_feature_class="C:/Users/katie/Documents/School/Thesis/Data/VMRC_KML.gdb/cage115", join_attributes="ALL", output_type="INPUT")
arcpy.Dissolve_management(in_features="cage115", out_feature_class="C:/Users/katie/Documents/School/Thesis/Data/VMRC_KML.gdb/cage115_Dissolve", dissolve_field="parcella_1")
arcpy.TableToExcel_conversion(Input_Table="cage115_Dissolve", Output_Excel_File="C:/Users/katie/Documents/School/Thesis/Data/scratch/cage115.xls")
arcpy.Intersect_analysis(in_features="'Buffer 2015\Buffer200_Project selection' #;'PrivateCages_Polygons' #", out_feature_class="C:/Users/katie/Documents/School/Thesis/Data/VMRC_KML.gdb/cage215", join_attributes="ALL", output_type="INPUT")
arcpy.Dissolve_management(in_features="cage215", out_feature_class="C:/Users/katie/Documents/School/Thesis/Data/VMRC_KML.gdb/cage215_Dissolve", dissolve_field="parcella_1")
arcpy.TableToExcel_conversion(Input_Table="cage215_Dissolve", Output_Excel_File="C:/Users/katie/Documents/School/Thesis/Data/scratch/cage15.xls")
arcpy.Intersect_analysis(in_features="'Buffer 2015\Buffer300_Project selection' #;'PrivateCages_Polygons' #", out_feature_class="C:/Users/katie/Documents/School/Thesis/Data/VMRC_KML.gdb/cage315", join_attributes="ALL", output_type="INPUT")

51
arcpy.Dissolve_management(in_features="cage315", out_feature_class="C:/Users/katie/Documents/School/Thesis/Data/VMRC_KML.gdb/cage315_Dissolve", dissolve_field="parcella_1")
arcpy.TableToExcel_conversion(Input_Table="cage315_Dissolve", Output_Excel_File="C:/Users/katie/Documents/School/Thesis/Data/scratch/cage315.xls")
arcpy.Intersect_analysis(in_features="'Buffer 2015\Buffer400_Project selection' #;'PrivateCages_Polygons' #", out_feature_class="C:/Users/katie/Documents/School/Thesis/Data/VMRC_KML.gdb/cage415", join_attributes="ALL", output_type="INPUT")
arcpy.Dissolve_management(in_features="cage415", out_feature_class="C:/Users/katie/Documents/School/Thesis/Data/VMRC_KML.gdb/cage415_Dissolve", dissolve_field="parcella_1")
arcpy.TableToExcel_conversion(Input_Table="cage415_Dissolve", Output_Excel_File="C:/Users/katie/Documents/School/Thesis/Data/scratch/cage415.xls")
arcpy.Intersect_analysis(in_features="'Buffer 2015\Buffer500_Project selection' #;'PrivateCages_Polygons' #", out_feature_class="C:/Users/katie/Documents/School/Thesis/Data/VMRC_KML.gdb/cage515", join_attributes="ALL", output_type="INPUT")
arcpy.Dissolve_management(in_features="cage515", out_feature_class="C:/Users/katie/Documents/School/Thesis/Data/VMRC_KML.gdb/cage515_Dissolve", dissolve_field="parcella_1")
arcpy.TableToExcel_conversion(Input_Table="cage515_Dissolve", Output_Excel_File="C:/Users/katie/Documents/School/Thesis/Data/scratch/cage515.xls")

52
Appendix B. Map of Active Oyster (Purple) and Clam (Red) Leases

53
Appendix C. Stata Code This code was used in Stata 14.2 to import GIS data, create lease percentages and other variables, and run regressions import excel "C:\Users\CAUSRE User\Documents\water100.xls", sheet("water100") firstrow clear drop OBJECTID Shape_Length rename parcella_1 gisunique rename Shape_Area water100 save "C:\Users\CAUSRE User\Documents\water100.dta" import excel "C:\Users\CAUSRE User\Documents\water200.xls", sheet("water200") firstrow clear drop OBJECTID Shape_Length rename parcella_1 gisunique rename Shape_Area water200 save "C:\Users\CAUSRE User\Documents\water200.dta" import excel "C:\Users\CAUSRE User\Documents\water300.xls", sheet("water300") firstrow clear drop OBJECTID Shape_Length rename parcella_1 gisunique rename Shape_Area water300 save "C:\Users\CAUSRE User\Documents\water300.dta" import excel "C:\Users\CAUSRE User\Documents\water400.xls", sheet("water400") firstrow clear drop OBJECTID Shape_Length rename parcella_1 gisunique rename Shape_Area water400 save "C:\Users\CAUSRE User\Documents\water400.dta" import excel "C:\Users\CAUSRE User\Documents\water500.xls", sheet("water500") firstrow clear drop OBJECTID Shape_Length rename parcella_1 gisunique rename Shape_Area water500 save "C:\Users\CAUSRE User\Documents\water500.dta"

54
import excel "C:\Users\CAUSRE User\Documents\alllease112.xls", sheet("alllease112") firstrow clear save "C:\Users\CAUSRE User\Documents\alllease112.dta" import excel "C:\Users\CAUSRE User\Documents\alllease212.xls", sheet("alllease212") firstrow clear save "C:\Users\CAUSRE User\Documents\alllease212.dta" import excel "C:\Users\CAUSRE User\Documents\alllease312.xls", sheet("alllease312") firstrow clear save "C:\Users\CAUSRE User\Documents\alllease312.dta" import excel "C:\Users\CAUSRE User\Documents\alllease412.xls", sheet("alllease412") firstrow clear save "C:\Users\CAUSRE User\Documents\alllease412.dta" import excel "C:\Users\CAUSRE User\Documents\alllease512.xls", sheet("alllease512") firstrow clear save "C:\Users\CAUSRE User\Documents\alllease512.dta" import excel "C:\Users\CAUSRE User\Documents\alllease113.xls", sheet("alllease113") firstrow clear save "C:\Users\CAUSRE User\Documents\alllease113.dta" import excel "C:\Users\CAUSRE User\Documents\alllease213.xls", sheet("alllease213") firstrow clear save "C:\Users\CAUSRE User\Documents\alllease213.dta" import excel "C:\Users\CAUSRE User\Documents\alllease313.xls", sheet("alllease313") firstrow clear save "C:\Users\CAUSRE User\Documents\alllease313.dta" import excel "C:\Users\CAUSRE User\Documents\alllease413.xls", sheet("alllease413") firstrow clear save "C:\Users\CAUSRE User\Documents\alllease413.dta" import excel "C:\Users\CAUSRE User\Documents\alllease513.xls", sheet("alllease513") firstrow clear save "C:\Users\CAUSRE User\Documents\alllease513.dta" import excel "C:\Users\CAUSRE User\Documents\alllease114.xls", sheet("alllease114") firstrow clear save "C:\Users\CAUSRE User\Documents\alllease114.dta" import excel "C:\Users\CAUSRE User\Documents\alllease214.xls", sheet("alllease214") firstrow clear save "C:\Users\CAUSRE User\Documents\alllease214.dta"

55
import excel "C:\Users\CAUSRE User\Documents\alllease314.xls", sheet("alllease314") firstrow clear save "C:\Users\CAUSRE User\Documents\alllease314.dta" import excel "C:\Users\CAUSRE User\Documents\alllease414.xls", sheet("alllease414") firstrow clear save "C:\Users\CAUSRE User\Documents\alllease414.dta" import excel "C:\Users\CAUSRE User\Documents\alllease514.xls", sheet("alllease514") firstrow clear save "C:\Users\CAUSRE User\Documents\alllease514.dta" import excel "C:\Users\CAUSRE User\Documents\alllease115.xls", sheet("alllease115") firstrow clear save "C:\Users\CAUSRE User\Documents\alllease115.dta" import excel "C:\Users\CAUSRE User\Documents\alllease215.xls", sheet("alllease215") firstrow clear save "C:\Users\CAUSRE User\Documents\alllease215.dta" import excel "C:\Users\CAUSRE User\Documents\alllease315.xls", sheet("alllease315") firstrow clear save "C:\Users\CAUSRE User\Documents\alllease315.dta" import excel "C:\Users\CAUSRE User\Documents\alllease415.xls", sheet("alllease415") firstrow clear save "C:\Users\CAUSRE User\Documents\alllease415.dta" import excel "C:\Users\CAUSRE User\Documents\alllease515.xls", sheet("alllease515") firstrow clear save "C:\Users\CAUSRE User\Documents\alllease515.dta" import excel "C:\Users\CAUSRE User\Documents\alllease116.xls", sheet("alllease116") firstrow clear save "C:\Users\CAUSRE User\Documents\alllease116.dta" import excel "C:\Users\CAUSRE User\Documents\alllease216.xls", sheet("alllease216") firstrow clear save "C:\Users\CAUSRE User\Documents\alllease216.dta" import excel "C:\Users\CAUSRE User\Documents\alllease316.xls", sheet("alllease316") firstrow clear save "C:\Users\CAUSRE User\Documents\alllease316.dta" import excel "C:\Users\CAUSRE User\Documents\alllease416.xls", sheet("alllease416") firstrow clear save "C:\Users\CAUSRE User\Documents\alllease416.dta"

56
import excel "C:\Users\CAUSRE User\Documents\alllease516.xls", sheet("alllease516") firstrow clear save "C:\Users\CAUSRE User\Documents\alllease516.dta" import excel "C:\Users\CAUSRE User\Documents\actlease112.xls", sheet("actlease112") firstrow clear save "C:\Users\CAUSRE User\Documents\actlease112.dta" import excel "C:\Users\CAUSRE User\Documents\actlease212.xls", sheet("actlease212") firstrow clear save "C:\Users\CAUSRE User\Documents\actlease212.dta" import excel "C:\Users\CAUSRE User\Documents\actlease312.xls", sheet("actlease312") firstrow clear save "C:\Users\CAUSRE User\Documents\actlease312.dta" import excel "C:\Users\CAUSRE User\Documents\actlease412.xls", sheet("actlease412") firstrow clear save "C:\Users\CAUSRE User\Documents\actlease412.dta" import excel "C:\Users\CAUSRE User\Documents\actlease512.xls", sheet("actlease512") firstrow clear save "C:\Users\CAUSRE User\Documents\actlease512.dta" import excel "C:\Users\CAUSRE User\Documents\actlease113.xls", sheet("actlease113") firstrow clear save "C:\Users\CAUSRE User\Documents\actlease113.dta" import excel "C:\Users\CAUSRE User\Documents\actlease213.xls", sheet("actlease213") firstrow clear save "C:\Users\CAUSRE User\Documents\actlease213.dta" import excel "C:\Users\CAUSRE User\Documents\actlease313.xls", sheet("actlease313") firstrow clear save "C:\Users\CAUSRE User\Documents\actlease313.dta" import excel "C:\Users\CAUSRE User\Documents\actlease413.xls", sheet("actlease413") firstrow clear save "C:\Users\CAUSRE User\Documents\actlease413.dta" import excel "C:\Users\CAUSRE User\Documents\actlease513.xls", sheet("actlease513") firstrow clear save "C:\Users\CAUSRE User\Documents\actlease513.dta" import excel "C:\Users\CAUSRE User\Documents\actlease114.xls", sheet("actlease114") firstrow clear save "C:\Users\CAUSRE User\Documents\actlease114.dta"

57
import excel "C:\Users\CAUSRE User\Documents\actlease214.xls", sheet("actlease214") firstrow clear save "C:\Users\CAUSRE User\Documents\actlease214.dta" import excel "C:\Users\CAUSRE User\Documents\actlease314.xls", sheet("actlease314") firstrow clear save "C:\Users\CAUSRE User\Documents\actlease314.dta" import excel "C:\Users\CAUSRE User\Documents\actlease414.xls", sheet("actlease414") firstrow clear save "C:\Users\CAUSRE User\Documents\actlease414.dta" import excel "C:\Users\CAUSRE User\Documents\actlease514.xls", sheet("actlease514") firstrow clear save "C:\Users\CAUSRE User\Documents\actlease514.dta" import excel "C:\Users\CAUSRE User\Documents\actlease115.xls", sheet("actlease115") firstrow clear save "C:\Users\CAUSRE User\Documents\actlease115.dta" import excel "C:\Users\CAUSRE User\Documents\actlease215.xls", sheet("actlease215") firstrow clear save "C:\Users\CAUSRE User\Documents\actlease215.dta" import excel "C:\Users\CAUSRE User\Documents\actlease315.xls", sheet("actlease315") firstrow clear save "C:\Users\CAUSRE User\Documents\actlease315.dta" import excel "C:\Users\CAUSRE User\Documents\actlease415.xls", sheet("actlease415") firstrow clear save "C:\Users\CAUSRE User\Documents\actlease415.dta" import excel "C:\Users\CAUSRE User\Documents\actlease515.xls", sheet("actlease515") firstrow clear save "C:\Users\CAUSRE User\Documents\actlease515.dta" import excel "C:\Users\CAUSRE User\Documents\actlease116.xls", sheet("actlease116") firstrow clear save "C:\Users\CAUSRE User\Documents\actlease116.dta" import excel "C:\Users\CAUSRE User\Documents\actlease216.xls", sheet("actlease216") firstrow clear save "C:\Users\CAUSRE User\Documents\actlease216.dta" import excel "C:\Users\CAUSRE User\Documents\actlease316.xls", sheet("actlease316") firstrow clear save "C:\Users\CAUSRE User\Documents\actlease316.dta"

58
import excel "C:\Users\CAUSRE User\Documents\actlease416.xls", sheet("actlease416") firstrow clear save "C:\Users\CAUSRE User\Documents\actlease416.dta" import excel "C:\Users\CAUSRE User\Documents\actlease516.xls", sheet("actlease516") firstrow clear save "C:\Users\CAUSRE User\Documents\actlease516.dta" import excel "C:\Users\CAUSRE User\Documents\cage112.xls", sheet("cage112") firstrow clear save "C:\Users\CAUSRE User\Documents\cage112.dta" import excel "C:\Users\CAUSRE User\Documents\cage212.xls", sheet("cage212") firstrow clear save "C:\Users\CAUSRE User\Documents\cage212.dta" import excel "C:\Users\CAUSRE User\Documents\cage312.xls", sheet("cage312") firstrow clear save "C:\Users\CAUSRE User\Documents\cage312.dta" import excel "C:\Users\CAUSRE User\Documents\cage412.xls", sheet("cage412") firstrow clear save "C:\Users\CAUSRE User\Documents\cage412.dta" import excel "C:\Users\CAUSRE User\Documents\cage512.xls", sheet("cage512") firstrow clear save "C:\Users\CAUSRE User\Documents\cage512.dta" import excel "C:\Users\CAUSRE User\Documents\cage113.xls", sheet("cage113") firstrow clear save "C:\Users\CAUSRE User\Documents\cage113.dta" import excel "C:\Users\CAUSRE User\Documents\cage213.xls", sheet("cage213") firstrow clear save "C:\Users\CAUSRE User\Documents\cage213.dta" import excel "C:\Users\CAUSRE User\Documents\cage313.xls", sheet("cage313") firstrow clear save "C:\Users\CAUSRE User\Documents\cage313.dta" import excel "C:\Users\CAUSRE User\Documents\cage413.xls", sheet("cage413") firstrow clear save "C:\Users\CAUSRE User\Documents\cage413.dta" import excel "C:\Users\CAUSRE User\Documents\cage513.xls", sheet("cage513") firstrow clear save "C:\Users\CAUSRE User\Documents\cage513.dta"

59
import excel "C:\Users\CAUSRE User\Documents\cage114.xls", sheet("cage114") firstrow clear save "C:\Users\CAUSRE User\Documents\cage114.dta" import excel "C:\Users\CAUSRE User\Documents\cage214.xls", sheet("cage214") firstrow clear save "C:\Users\CAUSRE User\Documents\cage214.dta" import excel "C:\Users\CAUSRE User\Documents\cage314.xls", sheet("cage314") firstrow clear save "C:\Users\CAUSRE User\Documents\cage314.dta" import excel "C:\Users\CAUSRE User\Documents\cage414.xls", sheet("cage414") firstrow clear save "C:\Users\CAUSRE User\Documents\cage414.dta" import excel "C:\Users\CAUSRE User\Documents\cage514.xls", sheet("cage514") firstrow clear save "C:\Users\CAUSRE User\Documents\cage514.dta" import excel "C:\Users\CAUSRE User\Documents\cage115.xls", sheet("cage115") firstrow clear save "C:\Users\CAUSRE User\Documents\cage115.dta" import excel "C:\Users\CAUSRE User\Documents\cage215.xls", sheet("cage215") firstrow clear save "C:\Users\CAUSRE User\Documents\cage215.dta" import excel "C:\Users\CAUSRE User\Documents\cage315.xls", sheet("cage315") firstrow clear save "C:\Users\CAUSRE User\Documents\cage315.dta" import excel "C:\Users\CAUSRE User\Documents\cage415.xls", sheet("cage415") firstrow clear save "C:\Users\CAUSRE User\Documents\cage415.dta" import excel "C:\Users\CAUSRE User\Documents\cage515.xls", sheet("cage515") firstrow clear save "C:\Users\CAUSRE User\Documents\cage515.dta" import excel "C:\Users\CAUSRE User\Documents\cage116.xls", sheet("cage116") firstrow clear save "C:\Users\CAUSRE User\Documents\cage116.dta" import excel "C:\Users\CAUSRE User\Documents\cage216.xls", sheet("cage216") firstrow clear save "C:\Users\CAUSRE User\Documents\cage216.dta"

60
import excel "C:\Users\CAUSRE User\Documents\cage316.xls", sheet("cage316") firstrow clear save "C:\Users\CAUSRE User\Documents\cage316.dta" import excel "C:\Users\CAUSRE User\Documents\cage416.xls", sheet("cage416") firstrow clear save "C:\Users\CAUSRE User\Documents\cage416.dta" import excel "C:\Users\CAUSRE User\Documents\cage516.xls", sheet("cage516") firstrow clear save "C:\Users\CAUSRE User\Documents\cage516.dta" use "C:\Users\CAUSRE User\Documents\alllease112.dta", clear append using "C:\Users\CAUSRE User\Documents\alllease113.dta" append using "C:\Users\CAUSRE User\Documents\alllease114.dta" append using "C:\Users\CAUSRE User\Documents\alllease115.dta" append using "C:\Users\CAUSRE User\Documents\alllease116.dta" drop OBJECTID Shape_Length rename parcella_1 gisunique rename Shape_Area alllease100 save "C:\Users\CAUSRE User\Documents\alllease100.dta" use "C:\Users\CAUSRE User\Documents\alllease212.dta", clear append using "C:\Users\CAUSRE User\Documents\alllease213.dta" append using "C:\Users\CAUSRE User\Documents\alllease214.dta" append using "C:\Users\CAUSRE User\Documents\alllease215.dta" append using "C:\Users\CAUSRE User\Documents\alllease216.dta" drop OBJECTID Shape_Length rename parcella_1 gisunique rename Shape_Area alllease200 save "C:\Users\CAUSRE User\Documents\alllease200.dta" use "C:\Users\CAUSRE User\Documents\alllease312.dta", clear append using "C:\Users\CAUSRE User\Documents\alllease313.dta" append using "C:\Users\CAUSRE User\Documents\alllease314.dta" append using "C:\Users\CAUSRE User\Documents\alllease315.dta" append using "C:\Users\CAUSRE User\Documents\alllease316.dta" drop OBJECTID Shape_Length rename parcella_1 gisunique rename Shape_Area alllease300 save "C:\Users\CAUSRE User\Documents\alllease300.dta"

61
use "C:\Users\CAUSRE User\Documents\alllease412.dta", clear append using "C:\Users\CAUSRE User\Documents\alllease413.dta" append using "C:\Users\CAUSRE User\Documents\alllease414.dta" append using "C:\Users\CAUSRE User\Documents\alllease415.dta" append using "C:\Users\CAUSRE User\Documents\alllease416.dta" drop OBJECTID Shape_Length rename parcella_1 gisunique rename Shape_Area alllease400 save "C:\Users\CAUSRE User\Documents\alllease400.dta" use "C:\Users\CAUSRE User\Documents\alllease512.dta", clear append using "C:\Users\CAUSRE User\Documents\alllease513.dta" append using "C:\Users\CAUSRE User\Documents\alllease514.dta" append using "C:\Users\CAUSRE User\Documents\alllease515.dta" append using "C:\Users\CAUSRE User\Documents\alllease516.dta" drop OBJECTID Shape_Length rename parcella_1 gisunique rename Shape_Area alllease500 save "C:\Users\CAUSRE User\Documents\alllease500.dta" use "C:\Users\CAUSRE User\Documents\actlease112.dta", clear append using "C:\Users\CAUSRE User\Documents\actlease113.dta" append using "C:\Users\CAUSRE User\Documents\actlease114.dta" append using "C:\Users\CAUSRE User\Documents\actlease115.dta" append using "C:\Users\CAUSRE User\Documents\actlease116.dta" drop OBJECTID Shape_Length rename parcella_1 gisunique rename Shape_Area actlease100 save "C:\Users\CAUSRE User\Documents\actlease100.dta" use "C:\Users\CAUSRE User\Documents\actlease212.dta", clear append using "C:\Users\CAUSRE User\Documents\actlease213.dta" append using "C:\Users\CAUSRE User\Documents\actlease214.dta" append using "C:\Users\CAUSRE User\Documents\actlease215.dta" append using "C:\Users\CAUSRE User\Documents\actlease216.dta" drop OBJECTID Shape_Length rename parcella_1 gisunique rename Shape_Area actlease200 save "C:\Users\CAUSRE User\Documents\actlease200.dta"

62
use "C:\Users\CAUSRE User\Documents\actlease312.dta", clear append using "C:\Users\CAUSRE User\Documents\actlease313.dta" append using "C:\Users\CAUSRE User\Documents\actlease314.dta" append using "C:\Users\CAUSRE User\Documents\actlease315.dta" append using "C:\Users\CAUSRE User\Documents\actlease316.dta" drop OBJECTID Shape_Length rename parcella_1 gisunique rename Shape_Area actlease300 save "C:\Users\CAUSRE User\Documents\actlease300.dta" use "C:\Users\CAUSRE User\Documents\actlease412.dta", clear append using "C:\Users\CAUSRE User\Documents\actlease413.dta" append using "C:\Users\CAUSRE User\Documents\actlease414.dta" append using "C:\Users\CAUSRE User\Documents\actlease415.dta" append using "C:\Users\CAUSRE User\Documents\actlease416.dta" drop OBJECTID Shape_Length rename parcella_1 gisunique rename Shape_Area actlease400 save "C:\Users\CAUSRE User\Documents\actlease400.dta" use "C:\Users\CAUSRE User\Documents\actlease512.dta", clear append using "C:\Users\CAUSRE User\Documents\actlease513.dta" append using "C:\Users\CAUSRE User\Documents\actlease514.dta" append using "C:\Users\CAUSRE User\Documents\actlease515.dta" append using "C:\Users\CAUSRE User\Documents\actlease516.dta" drop OBJECTID Shape_Length rename parcella_1 gisunique rename Shape_Area actlease500 save "C:\Users\CAUSRE User\Documents\actlease500.dta" use "C:\Users\CAUSRE User\Documents\cage112.dta", clear append using "C:\Users\CAUSRE User\Documents\cage113.dta" append using "C:\Users\CAUSRE User\Documents\cage114.dta" append using "C:\Users\CAUSRE User\Documents\cage115.dta" append using "C:\Users\CAUSRE User\Documents\cage116.dta" drop OBJECTID Shape_Length rename parcella_1 gisunique rename Shape_Area cage100 save "C:\Users\CAUSRE User\Documents\cage100.dta"

63
use "C:\Users\CAUSRE User\Documents\cage212.dta", clear append using "C:\Users\CAUSRE User\Documents\cage213.dta" append using "C:\Users\CAUSRE User\Documents\cage214.dta" append using "C:\Users\CAUSRE User\Documents\cage215.dta" append using "C:\Users\CAUSRE User\Documents\cage216.dta" drop OBJECTID Shape_Length rename parcella_1 gisunique rename Shape_Area cage200 save "C:\Users\CAUSRE User\Documents\cage200.dta" use "C:\Users\CAUSRE User\Documents\cage312.dta", clear append using "C:\Users\CAUSRE User\Documents\cage313.dta" append using "C:\Users\CAUSRE User\Documents\cage314.dta" append using "C:\Users\CAUSRE User\Documents\cage315.dta" append using "C:\Users\CAUSRE User\Documents\cage316.dta" drop OBJECTID Shape_Length rename parcella_1 gisunique rename Shape_Area cage300 save "C:\Users\CAUSRE User\Documents\cage300.dta" use "C:\Users\CAUSRE User\Documents\cage412.dta", clear append using "C:\Users\CAUSRE User\Documents\cage413.dta" append using "C:\Users\CAUSRE User\Documents\cage414.dta" append using "C:\Users\CAUSRE User\Documents\cage415.dta" append using "C:\Users\CAUSRE User\Documents\cage416.dta" drop OBJECTID Shape_Length rename parcella_1 gisunique rename Shape_Area cage400 save "C:\Users\CAUSRE User\Documents\cage400.dta" use "C:\Users\CAUSRE User\Documents\cage512.dta", clear append using "C:\Users\CAUSRE User\Documents\cage513.dta" append using "C:\Users\CAUSRE User\Documents\cage514.dta" append using "C:\Users\CAUSRE User\Documents\cage515.dta" append using "C:\Users\CAUSRE User\Documents\cage516.dta" drop OBJECTID Shape_Length rename parcella_1 gisunique rename Shape_Area cage500 save "C:\Users\CAUSRE User\Documents\cage500.dta"

64
Use “C:\Users\CAUSRE User\Documents\propertysales.dta”, clear merge 1:1 gisunique using "C:\Users\CAUSRE User\Documents\alllease100.dta" drop if _merge==2 replace alllease100=0 if mi(alllease100) drop _merge merge 1:1 gisunique using "C:\Users\CAUSRE User\Documents\alllease200.dta" drop if _merge==2 replace alllease200=0 if mi(alllease200) drop _merge merge 1:1 gisunique using "C:\Users\CAUSRE User\Documents\alllease300.dta" drop if _merge==2 replace alllease300=0 if mi(alllease300) drop _merge merge 1:1 gisunique using "C:\Users\CAUSRE User\Documents\alllease400.dta" drop if _merge==2 replace alllease400=0 if mi(alllease400) drop _merge merge 1:1 gisunique using "C:\Users\CAUSRE User\Documents\alllease500.dta" drop if _merge==2 replace alllease500=0 if mi(alllease500) drop _merge merge 1:1 gisunique using "C:\Users\CAUSRE User\Documents\actlease100.dta" drop if _merge==2 replace actlease100=0 if mi(actlease100) drop _merge merge 1:1 gisunique using "C:\Users\CAUSRE User\Documents\actlease200.dta" drop if _merge==2 replace actlease200=0 if mi(actlease200) drop _merge merge 1:1 gisunique using "C:\Users\CAUSRE User\Documents\actlease300.dta" drop if _merge==2 replace actlease300=0 if mi(actlease300) drop _merge merge 1:1 gisunique using "C:\Users\CAUSRE User\Documents\actlease400.dta" drop if _merge==2 replace actlease400=0 if mi(actlease400)

65
drop _merge merge 1:1 gisunique using "C:\Users\CAUSRE User\Documents\actlease500.dta" drop if _merge==2 replace actlease500=0 if mi(actlease500) drop _merge merge 1:1 gisunique using "C:\Users\CAUSRE User\Documents\cage100.dta" drop if _merge==2 replace cage100=0 if mi(cage100) drop _merge merge 1:1 gisunique using "C:\Users\CAUSRE User\Documents\cage200.dta" drop if _merge==2 replace cage200=0 if mi(cage200) drop _merge merge 1:1 gisunique using "C:\Users\CAUSRE User\Documents\cage300.dta" drop if _merge==2 replace cage300=0 if mi(cage300) drop _merge merge 1:1 gisunique using "C:\Users\CAUSRE User\Documents\cage400.dta" drop if _merge==2 replace cage400=0 if mi(cage400) drop _merge merge 1:1 gisunique using "C:\Users\CAUSRE User\Documents\cage500.dta" drop if _merge==2 replace cage500=0 if mi(cage500) drop _merge gen pactlease100=lease100/water100*100 gen pactlease200=lease200/water200*100 gen pactlease300=lease300/water300*100 gen pactlease400=lease400/water400*100 gen pactlease500=lease500/water500*100 gen pactlease1000=lease1000/water1000*100 gen palllease100=alllease100/water100*100 gen palllease200=alllease200/water200*100 gen palllease300=alllease300/water300*100 gen palllease400=alllease400/water400*100 gen palllease500=alllease500/water500*100

66
gen pcage100=cage100/water100*100 gen pcage200=cage200/water200*100 gen pcage300=cage300/water300*100 gen pcage400=cage400/water400*100 gen pcage500=cage500/water500*100 replace pactlease100=0 if mi(pactlease100) replace pactlease200=0 if mi(pactlease200) replace pactlease300=0 if mi(pactlease300) replace pactlease400=0 if mi(pactlease400) replace pactlease500=0 if mi(pactlease500) replace pcage100=0 if mi(pcage100) replace pcage200=0 if mi(pcage200) replace pcage300=0 if mi(pcage300) replace pcage400=0 if mi(pcage400) replace pcage500=0 if mi(pcage500) replace palllease100=0 if mi(palllease100) replace palllease200=0 if mi(palllease200) replace palllease300=0 if mi(palllease300) replace palllease400=0 if mi(palllease400) replace palllease500=0 if mi(palllease500) replace pactlease100=100 if pactlease100>100 replace pactlease200=100 if pactlease200>100 replace pactlease300=100 if pactlease300>100 replace pactlease400=100 if pactlease400>100 replace pactlease500=100 if pactlease500>100 replace palllease100=100 if palllease100>100 replace palllease200=100 if palllease200>100 replace palllease300=100 if palllease300>100 replace palllease400=100 if palllease400>100 replace palllease500=100 if palllease500>100 replace pcage100=100 if pcage100>100 replace pcage200=100 if pcage200>100 replace pcage300=100 if pcage300>100 replace pcage400=100 if pcage400>100 replace pcage500=100 if pcage500>100

67
reg lnsale livingsqft acres age pactlease100 pcage100 y2013 y2014 y2015 y2016 depthmean wqmean waterfront bgroup1 bgroup2 bgroup3 bgroup4 bgroup5 bgroup6 bgroup7 bgroup8 bgroup9 bgroup10 bgroup11 bgroup12 bgroup13 bgroup14 bgroup15 bgroup16 bgroup17 bgroup18 bgroup19 bgroup20 bgroup21 bgroup22 bgroup23 bgroup24 bgroup25 bgroup26 bgroup27 bgroup28 bgroup29 bgroup30 bgroup31 bgroup32 bgroup33 bgroup34 bgroup35 bgroup36 bgroup37 bgroup38 bgroup39 bgroup40 bgroup41 bgroup42 bgroup43 bgroup44 bgroup45 bgroup46 bgroup47 bgroup48 bgroup49 bgroup50 bgroup51 bgroup52 bgroup53 bgroup54 bgroup55 bgroup56 bgroup57 bgroup58 bgroup59 bgroup60 bgroup61 bgroup62 bgroup63 bgroup64 bgroup65 bgroup66 bgroup67 bgroup68 bgroup69 bgroup70 bgroup71 bgroup72 bgroup73 bgroup74 bgroup75 bgroup76 bgroup77 bgroup78 bgroup79 bgroup80 bgroup81 bgroup82 bgroup83 bgroup84 bgroup85 bgroup86 bgroup87 bgroup88 bgroup89 bgroup90 bgroup91 bgroup92 bgroup93 bgroup94 bgroup95 bgroup96 bgroup97 bgroup98 bgroup99 bgroup100 bgroup101 bgroup102 bgroup103 bgroup104 bgroup105 bgroup106 bgroup107 bgroup108 bgroup109 bgroup110 bgroup111 bgroup112 bgroup113 bgroup114 bgroup115 bgroup116 bgroup117 bgroup118 bgroup119 bgroup120 bgroup121 bgroup122 bgroup123 bgroup124 bgroup125 bgroup126 bgroup127 bgroup128 bgroup129 bgroup130 bgroup131 bgroup132 bgroup133 bgroup134 bgroup135 bgroup136 bgroup137 bgroup138 bgroup139 bgroup140 bgroup141 bgroup142 bgroup143 bgroup144 bgroup145 bgroup146 bgroup147 bgroup148 bgroup149 bgroup150 bgroup151 bgroup152 bgroup153 bgroup154 bgroup155 bgroup156 bgroup157 bgroup158 bgroup159 bgroup160 bgroup161 bgroup162 bgroup163 bgroup164 bgroup165 bgroup166
reg lnsale livingsqft acres age pactlease200 pcage200 y2013 y2014 y2015 y2016 depthmean wqmean waterfront bgroup1 bgroup2 bgroup3 bgroup4 bgroup5 bgroup6 bgroup7 bgroup8 bgroup9 bgroup10 bgroup11 bgroup12 bgroup13 bgroup14 bgroup15 bgroup16 bgroup17 bgroup18 bgroup19 bgroup20 bgroup21 bgroup22 bgroup23 bgroup24 bgroup25 bgroup26 bgroup27 bgroup28 bgroup29 bgroup30 bgroup31 bgroup32 bgroup33 bgroup34 bgroup35 bgroup36 bgroup37 bgroup38 bgroup39 bgroup40 bgroup41 bgroup42 bgroup43 bgroup44 bgroup45 bgroup46 bgroup47 bgroup48 bgroup49 bgroup50 bgroup51 bgroup52 bgroup53 bgroup54 bgroup55 bgroup56 bgroup57 bgroup58 bgroup59 bgroup60 bgroup61 bgroup62 bgroup63 bgroup64 bgroup65 bgroup66 bgroup67 bgroup68 bgroup69 bgroup70 bgroup71 bgroup72 bgroup73 bgroup74 bgroup75 bgroup76 bgroup77 bgroup78 bgroup79 bgroup80 bgroup81 bgroup82 bgroup83 bgroup84 bgroup85

68
bgroup86 bgroup87 bgroup88 bgroup89 bgroup90 bgroup91 bgroup92 bgroup93 bgroup94 bgroup95 bgroup96 bgroup97 bgroup98 bgroup99 bgroup100 bgroup101 bgroup102 bgroup103 bgroup104 bgroup105 bgroup106 bgroup107 bgroup108 bgroup109 bgroup110 bgroup111 bgroup112 bgroup113 bgroup114 bgroup115 bgroup116 bgroup117 bgroup118 bgroup119 bgroup120 bgroup121 bgroup122 bgroup123 bgroup124 bgroup125 bgroup126 bgroup127 bgroup128 bgroup129 bgroup130 bgroup131 bgroup132 bgroup133 bgroup134 bgroup135 bgroup136 bgroup137 bgroup138 bgroup139 bgroup140 bgroup141 bgroup142 bgroup143 bgroup144 bgroup145 bgroup146 bgroup147 bgroup148 bgroup149 bgroup150 bgroup151 bgroup152 bgroup153 bgroup154 bgroup155 bgroup156 bgroup157 bgroup158 bgroup159 bgroup160 bgroup161 bgroup162 bgroup163 bgroup164 bgroup165 bgroup166
reg lnsale livingsqft acres age pactlease300 pcage300 y2013 y2014 y2015 y2016 depthmean wqmean waterfront bgroup1 bgroup2 bgroup3 bgroup4 bgroup5 bgroup6 bgroup7 bgroup8 bgroup9 bgroup10 bgroup11 bgroup12 bgroup13 bgroup14 bgroup15 bgroup16 bgroup17 bgroup18 bgroup19 bgroup20 bgroup21 bgroup22 bgroup23 bgroup24 bgroup25 bgroup26 bgroup27 bgroup28 bgroup29 bgroup30 bgroup31 bgroup32 bgroup33 bgroup34 bgroup35 bgroup36 bgroup37 bgroup38 bgroup39 bgroup40 bgroup41 bgroup42 bgroup43 bgroup44 bgroup45 bgroup46 bgroup47 bgroup48 bgroup49 bgroup50 bgroup51 bgroup52 bgroup53 bgroup54 bgroup55 bgroup56 bgroup57 bgroup58 bgroup59 bgroup60 bgroup61 bgroup62 bgroup63 bgroup64 bgroup65 bgroup66 bgroup67 bgroup68 bgroup69 bgroup70 bgroup71 bgroup72 bgroup73 bgroup74 bgroup75 bgroup76 bgroup77 bgroup78 bgroup79 bgroup80 bgroup81 bgroup82 bgroup83 bgroup84 bgroup85 bgroup86 bgroup87 bgroup88 bgroup89 bgroup90 bgroup91 bgroup92 bgroup93 bgroup94 bgroup95 bgroup96 bgroup97 bgroup98 bgroup99 bgroup100 bgroup101 bgroup102 bgroup103 bgroup104 bgroup105 bgroup106 bgroup107 bgroup108 bgroup109 bgroup110 bgroup111 bgroup112 bgroup113 bgroup114 bgroup115 bgroup116 bgroup117 bgroup118 bgroup119 bgroup120 bgroup121 bgroup122 bgroup123 bgroup124 bgroup125 bgroup126 bgroup127 bgroup128 bgroup129 bgroup130 bgroup131 bgroup132 bgroup133 bgroup134 bgroup135 bgroup136 bgroup137 bgroup138 bgroup139 bgroup140 bgroup141 bgroup142 bgroup143 bgroup144 bgroup145 bgroup146 bgroup147 bgroup148 bgroup149 bgroup150 bgroup151 bgroup152 bgroup153 bgroup154 bgroup155 bgroup156 bgroup157 bgroup158 bgroup159 bgroup160 bgroup161 bgroup162 bgroup163 bgroup164 bgroup165 bgroup166

69
reg lnsale livingsqft acres age pactlease400 pcage400 y2013 y2014 y2015 y2016 depthmean wqmean waterfront bgroup1 bgroup2 bgroup3 bgroup4 bgroup5 bgroup6 bgroup7 bgroup8 bgroup9 bgroup10 bgroup11 bgroup12 bgroup13 bgroup14 bgroup15 bgroup16 bgroup17 bgroup18 bgroup19 bgroup20 bgroup21 bgroup22 bgroup23 bgroup24 bgroup25 bgroup26 bgroup27 bgroup28 bgroup29 bgroup30 bgroup31 bgroup32 bgroup33 bgroup34 bgroup35 bgroup36 bgroup37 bgroup38 bgroup39 bgroup40 bgroup41 bgroup42 bgroup43 bgroup44 bgroup45 bgroup46 bgroup47 bgroup48 bgroup49 bgroup50 bgroup51 bgroup52 bgroup53 bgroup54 bgroup55 bgroup56 bgroup57 bgroup58 bgroup59 bgroup60 bgroup61 bgroup62 bgroup63 bgroup64 bgroup65 bgroup66 bgroup67 bgroup68 bgroup69 bgroup70 bgroup71 bgroup72 bgroup73 bgroup74 bgroup75 bgroup76 bgroup77 bgroup78 bgroup79 bgroup80 bgroup81 bgroup82 bgroup83 bgroup84 bgroup85 bgroup86 bgroup87 bgroup88 bgroup89 bgroup90 bgroup91 bgroup92 bgroup93 bgroup94 bgroup95 bgroup96 bgroup97 bgroup98 bgroup99 bgroup100 bgroup101 bgroup102 bgroup103 bgroup104 bgroup105 bgroup106 bgroup107 bgroup108 bgroup109 bgroup110 bgroup111 bgroup112 bgroup113 bgroup114 bgroup115 bgroup116 bgroup117 bgroup118 bgroup119 bgroup120 bgroup121 bgroup122 bgroup123 bgroup124 bgroup125 bgroup126 bgroup127 bgroup128 bgroup129 bgroup130 bgroup131 bgroup132 bgroup133 bgroup134 bgroup135 bgroup136 bgroup137 bgroup138 bgroup139 bgroup140 bgroup141 bgroup142 bgroup143 bgroup144 bgroup145 bgroup146 bgroup147 bgroup148 bgroup149 bgroup150 bgroup151 bgroup152 bgroup153 bgroup154 bgroup155 bgroup156 bgroup157 bgroup158 bgroup159 bgroup160 bgroup161 bgroup162 bgroup163 bgroup164 bgroup165 bgroup166
reg lnsale livingsqft acres age pactlease500 pcage500 y2013 y2014 y2015 y2016 depthmean wqmean waterfront bgroup1 bgroup2 bgroup3 bgroup4 bgroup5 bgroup6 bgroup7 bgroup8 bgroup9 bgroup10 bgroup11 bgroup12 bgroup13 bgroup14 bgroup15 bgroup16 bgroup17 bgroup18 bgroup19 bgroup20 bgroup21 bgroup22 bgroup23 bgroup24 bgroup25 bgroup26 bgroup27 bgroup28 bgroup29 bgroup30 bgroup31 bgroup32 bgroup33 bgroup34 bgroup35 bgroup36 bgroup37 bgroup38 bgroup39 bgroup40 bgroup41 bgroup42 bgroup43 bgroup44 bgroup45 bgroup46 bgroup47 bgroup48 bgroup49 bgroup50 bgroup51 bgroup52 bgroup53 bgroup54 bgroup55 bgroup56 bgroup57 bgroup58 bgroup59 bgroup60 bgroup61 bgroup62 bgroup63 bgroup64 bgroup65 bgroup66 bgroup67 bgroup68 bgroup69 bgroup70 bgroup71 bgroup72 bgroup73 bgroup74 bgroup75 bgroup76 bgroup77 bgroup78 bgroup79 bgroup80 bgroup81 bgroup82 bgroup83 bgroup84 bgroup85

70
bgroup86 bgroup87 bgroup88 bgroup89 bgroup90 bgroup91 bgroup92 bgroup93 bgroup94 bgroup95 bgroup96 bgroup97 bgroup98 bgroup99 bgroup100 bgroup101 bgroup102 bgroup103 bgroup104 bgroup105 bgroup106 bgroup107 bgroup108 bgroup109 bgroup110 bgroup111 bgroup112 bgroup113 bgroup114 bgroup115 bgroup116 bgroup117 bgroup118 bgroup119 bgroup120 bgroup121 bgroup122 bgroup123 bgroup124 bgroup125 bgroup126 bgroup127 bgroup128 bgroup129 bgroup130 bgroup131 bgroup132 bgroup133 bgroup134 bgroup135 bgroup136 bgroup137 bgroup138 bgroup139 bgroup140 bgroup141 bgroup142 bgroup143 bgroup144 bgroup145 bgroup146 bgroup147 bgroup148 bgroup149 bgroup150 bgroup151 bgroup152 bgroup153 bgroup154 bgroup155 bgroup156 bgroup157 bgroup158 bgroup159 bgroup160 bgroup161 bgroup162 bgroup163 bgroup164 bgroup165 bgroup166

71
Appendix D. Full Model Results Table 1D. Full Results, 100m Buffer
Coefficient Standard Error
sqft 0.000259*a 9.57E-06 acres 0.018111* 0.003823 age 0.000342 0.000377 actlease100 0.000228 0.001788 cage100 0.010147***c 0.005901 wqmean -0.00136 0.029584 depthmean 0.005303 0.004481 waterfront 0.195343* 0.041189 y2013 0.013505 0.034934 y2014 0.011262 0.034694 y2015 0.032585 0.034067 y2016 0.023424 0.034128 bgroup1 0.473532 0.527535 bgroup2 0.251003 0.49998 bgroup3 0.448371 0.533641 bgroup4 0.366867 0.506809 bgroup5 -0.01574 0.52069 bgroup6 0.125194 0.478039 bgroup7 0.047995 0.481783 bgroup8 0.450737 0.472029 bgroup9 0.36131 0.471349 bgroup10 -0.34864 0.504989 bgroup11 0.293008 0.486907 bgroup12 0.273571 0.477282 bgroup13 0.545951 0.503234 bgroup14 0.001287 0.483484 bgroup15 0.172299 0.518804 bgroup16 0.362525 0.476585 bgroup17 0.162745 0.487274 bgroup18 -0.11445 0.476468 bgroup19 -0.19607 0.488619 bgroup20 0.373854 0.471192 bgroup21 -0.26159 0.500372 bgroup22 0.241593 0.486497 bgroup23 0.250123 0.48681

72
bgroup24 0.187725 0.49329 bgroup25 0.069726 0.492934 bgroup26 0.362824 0.48833 bgroup27 0.386342 0.509257 bgroup28 0.400136 0.492891 bgroup29 0.24195 0.537655 bgroup30 0.193642 0.536533 bgroup31 0.245814 0.656241 bgroup32 0.406968 0.656252 bgroup33 -0.1468 0.572692 bgroup34 1.148718*** 0.658749 bgroup35 0.485444 0.505678 bgroup36 0.421409 0.536268 bgroup37 0.374524 0.57274 bgroup38 0.264824 0.54425 bgroup39 -0.10865 0.50628 bgroup40 0.477562 0.49547 bgroup41 0.26664 0.483405 bgroup42 -0.74966 0.540506 bgroup43 0.291943 0.521775 bgroup44 0.417339 0.484721 bgroup45 0.357278 0.475465 bgroup46 0.287729 0.468751 bgroup47 0.459706 0.475613 bgroup48 0.511405 0.47297 bgroup49 0.491767 0.473123 bgroup50 0.419956 0.469454 bgroup51 0.632997 0.472102 bgroup52 0.502505 0.469164 bgroup53 0.375435 0.468244 bgroup54 0.598394 0.510236 bgroup55 -0.15006 0.499084 bgroup56 0.435185 0.569554 bgroup57 0.451019 0.492644 bgroup58 -0.11662 0.486273 bgroup59 0.085956 0.481682 bgroup60 0.299693 0.480324 bgroup61 0.10793 0.492986 bgroup62 0.482184 0.497653

73
bgroup63 0.300565 0.47354 bgroup64 0.134851 0.487824 bgroup65 0.392722 0.483136 bgroup66 0.482414 0.656236 bgroup67 0.321817 0.470424 bgroup68 0.744973 0.492051 bgroup69 0.050138 0.480221 bgroup70 0.595812 0.471117 bgroup71 0.52704 0.468595 bgroup72 0.157498 0.524692 bgroup73 0.522428 0.569523 bgroup74 0.590257 0.657712 bgroup75 0.264755 0.538073 bgroup76 0.087381 0.509726 bgroup77 0.147442 0.655195 bgroup78 -0.03959 0.511688 bgroup79 0.037273 0.537266 bgroup80 0.311763 0.536231 bgroup81 -0.07189 0.502822 bgroup82 0.139614 0.482176 bgroup83 0.103664 0.509995 bgroup84 0.059167 0.537409 bgroup85 -0.12227 0.476009 bgroup86 -0.1965 0.491184 bgroup87 -0.45448 0.657622 bgroup88 -0.5496 0.519927 bgroup89 -0.06275 0.478842 bgroup90 -0.22276 0.479088 bgroup91 -0.23878 0.493257 bgroup92 -0.2171 0.485581 bgroup93 0.602038 0.472305 bgroup94 0.21151 0.521724 bgroup95 0.262839 0.501952 bgroup96 -0.26629 0.655581 bgroup97 0.326902 0.484807 bgroup98 -0.18817 0.481436 bgroup99 0.19034 0.480633 bgroup100 0.021391 0.474669 bgroup101 -0.52947 0.508932

74
bgroup102 0.130065 0.480218 bgroup103 0.377199 0.486422 bgroup104 0.031453 0.521043 bgroup105 -0.28704 0.567745 bgroup106 -0.36157 0.480478 bgroup107 0.665016 0.476791 bgroup108 0.530361 0.568076 bgroup109 0.648262 0.488586 bgroup110 0.29971 0.496475 bgroup111 0.117372 0.510257 bgroup112 0.479765 0.508445 bgroup113 0.357267 0.482555 bgroup114 -0.05672 0.569886 bgroup115 0.121435 0.483786 bgroup116 0.167341 0.519302 bgroup117 0.155356 0.509733 bgroup118 0.270487 0.473013 bgroup119 0.219928 0.470382 bgroup120 0.312629 0.472244 bgroup121 0.082865 0.656374 bgroup122 0.407317 0.493791 bgroup123 -0.72104 0.569805 bgroup124 0.316993 0.484896 bgroup125 0.086146 0.511812 bgroup126 0.583949 0.655411 bgroup127 0.336714 0.491956 bgroup128 0.092911 0.507779 bgroup129 0.314195 0.48921 bgroup130 0.619901 0.507329 bgroup131 0.239898 0.484181 bgroup132 -0.08274 0.482847 bgroup133 0.287226 0.65714 bgroup134 -0.34392 0.49345 bgroup135 -0.00004 0.499556 bgroup136 0.279365 0.539454 bgroup137 0.057316 0.504596 bgroup138 0.361282 0.506386 bgroup139 0.03186 0.483847 bgroup140 0.473464 0.480191

75
bgroup141 0.627029 0.518834 bgroup142 0.390352 0.495325 bgroup143 0.762237 0.535752 bgroup144 0.401257 0.654966 bgroup145 0.801205*** 0.480305 bgroup146 0.555988 0.494996 bgroup147 -0.05363 0.534719 bgroup148 0.311741 0.477965 bgroup149 0.529257 0.468367 bgroup150 0.541852 0.467655 bgroup151 0.870973*** 0.476171 bgroup152 0.590131 0.497573 bgroup153 0.632901 0.47024 bgroup154 0.668003 0.466092 bgroup155 0.564834 0.477739 bgroup156 1.08674**b 0.488175 bgroup157 1.280065* 0.491418 bgroup158 0.44324 0.480547 bgroup159 0.617769 0.47616 bgroup160 0.512654 0.479027 bgroup161 0.913689*** 0.482468 bgroup162 0.572333 0.473303 bgroup163 0.867497*** 0.471086 bgroup164 0.831925*** 0.481811 bgroup165 -0.01389 0.655956 bgroup166 0.355564 0.567331 _cons 11.61593* 0.471766 a. Significant at 1% level b. Significant at 5% level c. Significant at 10% level
Table 2D. Full Results, 200m Buffer
Coefficient Standard Error
sqft 0.00026* 9.59E-06 acres 0.018425* 0.003832 age 0.000334 0.000378 actlease200 0.001352 0.001367 cage200 -0.00322 0.004106

76
wqmean -0.00225 0.0296 depthmean 0.00529 0.004486 waterfront 0.195857* 0.041212 y2013 0.012161 0.034951 y2014 0.010794 0.034722 y2015 0.030097 0.034108 y2016 0.021279 0.034233 bgroup1 0.481311 0.527824 bgroup2 0.258842 0.500262 bgroup3 0.455973 0.533934 bgroup4 0.375648 0.507095 bgroup5 -0.00722 0.520978 bgroup6 0.130558 0.478302 bgroup7 0.028932 0.482685 bgroup8 0.455138 0.472287 bgroup9 0.366577 0.471614 bgroup10 -0.36083 0.505225 bgroup11 0.296432 0.487169 bgroup12 0.277772 0.477546 bgroup13 0.550072 0.503508 bgroup14 0.006531 0.483747 bgroup15 0.176115 0.519083 bgroup16 0.365732 0.476842 bgroup17 0.166291 0.48754 bgroup18 -0.10961 0.476727 bgroup19 -0.19212 0.488883 bgroup20 0.378235 0.47145 bgroup21 -0.2593 0.500643 bgroup22 0.248454 0.486767 bgroup23 0.248826 0.487103 bgroup24 0.179399 0.493244 bgroup25 0.073155 0.4932 bgroup26 0.367635 0.488595 bgroup27 0.390305 0.50953 bgroup28 0.377962 0.493578 bgroup29 0.246035 0.537949 bgroup30 0.197512 0.536821 bgroup31 0.24901 0.656596 bgroup32 0.409431 0.656605

77
bgroup33 -0.14402 0.572998 bgroup34 1.152028*** 0.659103 bgroup35 0.491294 0.505958 bgroup36 0.428616 0.536561 bgroup37 0.381281 0.573052 bgroup38 0.271754 0.544547 bgroup39 -0.10266 0.506558 bgroup40 0.481525 0.495737 bgroup41 0.270911 0.483665 bgroup42 -0.74803 0.540791 bgroup43 0.298046 0.522062 bgroup44 0.420464 0.484984 bgroup45 0.361777 0.475726 bgroup46 0.288802 0.469015 bgroup47 0.459659 0.475876 bgroup48 0.513529 0.473229 bgroup49 0.493226 0.473379 bgroup50 0.418741 0.469727 bgroup51 0.625491 0.472439 bgroup52 0.504079 0.469418 bgroup53 0.377946 0.468498 bgroup54 0.604625 0.510521 bgroup55 -0.14756 0.499353 bgroup56 0.441309 0.569865 bgroup57 0.433467 0.491824 bgroup58 -0.11255 0.486538 bgroup59 0.090513 0.481948 bgroup60 0.304485 0.480588 bgroup61 0.114856 0.493258 bgroup62 0.486437 0.497924 bgroup63 0.305243 0.473799 bgroup64 0.131773 0.488141 bgroup65 0.397545 0.483399 bgroup66 0.487599 0.656589 bgroup67 0.326414 0.470681 bgroup68 0.74703 0.492316 bgroup69 0.065913 0.481164 bgroup70 0.594343 0.471348 bgroup71 0.541994 0.468946

78
bgroup72 0.163989 0.524981 bgroup73 0.526181 0.569848 bgroup74 0.595511 0.658065 bgroup75 0.270413 0.53837 bgroup76 0.092968 0.510007 bgroup77 0.152088 0.655548 bgroup78 -0.03437 0.511969 bgroup79 0.043308 0.537561 bgroup80 0.317021 0.536523 bgroup81 -0.08603 0.503438 bgroup82 0.143727 0.482439 bgroup83 0.106549 0.510271 bgroup84 0.063689 0.537702 bgroup85 -0.11689 0.476271 bgroup86 -0.19156 0.491454 bgroup87 -0.44836 0.657988 bgroup88 -0.5445 0.520214 bgroup89 -0.05792 0.479106 bgroup90 -0.21795 0.479353 bgroup91 -0.23331 0.49353 bgroup92 -0.21191 0.485848 bgroup93 0.606345 0.472562 bgroup94 0.140222 0.525824 bgroup95 0.267209 0.502228 bgroup96 -0.26248 0.655936 bgroup97 0.330796 0.485071 bgroup98 -0.18314 0.481703 bgroup99 0.195305 0.480899 bgroup100 0.026293 0.474931 bgroup101 -0.52293 0.509218 bgroup102 0.134842 0.480483 bgroup103 0.381275 0.486687 bgroup104 0.037237 0.521329 bgroup105 -0.28243 0.568053 bgroup106 -0.35675 0.480746 bgroup107 0.66905 0.47705 bgroup108 0.535023 0.568385 bgroup109 0.650749 0.488849 bgroup110 0.302654 0.496742

79
bgroup111 0.12097 0.510535 bgroup112 0.483742 0.508721 bgroup113 0.360917 0.482814 bgroup114 -0.05233 0.570194 bgroup115 0.126293 0.484051 bgroup116 0.171871 0.519584 bgroup117 0.161399 0.510016 bgroup118 0.274694 0.473273 bgroup119 0.236972 0.47067 bgroup120 0.315891 0.472503 bgroup121 0.084566 0.656726 bgroup122 0.410812 0.494058 bgroup123 -0.71763 0.570112 bgroup124 0.320637 0.48516 bgroup125 0.092371 0.512091 bgroup126 0.587172 0.655763 bgroup127 0.341654 0.492225 bgroup128 0.094438 0.508051 bgroup129 0.317181 0.489473 bgroup130 0.620575 0.507602 bgroup131 0.237805 0.484445 bgroup132 -0.07831 0.48311 bgroup133 0.292069 0.657499 bgroup134 -0.38535 0.495445 bgroup135 0.004332 0.499824 bgroup136 0.284163 0.539743 bgroup137 0.063032 0.504868 bgroup138 0.367346 0.506665 bgroup139 0.03839 0.484113 bgroup140 0.475648 0.480448 bgroup141 0.629767 0.519112 bgroup142 0.393261 0.495593 bgroup143 0.767095 0.536043 bgroup144 0.403956 0.655318 bgroup145 0.800749*** 0.480563 bgroup146 0.558448 0.495262 bgroup147 -0.05257 0.535005 bgroup148 0.315909 0.478224 bgroup149 0.533398 0.468623

80
bgroup150 0.544919 0.46791 bgroup151 0.868194*** 0.476435 bgroup152 0.595042 0.497845 bgroup153 0.641546 0.470505 bgroup154 0.677428 0.466343 bgroup155 0.569097 0.478 bgroup156 1.090254** 0.48844 bgroup157 1.283499* 0.491687 bgroup158 0.446162 0.480806 bgroup159 0.621561 0.476418 bgroup160 0.517362 0.47929 bgroup161 0.916973*** 0.482729 bgroup162 0.574521 0.473559 bgroup163 0.870241*** 0.47134 bgroup164 0.834782 0.482073 bgroup165 -0.00869 0.65631 bgroup166 0.359437 0.567637 _cons 11.6117* 0.472056
Table 3D. Full Results, 300m Buffer
Coefficient Standard Error
sqft 0.000261* 9.56E-06 acres 0.01883* 0.003821 age 0.000304 0.000377 actlease300 0.002128*** 0.001237 cage300 -0.01082* 0.003234 wqmean -0.004 0.02956 depthmean 0.005102 0.004476 waterfront 0.197207* 0.041113 y2013 0.009549 0.034894 y2014 0.007461 0.034676 y2015 0.026473 0.034063 y2016 0.018817 0.034215 bgroup1 0.491959 0.526549 bgroup2 0.270533 0.499084 bgroup3 0.466502 0.532661 bgroup4 0.388026 0.505885 bgroup5 0.004804 0.519723

81
bgroup6 0.138144 0.477132 bgroup7 -0.00214 0.482323 bgroup8 0.460826 0.47113 bgroup9 0.372601 0.470456 bgroup10 -0.38096 0.504184 bgroup11 0.302109 0.48598 bgroup12 0.280295 0.476374 bgroup13 0.554379 0.502274 bgroup14 0.015385 0.482571 bgroup15 0.182771 0.517818 bgroup16 0.368622 0.475673 bgroup17 0.170216 0.486344 bgroup18 -0.10591 0.475559 bgroup19 -0.12782 0.488167 bgroup20 0.383167 0.470292 bgroup21 -0.25678 0.499417 bgroup22 0.254645 0.485571 bgroup23 0.252701 0.485885 bgroup24 0.177999 0.491947 bgroup25 0.077868 0.491994 bgroup26 0.374136 0.487399 bgroup27 0.394466 0.508283 bgroup28 0.367047 0.49215 bgroup29 0.25427 0.536647 bgroup30 0.202008 0.535506 bgroup31 0.254283 0.654988 bgroup32 0.414094 0.654999 bgroup33 -0.13888 0.571616 bgroup34 1.155443*** 0.657489 bgroup35 0.500165 0.504738 bgroup36 0.446039 0.535273 bgroup37 0.390758 0.571661 bgroup38 0.281118 0.543224 bgroup39 -0.09297 0.505334 bgroup40 0.486442 0.494523 bgroup41 0.277165 0.482484 bgroup42 -0.74541 0.539467 bgroup43 0.307314 0.520787 bgroup44 0.42331 0.483794

82
bgroup45 0.36668 0.474558 bgroup46 0.292664 0.467861 bgroup47 0.460147 0.474713 bgroup48 0.515394 0.47207 bgroup49 0.495513 0.472219 bgroup50 0.414914 0.468604 bgroup51 0.621968 0.471282 bgroup52 0.509535 0.468273 bgroup53 0.382892 0.467356 bgroup54 0.611539 0.509266 bgroup55 -0.14613 0.49813 bgroup56 0.44823 0.568469 bgroup57 0.439354 0.490082 bgroup58 -0.11072 0.485345 bgroup59 0.093071 0.480768 bgroup60 0.307907 0.479407 bgroup61 0.125285 0.49206 bgroup62 0.492142 0.496702 bgroup63 0.31155 0.47264 bgroup64 0.123338 0.48704 bgroup65 0.404502 0.482218 bgroup66 0.494607 0.654984 bgroup67 0.333237 0.469531 bgroup68 0.734452 0.491214 bgroup69 0.123916 0.479878 bgroup70 0.597629 0.470168 bgroup71 0.566789 0.467782 bgroup72 0.17348 0.523702 bgroup73 0.577114 0.568717 bgroup74 0.601494 0.656455 bgroup75 0.379608 0.538349 bgroup76 0.102864 0.508762 bgroup77 0.158861 0.653951 bgroup78 -0.02813 0.510712 bgroup79 0.051634 0.536244 bgroup80 0.324097 0.535208 bgroup81 -0.10539 0.502454 bgroup82 0.148226 0.481255 bgroup83 0.109682 0.509024

83
bgroup84 0.068642 0.536384 bgroup85 -0.11008 0.475104 bgroup86 -0.18558 0.490247 bgroup87 -0.43914 0.656383 bgroup88 -0.53561 0.518943 bgroup89 -0.05203 0.47793 bgroup90 -0.21101 0.478179 bgroup91 -0.22537 0.492322 bgroup92 -0.20483 0.484659 bgroup93 0.610936 0.471403 bgroup94 0.089987 0.524065 bgroup95 0.274618 0.501002 bgroup96 -0.25793 0.65433 bgroup97 0.336417 0.483888 bgroup98 -0.175 0.480531 bgroup99 0.202044 0.479726 bgroup100 0.033755 0.473773 bgroup101 -0.51296 0.507979 bgroup102 0.140275 0.479303 bgroup103 0.385743 0.485494 bgroup104 0.043397 0.520049 bgroup105 -0.27465 0.566671 bgroup106 -0.34813 0.479578 bgroup107 0.675118 0.475887 bgroup108 0.540345 0.566995 bgroup109 0.654323 0.487657 bgroup110 0.306796 0.495527 bgroup111 0.125735 0.509282 bgroup112 0.489081 0.507478 bgroup113 0.366005 0.481635 bgroup114 -0.04619 0.568797 bgroup115 0.132765 0.482867 bgroup116 0.178318 0.518313 bgroup117 0.169401 0.508774 bgroup118 0.28535 0.472123 bgroup119 0.276024 0.46966 bgroup120 0.3176 0.471346 bgroup121 0.08764 0.655119 bgroup122 0.414613 0.492847

84
bgroup123 -0.71546 0.568715 bgroup124 0.324144 0.483969 bgroup125 0.102484 0.510857 bgroup126 0.59405 0.654162 bgroup127 0.348837 0.491024 bgroup128 0.098402 0.506817 bgroup129 0.322845 0.488286 bgroup130 0.623435 0.506365 bgroup131 0.239748 0.483231 bgroup132 -0.0721 0.481928 bgroup133 0.298612 0.655886 bgroup134 -0.42211 0.494474 bgroup135 0.005772 0.498599 bgroup136 0.29083 0.538435 bgroup137 0.072322 0.503647 bgroup138 0.376666 0.50545 bgroup139 0.048886 0.482947 bgroup140 0.478933 0.479275 bgroup141 0.633423 0.517843 bgroup142 0.398515 0.494383 bgroup143 0.772961 0.534731 bgroup144 0.410317 0.65372 bgroup145 0.799673*** 0.479391 bgroup146 0.562174 0.494054 bgroup147 -0.04901 0.5337 bgroup148 0.322378 0.477057 bgroup149 0.539524 0.467478 bgroup150 0.549971 0.466768 bgroup151 0.867407*** 0.47527 bgroup152 0.603938 0.49663 bgroup153 0.65007 0.469346 bgroup154 0.685495 0.465195 bgroup155 0.574922 0.476832 bgroup156 1.095429** 0.487248 bgroup157 1.288956* 0.490489 bgroup158 0.450905 0.479632 bgroup159 0.62733 0.475254 bgroup160 0.524343 0.478118 bgroup161 0.922129*** 0.481552
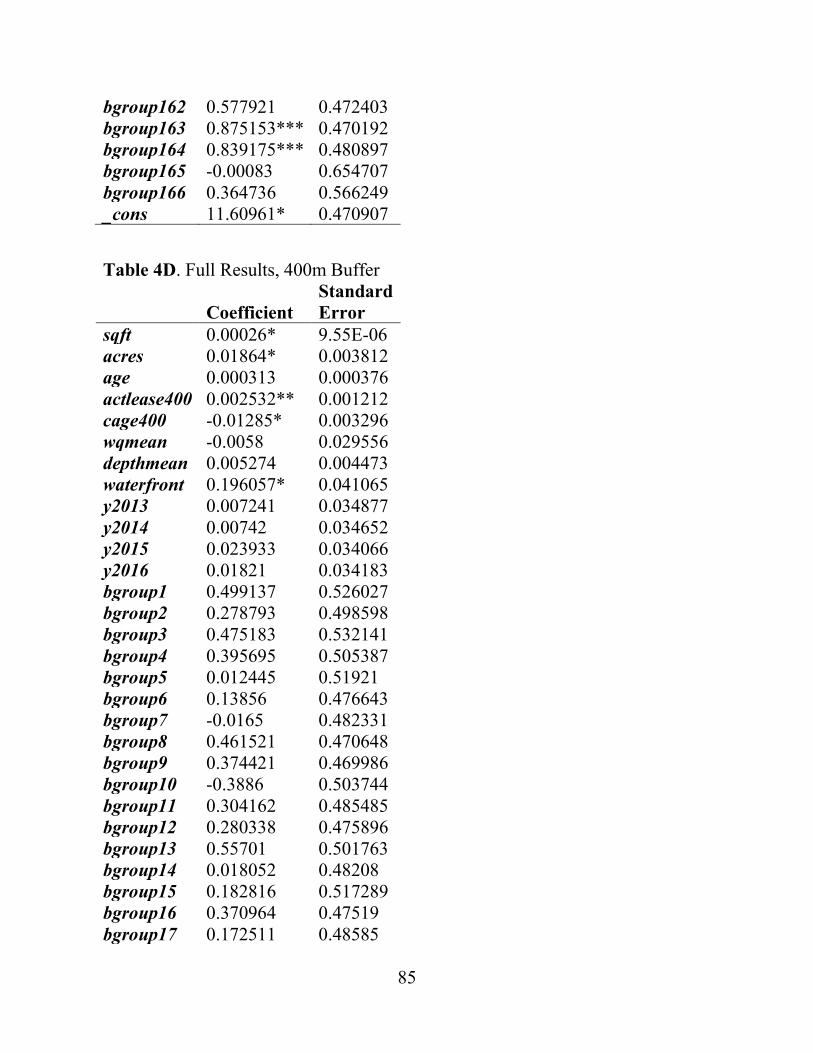
85
bgroup162 0.577921 0.472403 bgroup163 0.875153*** 0.470192 bgroup164 0.839175*** 0.480897 bgroup165 -0.00083 0.654707 bgroup166 0.364736 0.566249 _cons 11.60961* 0.470907
Table 4D. Full Results, 400m Buffer
Coefficient Standard Error
sqft 0.00026* 9.55E-06 acres 0.01864* 0.003812 age 0.000313 0.000376 actlease400 0.002532** 0.001212 cage400 -0.01285* 0.003296 wqmean -0.0058 0.029556 depthmean 0.005274 0.004473 waterfront 0.196057* 0.041065 y2013 0.007241 0.034877 y2014 0.00742 0.034652 y2015 0.023933 0.034066 y2016 0.01821 0.034183 bgroup1 0.499137 0.526027 bgroup2 0.278793 0.498598 bgroup3 0.475183 0.532141 bgroup4 0.395695 0.505387 bgroup5 0.012445 0.51921 bgroup6 0.13856 0.476643 bgroup7 -0.0165 0.482331 bgroup8 0.461521 0.470648 bgroup9 0.374421 0.469986 bgroup10 -0.3886 0.503744 bgroup11 0.304162 0.485485 bgroup12 0.280338 0.475896 bgroup13 0.55701 0.501763 bgroup14 0.018052 0.48208 bgroup15 0.182816 0.517289 bgroup16 0.370964 0.47519 bgroup17 0.172511 0.48585

86
bgroup18 -0.10417 0.475074 bgroup19 -0.11507 0.487706 bgroup20 0.386145 0.469815 bgroup21 -0.25648 0.498908 bgroup22 0.24876 0.485077 bgroup23 0.257334 0.485381 bgroup24 0.179968 0.491405 bgroup25 0.079566 0.491492 bgroup26 0.376996 0.486904 bgroup27 0.393399 0.507766 bgroup28 0.362704 0.491583 bgroup29 0.25687 0.5361 bgroup30 0.205861 0.534962 bgroup31 0.254982 0.65432 bgroup32 0.415174 0.65433 bgroup33 -0.13226 0.571046 bgroup34 1.160533*** 0.656821 bgroup35 0.503824 0.504229 bgroup36 0.442905 0.534709 bgroup37 0.395828 0.571086 bgroup38 0.278376 0.542655 bgroup39 -0.0889 0.504825 bgroup40 0.491206 0.494022 bgroup41 0.282473 0.481998 bgroup42 -0.73743 0.538924 bgroup43 0.310371 0.520257 bgroup44 0.42585 0.483302 bgroup45 0.36381 0.474081 bgroup46 0.300933 0.467407 bgroup47 0.462291 0.474227 bgroup48 0.511777 0.471605 bgroup49 0.497928 0.471738 bgroup50 0.411016 0.468149 bgroup51 0.618659 0.47079 bgroup52 0.51028 0.4678 bgroup53 0.387944 0.466895 bgroup54 0.615969 0.508753 bgroup55 -0.14981 0.497638 bgroup56 0.450131 0.56789

87
bgroup57 0.445914 0.489453 bgroup58 -0.11099 0.484852 bgroup59 0.092716 0.480283 bgroup60 0.305619 0.478923 bgroup61 0.130826 0.491567 bgroup62 0.494752 0.496197 bgroup63 0.31188 0.472156 bgroup64 0.125464 0.486715 bgroup65 0.405348 0.481724 bgroup66 0.496563 0.654316 bgroup67 0.333423 0.46905 bgroup68 0.724129 0.490805 bgroup69 0.132496 0.479356 bgroup70 0.597785 0.469689 bgroup71 0.56874 0.467295 bgroup72 0.178081 0.523172 bgroup73 0.613416 0.568465 bgroup74 0.603733 0.655786 bgroup75 0.457802 0.539381 bgroup76 0.133639 0.508375 bgroup77 0.161585 0.653285 bgroup78 -0.02591 0.510195 bgroup79 0.051441 0.535695 bgroup80 0.324873 0.534662 bgroup81 -0.11754 0.502088 bgroup82 0.150557 0.480766 bgroup83 0.111461 0.508504 bgroup84 0.070458 0.535838 bgroup85 -0.10909 0.474618 bgroup86 -0.18366 0.489749 bgroup87 -0.44061 0.655705 bgroup88 -0.53596 0.51841 bgroup89 -0.05073 0.477443 bgroup90 -0.21092 0.477689 bgroup91 -0.22525 0.491817 bgroup92 -0.20433 0.484163 bgroup93 0.612838 0.470923 bgroup94 0.063618 0.523409 bgroup95 0.274466 0.500487

88
bgroup96 -0.25808 0.653662 bgroup97 0.337619 0.483393 bgroup98 -0.17575 0.480036 bgroup99 0.202665 0.479233 bgroup100 0.033896 0.473286 bgroup101 -0.51371 0.507454 bgroup102 0.141716 0.478816 bgroup103 0.387548 0.485 bgroup104 0.045707 0.519521 bgroup105 -0.27372 0.566092 bgroup106 -0.34924 0.479083 bgroup107 0.676339 0.475399 bgroup108 0.541822 0.566416 bgroup109 0.657444 0.487161 bgroup110 0.30899 0.495022 bgroup111 0.127261 0.508763 bgroup112 0.490426 0.50696 bgroup113 0.369031 0.481145 bgroup114 -0.04322 0.568218 bgroup115 0.134373 0.482374 bgroup116 0.179871 0.517784 bgroup117 0.171646 0.508255 bgroup118 0.296835 0.471676 bgroup119 0.270826 0.46909 bgroup120 0.317523 0.47087 bgroup121 0.089226 0.654451 bgroup122 0.416884 0.492346 bgroup123 -0.7121 0.568136 bgroup124 0.326135 0.483477 bgroup125 0.106729 0.510343 bgroup126 0.593291 0.653493 bgroup127 0.348907 0.49052 bgroup128 0.100504 0.506305 bgroup129 0.324267 0.487791 bgroup130 0.624653 0.505851 bgroup131 0.237727 0.482743 bgroup132 -0.06996 0.481437 bgroup133 0.299079 0.655216 bgroup134 -0.44814 0.49445

89
bgroup135 0.012657 0.498103 bgroup136 0.29692 0.537894 bgroup137 0.076518 0.503142 bgroup138 0.380386 0.504945 bgroup139 0.052745 0.482461 bgroup140 0.478669 0.478785 bgroup141 0.634732 0.517315 bgroup142 0.397341 0.493876 bgroup143 0.773575 0.534185 bgroup144 0.409038 0.65305 bgroup145 0.795511*** 0.478912 bgroup146 0.562725 0.493549 bgroup147 -0.04879 0.533155 bgroup148 0.322127 0.476568 bgroup149 0.53853 0.466997 bgroup150 0.549701 0.466289 bgroup151 0.868238*** 0.474776 bgroup152 0.601767 0.496118 bgroup153 0.649681 0.468863 bgroup154 0.686522 0.464722 bgroup155 0.574219 0.476342 bgroup156 1.095556** 0.486749 bgroup157 1.289302* 0.489986 bgroup158 0.45021 0.479141 bgroup159 0.627036 0.474767 bgroup160 0.523115 0.477626 bgroup161 0.930437** 0.48107 bgroup162 0.577839 0.47192 bgroup163 0.875569*** 0.469711 bgroup164 0.838751*** 0.480404 bgroup165 -0.00058 0.654037 bgroup166 0.364281 0.56567 _cons 11.6117* 0.470447
Table 5D. Full Results, 500m Buffer
Coefficient Standard Error
sqft 0.00026* 9.53E-06 acres 0.018508* 0.003805

90
age 0.000318 0.000375 actlease500 0.002799** 0.001234 cage500 -0.0164* 0.003561 wqmean -0.00225 0.029541 depthmean 0.005255 0.004466 waterfront 0.198607* 0.041009 y2013 0.004807 0.034843 y2014 0.008583 0.034617 y2015 0.022864 0.034033 y2016 0.018457 0.034154 bgroup1 0.488234 0.525246 bgroup2 0.264344 0.497869 bgroup3 0.460391 0.531365 bgroup4 0.381426 0.50464 bgroup5 -0.00046 0.518438 bgroup6 0.137089 0.475931 bgroup7 -0.03984 0.482105 bgroup8 0.460509 0.469946 bgroup9 0.372184 0.469294 bgroup10 -0.40362 0.503184 bgroup11 0.302949 0.484761 bgroup12 0.277529 0.475181 bgroup13 0.553838 0.501013 bgroup14 0.01322 0.481359 bgroup15 0.180797 0.516519 bgroup16 0.368375 0.47448 bgroup17 0.169531 0.485124 bgroup18 -0.10934 0.474365 bgroup19 -0.11193 0.486853 bgroup20 0.383431 0.469112 bgroup21 -0.25736 0.498165 bgroup22 0.238024 0.484352 bgroup23 0.253342 0.484655 bgroup24 0.177327 0.490659 bgroup25 0.077249 0.490759 bgroup26 0.373117 0.486175 bgroup27 0.385428 0.507012 bgroup28 0.351772 0.490923 bgroup29 0.251046 0.5353

91
bgroup30 0.202712 0.534164 bgroup31 0.251668 0.653344 bgroup32 0.412131 0.653355 bgroup33 -0.14076 0.57021 bgroup34 1.152061*** 0.655843 bgroup35 0.494725 0.503484 bgroup36 0.417452 0.5339 bgroup37 0.387276 0.570238 bgroup38 0.254409 0.541855 bgroup39 -0.09844 0.504076 bgroup40 0.485342 0.493285 bgroup41 0.275271 0.48128 bgroup42 -0.74328 0.538125 bgroup43 0.304469 0.519476 bgroup44 0.4248 0.482581 bgroup45 0.362491 0.473373 bgroup46 0.29843 0.466702 bgroup47 0.461793 0.473519 bgroup48 0.508848 0.470909 bgroup49 0.49809 0.471035 bgroup50 0.4075 0.467465 bgroup51 0.618899 0.470067 bgroup52 0.510817 0.467108 bgroup53 0.394107 0.466211 bgroup54 0.61675 0.507996 bgroup55 -0.14875 0.496893 bgroup56 0.449759 0.567043 bgroup57 0.449662 0.488674 bgroup58 -0.11153 0.48413 bgroup59 0.087901 0.479582 bgroup60 0.303908 0.47821 bgroup61 0.119939 0.490833 bgroup62 0.490012 0.495454 bgroup63 0.310756 0.471451 bgroup64 0.196467 0.48661 bgroup65 0.40328 0.481005 bgroup66 0.496236 0.653341 bgroup67 0.332154 0.46835 bgroup68 0.718363 0.490113

92
bgroup69 0.140755 0.478564 bgroup70 0.595756 0.46899 bgroup71 0.571344 0.466586 bgroup72 0.168372 0.52239 bgroup73 0.688038 0.568451 bgroup74 0.605797 0.65481 bgroup75 0.52456 0.539397 bgroup76 0.181632 0.507946 bgroup77 0.15995 0.652314 bgroup78 -0.02595 0.509433 bgroup79 0.052375 0.534897 bgroup80 0.324817 0.533864 bgroup81 -0.12739 0.501413 bgroup82 0.147583 0.480047 bgroup83 0.109858 0.507746 bgroup84 0.068365 0.535037 bgroup85 -0.11031 0.473909 bgroup86 -0.18553 0.489016 bgroup87 -0.44063 0.654728 bgroup88 -0.53854 0.517634 bgroup89 -0.05305 0.476729 bgroup90 -0.21289 0.476975 bgroup91 -0.22661 0.491082 bgroup92 -0.20554 0.48344 bgroup93 0.611292 0.47022 bgroup94 0.05147 0.522492 bgroup95 0.272199 0.499739 bgroup96 -0.26087 0.652689 bgroup97 0.336548 0.482672 bgroup98 -0.17654 0.47932 bgroup99 0.201013 0.478517 bgroup100 0.032314 0.472579 bgroup101 -0.5148 0.506696 bgroup102 0.139965 0.4781 bgroup103 0.385259 0.484275 bgroup104 0.044434 0.518744 bgroup105 -0.2737 0.565249 bgroup106 -0.35145 0.478367 bgroup107 0.666191 0.474688

93
bgroup108 0.540829 0.565572 bgroup109 0.652361 0.486434 bgroup110 0.306411 0.494285 bgroup111 0.12448 0.508003 bgroup112 0.486136 0.506204 bgroup113 0.366375 0.480428 bgroup114 -0.04693 0.567369 bgroup115 0.131644 0.481654 bgroup116 0.176506 0.517012 bgroup117 0.16724 0.507496 bgroup118 0.314702 0.47104 bgroup119 0.266672 0.468332 bgroup120 0.314851 0.470169 bgroup121 0.086715 0.653477 bgroup122 0.415864 0.491611 bgroup123 -0.71281 0.567289 bgroup124 0.324697 0.482756 bgroup125 0.099562 0.509583 bgroup126 0.590173 0.65252 bgroup127 0.347399 0.489789 bgroup128 0.097649 0.505554 bgroup129 0.321852 0.487069 bgroup130 0.624193 0.505102 bgroup131 0.220692 0.48206 bgroup132 -0.07365 0.480718 bgroup133 0.295989 0.654238 bgroup134 -0.47354 0.494266 bgroup135 0.010532 0.497363 bgroup136 0.287169 0.537084 bgroup137 0.070088 0.502395 bgroup138 0.371341 0.504206 bgroup139 0.044551 0.481745 bgroup140 0.479166 0.478073 bgroup141 0.634687 0.516545 bgroup142 0.397967 0.493142 bgroup143 0.774651 0.53339 bgroup144 0.407061 0.652078 bgroup145 0.791487*** 0.478216 bgroup146 0.564528 0.492816

94
bgroup147 -0.04841 0.532363 bgroup148 0.323513 0.475859 bgroup149 0.538643 0.466302 bgroup150 0.551097 0.465596 bgroup151 0.870817*** 0.474065 bgroup152 0.603647 0.49538 bgroup153 0.650245 0.468164 bgroup154 0.689286 0.464032 bgroup155 0.57406 0.475632 bgroup156 1.096176** 0.486025 bgroup157 1.298452* 0.489265 bgroup158 0.450349 0.478428 bgroup159 0.627322 0.47406 bgroup160 0.522992 0.476915 bgroup161 0.94982** 0.4804 bgroup162 0.579008 0.471219 bgroup163 0.876082*** 0.469013 bgroup164 0.83866*** 0.479689 bgroup165 0.000411 0.653064 bgroup166 0.364309 0.564828 _cons 11.60829* 0.469756

95
Appendix E. Alternate Model Results Table 1E. Results Using Minimum Depth and Water Quality Radius of Buffer (m) 100 200 300 400 500 sqft 0.00026*a 0.00026* 0.00026* 0.00026* 0.00026* (0.00001)b (0.00001) (0.00001) (0.00001) (0.00001) acres 0.01817* 0.01848* 0.01889* 0.01869* 0.01856* (0.00382) (0.00383) (0.00382) (0.00381) (0.00380) age 0.00035 0.00034 0.00031 0.00032 0.00032 (0.00038) (0.00038) (0.00038) (0.00038) (0.00038) actlease 0.00021 0.00132 0.00211*** 0.00252**c 0.00281** (0.00179) (0.00137) (0.00124) (0.00121) (0.00123) cagelease 0.01008***d -0.00318 -0.01079* -0.01276* -0.01614* (0.00590) (0.00410) (0.00323) (0.00329) (0.00357) wqmin -0.04473 -0.04566 -0.04525 -0.04563 -0.03751 (0.03981) (0.03982) (0.03973) (0.03969) (0.03972) depthmin 0.00632 0.00625 0.00612 0.00608 0.00602 (0.00474) (0.00475) (0.00473) (0.00473) (0.00472) waterfront 0.19535* 0.19587* 0.19722* 0.19608* 0.19859* (0.04117) (0.04119) (0.04109) (0.04105) (0.04100) R2 0.5795 0.579 0.5811 0.5819 0.5831 a. Significant at 1% level b. Standard Error c. Significant at 5% level d. Significant at 10% level
Table 3E. Results Using Mean Water Quality Radius of Buffer (m) 100 200 300 400 500 sqft 0.00026* 0.00026* 0.00026* 0.00026* 0.00026* (0.00001) (0.00001) (0.00001) 90.00001) (0.00001) acres 0.01794* 0.01825) 0.01867* 0.01847* 0.01847* (0.00382) (0.00383) (0.00382) (0.00381) (0.00381) age 0.00034 0.00033 0.00030 0.00031 0.00031 (0.00038) (0.00038) (0.00038) (0.00038) (0.00038) actlease 0.00025 0.00140 0.00218*** 0.00259** 0.00259** (0.00179) (0.00137) (0.00124) (0.00121) (0.00121) cagelease 0.01018*** -0.00319 -0.01087* -0.01284* -0.01284* (0.00590) (0.00411) (0.00323) (0.00330) (0.00330)

96
wqmean -0.00387 -0.00476 -0.00648 -0.00839 -0.00839 (0.02951) (0.02953) (0.02948) (0.02948) (0.02948) waterfront 0.19544* 0.19593* 0.19728* 0.19612* 0.19612* (0.04119) (0.04122) (0.04112) (0.04107) (0.04107) R2 0.5788 0.5783 0.5804 0.5813 0.5825
Table 4E. Results Using Minimum Water Quality Radius of Buffer (m) 100 200 300 400 500 sqft 0.00026* 0.00026* 0.00026* 0.00026* 0.00026* (0.00001) (0.00001) (0.00001) (0.00001) (0.00001) acres 0.01800* 0.01831* 0.01873* 0.01853* 0.01839* (0.00382) (0.00383) (0.00382) (0.00381) (0.00380) age 0.00035 0.00034 0.00031 0.00032 0.00032 (0.00038) (0.00038) (0.00038) (0.00038) (0.00038) actlease 0.00023 0.00138 0.00217*** 0.00258** 0.00287** (0.00179) (0.00137) (0.00123) (0.00121) (0.00123) cagelease 0.01009*** -0.00316 -0.01083* -0.01280* -0.01618* (0.00590) (0.00410) (0.00323) (0.00329) (0.00357) wqmin -0.05030 -0.05117 -0.05066 -0.05101 -0.04287 (0.03960) (0.03961) (0.03951) (0.03948) (0.03951) waterfront 0.19510* 0.19559* 0.19695* 0.19582* 0.19833* (0.04118) (0.04120) (0.04110) (0.04105) (0.04100) R2 0.5791 0.5787 0.5807 0.5816 0.5827
Table 5E. Results Using Maximum Water Quality Radius of Buffer (m) 100 200 300 400 500 sqft 0.00026* 0.00026* 0.00026* 0.00026* 0.00026* (0.00001) (0.00001) (0.00001) (0.00001) (0.00001) acres 0.01795* 0.01826* 0.01867* 0.01847* 0.01834* (0.00382) (0.00383) (0.00382) (0.00381) (0.00380) age 0.00034 0.00034 0.00031 0.00031 0.00032 (0.00038) (0.00038) (0.00038) (0.00038) (0.00038) actlease 0.00025 0.00137 0.00213*** 0.00254** 0.00281** (0.00179) (0.00137) (0.00124) (0.00121) (0.00123) cagelease 0.01019*** -0.00316 -0.01085* -0.01279* -0.01638* (0.00590) (0.00411) (0.00323) (0.00330) (0.00356)

97
wqmax 0.00576 0.00538 0.00503 0.00423 0.00463 (0.01146) (0.01147) (0.01146) (0.01145) (0.01144) waterfront 0.19546* 0.19597* 0.19736* 0.19623* 0.19874* (0.04119) (0.04121) (0.04111) (0.04107) (0.04101) R2 0.5788 0.5784 0.5805 0.5813 0.5825
Table 6E. Results Using Mean Water Quality and All Lease Category Radius of Buffer (m) 100 200 300 400 500 sqft 0.00026* 0.00026* 0.00026* 0.00026* 0.00025* (0.00001) (0.00001) (0.00001) (0.00001) (0.00001) acres 0.02022* 0.02011* 0.02049* 0.01895* 0.01937* (0.00384) (0.00384) (0.00381) (0.00381) (0.00380) age 0.00028 0.00023 0.00022 0.00026 0.00026 (0.00038) (0.00038) (0.00037) (0.00038) (0.00037) actlease -0.00144 0.00038 0.00135 0.00225*** 0.00249** (0.00182) (0.00138) (0.00124) (0.00122) (0.00123) cagelease 0.00929 -0.00351 -0.01104* -0.01294* -0.01658* (0.00588) (0.00409) (0.00321) (0.00329) (0.00355) leasecat 0.13860* 0.10368* 0.12862* 0.07362* 0.11424* (0.03105) (0.02447) (0.02491) (0.02700) (0.02991) wqmean -0.00789 -0.00845 -0.00578 -0.00713 -0.00468 (0.02939) (0.02942) (0.02930) (0.02944) (0.02936) waterfront 0.18784* 0.18169* 0.18079* 0.18910* 0.19355* (0.04104) (0.04119) (0.04099) (0.04109) (0.04090) R2 0.5828 0.582 0.5858 0.5828 0.5854
Table 7E. Results Using Minimum Water Quality and All Lease Category Radius of Buffer (m) 100 200 300 400 500 sqft 0.00026* 0.00026* 0.00026* 0.00026* 0.00026* (0.00001) (0.00001) (0.00001) (0.00001) (0.00001) acres 0.02028* 0.02016* 0.02052* 0.01899* 0.01940* (0.00384) (0.00384) (0.00381) (0.00381) (0.00380) age 0.00029 0.00024 0.00022 0.00027 0.00026 (0.00038) (0.00038) (0.00037) (0.00038) (0.00037) actlease -0.00145 0.00037 0.00135 0.00225*** 0.00250** (0.00182) (0.00138) (0.00124) (0.00121) (0.00123)

98
cagelease 0.00920 -0.00348 -0.01100* -0.01290* -0.01640* (0.00588) (0.00409) (0.00321) (0.00329) (0.00355) leasecat 0.13841* 0.10347* 0.12781* 0.07253* 0.11313* (0.03102) (0.02445) (0.02491) (0.02701) (0.02993) wqmin -0.05058 -0.05115 -0.04475 -0.04709 -0.03689 (0.03942) (0.03945) (0.03929) (0.03944) (0.03941) waterfront 0.18756* 0.18142* 0.18061* 0.18892* 0.19331* (0.04103) (0.04117) (0.04097) (0.04107) (0.04089) R2 0.5831 0.5823 0.586 0.583 0.5856
Table 8E. Results Using Maximum Water Quality and All Lease Category Radius of Buffer (m) 100 200 300 400 500 sqft 0.00026* 0.00026* 0.00026* 0.00026* 0.00026* (0.00001) (0.00001) (0.00001) (0.00001) (0.00001) acres 0.02021* 0.02010* 0.02049* 0.01895* 0.01937* (0.00384) (0.00384) (0.00381) (0.00381) (0.00380) age 0.00029 0.00024 0.00022 0.00026 0.00026 (0.00038) (0.00038) (0.00037) (0.00038) (0.00037) actlease -0.00143 0.00037 0.00131 0.00219*** 0.00244** (0.00182) (0.00138) (0.00124) (0.00122) (0.00123) cagelease 0.00931 -0.00348 -0.01101* -0.01289* -0.01657* (0.00588) (0.00409) (0.00321) (0.00329) (0.00355) leasecat 0.13792* 0.10317* 0.12870* 0.07398* 0.11431* (0.03106) (0.02448) (0.02491) (0.02700) (0.02991) wqmax 0.00343 0.00332 0.00533 0.00491 0.00484 (0.01142) (0.01143) (0.01139) (0.01144) (0.01140) waterfront 0.18795* 0.18184* 0.18086* 0.18916* 0.19361* (0.04104) (0.04118) (0.04098) (0.04108) (0.04090) R2 0.5828 0.582 0.5858 0.5828 0.5855