texaco gasification process
TRANSCRIPT

EPA/540/R-94/514July 1995
TEXACO GASIFICATION PROCESS
INNOVATIVE TECHNOLOGY EVALUATION REPORT
NATIONAL RISK MANGEMENT RESEARCH LABORATORYOFFICE OF RESEARCH AND DEVELOPMENT
U.S. ENVIRONMENTAL PROTECTION AGENCYCINCINNATI, OHIO 45268
4% Printed on Recycled Paper

NOTICE
The information in this document has been prepared for the U.S. Environmental Protection Agency (EPA)Super-fund Innovative Technology Evaluation (SITE) Program under Contract No. 68-C9-0033. This documenthas been subjected to EPA’s peer and administrative reviews and has been approved for publication as an EPAdocument. Mention of trade names or commercial products does not constitute an endorsement orrecommendation for use.

FOREWORD
The U.S. Environmental Protection Agency is charged by Congress with protecting the Nation’s land, air, and waterresources. Under a mandate of national environmental laws, the Agency strives to formulate and implement actions leadingto a compatible balance between human activities and the ability of natural systems to support and nurture life. To meetthese mandates, EPA’s research program is providing data and technical support for solving environmental problems todayand building a science knowledge base necessary to manage our ecological resources wisely, understand how pollutantsaffect our health, and prevent or reduce environmental risks in the future.
The National Risk Management Research Laboratory is the Agency’s center for investigation of technological andmanagement approaches for reducing risks from threats to human health and the environment. The focus of the Laboratory’sresearch program is on methods for the prevention and control of pollution to air, land, water and subsurface resources;protection of water quality in public water systems ; remediation of contaminated sites and groundwater; and prevention andcontrol of indoor air pollution. The goal of this research effort is to catalyze development and implementation of innovative,cost-effective environmental technologies; develop scientific and engineering information needed by EPA to supportregulatory and policy decisions; and provide technical support and information transfer to ensure effective implementationof environmental regulations and strategies.
This publication has been produced as part of the Laboratory’s strategic long-term research plan. It is published andmade available by EPA’s Office of Research and Development to assist the user community and to link researchers with theirclients.
E. Timothy Oppelt, DirectorNational Risk Management Research Laboratory

CONTENTS
Notice . . . . . . . . . . . . . . . . . . . . . . . . . . . . . . . . . . . . . . . . . . . . . . . . . . . . . . . . . . . . . . . . . . . . . . . . . . . F o r e wa r d . . . . . . .. . . . . . . . . . . . . . . . . . . . . . . . . . . . . . . . . . . . . . . . . . . . . . . . . . . . . . . . . . . . . . . . . . . .Figures .. . . . . . . . . . . . . . . . . . . . . . . . . . . . . . . . . . . . . . . . . . . . . . . . . . . . . . . . . . . . . . . . . . . . . . . .Tables . . . . . . . . . . . . . . . . . . . . . . . . . . . . . . . . . . . . . . . . . . . . . . . . . . . . . . . . . . . . . . . . . . . . . . . . . .List of Abbreviations, Acronyms, and Symbols . . . . . . . . . . . . . . . . . . . . . . . . . . . . . . . . . . . . . . . . . .Conversion Factors . . . . . . . . . . . . . . . . . . . . . . . . . . . . . . . . . . . . . . . . . . . . . . . . . . . . . . . . . .Acknowledgements . . . . . . . . . . . . . . . . . . . . . . . . . . . . . . . . . . . . . . . . . . . . . . . . . . . . . . . . . . . . . . .
Executive Summary . . . . . . . . . . . . . . . . . . . . . . . . . . . . . . . . . . . . . . . . . . . . . . . . . . . . . . . . . . . . . . . 1
1 Introduction ................. .................................................1 .1 Background ............................................................1.2 Brief Description of Program and Reports .....................................1.3 Purpose of the Innovative Technology Evaluation Report (ITER) ...................1.4 Technology Description ............ ......................................1.5 Key Contacts ............................................................
2 Technology Applications Analysis . .. ...........................................2.1 Objectives - Performances versus ARARs ....................................
2.1.1 Comprehensive Environmental Response, Compensation,and Liability Actt . . . . . . . . . . . . . . . . . . . . . . . . . . . . . . . . . . . . . . . . . . . . . . . . . . . . .
2.1.2 Resource Conservation and Recovery Act . . . . . . . . . . . . . . . . . . . . . . . . . . . . . . .2.1.3 Clean Air Act ......................................................2.1.4 Safe Drinking Water Act .............................................2.15 Clean Water Act ...................................................2.1.6 Toxic Substances Control Act .........................................2.1.7 Occupational Safety and Health Administration Requirements ...............
2.2 Operability of the Technology ...............................................2.3 Applicable Wastes . . . . . . . . . . . . . . . . . . . . . . . . . . . . . . . . . . . . . . . . . . . . . . . . . . . . . . . . . . .2.4 Key Features ............................................................2.5 Availability and Transportability of Equipment ’.................................2.6 Materials Handling Requirements ...........................................2.7 Site Support Requirements .................................................2.8 Limitations of the Technology ...............................................
3 Economic Analysis . . . . . . . . . . . . . . . . . . . . . . . . . . . . . . . . . . . . . . . . . . . . . . . . . . . . . . . . . . . . .3.1 Conclusion of Economic Analysis ...........................................3.2 Basis of Economic Analysis ................................................3.3 Issues and Assumptions ...................................................3.4 Results .................................................................
3.4.1 Site Preparation Costs ..............................................3.4.2 Permitting and Regulatory Requirements . . . . . . . . . . . . . . . . . . . . . . . . . . . . . . . . .
iii i i
vil vil viil
X xl
778
1010272929
303637373838394042434445454647474950515152
V

CONTENTS (Continued)
3.4.3 Capital Equipment ..................................................3.4.4 Startup ...........................................................3.4.5 Labor . . . . . . . . . . . . . . . . . . . . . . . . . . . . . . . . . . . . . . . . . . . . . . . . . . . . . . . . . . . . . . .3.4.6 Consumables and Supplies . . . . . . . . . . . . . . . . . . . . . . . . . . . . . . . . . . . . . . . . . . . .3.4.7 Utilities ...........................................................3.4.8 Effluent Treatment and Disposal ......................................3.4.9 Residual Waste Shipping and Handling . . . . . . . . . . . . . . . . . . . . . . . . . . . . . . . . . .3.4.10 Analytical Services .................................................3.4.11 Maintenance and Modifications . . . . . . . . . . . . . . . . . . . . . . . . . . . . . . . . . . . . . . . .3.4.12 Demobilization ....................................................
Treatment Effectiveness . . . . . . . . . .. . . . . . . . . . . .. . . .. . . . . . . . . . . . . . . . . . . . . . . . . . . . . . . . . .4.14.24.3
4.4
4.54.6
l n t r o d u c t i o n . . . . . . . . . . . . . . . . . . . . . . . . . . . . . . . . . . . . . . . . . . . . . . . . . . . . . . . . . . . . . . . . .DRE . . . . . . . . . . . . . . . . . . . . . . . . . . . . . . . . . . . . . . . . . . . . . . . . . . . . . . . . . . . . . . . . . . . . . .Slag and Solid Residuals Leachability ........................................
4.3.1 Test Slurry Leaching Characteristics . . . . . . . . . . . . . . . . . . . . . . . . . . . . . . . . . . . .4.3.2 SITE Demonstration Results .........................................Synthesis Gas Products . . . . . . . . . . . . . . . . . . . . . . . . . . . . . . . . . . . . . . . . . . . . . . . . . . . .
4.4.1 Synthesis Gas Composition ...........................................4.4.2 Products of Incomplete Reaction (PIRs) ................................4.4.3 Particulate Emissions ...............................................4.4.4 Acid Gas Removal ..................................................Metals Partitioning ........................................................Process Wastewater . . . . . . . . . . . . . . . . . . . . . . . . . . . . . . . . . . . . . . . . . . . . . . . . . . . . . .
Other Technology Requirements .................................................5.1 Environmental Regulation Requirements . . . . . . . . . . . . . . . . . . . . . . . . . . . . . . . . . . . . .5.2 Personnellssues . . . . . . . . . . . . . . . . . . . . . . . . . . . . . . . . . . . . . . . . . . . . . . . . . . . . . . . . .5.3 Community Acceptance . . . . . . . . . . . . . . . . . . . . . . . . . . . . . . . . . . . . . . . . . . . . . . . . . . .
Technology Statuss . . . . . . . . . . . . . . . . . . . . . . . . . . . . . . . . . . . . . . . . . . . . . . . . . . . . . . . . . . . . .6.1 Petroleum Production Tank Bottoms Demonstration ............................6.2 El Dorado, Kansas Refinery Project ...................... . . .................
525354545454555555555656585959626363636565666769696970717171
Appendices
I Vendor Claims ............................................................................................................... 72
II Case Studies ................................................................................................................. 78
vi

Number
l-ll - 2l -3l -4l-5
Block Flow Diagram of MRL TGP during SITE Demonstration . . . . . . . . . . . . . . . . . . . .Solids Grinding and Slurry Preparation Unit Process Flow Diagram . . . . . . . . . . . . . . .High Pressure Solids Gasification Unit Process Flow Diagram . . . . . . . . . . . . . . . . . . .Acid Gas Removal Unit Process Flow Diagram ................................Sulfur Removal Unit Process Flow Diagram ..................................
ES-l2-l3-l3-24-l4-2
4-34-44-5
I-1l-2II-1
TABLES
Number
Evaluation Criteria for the Texaco Gasification Process Technology ...............Federal and State ARARs for the Texaco Gasification Process Technology .........Treatment Costs Associated with the TGP ....................................Capital Costs for the TGP Unit ..............................................Composition of Demonstration Slurry Feed ....................................Destruction and Removal Efficiencies (DREs) for Principal Organic Hazardous
Constituent (POHC) - Chlorobenzene .........................................TCLP and WET-STLC Results - Lead and Barium ..............................Synthesis Gas Composition ................................................Mass Flow Rates and Total Concentrations of Lead and Barium in SlurryFeed and Solid Residuals................................: . . . . . . . . . . . . . . . . . .Syngas Composition Data-On-Line Analysis ..................................Mass Flow Rates of Lead and Barium in Slurry Feed and Solid Residuals ...........Raw Syngas Composition and Heating Value ...................................
1213162123
Paqe
431485358
606164
67747580
vii

LIST OF ABBREVIATIONS, ACRONYMS, AND SYMBOLS
ACLArARARATTICBaBtuCAACAL/EPACCRCERCLACERICFRCH,C OCO,C O S
YWADOTDREdscfEPA“FFSftFWEIFWQCgpmgrHZHPSGUH2ShITERkgkWhLlbLPSGUm3MCLmg
alternate concentration limitargonApplicable or Relevant and Appropriate RequirementsAlternative Treatment Technology Information CenterbariumBritish thermal unitClean Air ActCalifornia Environmental Protection AgencyCalifornia Code of RegulationsComprehensive Environmental Response, Compensation, and Liability ActCenter for Environmental Research InformationCode of Federal Regulationsmethanecarbon monoxidecarbon dioxide
. .
carbonyl sulfidecubicClean Water ActDepartment of Transportationdestruction and removal efficiencydry standard cubic feetUnited States Environmental Protection Agencydegrees Fahrenheitfeasibility studyfeetFoster Wheeler Enviresponse, IncorporatedFederal Water Quality Criteriagallons per minutegrainshydrogen
*High Pressure Solids Gasification Unithydrogen sulfidehourInnovative Technology Evaluation ReportkilogramkilowatthourliterpoundsLow Pressure Solids Gasification Unitcubic metermaximum contaminant levelmilligram
VIII
LIST OF ABBREVIATIONS, ACRONYMS, AND SYMBOLS (Continued)
minMRLN,NAAQSNO,NPDESNTISORDOSHAOSWERPbPCBPCDDPCDFPIRPOHCPPEppmppmv
!ZIpsigRCRASARASCAQMDSDWASSITESO,s v o cTCLPTGPTHCtpdTSCATSDVISITTV O CWET-STLCWWTUyd
minuteMontebello Research LaboratorynitrogenNational Ambient Air Quality Standardsnitrogen oxideNational Pollutant Discharge Elimination SystemNational Technical Information SystemOffice of Research and DevelopmentOccupational Safety and Health AdministrationOffice of Solid Waste and Emergency Responseleadpolychlorinated biphenylpolychlorinated dibenzodioxinpolychlorinated dibenzofuranproduct of incomplete reactionprincipal organic hazardous constituentpersonal protective equipmentparts per millionparts per million, by volume parts per quadrillionprevention of significant deteriorationpounds per square inch gaugeResource Conservation and Recovery ActSuperfund Amendments and Reauthorization ActSouth Coast Air Quality Management DistrictSafe Drinking Water ActsecondSuperfund Innovative Technology Evaluationsulfur oxidesemivolatile organic compoundToxicity Characteristic Leaching ProcedureTexaco Gasification Processtotal hydrocarbonstons per dayToxic Substances Control Acttreatment, storage, and disposalVendor Information System for Innovative Treatment Technologiesvolatile organic compoundWaste Extraction Test-Soluble Threshold Limit Concentrationwastewater treatment unityard
ix

CONVERSION FACTORS
Length
Area:
Volume:
Pressure:
Energy:
Temperature:
English (US)
1 foot (ft)
1 square foot <fF)
1 gallon (gal)
1 cubic foot (fl?)
1 grain (gr)
1 pound (lb)
1 ton (t)
1 pound per square inch (psi)
1 pound per square inch (psi)
1 British Thermal Unit (Btu)
1 kilowatthour (kWh)
eFahrenhei t (“F ) - 32)
Factor
0.305
0.0929
3.78
0.0283
64.8
0.454
907
0.0703
6.895
1.05
3.60
0.556
Metric
meter (m)
square meter (m’>
liter (L)
cubic meter (rn?
milligram (mg)
kilogram (kg)
kilogram (kg)
kilogram per squarecentimeter (kg/cm?
kilopascal (kPa)
kilojoule (kJ)
megajoule (MJ)
%elsiu s (%)

ACKNOWLEDGEMENTS
This report was prepared under the direction of Marta K. Richards, EPA Superfund Innovative TechnologyEvaluation (SITE) Project Manager at the Risk Reduction Engineering Laboratory, Cincinnati, Ohio.Contributors and reviewers of this report included Donald A. Oberacker, Gregory J. Carroll, Jeffrey Worthington,and Gordon E. Evans of U.S. EPA’s Risk Reduction Engineering Laboratory and Jerrold S. Kassman, JohnWinter, John Stevenson, and Richard B. Zang of Texaco Inc.
This report was prepared for EPA’s SITE Program by Foster Wheeler Enviresponse, Inc. (FWEI) inEdison, New Jersey under EPA Contract No. 68-C9-0033. The FWEI SITE Project Manager for this projectwas Seymour Rosenthal. FWEI contributors and reviewers for this report were James P. Stumbar, HenryNjuguna, and Marilyn Avery. Michelle Kuhn provided expert word processing support.
The authors would like to acknowledge the assistance provided by Robert S. Burton Ill and the MontebelloResearch Laboratory operations staff in planning, preparing for, and supporting the SITE Demonstration andthe Radian Corporation staff for their professional expertise in the collection and analysis of samples.
xi

EXECUTIVE SUMMARY
This report summarizes the evaluation of the Texaco Gasification Process (TGP) conducted under
the U.S. Environmental Protection Agency (EPA) Superfund Innovative Technology Evaluation (SITE)
Program. The Texaco Gasification Process was developed by Texaco Inc.
The TGP is a commercial gasification process which converts organic materials into syngas, a
mixture of hydrogen and carbon monoxide. The feed reacts with a limited amount of oxygen (partial
oxidation) in a refractory-lined reactor at temperatures between 2,200’ and 2,650OF’ and at pressures
above 250 pounds per square inch gauge (psig). According to Texaco, these severe conditions destroy
hydrocarbons and organics in the feed and avoid the formation of undesirable organic by-products
associated with other fossil fuel conversion processes. At such high operating temperatures, the
residual ash melts-forming an inert glass-like slag.
Texaco reports that the syngas can be processed into high-purity hydrogen, ammonia, methanol,
and other chemicals, as well as clean fuel for electric power.
The SITE Program evaluated the TGP’s ability to treat hazardous waste materials containing both
organic compounds and inorganic heavy metal. The primary technical objectives of the Demonstration
were to determine the TGP’s ability to:
Produce a usable syngas product;
Achieve 99.99 percent Destruction and Removal Efficiencies (DREs) for organic compounds;
and
Produce a non-hazardous primary solid residual-coarse slag-and secondary solid
residuals-fine slag and clarifier bottoms.
‘A list of conversion factors precedes the text.

Additionally, the Demonstration test results and observations were evaluated to:
o Develop overall capital and operating cost data; and
l Assess the reliability and efficiency of the TGP operations.
The TGP was evaluated under the EPA SITE Program in January 1994 at Texaco’s Montebello
Research Laboratory (MRL) in South El Monte, California, located in the greater Los Angeles area. The
Demonstration used a soil feed mixture consisting of approximately 20 weight-percent waste soil from
the Purity Oil Sales Superfund Site, Fresno, California and 80 weight-percent clean soil. The mixture
was gasified as a slurry in water. The slurry also included coal as a support fuel and was spiked with
lead and barium compounds (inorganic heavy metals) and chlorobenzene (volatile organic compound)
as the Principal Organic Hazardous Constituent (POHC). information on the TGP and results of the SITE
Demonstration at the Texaco MRL are provided herein.
The findings of the TGP SITE Demonstration are as follows:
The TGP produced a syngas that can be used as feed for chemical synthesis facilities or as a
clean fuel for the production of electrical power when cornbusted in a gas turbine. The average
composition of the dry synthesis gas product consisted of 37 percent hydrogen, 39 percent
carbon monoxide, and 21 percent carbon dioxide. No organic contaminants, other than
methane (55 ppml, exceeded 0.1 ppm. The average heating value of the gas, a readily
combustible fuel, was 239 British thermal units (Btu) per dry standard cubic foot (dscf).
The DRE for the designated POHC (chlorobenzene) was greater than the 99.99 percent goal.
The average Toxicity Characteristic Leaching Procedure (TCLP) measurement for the coarse slag
was lower than the regulatory levels for lead (5 milligrams per liter) (mg/L) and barium (100
mg/L). The average California Waste Extraction Test (WET)-Soluble Threshold Limit
Concentration (STLC) measurement for the coarse’ slag was lower than regulatory value for
barium (100 mg/L) and higher than the regulatory value for lead (5 mg/L).
Volatile heavy metals, such as lead, tend to partition and concentrate in the secondary TGP
solid products--fine slag and clarifier solids. The average TCLP and WET-STLC measurements
for these secondary TGP solid products were higher than the regulatory limits for lead but lower
than the regulatory limits for barium.
Texaco estimates an overall treatment cost of $308 per ton of soil for a proposed transportable
unit designed to process 100 tons per day (tpd) of soil with characteristics similar to that from
2

the Purity Oil Sales Superfund Site, based on a value of $1.00/million Btu for the syngas
product. Texaco estimates an overall treatment cost of $225 per ton of soil for a proposed
stationary unit designed to process 200 tpd of soil, at a central site, with characteristics similar
to that from the Purity Oil Sales Superfund Site, based on a value of $2.00/million Btu for the
syngas product.
l Based on the successful operation of the TGP during the SITE Demonstration and post-
demonstration processing of the remaining slurry inventory, it is expected that in continuous
operations, proposed commercial units can operate at on-stream efficiencies of 70 to 80
percent allowing for scheduled maintenance and intermittent, unscheduled shutdowns.
The TGP technology evaluation applied the EPA’s standard nine criteria from the Superfund
feasibility study (FS) process. Summary conclusions appear in Table ES-l.
3

?%?pasleo 'hssq6
Buywa)-uou‘)!os alsm ,oa olu! s)alaw
uoi ,ad SZZ$ 01hmaq az!)!qoluw!is03 Ile,aAo aql01 la!lualod a t3u!
aonpa, A134 ,asn‘sMVklV-1wlsuourap pualmpo,d se6uhsm)!3ads-uo!le3o)sl”a”!wal”o3
a ql!~ uo!le,t3alu!ql!~ awe!)dwo33!ue6,0 Byhowan!ma),a.le!,aleura,!nba, heu~ l!un-ap Aq uo!la,6!w
a,oul ql!~ 1ue)d40 aum)oA.slenp!sa,luarulaa,l al!sal!s-,,o puspal!+hl)e,lua3))e,aAo sampa,m qly panowa,-uo $0 uo!ia,ado“o!la”!wal”o3
‘A,euo!lels.pa,!nba, ea,e6e)s hsse)G 01,o pahowap a,epue uo~l3n,lsuo3,alannpuno,6‘,a6,el vssaDo,d a6,el)!os 40 uo!impaysiuau~waluo3 ai!Spua uo!iaAe3xg,aql,n, sluar\a,d
.shap 06 ueql,alea,6 10) )!os‘Gu!h,m~s
paleu!uraluo301 ,o!,d lualuleaaa,ols 01 lyuadpue ‘6u!)pueq
a pus ‘lguad‘uo!ieAemasuo!ss!u,aGu!,np
,!a ua ‘walshs,!a 01 pasaa)a,luau_qaa,lsuo!ss!u.ta.Eia)s 88,803
aql ale. ale)na!vedhssel6 6yq3ea).(alse~-,ado 01 l+u,ad‘ameldamepue s~ueuy.ieluo3-uou e ‘lmpo,d.6e)ssnop,ezaq
a :se qms ‘sl!wh1pJnwwo3‘pas alsew01 amsodxa pusp!,os h,euydas,803 Assale JO) suo!leln6a,-,ad Gu!le,adodo)aAap 01)o uol ,ad fjo~$amsodxa as!ouaql olu! s)alaur6uy3eal-uou a)asods!p pue) pus‘(!OS “! SlUB”!
a,!nba, Aeu~Uo,)a iue3!)!u6!sh~aleur!ro,dde lawo,, A1&mJ,w03hlreaq +.te6,ou!olu! s)alalu AAaaq‘a6a,ols ‘iualu-uleluoa 3!uaB,osa!ma6e h~oielna,!nba, heuiyn uo!pn,wappue s,ayow 01azyqowu! 01o!ue6,ou! az!(!qoru-6a, alels ‘suo!l
-lea,1 wtm)-u! pua 3!ua6,0l!un uo!lm,lsap)elu,aql a)qel,od3)alacusqsy cu,al-l,oqs)epualod a salells-LU! 01 (wwaiod13~ hlattoaauqloq 01 amsodxa
-38 arr!pa,,o3pzw,aql ‘a,nssa,d-sue,) ‘a,nssa,dh,waq 6u!u!e1uo3le!lualod alau-uou,ap pus slueua sale,lsuoruappus “CM16u!1eu!lu!)a hq
vtl3tf $0 uad~46~ ‘amlwadwalq6!q ‘a,nle,adlualsaw3v 10,+!)a 01 pa,!nba,-!uleiuo3 aye6pus sluau!weiuo3-an,asuo3 a3,nosuo!palo,d w,aise paimpuo3q6i1.1 ‘nl!s4634 ‘xa)dwoapa,!nba, Gu!lsala,a s)o,wo3 as!ou-10 3!XO1 ShOJlSrye6lo shoals-aH q1y awe-6~0) pua -uoqs
s! uo!le!paura, 4)-xa ‘a)ms-a6,e-)‘a)ewa6,e-)hlyqalaa,~pue S”O!SS!Lu~-ap h)afyioa443-ap h)aw3a)43-!)du,oD sa,!nbauq1oq sap!Ao,d
amaldamaaauaidacmal .wo3hg)!qa)uatua)drulssauaA!laafialuauIlaa,~amauauuad.swwl”aur”o,!A”aalal6h~pnluuko~wlawoqsq6noy) aum,o~P”=lwapaj ql!~aql pus
10 ‘hlJ!)!qowssauaA!l3aHaacwa!)dtuo3ql)aaq uaurnq‘Alppima)-6uol40 uo!laalo,d
40 “0!13”pat(w-0
spw!J3
A6OlOUl(3al SSa3OJd uogeagseg 03exal ay) JO4 epagr3 uogenp3 - L-S3 alqel

Table ES-1. (Continued)
Criteria
Overallprotection ofhuman health
and theenvironment
Requiresmeasures toprotect workersand communityduringexcavation,handling, andtreatment.
Reduction ofLong-term toxicity,
Compliance effectiveness mobility, orwith Federal and volume through Short-term Community State
ARARs* permanence treatment effectiveness Implementability cost** acceptance acceptance
Emission controls The potential Large-scale Simultaneousare needed to immobilization of transportable 100 treatment ofensure heavy metals into tpd unit on organic and in-compliance with non-leaching multiple trans- organic contami-air quality glassy, coarse portable skids nants with creditsstandards, if slag requires requires large for resultingvolatile further testing for scale remediation syngas productcompounds and anticipated long- with on-site may overcomeparticulate term stability. commitment of initial costemissions occur more than disadvantage.during 50,000 tons ofexcavation, soil and 2 yearshandling, and of operation.treatment prior toslurrying.
Wastewater dis- Fine slag andcharges to treat- clarifier solidsment facilities or may requiresurface water further treatment,bodies requires particularly whencompliance with volatile heavyClean Water Act metals areregulations. present.
Initial transport-able unit can beconstructed andmay be availablein 24 months.
CERCLA defines Wastewaters Large size of unitdrinking water require further and ex-situ ther-standards estab- treatment to mal destructionlished under the effect long-term basis for unit maySafe Drinking stability of provide delays inWater Act that contaminants and approvals andapply to remedia- reuse of water. permits.tion of Superfundsites.

Table ES-l. (Continued)
Criteria
Overallprotection ofhuman health
and theenvironment
Compliancewith Federal
ARARs’
Requires compli-ance with ToxicSubstances Con-trol Act treatmentand disposalregulations forwastescontainingpolychlorinatedbiphenyls.
Long-termeffectiveness
andpermanence
Reduction oftoxicity,
mobility, orvolume through
treatmentShort-term Community state
effectiveness Implementability cost** acceptance acceptance
CERCLA remedialactions andRCRA correctiveactions to beperformed inaccordance withOccupationalSafety and HealthAdministrationrequirements.
* Applicable or relevant and appropriate requirements. * * Actual cost of a remediation technology is highly site-specific and dependent on matrix characteristics. See Economic Analysis-- Section 3 of this ITER.

SECTION 1
INTRODUCTION
1.1
gas,
BACKGROUND
The Texaco Gasification Process (TGP) has been used to gasify conventional fuels, such as natural
liquid petroleum fractions, coal, and petroleum coke for more than 45 years. More than 40
gasification plants are either operational or under development worldwide.
According to Texaco, wastes containing a broad range of hydrocarbon compounds have been
gasified successfully. They have demonstrated gasification of coal liquefaction residues, verifying the
nonhazardous content of the product and treated effluent streams. In a program sponsored by the
California Department of Health Services, Texaco reports the successful gasification of California
hazardous waste material from an oil production field. This program converted petroleum production
tank bottoms to synthesis gas and nonhazardous effluent streams. Texaco has also gasified mixtures
of municipal sewage sludge and coal. The data generated in these studies formed the basis for permit
applications prepared by Texaco for commercial facilities in the United States. Texaco has also gasified
surrogate contaminated soil (clean soil mixed with unused motor oil), which was slurried with coal and
water. According to Texaco, the effluent streams from gasifying this feed were nonhazardous.
Waste gasification is an innovative extension of Texaco’s conventional fuels gasification
technology that reacts carbonaceous materials with a limited amount of oxygen (partial oxidation) at
high temperatures. Hazardous waste gasification, using the TGP, offers an environmentally attractive
alternative to other thermal and stabilization technologies. The TGP destroys any hydrocarbons in the
feed and effectively recycles the waste by transforming it into clean gas for use as fuel for power
generation or an intermediate product for the manufacture of transportation fuels, fertilizers, or
chemicals. The residual mineral matter solidifies into small pieces of glassy slag. Texaco reports that
extensive testing has shown the aqueous effluent streams to be free of priority pollutants and
7

acceptable for discharge after pretreatment by conventional wastewater technology. None of the
effluent streams contained measurable concentrations of dioxins or furans.
Given its ability to deal with a variety of feedstocks, destroy organic compounds, produce a useful
synthesis gas, and solidify inorganic compounds into potentially inert glassy slag, TGP offers an
effective treatment alternative for hazardous wastes.
1.2 BRIEF DESCRIPTION OF PROGRAM AND REPORTS
The SITE Program is a formal program established by EPA’s Office of Solid Waste and Emergency
Response (OSWER) and Office of Research and Development (ORD) in response to the Superfund
Amendments and Reauthorization Act of 1986 (SARA). The SITE Program’s primary purpose is to
maximize the use of alternative remedies in cleaning hazardous waste sites by encouraging the
development and demonstration of new, innovative treatment and monitoring technologies. The SITE
Program consists of four major elements discussed below.
The Demonstration Program develops reliable performance and cost data on innovative
technologies so that potential users may assess the technology’s site-specific applicability. The
selected technologies are either currently available or close to being available for remediation of
Superfund sites. SITE Demonstrations are conducted on hazardous waste sites under conditions that
closely simulate full-scale remediation conditions, thus assuring the usefulness and reliability of
information collected. The data collected are used to assess the performance of the technology, the
potential need for pre- and post-treatment processing of wastes, possible operating problems, and the
approximate costs. The Demonstrations also allow for evaluation of long-term risks, operating costs,
and maintenance.
The Emerging Technology Program focuses on successfully proven, bench-scale technologies
which are in an early stage of development involving pilot or laboratory testing. It encourages
successful technologies to advance to the Demonstration Program.
The Monitoring and Measurement Technologies Program identifies existing technologies which
improve field monitoring and site characterizations. New technologies that provide faster, more cost-
effective contamination and site assessment data are supported by this program. The Monitoring and
8
Measurement Technology Program also formulates the protocols and standard operating procedures for
demonstrating methods and equipment.
The Technology Transfer Program disseminates technical information on innovative technologies
in the Demonstration, Emerging Technology, and Monitoring and Measurements Technology Programs
through various activities. These activities increase the awareness and promote the use of innovative
technologies for assessment and remediation at Superfund sites. The goal of technology transfer
activities is to develop interactive communication among individuals requiring up-to-date technical
information.
Technologies are selected for the SITE Demonstration Program through annual requests for
proposals. ORD staff review the proposals to determine which technologies show the most promise
for use at Superfund sites. Technologies must be at the pilot- or full-scale stage. Mobile technologies
and innovative technologies that incorporate unique design features and may offer advantages over
conventional existing processes for the remediation of hazardous waste matrices are of particular
interest.
Once EPA has accepted a proposal, a cooperative agreement between EPA and the developer
establishes responsibilities for conducting the demonstrations and evaluating the technology. The
developer is responsible for demonstrating the technology at the selected site and is expected to pay
any costs for transport, operations, and removal of the equipment. EPA is responsible for project
planning, sampling and analysis, quality assurance and quality control, preparing reports, disseminating
information, and transporting and disposing of treated waste materials.
The results of the TGP demonstration are published in two (basic) documents: the SITE
Technology Capsule and the Innovative Technology Evaluation Report (ITER). The SITE Technology
Capsule provides relevant summary information on the technology and key results of the SITE
Demonstration. The ITER content is defined in Section 1.3 and presented in the succeeding sections.
It provides detailed discussions of the technology and the results of the SITE Demonstration. Both
publications are intended for use by remedial managers evaluating the technology for a specific site and
waste.
An additional document, the Technology Evaluation Report (TER) contains all of the records and
data acquired during the predemonstration, demonstration, and post-demonstration phases of the test
9

program. It is available, on request, from the EPA SITE Project Manager listed in Section 1.5-Key
Contacts.
1.3 PURPOSE OF THE INNOVATIVE TECHNOLOGY EVALUATION REPORT (ITER)
The ITER provides definitive information on the technology, SITE Demonstration and ‘its results,
and conclusions and discussions about the applicability and effectiveness of the technology to
remediate hazardous waste sites based on the Demonstration results. The ITER is intended for use by
EPA remedial project managers, EPA on-scene coordinators, contractors, and other decisionmakers who
implement specific remedial actions. The ITER is designed to aid them in further evaluating the specific
technology as an applicable option in a particular cleanup operation.
This report represents a critical step in the development and commercialization of a treatment
technology. To encourage the general use of demonstrated technologies, EPA provides information
regarding the applicability of each technology to specific sites and wastes. The ITER also includes
information on cost and site-specific characteristics. It discusses advantages, disadvantages, and
limitations of the technology.
Each SITE Demonstration evaluates the performance of a technology in treating a specific waste.
The characteristics of wastes at or from other sites may differ from the characteristics of the treated
waste. Therefore, a successful field demonstration of a technology on a specific site waste or at a
specific site does not necessarily ensure that it will be applicable at other sites or to other waste
matrices. Data from the field demonstration may require extrapolation for estimating the operating
ranges in which the technology will perform satisfactorily.
1.4 TECHNOLOGY DESCRIPTION
1.4.1 Process Units
Texaco maintains three pilot-scale gasification units with ancillary units and miscellaneous
equipment at the Montebello Research Laboratory (MRL), where the SITE Demonstration was
conducted. Each gasification unit at MRL can handle a nominal throughput of 25 tpd of coal. The High
Pressure Solids Gasification Units I and II (HPSGU I and II) and the Low Pressure Solid Gasification Unit
(LPSGU) are rated for operation at pressures up to 1,200 psig and 400 psig, respectively. HPSGU I and
10

II use a direct quench. mode for cooling the gas, while the LPSGU adds the option of cooling the gas
by indirect heat exchange with water. Only one of the three units operates at a given time.
This SITE Demonstration evaluated the operation of the HPSGU II in conjunction with other
systems for the storage and grinding of solid fuels, generation and storage of slurries, acid gas removal,
sulfur removal, and on-site wastewater treatment. Figure 1-1 is a block flow diagram, which identifies
the major subsystems.
1.4.2 Solids Grinding and Slurry Preparation Unit
The feed was prepared in the Solids Grinding and Slurry Preparation Unit in a two-step process:
l Dry solids were crushed in a hammer mill.
l The crushed solids were ground and mixed with the waste and water in a wet rod mill.
Figure 1-2 is the process flow diagram for the Solids Grinding and Slurry Preparation Unit.
1.4.2.1 Crushing--
Coal arrived at the plant in bottom-dumping ‘trucks that loaded it directly into a truck dump
hopper, or piled it on-site for storage. (Skip loaders transferred stored coal to the truck dump hopper.)
From the truck dump hopper, the coal traveled on a feed belt to a bucket elevator, which delivered it
either to the coal silo or to the smaller, bypass hopper, From either device, the coal dropped onto a
conveyor belt, passed through a magnetic separator and a metal detector, and entered the hammer mill.
A conveyor belt scale controlled the coal feed rate to the hammer mill. The hammer mill crushed the
coal to a size appropriate for feeding to the wet rod mill. The crushed coal was conveyed to the mill
feed hopper.
1.4.2.2 Waste Feed--
The contaminated soil was dumped from drums into the waste feed hopper and metered into the
wet rod mill using a bin feeder and bucket elevator system. The soil addition started after the wet rod
mill had been started; it was completed before the wet rod mill shutdown to ensure that all the soil was
11

,
Fig
ure
l-l
. B
lock
Flo
w D
iag
ram
of
MR
L T
GP
Du
rin
g S
ITE
Dem
on
stra
tio
n.

c.
I..
13
transferred to the slurry storage tanks. The slurry in the tanks was analyzed to determine the solids
concentration in the slurry.
l.4.2.3 Slurrying--
For the preparation of the Purity Oil soil slurry, the mill feed hopper dropped the coal onto a weigh
belt that metered its flow into the wet rod mill where it was simultaneously ground and slurried with
water. A belt scale controlled the speed of the weigh belt to achieve the desired feed rate. The mill
feed water line mixed water with the coal and the contaminated soil at the entrance to the wet rod mill.
The mill discharged the slurry, which passed through a screen, into the slurry surge tank. Pumps
moved it to the gasification slurry storage tanks. During grinding, frequent grab samples of the slurry
provided a means of determining the solids concentration. An operator then adjusted the mill water
feed rate as required. A small quantity of oversized material, screened from the slurry, was collected
in a bin for proper disposal or recycled through the solids grinding system.
For the extended SITE Demonstration, additional slurry was required and prepared using clean soil
since further supplies of Purity Oil soil were not readily available. For the preparation of the clean soil
slurry, coal and clean soil were weighed, using a front-end loader and a truck scale. The truck dump
hopper was filled with alternating loads of coal and soil at the predetermined ratio. Any lime required
to control slag viscosity was preweighed and added to the hopper with the soil.
SAE 30 oil from preweighed drums was added at the wet rod mill inlet using a pneumatic pump.
The oil was added to match the heating value of the Purity Oil soil in the Purity Oil soil slurry and to
provide a similar level of hydrocarbon contamination in the clean soil slurry. Had any operating
problems with the oil transfer pump occurred, the oil in the drums could have been added directly to
the slurry in the slurry storage tank.
1.4.2.4 Additives-
Gypsum, a dry additive (ash viscosity modifier), entered the process through a dry additive hopper
in the same manner as the contaminated soil. A surfactant liquid additive (slurry viscosity modifier),
entered the feed in the wet rod mill via the mill feed water line.
14

1.4.2.5 Particulate and Odor Emissions Control-
The Solids Grinding and Slurry Preparation Unit included a baghouse and dust control system to
control particulate emissions. Enclosed coal conveyor belts and coal handling equipment upstream of
the weigh belts operated under a slight negative pressure. The baghouse collected particulates and
recycled them to the process downstream of the hammer mill. The gas discharge from the baghouse
passed through a carbon canister for organics removal. In addition, a nitrogen blanket on the coal silo
prevented the creation of an explosive atmosphere. The wet rod mill and slurry storage tank were
enclosed and the vent line from them was also routed to a carbon canister for organics removal.
1.4.3 High Pressure Solids Gasification Unit
The HPSGU II can handle a nominal throughput of 25 tpd of coal. The gasifier was designed to
operate at pressures up to 1,200 psig and internal temperatures up to 2,800’F. This unit is a direct
quench gasifier where the hot syngas and molten slag are
1-3 shows the process flow diagram for the HPSGU II.
l.4.3.1 Slurry Feed System-.
cooled by direct contact with water. Figure
For the preparation of the SITE Demonstration slurry, the clean soil slurry was blended with a
portion of the Purity Oil soil slurry to produce the mixed test slurry for the SITE Demonstration runs.
The blending was accomplished by filling a slurry storage tank to the appropriate level with one of the
slurries and then adding the required amount of the other slurry to achieve the desired level in the tank.
The quantity of each slurry was measured by slurry storage tank level.
The mixed test slurry was pumped to the two gasification slurry storage tanks and the single
slurry run tank located adjacent to the HPSGU II. The tank group held sufficient capacity for a 3 to 4-
day gasification test. Slurry from any of the MRL storage tanks could be fed to the gasifier run tank.
The slurry storage and run tanks, equipped with paddle mixers and slurry circulation/transfer
pumps, kept the slurry in constant motion and maintained homogeneity. Agitation was enhanced by
sparging the tanks with nitrogen. All of the tanks were equipped with vibrating screens to separate
oversized material from the slurry.
15

__,~“““.~“_~“. “,:: z “j “,,___“... “4
r-_-?“J “” 23 ,I-’ I
, L----,i’ /L---l”--“. __i
I
30iiLH&=
16

Conventional charge pumps fed the slurry from the slurry run tank to the gasifier. The slurry flow
rate was varied by adjusting the charge pump speed; it was monitored by several flow meters. The
slurry run tank was mounted on a scale, allowing an additional check (by weight) on the slurry charge
rate.
For the TGP SITE Demonstration, a metering pump injected the chlorobenzene organic liquid spike
into the slurry flow at the gasifier inlet. The barium nitrate and lead nitrate inorganic metal salts had
been weighed and directly added to the slurry in each of the slurry storage tanks.
High purity oxygen supplied the oxidant feed to the gasifier. Stored on site as a liquid, the oxygen
was vaporized and heated under high pressure before being charged to the gasifier. The oxygen flow
to the gasifier was measured and controlled.
1.4.3.2 Gasification--
The HPSGU II is a two-compartment vessel, consisting of an upper refractory-lined, reaction
chamber and a lower quench chamber. Oxygen and slurry feeds were charged through an injector
nozzle into the reaction chamber where they reacted under highly reducing conditions to produce raw
syngas and molten ash. The following chemical conversion formula describes the continuous,
entrained-flow, pressurized, non-catalytic, partial-oxidation TGP process, in which the carbonaceous
materials react with oxygen or air:
C,H, + n/2 02------ > nC0 + m/2 H,
The gasifier temperature was measured and controlled to maintain an operating temperature
sufficient to convert the soil and coal ash into molten slag by adjusting the oxygen-to-slurry feed rate
ratio. The raw syngas consisted primarily of carbon monoxide and hydrogen, with lesser quantities of
carbon dioxide and traces of methane. Chlorinated species in the feed became hydrogen chloride in
the raw syngas. Any sulfur in the feed was converted into hydrogen sulfide and carbonyl sulfide, and
any unreacted fuel was converted to char. The average pressure was 500 psig. The pressure was
controlled by a control valve downstream of the gas coolers.
From the reaction chamber, the raw syngas and molten ash flowed into the quench chamber,
where the water cooled and partially scrubbed the raw syngas. It also converted the molten ash into
17

small pieces of glassy slag, which then passed down into the lockhopper. The quench water was then
cooled and directed to the clarifier to remove solids.
1.4.3.3 Gas Scrubbing and Cooling--
The raw syngas leaving the quench chamber contacted additional water in the raw gas scrubber,
which further reduced the hydrogen chloride and particulate content in the syngas. The scrubber water
combined with the quench water and was cooled before flowing to the clarifier. The scrubbed raw
syngas was further cooled in a heat exchanger separating the entrained liquid water condensate from
the gas in the high pressure knockout pot. The pressure of the scrubbed raw syngas was lowered and
any additional entrained water separated from the gas in the low pressure knockout pot was routed to
the HPSGU II sump. After the gas exited this second knockout pot, the flow was measured and
samples were taken. The gas was then fed to the Acid Gas Removal Unit for cleanup before flaring.
1.4.3.4 Solids Recovery and Water Handling--
Due to the nature of the solids residuals/gas quenching and scrubbing methods, two separate
solids/water handling systems were necessary. The lockhopper system handled the coarse and fine
slag solids. The quench/scrubber system both cooled and scrubbed the raw syngas, and then
recovered entrained particulate.
Lockhopper Svstem--The lockhopper system used a cyclic mode of operation to remove coarse
and fine slag solids from the gasification unit. During the collection cycle, the lockhopper was open
to the gasifier at gasifier pressure. The slag from the quench chamber fell through the top valve and
accumulated in the lockhopper.
In the discharge cycle, the top lockhopper valve closed, and the lockhopper was depressured to
atmospheric pressure. The bottom lockhopper and lockhopper flush tank discharge valves opened,
allowing water from the flush tank to move the contents of the lockhopper into the slag receiver below.
As the flush tank level fell, the bottom lockhopper valve closed, keeping the lockhopper full of water.
The lockhopper returned to gasifier pressure using a dedicated pressurizing pump system. The top
lockhopper valve then opened, resuming the collection cycle.
18

The slag and water from the lockhopper blowdown were delivered from the slag receiver to the
shaker screen by a rotary valve. The shaker screen separates the slag into coarse slag and fine slag
fractions. The coarse slag fell off the screen into a bin hopper. When the bin hopper was full an
operator replaced it and weighed/sampled the coarse slag.
The fine slag passed with the flush water down through the shaker screen into the slag fines
settler. The fine slag was drawn from the bottom of the settler and pumped to the vacuum belt filter.
The resulting fine slag cake fell into a separate bin hopper. When this bin hopper was full an operator
replaced it and weighed/sampled the fine slag.
The filtrate from the vacuum belt filter returned to the weir of the slag fines settler where it mixed
with the overflow of the slag fines settler. This liquid, pumped through a cooler back to the lockhopper
flush tank, recycled in the next lockhopper cycle.
Quench/Scrubber Svstem--The system continually routed the water in the quench chamber and
scrubber vessel to the clarifier via coolers. The clarifier produces an underflow stream of solids and
water, called clarifier bottoms, and an overflow stream of clarified water, known as the clarifier
overhead.
Periodically the clarifier bottoms were drawn off and filtered to produce a filter cake (clarifier
solids-approximately 45 wt% solids), and a filtrate stream (vacuum filtrate). Operators sampled the
clarifier bottoms both before and after filtering. The bottoms were also weighed after filtering.
The clarifier overhead flowed into the flash tank where it mixed with the blowdown stream from
the high pressure knockout pot. In the flash tank dissolved gases were removed from these waters at
low pressure. The water then recycled back to the quench chamber and scrubber vessel or was routed
to temporary storage or wastewater treatment as a blowdown stream. The flash gas was cooled and
routed to the flash gas knockout pot before going to the Sulfur Removal Unit for removal of sulfides.
Any water that accumulated in this knockout pot was routed to the HPSGU II sump. When required,
water was added to the quench/scrubber system at the flash tank. Makeup water was drawn from an
on-site well and softened.
19

1.4.4 Acid Gas Removal Unit
The Acid Gas Removal Unit, shown in Figure l-4, removed hydrogen sulfide, carbon dioxide, and
small amounts of hydrogen chloride and chlorine (acid gases) from the scrubbed raw syngas. The
solvent used in this absorption operation was Selexols, a polyethylene glycol dimethyl ether solution
supplied by Sherex Chemical Company under license from Union Carbide.
Scrubbed raw syngas from the gasification unit flowed to the raw syngas knockout pot for
removal of small amounts of entrained process water, which were routed to the sump. The scrubbed
raw syngas then entered the bottom of the Selexols absorber tower and rose up the tower against a
counter-current flow of stripped solvent called lean Selexole or lean solvent. The Selexole absorber
tower operated at conditions that removed approximately 80-95 percent of the hydrogen sulfide as well
as the remaining hydrogen chloride and chlorine in the raw syngas
This treated raw syngas, called fuel gas, flowed from the top of the Selexole absorber into an
absorber knockout pot where small amounts .of. entrained solvent were removed and routed to the
sump. The dry fuel gas was then sampled, metered, and flared.
A solvent stream, called rich Selexole or rich solvent because it is concentrated with acid gas
consisting mainly of hydrogen sulfide and carbon dioxide, flowed from the bottom of the Selexole
absorber to the solvent-solvent exchanger where it was heated by hot lean solvent. The rich solvent
was further heated in a steam heat exchanger before entering the top of the Setexole stripper. The
rich solvent flowed down the tower, contacting steam, which stripped out the acid gases.
The acid gases and steam flowed from the top of the tower ‘through a cooler to the reflux pot.
Water condensed out in this pot and was pumped back to the rich solvent line upstream of the solvent-
solvent exchanger. The overhead acid gas stream from the reflux pot, consisting mainly of hydrogen
sulfide and carbon dioxide and known as sour gas, flowed to the Sulfur Removal Unit.
Lean solvent exited the bottom of the stripper. There, a portion was drawn off, heated in external
reboilers, and fed to the separator, where lean solvent separated from the steam. The steam was fed
to the middle section of the stripper, while the lean solvent from the separator was combined with the
balance of the lean solvent from the bottom of the stripper. The composite lean stream was cooled first
20

30ii:
Eslii
21

in the solvent-solvent exchanger, then sent through a cooler and directed into the Selexol surge pot
where a level of lean solvent is maintained to ensure a constant flow to the absorber. A pump moved
the composite lean solvent from the S e l e x o l surge pot, through additional coolers to the top of the
absorber tower.
1.4.5 Sulfur Removal Unit
The Sulfur Removal Unit, shown in Figure 1-5, separated hydrogen sulfide from the sour gas
stream from the Acid Gas Removal Unit and the flash gas stream from the gasification section. It
converted hydrogen sulfide to a sodium thiosulfate solution, which was treated in the MRL Wastewater
Treatment Unit (WWTU).
The combined flow of sour gas from the Acid Gas Removal Unit and the flash gas from the
HPSGU II entered the bottom of the caustic absorber. In the absorber, the composite gas stream
contacted a counter-current aqueous solution of sodium hydroxide (caustic), which reacted with the
gaseous hydrogen sulfide to produce sodium sulfide. Carbon dioxide in the sour gas stream also
reacted with the caustic to produce sodium bicarbonate. The caustic absorber achieved 85 to 95
percent removal of the hydrogen sulfide in the sour gas. The residual gas, known as caustic absorber
off-gas, traveled to an absorber knockout pot before flaring as absorber off-gas. Any entrained caustic
was routed to the unit sump.
Pumps sent the spent caustic from the bottom of the caustic absorber through a meter to the
oxidizer tower. A portion of the spent caustic stream recycled to the top of the caustic absorber
through a meter in the spent caustic recycle line. Mixed with fresh caustic, it cooled in an exchanger,
and then (mixed with water) reentered the absorber.
A heated storage tank, aboveground in a bermed area, stored fresh caustic as a 50 weight-percent
aqueous solution of sodium hydroxide.
At the oxidizer tower, the spent caustic stream was mixed with compressed air and steam, and
fed to the bottom of the oxidizer tower. The caustic, air, and steam reacted with the sodium sulfide
to produce sodium thiosulfate.
22

CAUSTIC ABSORBERTO FLARE
WATERWATER
i
. .
. . . ..
FRESH CA U ST I C STORAGE
SPENT C A U ST I C
f
FROMGASFICA~M~
U N I T
OXIDIZEROff-GAS.
\
Figure 1-5. Sulfur Removal Unit Process Flow Diagram.

The oxidizer tower operated in an overflow mode. The vapor and liquid phases flowed out of the
top of the tower and passed through a cooler before entering the oxidizer knockout pot. The overhead
gas from the oxidizer knockout pot, called oxidizer off-gas, flowed to the off-gas knockout pot before
being flared. Any residual entrained solution was routed to the unit sump.
The liquid phase separated in the oxidizer knockout pot was an aqueous mixture of sodium
thiosulfate and sodium hydroxide. In a neutralization line, the pH was adjusted to approximately 7 by
the automated addition of sulfuric acid. The neutralized stream then discharged to the WWTU.
An aboveground tank located in an adjacent bermed area stored sulfuric acid as 93 weight-percent
aqueous solution. The pH of the wastewater stream was continuously monitored downstream of the
mixing point by an instrument which directly controlled the amount of acid being pumped into the line.
1.4.6 Other Ancillary Units and Miscellaneous Equipment
1.4.6.1 Flare-
MRL employs a flare system to combust the fuel gas from the Acid Gas Removal Unit and the off-
gases from the Sulfur Removal Unit. Hydrogen and carbon monoxide were the primary combustible
components in the off-gases. The oxidizing environment at the flare provided a fuel-lean stoichiometry
and complete combustion of the raw syngas, producing primarily carbon dioxide and water. Continuous
monitoring of the flare flame temperature verified proper operation. If the flame had been extinguished,
the flare would automatically have attempted to reignite and sound an alarm.
1.4.6.2 Wastewater Treatment Unit--
MRL maintains an on-site Wastewater Treatment Unit (WWTU) for processing plant wastewater
before discharging it to a municipal sewer.
The WWTU treats wastewater from the following sources
l Sulfur Removal Unit neutralization line
l Stormwater drains in process areas
l Laboratory sinks
24
l Solids Grinding and Slurry Preparation Unit sump
l Ancillary process unit sumps
l Boilers
l Water softeners
The WWTU employs neutralization, flocculation, clarification, and filtration to meet the effluent
discharge specifications required by the Los Angeles County Sanitation Districts.
1.4.7 Waste Disposal
Solid wastes and wastewaters generated during the operation and decontamination of process
equipment were tested for hazardous characteristics. Hazardous wastes were transported off-site for
proper disposal. These wastes included:
l Slag and clarifier solids
l Process wastewater streams
l Washdown water
o Unused feed and other test-defined feed materials (hazardous waste, hazardous slurries, and
miscellaneous spiking chemicals and additives)
l Rinse water generated during decontamination
l Used disposable personal protection and decontamination materials.
1.4.7.1 Solids--
Slag and clarifier solids, generated from the gasification process, consisted primarily of the
inorganic/mineral matter present in the coal and hazardous waste feed. These solids were stored in
lined, certified, steel roll-off bins leased from a licensed hazardous waste transporter. Each roll-off bin
was covered with a water-proof canvas tarpaulin. Samples of each stream sent to the roll-off bins were
retained and analyzed; waste logs were maintained on all roll-off bin contents. The waste solids were
transported via a licensed hauler to a permitted treatment, storage, and disposal facility in compliance
with all federal and state regulations.
25

1.4.7.2 Process Wastewater and Washdown Water--
During gasification tests, two process wastewater streams, the flash tank blowdown and the
clarifier underflow vacuum filtrate, are discharged from the HPSGU II to the WWTU. At the end of a
gasification run, the quench/scrubber system and the lockhopper system water inventories are also
normally discharged to the WWTU. Because this SITE Demonstration used California hazardous waste
as gasifier feed material, these four water streams diverted to temporary storage, sampled, and, if
hazardous properly disposed of off-site.
A fifth process wastewater stream was generated by the Sulfur Removal Unit during gasification
operations. This stream contained sodium sulfate and sodium thiosulfate. This stream did not exhibit
hazardous characteristics as a result of gasifying a hazardous waste and was diverted to storage,
followed by off-site treatment and disposal.
Water generated from washing down the process plot area is normally discharged to the WWTU
via a sump system. Because a hazardous waste was used as a gasification feedstock, this water was
not allowed to flow to the WWTU. Instead, it was stored and removed by vacuum truck for off-site
treatment and disposal.
1.4.7.3 Unused Hazardous Waste Feed, Hazardous Waste Feed/Coal Slurry and Coal--
All unused feed materials were gastfied after the SITE Demonstration tests were completed. The
hazardous waste residuals were transferred to an off-site hazardous waste disposal facility. The coal
that was not consumed was stored on-site for future use.
1.4.7.4 Decontamination Rinse Water--
Decontamination rinse water generated during gasification operation was discharged to the sumps
that serve the unit being decontaminated. This water was isolated from the WWTU and transported
by a certified waste transporter via vacuum truck to a permitted off-site treatment facility.
26

1.4.7.5 Contaminated Oil--
Oils for machinery lubrication were stocked in barrel racks located inside the tank retaining wall.
When in use, these barrels were fixed in such a position that normal spills drained into an oil/water
sump for pumping into a waste oil tank. Waste oil removed from machinery was stdred in 55-gallon
drums prior to transport to a permitted disposal facility. Small oil spills elsewhere in the MRL facility
were treated with an oil absorbing material, which was sent for disposal as hazardous waste.
1.4.7.6 Used Health, Safety, and Decontamination Material(s)--
Used personal protection materials ( T y v e k suits, gloves, towel wipes, etc.) were collected in a
dumpster and transported as hazardous waste by a certified service to a permitted off-site treatment
facility.
1.5 KEY CONTACTS
Additional information on the SITE Program, the TGP SITE Demonstration, and TGP technology
are available from the following sources:
The SITE Program
Robert A. OlexseyDirector, Superfund Technology Demonstration DivisionU.S. Environmental Protection Agency26 West Martin Luther King DriveCincinnati, OH 45268513-569-7861Fax 513-569-7620
The Texaco Gasification Process Technology
Richard 6. ZangTexaco Inc.2000 Westchester AvenueWhite Plains, NY 10650914-253-4047Fax 914-253-7744
Marta K. RichardsEPA SITE Project ManagerU.S. Environmental Protection Agency26 West Martin Luther King DriveCincinnati, OH 45268513-569-7692Fax 513-569-7549
27
On-Line Clearinghouses
l The Alternative Treatment Technology Information Center (ATTIC) System (operator 301-670-
6294) is a comprehensive, automated information retrieval system that integrates data on
hazardous waste treatment technologies into a centralized, searchable source. This database
provides summarized information on innovative treatment technologies.
o The Vendor Information System for Innovative Treatment Technologies (VISITT) (Hotline: 800.
245-4505) database contains information on 154 technologies offered by 97 developers.
l The OSWER CLU-In electronic bulletin board contains information on the status of SITE
technology demonstrations. The system operator can be reached at 301-585-8368.
Publications
Technical reports may be obtained by contacting the Center for Environmental Research
Information (CERI), 26 West Martin Luther King Drive, Cincinnati, OH 45268 at 513-569-7562.
28

SECTION 2
TECHNOLOGY APPLICATIONS ANALYSIS
This section of the report addresses the general applicability of the Texaco Gasification Process
(TGP) for the treatment of hazardous wastes contaminated with organics and heavy metals. The
conclusions are based primarily on the TGP SITE Demonstration results supplemented by information
on other applications of the technology, presented in Appendix II.
2.1 OBJECTIVES - PERFORMANCE VERSUS ARARs
Specific environmental regulations pertain to the operation of the TGP, including the transport,
treatment, storage, and disposal of wastes and treatment residuals. These regulations may affect the
future development of commercial TGP units.
For the TGP SITE Demonstration, the primary waste feed materials were transported from the
Purity Oil Sales Superfund Site in Fresno, California to the TGP’s location at Texaco’s MRL in South El
Monte, California. Such waste treatment, if conducted on a hazardous waste, would be considered
off-site treatment. All substantive and administrative regulatory requirements for waste transport,
storage, treatment, and disposal at the federal, state, and local level must be fulfilled.
The operation of MRL is regulated by environmental permits covering air quality, water quality,
and the storage and treatment of hazardous wastes. Air quality permits have been issued by the
regional South Coast Air Quality Management District (SCAQMD), with individual permits covering all
pertinent operations facilities at the MRL. The MRL does not have a National Pollutant Discharge
Elimination System (NPDES) permit for direct wastewater discharge. Instead, wastewater is pretreated
by an on-site wastewater treatment plant and then discharged to a municipal sewer. This discharge
is permitted by the Los Angeles County Sanitation Districts and is routed to their treatment facilities.
The MRL is classified as a hazardous waste generator. Hazardous waste residuals are sent to certified
treatment, storage, and disposal facilities in compliance with U.S. EPA and California EPA regulations.
29

Permits held by MRL allow routine research and development as well as support activities. New
research programs require the modification of existing permits and the addition of new permits.
Depending on the length of the research programs, these modifications and new permits can be
temporary. Such permits terminate at the end of the short-term research.
For this specific SITE Demonstration, the waste soil excavated from the Purity Oil Sales Superfund
Site was prescreened, pH modified, analyzed, and predetermined not to be a Resource, Conservation,
and Recovery Act (RCRA) hazardous waste. It was then sealed in drums and transported to Texaco’s
MRL. Based on these conditions, the State of California Environmental Protection Agency (CAL-EPA)
Department of Toxic Substances Control issued a variance to MRL from the hazardous waste facility
permit under generator and transporter regulatory requirements of Division 4.5, Title 22, California Code
of Regulations (CCR). The waste soil was still considered a California hazardous waste and all
operations were properly conducted under these regulations.
When a proposed transportable TGP system is constructed for on-site treatment at Superfund
sites, the substantive requirements discussed in this Section would be considered applicable or relevant
and appropriate requirements (ARARs). However, the administrative requirements (obtaining the actual
permits), would not have to be fulfilled.
Potential TGP technology users should understand and satisfy the requirements of all applicable
local, state, and federal regulations. Specific ARARs include the following: (1) the Comprehensive
Environmental Response, Compensation, and Liability Act (CERCLA); (2) the Resource Conservation and
Recovery Act (RCRA); (3) the Clean Air Act (CAA); (4) the Safe Drinking Water Act (SDWA); (5) the
Clean Water Act (CWA); (6) the Toxic Substances Control Act (TSCA); and (7) the Occupational Safety
and Health Administration (OSHA) regulations. In addition to these seven general ARARs, discussed
below, specific ARARs must be identified by remedial managers for each site. Specific federal and state
ARARs which may be applicable to the TGP technology are addressed in Table 2-l.
2.1.1l Comprehensive Environmental Response, Compensation, and Liability Act
The Comprehensive Environmental Response, Compensation, and Liability Act (CERCLA) of 1980
as amended by the Superfund Amendments and Reauthorization Act (SARA) of 1986 provides for
federal funding to respond to releases of hazardous substances to air, water, and land. Section 121
of SARA, entitled “Cleanup Standards”, states a strong statutory preference for remedies that are
30

Table 2-1. Federal and State ARARs for the Texaco Gasification Process Technoloav_.
Processactivity
Waste feed characterization(untreated waste)
ARAR
RCRA 40 CFR Part 261 orstate equivalent
Description
Identify and characterize thewaste as treated.
Basis
A RCRA requirement must bemet prior to managing andhandling the waste.
Response
Chemical and physicalanalyses must be performed.
TSCA 40 CFR Part 761 orstate equivalent
Apply standards to thetreatment and disposal ofwastes containing PCBs.
During waste Chemical and physicalcharacterization, PCBs may analyses must be performed.be identified in contaminated If PCBs are identified, soilssoils, and soils would then be will be managed accordingsubject to TSCA regulations. to TSCA regulations.
Soil excavation Clean Air Act 40 CFR 50.6,and 40 CFR 52 Subpart K orstate equivalent
Manage toxic pollutants andparticulate matter in the air.
Fugitive air emissions mayoccur during excavation,material handling, andtransport.
If necessary, the wastematerial should be watereddown or covered to eliminateor minimize dust generation.
RCRA 40 CFR Section 262 or Apply standards to The soils are excavated forstate equivalent
If possible, soil should be fedgenerators of hazardous treatment. directly into the unit forwaste. slurrying.
Storage prior to processing RCRA 40 CFR Section 264 or Apply standards to the Excavation may generate a In a waste pile, the materialstate equivalent storage of hazardous waste hazardous waste that must should be placed on and
be stored in a waste pile. covered with plastic tieddown to minimize fugitive airemissions and volatilization.The time betweenexcavation and treatmentshould be minimized.
Transportation for on-siteprocessing and off-sitedisposal
RCRA 40 CFR Part 262 orstate equivalent
Mandate manifest require-ments, packaging, and label-ing prior to transporting.
The waste soil or solids An identification (ID) numberproducts may need to be must be obtained from EPA.manifested and managed as ahazardous waste.
RCRA 40 CFR Part 263 orstate equivalent
Set transportation standards. Waste soil or solids products A transporter licensed bymay need permitted EPA must be used totransportation as a hazardous transport the hazardouswaste. waste.

Table 2-l. (Continued)
Processactivity
Waste processing
ARAR
RCRA 40 CFR Parts 264 and265 or state equivalent
Description Basis Response
Apply standards to the Treatment of hazardous Equipment must be operatedtreatment of hazardous waste waste must be conducted in and maintained daily. Airat permitted and interim a manner that meets the emissions must bestatus facilities. RCRA operating and characterized by continuous
monitoring requirements. emissions monitoring.Equipment must bedecontaminated whenprocessing is complete.
Clean Air Act 40 CFR 50.6,and 40 CFR 52 Subpart K orstate equivalent
Manage toxic pollutants andparticulate matter in the air.
Fugitive air emissions mayoccur during solids grindingand slurry preparation.
Unit design includesnegative pressure withinenclosures, nitrogenblanketing, baghousecollection, and carbonadsorption of vapors.
Storage after processing RCRA 40 CFR Part 264 orstate equivalent
Apply standards to thestorage of hazardous wastein containers.
The treated solid productswill be placed in covered rolloffs or equivalent containersprior to a decision on finaldisposition.
The treated solids productsmust be stored in containersthat are well maintained;container storage area mustbe constructed to controlrain- water runoff.
Waste productcharacterization (treatedwaste)
RCRA 40 CFR Part 261 or Apply standards to wastestate equivalent characteristics.
A requirement of RCRA prior Chemical and physical teststo managing and handling the must be performed onwaste; it must be determined treated solids products priorif the solids products is RCRA to disposal.hazardous waste.
TSCA 40 CFR Part 761 orstate equivalent
Apply standards to thetreatment and disposal ofwastes containing PCBs.
Treated solids products maystill contain PCBs.
Chemic al and physical testsmust be performed ontreated solids products. IfPCBs are identified, a properdisposal method must beselected.

Table 2-1. (Continued)
Processactivity
Wastewater discharge
ARAR
Clean Water Act 40 CFRParts 301, 304, 306, 307.306. 402, and 403
Description
Apply standards to dischargeof wastewater into sewagetreatment plant or surfacewater bodies.
Basis
The wastewater may be ahazardous waste.
Response
Determine if wastewatercould be directly dischargedinto a sewage treatmentplant or surface water body.If not, the wastewater mayneed further treatment tomeet dischargerequirements.
Safe Drinking Water Act 40 Apply standards to primary Wastewater may require CERCLA Sections 12 1 (d)(2)CFR Parts 141 and 143 and secondary national treatment to drinking water (A) and (B) explicitly mention
drinking water sources standards. compliance with MCLs,FWQC, and ACLs surface orgroundwater standardswhere human exposure is tobe limited.
On-site/off-site disposal RCRA 40 CFR Part 264 or Apply standards to landfillingstate equivalent hazardous waste.
Treated solids products may Treated solids products muststill contain contaminants in be sent for disposal at alevels above required cleanup NRA-permitted hazardousaction levels and, therefore, waste facility, or approvalbe subject to the LDRs. must be obtained from EPA
to dispose of the wastes onsite.
TSCA 40 Part 761 or stateequivalent
Set standards that restrict the Treated solid products If untreated soil containedplacement of PCBs in or on containing less than 500 ppm PCBs, then treated solidsthe ground. PCBs may be landfilled or products should be analyzed
incinerated. for PCB concentration.Approved PCB landfills orincinerators’must be used.
RCRA 40 CFR Part 268 orstate equivalent
Set standards that restrict the The nature of the waste may The waste must beplacement of certain wastes be subject to the LDRs. characterized to determine ifin or on the ground. the LDRs apply; treated
wastes must be tested andresults compared.

Processactivitv
On-site/off-site disposal(cont.)
ARAR
SARA Section 121 (d)(3)
Table 2-l. (Continued)
Description Basis
Set requirements for the off- The waste is being generatedsite disposal of wastes from under a response actiona Superfund site. authorized under SARA.
Wastes must be sent fordisposal at a RCRA-permitted hazardous wastefacilitv.
cdP

highly reliable and provide long-term protection. It strongly recommends that a remedial action use an
on-site treatment that " . . ..permanently and significantly reduces the volume, toxicity, or mobility of
hazardous substances.” In addition, general factors which must be addressed by CERCLA remedial
actions include long-term effectiveness and permanence, short-term effectiveness, implementability,
and cost.
The TGP has demonstrated that organic contaminants in the feed stream can be destroyed with
at least 99.99 percent DRE. This illustrates both long-term and short-term effectiveness with respect
to organic compounds. The process also demonstrated the potential that heavy metals could be
immobilized in a non-leaching glassy slag based on TCLP analyses performed on the coarse slag.
Similar analyses on the fine slag and the filtered clarifier bottoms, however, provided mixed results on
heavy metals immobilization. The long-term effectiveness and permanence of the TGP would have to
be evaluated by subsequent analyses that are beyond the scope of work for this project. It is
anticipated, however, that the heavy metals immobilized in the non-leaching TGP residuals will remain
indefinitely stable. The process wastewater streams contained organics and heavy metals and required
additional treatment prior to regulated disposal.
The TGP is a viable and implementable syste m. Texaco is designing a transportable unit that is
better suited for long-term or large-scale on-site treatment. Under such conditions, a fixed supply of
coal feed and an economical tie-in to a utility or a chemical synthesis facility for the sale of the fuel gas
product could be effected.
Based on the economic analysis in Section 3, the cost of this technology is comparable to
alternative thermal destruction technologies. The unique features of the TGP, however, provide some
positive economic incentives:
l The TGP is capable of remediating waste materials containing both organics and heavy metals;
the TGP effectively destroys organics and immobilizes heavy metals, thus eliminating the need
for significant stabilization/solidification treatment of a major portion of the solids byproducts.
l The gas emissions from the TGP are hydrogen-rich and economically valuable. They can be
routed to a utility or chemical synthesis plant for further productive use, thus providing a
positive cash flow from emissions which otherwise must be released to the atmosphere.
35

2.1.2 Resource Conservation and Recovery Act
The Resource Conservation and Recovery Act (rcra) ) is the primary federal legislation governing
hazardous waste activities. Subtitle " C " ” of RCRA contains requirements for generation, transport,
treatment, storage, and disposal of hazardoues waste, most of which are also applicable e to CERCLA
activities,
Depending on the waste feed and the effectiveness of the treatment process, the TGP generates
reusable fuel gas, process wastewaters, coarse slag, fine slag, and clarifier solids. Therefore, both
liquid and solid residuals must be examined. The process wastewaters may contain organic s and heavy
metals; they would require additional treatment prior to regulated disposal. The coarse slag analyses
conducted for the SITE Demonstration showed a potential for the heavy metals to be immobilized in
the non-leaching glassy slag. Similar analyses on the fine slag and clarifier solids, however, provided
mixed results on heavy metals immobilization. These solids may exhibit RCRA hazardous waste
characteristics; therefore, they may require further permitted treatment/disposal as hazardous.
For generation of any hazardous waste, the responsible party for the site must obtain, an EPA
generator identification number and comply with accumulation and storage requirements under 40 CFR
262, or hold a Part B Treatment, Storage, and Disposal (TSD) () permit or interim status. Compliance with
RCRA TSD requirements is required for CERCLA sites. A hazardous waste manifest must accompany
off-site shipment of waste. Transport must comply with RCRA and Department of Transportation (DOT)
hazardous waste transportation regulations .The receiving TSD facility must also be permitted in
compliance with RCRA standards.
Technology (and/or concentration-based) treatment standards have been established for many
hazardous wastes. Those appropriate for the TGP waste streams will be determined by the type of
waste generated in each operation .The RCRA land disposal restrictions, 40 CFR 268, mandate that
hazardous wastes which do not meet the required treatment standards receive treatment after removal
from a contaminated site before land disposal, unless a variance is granted. If either the process
wastewaters or solids generated by the TGP constitute hazardous wastes and do not meet the land
disposal treatment standards, additional treatment will be required prior to disposal.
36
2.1.3 Clean Air Act
The Clean Air Act (CAA) establishes primary and secondary ambient air quality standards for
protection of public health and emission limitations for certain hazardous air pollutants. Permitting
requirements under the Clean Air Act are administered by each state as part of State Implementation
Plans, developed to bring each state into compliance with National Ambient Air Quality Standards
(NAAQS). Air quality permits covering the operation at MRL were obtained through the SCAQMD. The
ambient air quality standards listed for specific pollutants applied to the TGP because of its potential
emissions. The TGP produces a synthesis gas primarily composed of hydrogen (H,), carbon monoxide
(CO), and carbon dioxide (CO2). If the TGP were tied to a utility or chemical synthesis facility, this
synthesis gas could then be routed to a gas turbine or synthesis plant, where emissions would then be
based on the combustion of the gas (leaving only CO, CO2, and nitrogen oxide (NOx) or the resulting
emissions from a chemical synthesis process). It is likely, then, that a TGP built in any state would
require an air permit. The allowable emissions would be established on a case-by-case basis, depending
upon whether or not the site is in attainment of the NAAQS. If the area is in attainment, the allowable
emission limits could still be curtailed by the available increments under Prevention of Significant
Deterioration (PSD) regulations. This could only be determined on a site-by-site basis.
Fugitive emissions are also subject to the provisions of the CAA. For this SITE Demonstration,
soil from the Purity Oil Sales Superfund Site was excavated and steps were taken to minimize the
impact from fugitive emissions by watering down the soils and covering them with industrial strength
plastic prior to drumming and transport. The MRL Solids Grinding and Slurry Preparation Unit
incorporates negative pressure enclosures, nitrogen blanketing, baghouse collection of particulates, and
carbon adsorption for organics removal to control fugitive emissions prior to the slurrying of the coal
and soil with water.
2.1.4 Safe Drinking Water Act
The Safe Drinking Water Act (SDWA) establishes primary and secondary national drinking water
standards. Provisions of the Safe Drinking Water Act apply to remediation of Superfund sites. CERCLA
Sections 121 (d)(2)(A) and (6) explicitly mention three kinds of surface water or groundwater standards
with which compliance is potentially required-Maximum Contaminant Levels (MCLs), Federal Water
Quality Criteria (FWQC), and Alternate Concentration limits (ACLs). CERCLA describes those
requirements and how they may be applied to Superfund remedial actions. The guidance is based on
37
federal requirements and policies; state requirements may apply even stricter standards than those
specified in federal regulations.
2.1.5 Clean Water Act
The Clean Water Act (CWA) regulates direct discharges to surface water through the National
Pollutant Discharge Elimination System (NPDES) regulations. These regulations require point-source
discharges of wastewater to meet established water quality standards. The discharge of wastewater
to a municipal sewer requires a discharge permit and concurrence that the wastewater is in compliance
with state and local regulatory limits.
The TGP’s wastewater streams are normally tested for hazardous characteristics and constituents
and, if nonhazardous, are treated by an on-site wastewater treatment facility. The effluent is
discharged to the sewer if it meets Los Angeles County Sanitation Districts specifications. If the
effluent does not meet these specifications, it is collected, removed, treated, and sent for proper
disposal off-site. If the wastewater streams are hazardous, they are not treated on-site. Instead, they
are also removed, treated, and sent for disposal in a regulated facility.
Two process wastewater streams, the flash tank blowdown and the clarifier underflow vacuum
filtrate, are discharged from the HPSGU II to the WWTU. At the end of each test, two additional
wastewater streams-the quench/scrubber system and the lockhopper system water inventories-are
also discharge to the WWTU. Because this test program treated a hazardous waste as gasifier feed
material, these four water streams were diverted to temporary storage to allow removal by vacuum
truck for off-site treatment and disposal. A fifth process wastewater stream containing sodium sulfate
and sodium thiosulfate was generated by the Sulfur Removal Unit. This stream did not exhibit
hazardous characteristics as a result of gasifying a hazardous waste. As with the other wastewater
streams, this stream was diverted to storage, followed by off-site treatment and disposal. Water
generated from washing down the process units, normally discharged to the WWTU via a sump system,
was also removed by vacuum truck for off-site treatment and disposal.
2.1.6 Toxic Substances Control Act
The disposal of PCBs is regulated under Section 6(e) of the Toxic Substances Control Act of 1976
(TSCA). PCB treatment and disposal regulations are described in 40 CFR Part 761. Materials
38
containing PCBs in concentrations between 50 and 500 ppm may either be sent to TSCA-permitted
landfills or destroyed by incineration at a TSCA-approved incinerator. At concentrations greater than 500
ppm, the material must be incinerated. Sites where spills of PCBs have occurred after May 4, 1987, must
be addressed under the PCB Spill Cleanup Policy in 40 CFR Part 761, Subpart G. The policy applies to
spills of materials containing 50 ppm or greater of PCBs and establishes cleanup protocols for addressing
such releases, based upon the volume and the concentration of the spilled material.
According to Texaco, the TGP is an effective thermal destruction system capable of treating both
solid and liquid wastes containing PCBs. If the TGP is to be used to treat PCB-contaminated material,
TSCA authorization defining operational, throughput and/or disposal constraints is required. If the PCB-
contaminated material contains RCRA wastes, RCRA compliance is also required.
2.1.7 Occupational Safety and Health Administration Requirements
CERCLA remedial actions and RCRA corrective actions must be performed in accordance with OSHA
requirements detailed in 20 CFR Parts 1900 through 1926, especially Part 1910.120, which provides for
the health and safety of workers at hazardous waste sites. On-site construction activities at Super-fund
or RCRA corrective action sites must be performed in accordance with Part 1926 of OSHA, which provides
safety and health regulations for construction sites. State OSHA requirements, which may be significantly
stricter than federal standards, must also be met.
All technicians operating the TGP on waste feeds are required to have completed and maintained
OSHA hazardous waste operations training. They must be familiar with all OSHA requirements relevant
to hazardous waste sites. For most sites, minimum personal protective equipment (PPE) for technicians
will include gloves, hard hats, steel toe boots, and flame-retardant coveralls. Depending on contaminant
types and concentrations, additional PPE may be required.
A required health and safety plan for all TGP operations defines the operational site, health and
safety personnel responsibilities, chemical and physical hazard assessments, PPE, site control and hazard-
zone definition, decontamination procedures, exposure monitoring for chemical and physical variables,
recordkeeping, and specific material safety data sheets for all site-related chemicals of concern.
39
2.2 OPERABILITY OF THE TECHNOLOGY
During the one-week period scheduled for the SITE Demonstration tests a major earthquake and
three operational problems impacted the scheduling and operation of the test runs.
The earthquake on January 17, 1994 caused an overall shutdown of MRL. The facility sustained
minor piping, equipment, and instrument damage that required overall repairs, and recalibration. The
shutdown required a rescheduling of the system preheat, equilibration, and startup sequence and
protocol. These changes delayed the planned SITE Test Run No. 1 from January 18, 1994 to January
19, 1994.
Three operational problems caused no significant delay
1.
2.
3.
Plugging of the organic (POHC) spike injection line.
Unstable gasifier operation during Run No. 3.
A tear in the fine slag vacuum filter belt during Run No. 3.
In all three incidents, actions by MRL personnel successfully addressed the problems to complete
the SITE test runs with minimal delay, no process interruption, and minor interference with the test
sampling activities.
The plugging of the spike injection line occurred during the startup sequence for Run No. 1. Two
POHC spiking compounds-chlorobenzene (VOC) and hexachlorobenzene(SVOC)-- were originally
planned. A heated system was designed by Texaco to ensure the complete dissolution of the
crystalline-solid hexachlorobenzene in the liquid chlorobenzene. Even though the entire system was
heated and steam-traced, apparently either the temperature or flow of the solution was low enough in
the piping to cause recrystallization of the hexachlorobenzene which plugged the line. After several
hours of unsuccessfully attempting to establish a continuous flow, further delays appeared to jeopardize
the SITE test runs. The POHC spike solution composition was revised to eliminate the SVOC
hexachlorobenzene. This change would still allow the SITE tests to measure the ability of the TGP to
achieve a 99.99 percent DRE on the remaining chlorobentene VOC POHC. The initiation of Run No.
1, however, was further delayed from January 19, 1994 to January 20, 1994.
40

The unstable gasifier operation, which caused gasifier operating temperatures to increase and
sampling activities to be suspended during a 1 -hour period of Run No. 3, was apparently caused by the
formation of a solid deposit at the slurry feed injector outlet in the gasifier. The solid deposit was
shaken loose by a large pulse of nitrogen after which gasifier conditions returned to normal.
The torn filter belt on the fine slag vacuum filter was replaced by maintenance staff during a 4-
hour period of Run No. 3 and the filter was returned to service with no unit or SITE sampling shutdown.
None of the above-mentioned incidents were considered substantial episodes affecting critical
reliability or maintainability. The earthquake confirmed the structural integrity of the TGP system,
which experienced only minor damage. The plugging of the spike injection line was specific to the
attempt to introduce hexachlorobentene for DRE determination, therefore, it will not occur during
commercial operation. The gasifier feed injector solid deposit, which caused the gasifier in stability and
a rise in operating temperature, was eliminated by operator intervention based on past experience. A
torn filter belt on a fine slag vacuum filter is an infrequent but routine maintenance issue. Intermittent
operations, length of time in service, and a misalignment of the belt scraper (possibly caused by the
earthquake) may have contributed to the belt failure. In any event the belt failure did not affect gasifier
operation and only impacted the recovery of the fine slag which was then collected in slurry form.
Based on the minimal delays and interruption caused by the above-mentioned incidents and the
continuity of operations exhibited during the overall two-week Demonstration period, it is expected that
the reliability and efficiency of the TGP will be consistently high and TGP operations will maintain on-
stream efficiencies of approximately 80 percent allowing for routine maintenance and intermittent,
unscheduled shutdowns. Two potential process area maintenance problems include solids handling
equipment, where the variations and abrasive nature of the coal, soil, and slag matrices may cause
above-average wear, and the gasification section, where the high temperatures and pressures provide
a difficult environment for equipment operation.
During the three SITE test runs, approximately 40 tons of slurry were treated in the TGP. The
total amount of slurry treated during the entire Demonstration period of two weeks, which included
scoping runs, initial shakedown, system start-up, a pretest run, the three replicate test runs and post-
demonstration processing of the slurry inventory, was approximately 100 tons.
41
2.3 APPLICABLE WASTES
The versatile TGP can process a variety of waste streams. Virtually any carbonaceous, hazardous,
or non-hazardous waste stream can be processed in the TGP if the pretreatment facilities for storage,
grinding, screening, and slurrying are adequate to handle and treat the incoming material. Physical
characteristics-such as particle size and the viscous or sludge-like nature of the matrix-and chemical
properties-such as pH and moisture content-will directly impact on the ability of the TGP equipment
to effectively slurry the waste feed.
The TGP test facility at MRL, where the SITE demonstration was conducted, is equipped with a
hammer mill for coal crushing, a wet rod mill for waste/coal/water slurrying, and various silos, hoppers,
conveyor belts, bucket elevators, and storage tanks to support the movement and storage of the waste,
coal, and slurry feed. The Purity Oil Sales Superfund Site soil, excavated for treatment in the TGP, was
site-treated with lime to a pH greater than 4 and screened to a particle size less than % inch for easier
processing by the MRL materials-handling and slurrying systems.
Depending upon its physical and chemical composition,, the waste stream can either be used as
the primary gasifier feed or a portion of the mix, combined with a high-Btu fuel such as coal, petroleum
coke, or oil. The combined feed must be capable of being slurried, have a heating value that can
maintain gasifier temperatures, and produce an ash with a fusion temperature that falls within
operational limits.
The ratio of waste feed to fuel can be adjusted to optimize the gasifier operation. Even if a waste
stream can be used as the sole feed to the gasifier, blending the waste with a high-Btu feed or fuel
ensures continuity and stability of operation.
The TGP can treat wastes that fall into three categories:
(1)
(2)
Solid or liquid wastes that contain sufficient energy to sustain gasifier operation as the
sole feed without adding another higher-heating-value fuel.
Solid wastes with heating values too low to sustain gasifier operation that can be
supplemented by a higher-heating-value fuel, such as coal.
42

(3) Liquid waste with insufficient heating values that can be combined with a higher-
heating- value fuel. In this case the liquid waste can be used as the fluid phase of the
primary feed slurry.
The TGP has operated commercially for nearly 45 years on feeds such as natural gas and coal,
and non-hazardous wastes such as liquid petroleum fractions, and petroleum coke. Texaco’s patented
gasification process is currently licensed in the U.S. and abroad. The syngas is used for the production
of electric power and numerous chemical products, such as ammonia, methanol and high-purity
hydrogen. As an innovative process gasifying less traditional and hazardous wastes, Texaco reports
that the TGP has processed various waste matrices containing a broad range of hydrocarbon
compounds including coal liquefaction residues, California hazardous waste material from an oil
production field (petroleum production tank bottoms), municipal sewage sludge, waste oil, used
automobile tires, waste plastics, and low-Btu soil. Texaco licensees in Europe have had long-term
success in gasifying small quantities of hazardous waste as supplemental feedstock including PCBs,
chlorinated hydrocarbons, styrene distillation bottoms, and waste motor oil.
Texaco expects to design TGP facilities with flexible and comprehensive storage and pretreatment
systems capable of processing a wide range of waste matrices slurried with coal or oil, water, and
additives. If the specific waste exhibits some unusual physical or chemical characteristics that would
affect the ability of the pretreatment module to slurry the feed, additional equipment may supplement
the existing design.
2.4 KEY FEATURES
The TGP is uniquely different from conventional thermal destruction technologies, particularly
’incineration, in several key process and design areas.
l The TGP is a gasification process operating with a limited amount of oxygen (partial oxidation)
at high temperature and pressure. Because gasification is a reducing process using oxygen, the
production of sulfur oxide (SOx) and NOx is minimized.
l The centerpiece of the TGP is a proprietary entrained-bed gasifier with concurrent flow of
oxygen and hydrocarbon fuel.
43

l The waste matrix can be wet or dry, and according to the design of the pretreatment system,
requires no other specification. The slurry waste feed, mixed with coal, water and any other
supplemental stream, is safer and easier to control than a dry system. This allows Texaco to
customize the feed to ensure proper slurrying, storage, pumpability, adequate feed heating
value, gasifier temperature maintainability, optimum slag fusion, and proper production
conditions.
l The TGP destroys organic contaminants to regulatory DREs and can potentially immobilize
heavy metals in a glassy coarse slag.
l The TGP produces a usable and economically viable gas stream (syngas) containing hydrogen
and carbon monoxide which can be used for further chemical synthesis and electrical power
generation.
l The TGP, currently designed and operating as large capacity stationary units, is also being
designed as a transportable unit for on-site remediation.
2.5 AVAILABILITY AND TRANSPORTABILITY OF EQUIPMENT
The SITE Demonstration of the TGP was conducted at the MRL using permanent multi-purpose
gasification research facilities. This research and development laboratory, with three pilot-scale
gasification units, ancillary units, miscellaneous equipment, offices, and other support facilities
comprises a fixed-sited area of approximately 10 acres.
Texaco is completing the design of a skid-mounted transportable unit capable of treating
hazardous waste on-site, eliminating the need to transport contaminated waste from a hazardous waste
site to a fixed treatment facility. The capacity of the proposed unit is based on a dry syngas flow rate
of 4.2 million scf/day. The quantity of waste that could be treated would be approximately 100 tpd
depending on the composition of the waste.
Skid-mounted components could be constructed in about 24 months; they would be mounted on
multiple transportable trailers. The size and configuration of this equipment is based on operating
conditions determined at the MRL. Materials-handling equipment may require modifications to process
specific waste matrices as discussed earlier and summarized below. Syngas product usage would be
44
determined on a case-by-case basis. Water streams might receive some treatment, but may have to
be removed with the solid products as hazardous waste.
2.6 MA TERIALS HANDLING REQUIREMENTS
As discussed in Section 2.3, the TGP is flexible and can process virtually any carbonaceous
hazardous or non-hazardous waste stream. The waste material, however, either as the primary feed
to the gasifier or combined with a high-Btu fuel such as coal, petroleum, coke, or oil must be capable
of being slurried, have a heating value that can maintain gasifier temperatures, and produce an ash with
a fusion temperature that falls within operational limits.
Based on the ability of the TGP to accept such a wide range of wastes, materials-handling
requirements are dictated by the physical and chemical characteristics of the waste matrix to be
slurried. Additional equipment may be required to supplement the existing design of the transportable
unit’s materials-handling system.
At the waste or Superfund site, contaminated soil will need to be excavated, staged, transported,
and loaded into the TGP. Soil should be kept wet and covered with industrial strength plastic to
prevent fugitive emissions of particulates. Where VOCs are primary contaminants, soil should be
handled within an enclosed system.
2.7 SITE SUPPORT REQUIREMENTS
The TGP support requirements include site conditions (surface, subsurface, clearance, area,
topography, climate, and geography), utilities, facilities, and equipment.
For a proposed 100-tpd transportable unit, surface requirements would include a level, graded area
capable of supporting the equipment and the structures housing it. The complexity and mechanical
structure of a high-temperature, high-pressure TGP unit mandate a level and stable location. The unit
cannot be deployed in areas where fragile geologic formations could be disturbed by heavy loads or
vibrational stress. Foundations must support the weight of the gasifier system, which is estimated at
50 tons, as well as other TGP support facilities and equipment. The transportable TGP unit would
weigh approximately 300 tons and consist of multiple skid-mounted trailers requiring stable access
roads that can accommodate oversized and heavy equipment.
45
The transportable l00-tpd TGP unit would require an area of approximately 40,000 square feet
(ft’) (275 ft x 150 ft), with height clearances of up to 70 feet. This area should accommodate all TGP
process operations, although additional space could be needed for special feed preparation and
waste/residuals storage facilities.
The transportable TGP unit could be used in a broad range of different climates. Although
prolonged periods of freezing temperatures might interfere with soil excavation and handling, coal
handling, slurry preparation, and water-related operations, they would not affect a TGP design that
incorporates adequate heating, insulating, and heat-tracing capabilities at critical locations.
The proposed transportable l00-tpd TGP unit would require the following utilities: 91 tpd of
oxygen, 39 tpd of coal, 5 tpd of lime, 410 kilowatthours per hour (kWh/h) of electrical power, 40
gallons per minute (gpm) of make-up water, and less than 1 tpd of nitrogen.
Support facilities would include staging areas for contaminated soil and coal prior to pretreatment,
materials-handling, and slurry preparation. Syngas product would be routed by pipeline directly off-site
without any support facilities for storage or transport. Solid products would be stored in roll-off bins.
Wastewater would be collected in appropriate tank storage. All support facilities must be designed to
control run-off and fugitive emissions. Support equipment would include excavation/transport
equipment such as backhoes, front-end loaders, dump trucks, roll-off bins, and storage tanks.
2.8 LIMITATIONS OF THE TECHNOLOGY
The TGP can process virtually all waste stream matrices based on the availability of adequate
materials-handling, pretreatment, and slurrying equipment.
The unit’s complexity and costs, and preferred tie-in to a syngas user mandate that on-site
remediations be limited to relatively large sites and long-term remediations with a minimum of 50,000
tons of waste feed and about two years of operation. A tie-in for the TGP syngas product, such as to
a gas turbine electrical generation set or to a manufacturing facility may also affect TGP siting.
46

SECTION 3
ECONOMIC ANALYSIS
Estimating the cost of employing an innovative technology is a major objective in each SITE
Demonstration project. This economic analysis presents data on the costs (excluding profit) for
commercial-scale remediations using the Texaco Gasification Process (TGP). Data were compiled during
the SITE Demonstration tests conducted at the Texaco Montebello Research Laboratory (MRL) pilot
facility. This pilot facility is only used to optimize operating conditions for the design of commercial
units; the SITE Demonstration was conducted in the same manner to determine the commercial design
on which this economic analysis is based. With a realistic understanding of, and accounting for the
Demonstration test results and costs, the following economic analysis extrapolates these test results
and costs for larger proposed commercial systems at other sites.
3.1 CONCLUSIONS OF ECONOMIC ANALYSIS
This analysis presents the costs of treating contaminated sites, each containing 100,000 tons of
soil. The analysis is based on a transportable TGP unit capable of processing 100 tpd of waste soil on-
site. An analysis for a stationary, centralized TGP facility designed to process 200 tpd of waste soil
transported to a central plant is also presented. Table 3-1 presents a breakdown of costs per ton of
soil into 12 standard cost categories, as defined in Section 3.2.
The two cases illustrate the need for a commercial TGP unit to operate for several years on large,
high-contaminated-soil-volume sites at high unit capacity. This is necessary to overcome the
complexity and high costs of the TGP design and operation and to take advantage of the value of the
TGP syngas product as a useable and marketable commodity.
47

Table 3-1. Treatment Costs Associated with the TGP
Unit Ontite TGP Central TGP
Soil, tpd design 100 100 200 200
Soil, tpy actual 29.200 25,550 58,400 51,100
Online % utilization factor 80 70 80 70
Years online leach site) 3.42 3.91 15 15
Capital, $ million I 11.0 11.0 I 22.0 I 22.0
Cost categories, $/ton
Site preparation
Permitting/regulator
Capital equipment $64.26 $64.26 $44.01 $50.30
Start-up I $25.00 $25.00 I $0.00 I $0.00I
Labor
Consumables and supplies
$52.60 $60.12 $26.30 $30.06
OxygenChemicalsCoalLime
$54.60 $54.60 $54.60 $54.60$5.00 $5.00 $5.00 $5.00
$ 1 5 . 5 6 $15.56 $15.58 $15.56$2.00 $2.00 $2.00 $2.00
Utilities ! $6.81 ! $6.81 ! $6.81 ! $6.81
Effluent treatment/disposal
Residuals
$65.80 $65.80 $65.80 $65.80
Slag $2.74 $2.74 $2.74 52.74Syngas ($7.24) ($7.24) ($14.48) ($14.48)
Analytical services
Maintenance
Demobilization
Total, $/ton
$5.00 $5.00 $5.00 $5.00
$11.30 $12.92 $11.30 $12.92
$5.00 $5.00 $0.00 $0.00
$308.43 $317.56 $224.64 $236.31
The estimated treatment costs, at 80 percent and 70 percent utilization factors, respectively,
ranged from $308 to $318 per ton of soil for the lOO-tpd transportable unit and from $225 to $236
per ton for the 200-tpd stationary centralized facility. The estimates presented in this analysis may
range in accuracy from +50 percent to -30 percent.
48

3.2 BASIS OF ECONOMIC ANAL YSIS
In addition to developing effective cost data, the major objectives of this SITE Demonstration were
to demonstrate, on a RCRA-designated hazardous waste feed, the potential of the TGP to produce a
useabl e syngas product, destroy organic compounds, and produce non-hazardous, inert glass-like slag
byproducts. The Demonstration test slurry, which consisted of Purity Oil Sales Superfund Site waste
soil mixed with other slurry materials including clean soil, coal, water, and heavy metals (specifically
lead and barium nitrate) and organic (chlorobenzene) spike compounds, demonstrated the potential of
the TGP to meet all of the objectives in a reliable and cost-effective manner and its applicability to the
remediation of sites contaminated with both organic and heavy metal compounds.
For the Demonstration test, three runs were conducted, over a two-day period, treating
approximately 40 tons of slurry. Solid feed rates during the Demonstration averaged 16 tpd. These
feed rates and the overall design and size of the pilot facility at MRL are for research-testing and are
not practical for an on-site cleanup or a commercial facility where higher throughputs are required for
cost effectiveness.
The proposed Texaco-designed transportable TGP is sized to process hazardous soils and sludges
at a rate of 100 tpd of waste solids, which is a six-fold increase over the Demonstration pilot test
facility and is considered a minimum capacity for economical and on-site remediation operation. This
comparatively small TGP unit falls within the size range of several currently operating units but is less
than one-tenth the size of the largest operating TGP unit .The TGP’s complexity, costs, and the
economic benefit of a tie-in to its syngas product mandate that on-site remediations be limited to
relatively large sites with a minimum of 50,000 tons of waste feed and about two years of operation.
This commercial transportable TGP would be operated under conditions defined by the performance
data from the SITE Demonstration and applied to a commercial design that maximizes the amount of
contaminated soil (hazardous waste throughput) in the overall slurry feed.
Because the complexity, costs, and tie-in to a syngas user mandate a large site remediation, an
alternative, 200-tpd stationary centralized TGP facility has also been designed and costed as part of
the economic analysis.
To provide a basis of cost-effectiveness comparison among technologies, the SITE Program links
costs to 12 standard cost categories, listed below:
49

Site preparation
Permitting and regulatory requirements
Capital equipment
Start-up
Labor
Consumables and supplies
Utilities
Effluent treatment and disposal
Residuals
Analytical services
Maintenance
Demobilization
Some of the cost categories above do not apply to this analysis because they are site-specific,
project-specific, or the obligation of site owner/responsible party.
All of these cost categories are defined and discussed in Section 3.4 - Results
3 . 3 ISSUES AND ASSUMPTIONS
This analysis is based on the operating results obtained during the SITE Demonstration at the MRL
pilot facility using a slurry feed containing Purity Oil Sales Superfund Site waste soil. The pilot facility
is used for demonstrations and to optimize operating conditions but due to its small lockhopper and slag
handling capacity (ash handling capacity), soil throughput had to be maintained at rates that are lower
than actual scaled-up soil feed rates proposed for commercial units. The SITE Demonstration processed
a slurry containing over 40 weight-percent coal and approximately 17 weight-percent soil producing
a slurry containing 62.5 weight-percent solids. The commercial transportable 100-tpd unit is designed
to process a slurry containing less than 20 weight-percent coal and over 40 weight-percent soil, but
the same 62.5 weight-percent solids used in the SITE Demonstration. Since the commercial units are
being designed for cost-effective site remediations, soil throughputs have been maximized and are
higher than the pilot facility feed rates. With higher soil throughputs and lower coal feed rates, feed
slurries will have lower heat contents. Commercial units will consume higher quantities of oxygen and
auxiliary fuel per ton of soil to offset lower heating values, but overall unit costs per ton of soil will
improve based on increased soil throughputs. For this analysis, which is based on the SITE
50

Demonstration test, the waste feed soil is assumed to have the same comparatively high heating value
as the Purity Oil Sales Superfund Site soil because of its contamination with high-heating-value waste
oil. This high heating value offsets the need to supplement the feed with auxiliary fuel to maintain
gasifier operation. Other soils may not have as high a heating value and will require additional oxygen
and auxiliary fuel.
The SITE Demonstration tests produced a useable and potentially marketable medium-Btu syngas.
Any proposed site cleanup using the TGP should incorporate the practical end-use of the syngas
product. The simplest use for the syngas is as a fuel gas for steam production or power generation.
For this analysis the syngas is assumed to be routed off-site without any support facilities for storage,
transport, or use as a fuel gas. Further discussions on the planned or currently operating plant uses
of the syngas are presented in the Vendor Claims - Appendix I.
The proposed 100-tpd transportable unit, as defined in this analysis, is designed for a 15-year
service life. For such a large and complex unit, relocation costs are high; a more practical investment
may be the construction and operation of a stationary unit at a central facility for the entire service life
of the equipment, which although assumed to be similar to the 15-year life of the transportable design
for a comparative analysis, could be 30 years.
The transportable 100-tpd unit and the stationary 200-tpd unit are assumed to operate 24 hours
a day, 7 days a week, 292 days a year (at an 80 percent utilization factor for 3.42 years) or 255 days
a year (at 70 percent utilization factor for 3.91 years) to remediate 100,000 tons of contaminated soil.
The transportable unit is assumed to operate for about 4 years at each of 3 sites during its 15-year life.
The stationary unit will operate at a fixed site for 15 years.
Specific issues and assumptions as they relate ‘to each of the standard cost categories are
presented below.
3.4 RESULTSTS
3.4.1 Site Preparation Costs
The costs for excavation, transportation, and pretreatment of a contaminated waste matrix are
highly variable. The type of contaminated matrix (i.e., dry soil vs. sticky sludge), the amount of
51

extraneous debris that must be separated from the matrix, and the contaminant types and
concentrations are several variables that will impact on excavation, transportation, and pretreatment
costs. Cost for waste handling, and temporary roads and facilities that may be required are not
included because they are site-specific. The costs for foundations, utilities, and equipment erection for
TGP systems were estimated and are included under the capital equipment and startup cost categories.
3.4.2 Permitting and Regulatory Requirements
The costs for permitting are not included. These may include federal, state, and local permits and
will vary with each project and are generally the obligation of the site owner or responsible party.
Depending on the site, these costs could be significant. The obtaining of these permits can also be
extremely time-consuming. The stationary facility, for example, may require the expenditure of several
hundred thousand dollars and a year of application, operation, and reporting activities in order to obtain
an operating permit to process RCRA-designated hazardous waste. The monitoring and analytical
protocols that would be required on an ongoing basis to support permit and regulatory requirements
during operation have been estimated and are jncluded under analytical services.
3.4.3 Capital Equipment
The capital costs are based in part on a comprehensive 1993 cost estimate, prepared by an
engineering design firm, for a l00-tpd transportable TGP unit. A portion of the installed equipment,
including materials handling for the feed preparation and the gas cleaning and wastewater treating, was
estimated by Texaco. The costs of the 200-tpd stationary unit were factored from the costs developed
for the l00-tpd transportable unit.
It is assumed that the transportable unit would operate at 3 sites over its 15-year life. The capital
costs are based on amortization over 15 years at 8% interest with no tax considerations and no scrap
value. The annual capital recovery (amortization) factor is 0.11683 and the total was allocated evenly
between the 3 sites.
The components of the capital cost for the 100-tpd transportable unit are presented in Table 3-2
52
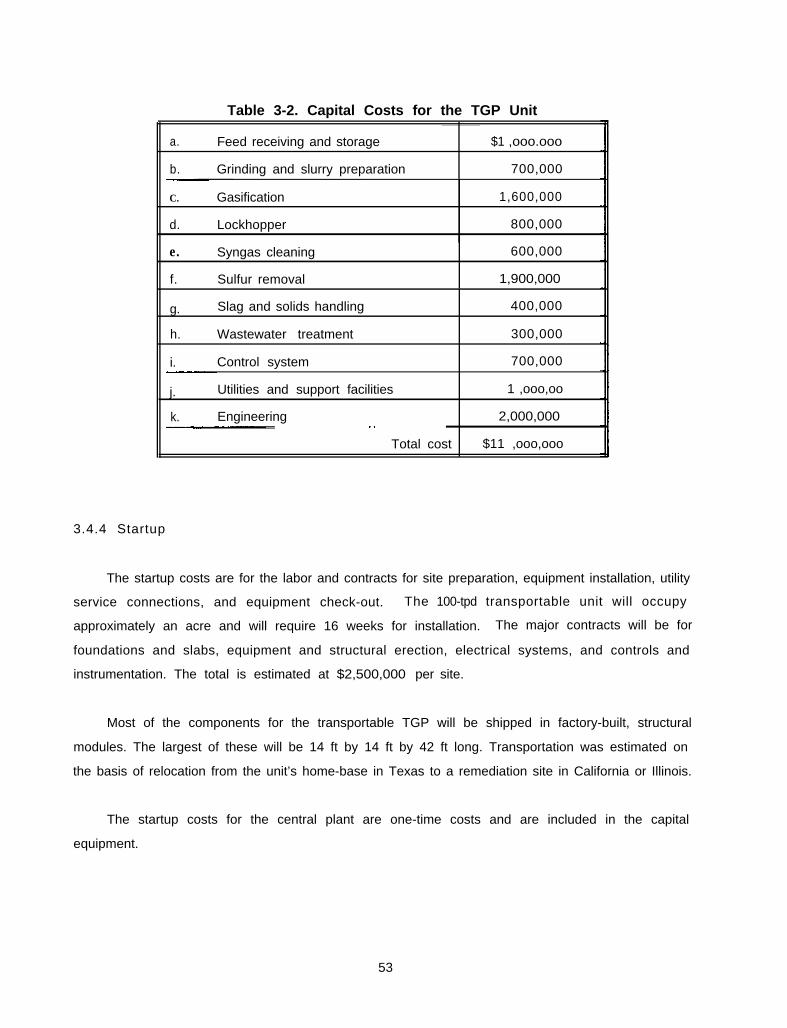
Table 3-2. Capital Costs for the TGP Unit
a. Feed receiving and storage $1 ,ooo.ooo
b. Grinding and slurry preparation 700,000
C.
d.
Gasification
Lockhopper
1,600,000
800,000
e. Syngas cleaning 600,000
f. Sulfur removal 1,900,000
g.
h.
i.
j.
k.
Slag and solids handling
Wastewater treatment
Control system
Utilities and support facilities
Engineering
Total cost
400,000
300,000
700,000
1 ,ooo,oo
2,000,000
$11 ,ooo,ooo
3.4.4 Startup
The startup costs are for the labor and contracts for site preparation, equipment installation, utility
service connections, and equipment check-out. The 100-tpd transportable unit will occupy
approximately an acre and will require 16 weeks for installation. The major contracts will be for
foundations and slabs, equipment and structural erection, electrical systems, and controls and
instrumentation. The total is estimated at $2,500,000 per site.
Most of the components for the transportable TGP will be shipped in factory-built, structural
modules. The largest of these will be 14 ft by 14 ft by 42 ft long. Transportation was estimated on
the basis of relocation from the unit’s home-base in Texas to a remediation site in California or Illinois.
The startup costs for the central plant are one-time costs and are included in the capital
equipment.
53

3.4.5 Labor
Labor costs are based on six-man crews for each of four shifts per week. The cost for the total
staff of 24, at an average all-in cost per hour of $32.00 or $64,000 per year per employee is
$ 1,536, 000 per year for both the transportable and stationary units and is independent of the utilization
factor
3.4.6 Consumables and Supplies
The major costs are for oxygen and coal. Oxygen cost is estimated at $60.00 per ton and is
expected to be consumed at the rate of 0.91 tons per ton of soil. The cost for site-delivered coal is
estimated at $40 per ton and is expected to be consumed at a rate of 0.39 tons per ton of soil. Lime
addition, at a rate of 0.05 tons per ton of soil, is estimated at $40 per ton. The costs for gas treating
chemicals are $5.00 per ton of soil.
3.4.7 Utilities
The cost for electric power is estimated at $0.06/kWh. The water charge is $1.50 per 1,000
gallons. The stationary plant utilities were estimated at the same rate per ton of soil. The l00-tpd
transportable unit utilities consumption were estimated to be $410 kWh/h of electrical power and 40
gpm of make-up water.
3.4.8 Effluent Treatment and Disposal
Disposal costs are estimated for the wastewater, hazardous clarifier bottoms, and fine slag
effluents. The syngas product and potentially non-hazardous coarse slag economics are defined in the
residuals cost section of this discussion. Effluent treatment costs, including wastewater treatment, are
included in other categories as part of the operating process. The one-time SITE Demonstration
disposal cost for clarifier bottoms and fine slag was $230 per ton. For a continuous commercial
operation, it is assumed that a more cost-effective disposal cost can be negotiated. At 87.7 tons of
solids per 100 tons of soil, of which 62.5 weight-percent is non-hazardous coarse slag, the disposal
of the 32.9 tpd of the hazardous portion at $200 per ton is $65.80 per ton of soil.
54

3.4.9 Residuals and Waste Shipping and Handling
The potentially non-hazardous coarse slag can be sold for the cost of transportation from the
proposed stationary plant as road or building-block aggregate or returned to the site in the transportable
unit case. Nonetheless, to be conservative, a cost of $5 per ton or $2.74 per ton of soil for the coarse
slag handling and transport is included for the 62.5 weight-percent of the solids that are non-hazardous.
The syngas product can be valued on a par with natural gas for the transportable unit case and
at a higher value for the stationary plant based on its hydrogen and carbon monoxide content. The
value of the syngas is estimated at $1 .00 per million Btu for the transportable unit and $2.00 per million
Btu for the stationary plant. The process, storage, and transport equipment and facilities for the syngas
are not included in these cost estimates.
3.4.10 Analytical Services
This cost is based on the sampling and TCLP testing of the solid and liquid effluents and residuals
by an independent laboratory on a periodic basis. Tests for lead and several other species, two to four
times per day, are estimated to cost $60 to $75.per sample and may add up to $5 per ton of waste
processed
3.4.11 Maintenance and Modifications
Maintenance costs are estimated at 3% of the capital cost per year. This is based on an average
of previous DOE studies for a large stationary TGP/combined-cycle power plant at 1.5% of capital cost
and actual MRL maintenance costs budgeted at 5% per year.
3.4.12 Demobilization
Site demobilization for a transportable unit is assumed to cost a flat $500,000. This is intended
to cover all labor and contracts to close and leave a cleanup site. There is no cost assumed for
demobilization at the stationary plant.
55

SECTION 4
TREATMENT EFFECTIVENESS
Results of the TGP SITE Demonstration relate to the three primary technical objectives listed
below:
l Achieve 99.99 percent DREs for specific principal organic hazardous constituents
(POHCs).
0 Produce a non-hazardous primary solid residual -coarse slag -and secondary solid
residuals-fine slag and clarifier bottoms.
0 Produce a synthesis gas (syngas) product composed primarily of hydrogen and carbon
monoxide that will be usable as a clean fuel source for the production of electrical
power or raw material for chemical manufacturing.
Additionally, the Demonstration test data were evaluated to determine two other measures of
applicability:
0 Overall capital and operating costs for the TGP, including the value of the resulting
synthesis gas product.
0 The reliability and efficiency of the TGP and its operations throughout the SITE
Demonstration.
4.1 INTRODUCTION
Prior to the SITE tests, soil from the Purity Oil Sales Superfund Site in Fresno, California was
characterized and evaluated as a potential source of hazardous waste material. Based on constraints
56

imposed by the State of California under a variance to permitted operations at MRL, the waste feed
material could not exhibit characteristics that would define the soil as hazardous under RCRA. Based
on this regulatory constraint, excavated soil, treated with lime and prescreened, was analyzed to ensure
that it met the TCLP criteria for lead (5 mg/kg) and contained less than 1,000 mg/kg total lead.
To assess the TGP operation and its ability to process a RCRA-designated hazardous waste feed
that does not comply with TCLP and WET-STLC regulatory limits, non-RCRA hazardous soil from the
Purity Oil Sales Superfund Site in Fresno, California was spiked with lead nitrate and barium nitrate
during slurry preparation to create a surrogate RCRA-hazardous waste feed. For the extended SITE
Demonstration, additional slurry was required and prepared using a mixture of clean soil and oil spiked
with barium nitrate since further supplies of Purity Oil soil could not be obtained. To ensure a sufficient
concentration of the designated POHC for DRE determination, chlorobenzene was added to the Purity
Oil/clean soil mixed test slurry at the slurry feed line to the gasifier. Table 4-l shows the overall
composition of the mixed, spiked test slurry processed during the TGP SITE Demonstration.
Three runs were conducted over a two-day period, treating approximately 40 tons of slurry. The
total amount of slurry treated during the entire Demonstration (scoping runs, initial shakedown, system
startup, a pretest run, the three replicate runs; and post-demonstration processing of the slurry
inventory) was approximately 100 tons. The following critical process and chemical parameters were
measured and analyzed.
Process Parameters
0 Slurry feed rate
0 Raw syngas, flash gas, and fuel gas flow rates
0 Make-up and effluent water flow rates (except neutralized wastewater)
0 Weight of coarse slag, fine slag, and clarifier solids
o Organic spike flow rate
Chemical/Analytical Parameters
0 VOCs, PCDD/PCDF, and metals in all feed and discharge streams (except neutralized
wastewater)
57

Table 4-1 Composition of Demonstration Slurry Feed--.-- -_---_.-- - - -__
Slurry, pounds ( l b )
Pittsburgh #8 coal
Havoline SAE 30 oil ---
L.A. County soil ---
Fresno County soil ---
Purity Oil soil
Water
Gypsum ---
Surfactant
Barium nitrate
Lead nitrate
TOTAL
Purity Oil soil Clean soil
10,511 56,280
2,050
11,000
11,080
5,264 ---
10,529 54,000
2,500
21 130
330 1,000
145 ---
26,800 138,040
Total mixed*
66,791
2.050
11,000
11,080
5,264
64,529
2,500
151
1,330
145
164.840
The total slurry feed does not include the chlorobenzene organic spike (L-5) that was added (at approximately3,150 milligrams per kilogram (mg/kg) based on’slurry flow) to the total mixed slurry flow to the gasifier at 6.20,6.30, and 6.75 pounds per hour (lb/h) for Runs 1, 2, and 3, respectively.
0 TCLP and WET-STLC analyses on waste feed, slurry feed, coarse slag, fine slag, and
clarifier solids
0 Process gas stream compositions
4.2 DRE
The DRE was the measure of organic destruction and removal efficiency during the Demonstration
Test. This parameter is determined by analyzing the concentration of the POHC in the feed slurry and
the effluent gas stream(s). For a given POHC, DRE is defined as follows:
WIN - W,,DRE = x 100%
WIN
58

Where
WI, = Mass feed rate of the POHC of interest in the waste stream feed
WO U T = Mass emission rate of the same POHC present in the effluent gas streams prior to
release to the flare.
For these TGP SITE tests, DREs were calculated in two ways. For the gasification process, the
effluent gas streams included the raw syngas and flash gas; for the overall TGP operation, the effluent
gas streams included the fuel gas, the absorber off-gas, and oxidizer off-gas. The POHC identified for
the Demonstration was chlorobenzene. This compound was selected as a representative thermally
stable compound for the purpose of evaluating the TGP’s ability to destroy organic compounds. As
shown in Table 4-2, all calculated DREs were greater than 99.99 percent for chlorobenzene.
4 .3 SLAG AND SOLID RESIDUALS LEACHABILITY
A major objective of this SITE Demonstration was to evaluate the TGP’s ability to produce, from
hazardous waste feed, a non-hazardous solid residual in which heavy metals are bound in an inert slag
that complies with the regulatory requirements of TCLP. Compliance with the California WET-STLC also
applied since the tests were conducted in California. The TCLP and WET-STLC results for the soil,
slurry, and solid residual products are presented in Table 4-3.
4.3.1 Test Slurry Leaching Characteristics
The test slurry was spiked with lead nitrate and barium nitrate to create a surrogate RCRA-
hazardous waste feed and to evaluate the TGP’s ability to produce a non-hazardous solid residual in
which heavy metals are bound in an inert slag resulting in TCLP and WET-STLC measurements that are
lower than their respective regulatory limits. Table 4-3 shows that the test slurry feed measurements
were higher than the TCLP and WET-STLC regulatory limits for lead but lower than the regulatory limits
for barium.
Prior to the preparation of the slurry feed for the SITE Demonstration, the excavated Purity Oil
Sales Superfund Site soil was spiked with lead nitrate and barium nitrate. The spiked soil was
subjected to a TCLP-response test to ensure that the contaminated soil exceeded TCLP regulatory
limits. The TCLP measurement for a lead spike of 15,000 mg/kg was 223 mg/L in the soil; the TCLP
59

Table 4-2. Destruction and Removal Efficiencies (DREs) forPrincipal Organic Hazardous Constituent (POHC) - Chlorobenzene
DRE for gasification process
Run
1
2
3
Average
W,*(lb/h)
6.20
6.30
6.75
6.42
Raw syngas Flash gas(lb/h) (lb/h)
0.00016 0.000013
0.00019 0.000010
0.00023 0.000014
0.00019 0.000012
DRE for overall Texaco MRL operation
Total Wour** DRE***(lb/h) (%)
0.000173 99.9972
0.000200 99.9966
0.000244 99.9964
0.000210 99.9967
Run
1
2
3
Average
W,’ Fuel gas Abs. offgas Oxid. offgas Total W,* l DRE***(lb/h) (lb/h) (lb/h) (lb/h) (lb/h) (%)
6.20 0.0000033 0.00010 < 0.000019 <0.000122 > 99.9980
6.30 0.0000620 0.00038 0.000018 0.000460 99.9926
6.75 0.0000130 0.00023 0.000011 0.000254 99.9962
6.42 0.0000250 0.00024 <0.000016 <0.000281 > 99.9956
l * Win = Mass feed rate of chlorobenzene (POHC) in the waste stream feed.l* * * Wout = Mass emission rate of chlorobenzene (POHC) in gas effluent streamsl . W, - wcwl
*** DRE = x 100WI,
result for a barium spike of 30,000 mg/kg was 329 mg/L. At these spike concentrations, the Purity
Oil soil exceeded the TCLP regulatory limits for lead (5 mg/L) and barium (100 mg/L).
4.3.1.1l Normalized TCLP and WET-STLC Values for Lead in Test Slurry-.
The test soil composed of approximately 20 weight-percent Purity Oil soil (lead TCLP of Purity Oil
soil: 223 mg/L) and 80 weight-percent clean soil (lead TCLP of clean soil: <0.03 mg/L), could be
expected to have a normalized, or corrected, TCLP value for lead of approximately 40 mg/L. The test
slurry, composed of approximately 20 weight-percent total soil (normalized TCLP value for lead: 40
mg/L) diluted by the remaining slurry solution of 80 weight-percent coal, gypsum, and water (no lead
TCLP value) could be expected to have a calculated TCLP value for lead of around 8 mg/L, which
closely approximates the average TCLP measurement of 8.3 mg/L lead for the test slurry. Similarly,
60

Table 4-3. TCLP and WET-STLC ResultsLead and Barium
*. Lead TCLP of Purity Oil soil (waste feed to produce Purity oil slurry) with 15,000 mg/kg (as elemental lead) lead nitratespike and barium TCLP of Purity Oil soil with 30.000 mglkg [as elemental barium) barium nitrate spike-measured in pretestspike study.
l l** Clean soil is soil matrix used to produce clean soil slurry.l l *** The SITE Demonstration slurry (SL-1) is a mixture of slurries produced using Purity Oil soil and clean soil. SL-1 is
composed of 26,800 lb of Purity Oil slurry mixed with 138,040 lb of clean soil slurry. (See Table 4-l.)**** Range of values for SL-1, S-3, and S-4 based on 4 samples and S-5 based on 3 samples.
Pb: LeadBa: Barium
Regulatory value
Purity Oil soil
Clean soil (S-1) ** l l
Slurry (SL-1) *** l l l
Coarse slag (S - 3 )
Fine slag (S-4)
Clarifier solids (S-5)-
Regulatory value
Purity Oil soil * l
Clean soil (S-1 )**
Slurry (SL-1)*** ) l l l
Coarse slag (S-3)
Fine slag (S-4)
Clarifier solids (S-5)
TCLP Pb WET-STLC Pbmg/L mg/L
Range**** Average Range* *** Average
5.0 5.0
223
<0.03 <0.5 -
8.1-8.4 8.3 54-61 56
3.3-5.8 4.5 6.7-11.1 9.8
11-18.3 14.9 22.8-52.9 43.0
691-1,330 953 903-1,490 1,167---_
TCLP Ba WET-STLC Bamg/L mg/L
Range**** Average Range**** Average
100 100 - -
329 ---
0.3 <5.0
0.1-0.2 0 . 1 <5.0-6.5 <5.5
0.5-0.8 0.6 <5.0 <5.0
1.2-2.0 1.75 5.6-10.4 9.3
1.2-3.8 2.7 14-51.4 38.4- --.
an expected normalized WET-STLC value of 280 mg/L lead, based on spiked soil blending, would be
consistent with the average WET-STLC measurement of 56 mg/L lead for the test slurry, due to the
dilution of the coal, gypsum, and water.
61

4.3.1.2 Fate of Barium in Test Slurry--
The fate of the barium contaminant indicates that significant changes occurred in the barium
chemistry during slurry formulation. A pretest study TCLP value of 329 mg/L was measured in a
leachate produced from the spiked Purity Oil soil. This contrasts with the much lower 0.1 mg/L
measured in the TCLP leachate from the test slurry matrix, which included coal, gypsum, and water.
The introduction of sulfur-containing gypsum and coal could have provided an environment in the slurry
that changed the original soluble barium nitrate spike material to insoluble barium sulfate. The relative
solubilities of barium nitrate and barium sulfate differ by ten-thousand fold. Since barium sulfate is
relatively insoluble, it remains with the solids and does not transfer to the leachate during the TCLP
test. The one thousand times reduction in the test slurry TCLP result for barium from the pretest level
in the Purity Oil soil would be consistent with a partial speciation change to barium sulfate.
4.3.2 SITE Demonstration Results
The SITE Demonstration showed that the leachability of the lead in the main residual solid
product-the coarse slag-was lower than the leachability of the lead in the contaminated/spiked soil.
The leachability of the barium essentially remained unchanged. The average TCLP and WET-STLC
measurements for coarse slag, which comprised 62.5 weight-percent of the total solid residuals, were
lower than the TCLP regulatory levels for lead and barium and the WET-STLC regulatory value for
barium. The average TCLP and WET-STLC measurements for fine slag, which constituted 35.9 weight-
percent of the total solid residuals, and clarifier solids, which amounted to 1.6 weight-percent, were
higher than the TCLP and WET-STLC regulatory limits for lead but lower than the tests’ regulatory limit
for barium. The leach test results indicated mixed success in meeting the test objectives. Analysis of
the effects of dilution by the non-contributing slurry components-coal, water, gypsum-on the TCLP
and WET-STLC test results showed that the TGP can potentially produce-as its major solid residual-a
coarse slag product with TCLP and WET-STLC measurements below regulatory limits. The TGP
effectively treated a soil matrix exhibiting a normalized TCLP value of 40 mg/L for lead and produced
a coarse slag with an average TCLP value of 4.5 mg/L lead and a fine slag with an average TCLP value
of 14.9 mg/L lead.
The average WET-STLC measurements for all solid residual streams were higher than the WET-
STLC regulatory values for lead. However, the TGP demonstrated significant improvement in reducing
lead mobility as measured by WET-STLC results. The process treated a soil matrix exhibiting a
62

normalized WET-STLC value of 280 mg/L for lead and produced a caorse slag with an WET-STLC value
of 9.8 mg/L and a fine slag, with an average WET-STLC of 43 mg/L lead.
4.4 SYNTHESIS GAS PRODUCT
4.4.1 Synthesis Gas Composition
The synthesis gas (syngas) product from the TGP is composed primarily of hydrogen, carbon
monoxide, and carbon dioxide. For a commercial unit, the raw syngas would receive further treatment
in an acid gas treatment system to remove hydrogen sulfide. This would produce a combustible fuel
gas that could be burned directly in a gas turbine/electrical generation facility or be synthesized into
other chemicals.
The raw gas from the gasifier was sampled and analyzed to evaluate the TGP’s ability to gasify
a slurry containing a RCRA-hazardous waste material and produce a synthesis gas product. This gas
stream was then treated in the Texaco MRL Acid :Gas Removal System; the resulting fuel gas product
was flared. Table 4-4 shows the compositions‘of the raw syngas and the fuel gas product.
4.4.2 Products of Incomplete Reaction (PIRs)
The TGP is a gasification process which converts organic materials into syngas by reacting the
feed with a limited amount of oxygen (partial oxidation). In addition to the syngas mixture of hydrogen
and carbon monoxide, other organic compounds appear as products of the incomplete partial oxidation
reaction. The term "PIR" describes the organic compounds detected in the gas product streams as a
result of the incomplete reaction process.
All gas streams, including the raw gas, flash gas from the gasification section, fuel gas, absorber
off-gas, and oxidizer off-gas contained trace amounts of volatile and semivolatile PIRs. Carbon
disulfide, benzene, toluene, naphthalene, naphthalene derivatives, and acenaphthene concentrations
were measured in the gas streams at parts per billion (ppb) levels. The POHC-chlorobenzene-was
also detected. Small amounts of methylene chloride and phthalates were also detected but likely were
63

Table 4-4. Synthesis Gas Composition
Raw syngas composition an
Run
1
“2 co co2 C”, N*(vol. %) {vol. %) [vol. %) (ppmv) (vol. %)
3 4 . 6 3 3 . 0 2 5 . 9 8 7 6 . 5
I heating value .II
A r c o s “,S THC IHeating value i
(vo l . %) (ppmv) (ppmv) (ppmv) 1 (Btu/dscf)
0 . 3 1 2 0 1 ,180 4 9 2 1 9
0 . 0 1 7 0 3 . 0 5 0 17 ! 2 1 0 ‘I I31 .3 2 6 . 9 51 5.1
3 9 . 6 2 6 . 2 4 2 5 .7 0 . 0 5 1 3 0 1 , 9 8 0 14 2 2 8
34 .6 2 6 . 3 6 0 5 . 8 0.1 1 4 0 2 , 0 7 0 2 7 2 1 9
Fuel gas composition and heating value
C O CC* C”. N* A r c o s “,S THC Heating value
(vol. %) (vol. %) (ppmv) (vol. %) (vol. %) (ppmv) (ppmv) (ppmv) (Btu/dscf)
39.1 21 .o 71 5 .8 0 . 2 3 3 4 9 0 3 2 2 3 9
3 5 . 0 2 0 . 9 4 9 4.9 0 . 0 5 4 4 5 8 0 16 2 3 9
41.3 2 1 . 2 4 4 5 .6 0.1 5 0 6 8 15 2 3 9
38 .5 2 1 . 0 5 5 6 . 4 0.1 4 2 3 8 0 21 2 3 9
2
3
Average
Run
1
2
3
Average
2 6 . 9
3 5 . 4
3 2 . 3
“*(vol. %)
37 .6
38 .3
34 .7
36 .9
H2: Hydrogen CH4: Methane C O S : Carbonyl sulfide
CO: Carbon monoxide N2: Nitrogen H,S: Hydrogen sulfide
CO2: Carbon dioxide Ar: Argon THC: Total hydrocarbons (excluding methane)

sampling and analytical contaminants. Measured concentrations of PCDDs and PCDFs in the gas
streams were comparable to the blanks, indicating that these species, if present, were at concentrations
less than or equal to the method detection limits (parts per quadrillion). Other compounds, such as
xylenes, chloromethane, bromomethane, dibenzofuran, fluorene, and phenanthrene (expected from the
thermal treatment of coal and chlorobenzene), were detected at lower concentrations in the flash gas
and off-gases.
During the SITE Demonstration all of the effluent gas streams including the fuel gas, and the
absorber and oxidizer off-gases, were routed to a flare. For a commercial design, the fuel gas product
will be further processed for use as a fuel for power generation or an intermediate for chemical
synthesis. The absorber and oxidizer off-gas streams or their equivalent effluents based on the final
commercial design will either be flared or further processed, treated, or recycled, based on permit
constraints.
4.4.3 Particulate Emissions
During the SITE Demonstration, particulate emissions were measured for the raw syngas and fuel
gas streams. These averaged 6.1 milligrams per cubic meter (mglm? in the raw syngas, and 1.3 mglm”
in the fuel gas. By comparison, the particulate emission standards for boilers and industrial furnaces
processing hazardous waste (40 CFR Part 266 Subpart H), and industrial, commercial, and institutional
steam generators processing coal and other fuels (40 CFR Part 60 Subpart Db) are higher than the
average measured values for these gas streams. Since the fuel gas product would not be vented or
flared in a commercial unit, but would be burned directly in a gas-turbine/electrical-generation facility
or synthesized into other chemicals, it is expected that the treated vent gas from any of these
downstream facilities will be treated to meet applicable particulate emissions standards. This must be
assessed on a case-by-case basis.
4.4.4 Acid Gas Removal
Hydrogen chloride gaseous emission rates measured from 0.0046 to 0.0117 lb/h. The chlorine
concentration in the feed slurry, based on a chlorobenzene spike addition equivalent to 3,150 mg/kg
in the slurry and the chloride concentration in the slurry, ranged from 4.3 to 4.7 lb/h. Using these
figures, the TGP’s hydrogen chloride removal efficiency exceeded 99 percent.
65

Sulfur-containing gas emission rates measured from 2.2 to 2.7 lb/h. The sulfur concentration in
the slurry, based on the ultimate analysis for sulfur, ranged from 0.97 to 1.20 weight-percent. Using
these figures, the TGP’s sulfur removal efficiency averaged 90 percent.
According to Texaco, the MRL systems for acid gas removal are designed to process a wide
variation (flow and composition) of gas streams based on the developmental-nature of the research
activities conducted there. It is expected that systems designed to meet the specific requirements of
proposed commercial TGP units will provide higher removal efficiencies.
4.5 METALS PARTITIONING
The fate of the spike metals in the slurry (lead and barium) appeared to depend on their relative
volatilities under TGP operating conditions. Lead-a volatile metal-concentrated in the clarifier solids,
which were scrubbed from the raw syngas. Lead probably evaporated in the hot regions of the gasifier
and condensed on the fine particles in the cooler areas of the process. The more refractory barium did
not concentrate in any particular solid residue. It partitioned throughout the solid residual streams
roughly in proportion to the mass of each residual stream.
As presented in Table 4-5, average lead concentrations were 880 mg/kg, 329 mg/kg, 491 mg/kg,
and 55,000 mg/kg in the Demonstration slurry, coarse slag, fine slag and clarifier solids, respectively.
Although the clarifier solids comprised only 1.6 weight-percent of the solid residuals, they contained
71.1 weight-percent of the measured lead in all the solid residuals. The remaining 28.9 weight-percent
of the lead partitioned to the coarse and fine slags.
Average barium concentrations were 2,700 mg/kg, 11,500 mg/kg, 15,300 mg/kg, and 21,000
mg/kg in the Demonstration slurry, coarse slag, fine slag and clarified solids, respectively. The barium
partitioned to the solid residual streams in approximate proportion to the mass flow of each stream.
The coarse slag, which comprised 62.5 weight-percent of the solid residuals, contained 55 weight-
percent of the measured barium in the solid residuals. The remaining 45 weight-percent of the barium
partitioned to the fine slag and clarifier solids in approximate proportion to their mass flow.
66

Table 4-5. Mass Flow Rates and Total Concentrations of Lead andBarium in Slurry Feed and Solid Residuals*
Flow rate (lb/h)
Slurry(SL-1)
Coarse slag(S-3)
Fine stag(S-4)
- -Clarifier solids
(S-5)
Range** l lAverage% of Residuals ---
Pb concentration (mg/kg)
2,212-2,291 250-307 151-167 3.1-10.52,216 273 157 6 . 8
62.5 35.9 1.6
Range ** lAverage
Pb mass rate
867-899 198-542 217-651 43.400-72.000880 329 491 55,000
Average (lb/h)% of Slurry Pb% of Residuals Pb
Ba concentration (mg/kg)
2.00 0.09 0.08 0.42_ _ 4.5 4.0 21.0-- 15.3 13.6 71.1
Range ** lAverage
Ba mass rate
1,750-3,580 8,090- l6,300 11.800-18.300 15,100-26,3002.700 11,500 15,300 21,000
Average (lb/h) 6.1 3.1 2.4 0.14% of Slurry Ba _ _ 50.8 39.3 2.3% of Residuals Ba __ 55:0 42.5 2.5
-. 4
* Mass flow rates of and metal concentrations for slurry are on as received basis; for solid residuals are on dry basis.** Flow rate range for SL-1, S-3, and S-4 based on 3 measurements and S-5 based on 2 measurements. Pb and Ba
concentrations ranges for SL-1, S-3, and S-4 based on 4 samples and S-5 based on 3 samples.
Pb: LeadBa: Barium
4.6 PROCESS WASTEWATER
The Demonstration produced three process wastewater streams: process wastewater (flash tank
blowdown and quench/scrubber and lockhopper water inventory on shutdown); gasification vacuum
filtrate (produced from the vacuum filtration of the clarifier bottoms); and neutralized wastewater from
the sulfur removal unit. Samples from each of these streams were collected and analyzed for VOCs,
SVOCs, PCDD/PCDF, metals, pH, and organic and inorganic halogens. Samples of the inlet water
stream were also analyzed to determine if it was introducing any contaminants of concern.
67

Lead concentrations in the process wastewater and vacuum filtrate ranged from 12.4 to 38.9
mg/L and from 3.98 to 18.4 mg/L, respectively. Although the majority of the lead was found in the
clarifier solids, small amounts of lead or lead compounds remained suspended in the clarifier overhead
and traveled to the process wastewater as the flash tank blowdown. Similarly, small amounts of lead
remained suspended in the vacuum filtrate and did not settle in the clarifier solids.
Trace concentrations of VOC and SVOC PlRs such as benzene, acetone, carbon disulfide,
methylene chloride, naphthalene and naphthalene derivatives, and fluorene were found in the
wastewater streams. No concentrations of PCDDs or PCDFs were found at or above the method
detection limit of 10 nanograms per liter (ng/L).
Inorganic chloride concentrations in the wastewater streams ranged from 380 mg/L to 6,800
mg/L. These values were, in general, an order of magnitude higher than the concentrations found in
the inlet water; they indicated the presence of additional chlorides in the feed. Ammonia was also
detected in the process wastewater and vacuum filtrate streams; the pH values of these streams were
fairly neutral. The inorganic chloride concentrations indicated the presence of chloride, but the neutral
pH values indicate that the chloride species is not acidic. These results show that the HCI produced
in the gasification process was removed in the quench and scrubber, neutralized by the ammonia, and
discharged in the process wastewater/vacuum filtrate effluents.
Concentrations of organic chloride in the inlet water ranging from 680 mg/kg (Run 3) to 2,500
mg/kg (Pretest) were carried through the system to the wastewater streams. Similar concentrations
appeared in the process wastewater, vacuum filtrate, and neutralized wastewater streams.
For proposed commercial units,
for disposal as non-hazardous water.
the wastewater streams would be treated on-site for recycle or
68

SECTION 5
OTHER TECHNOLOGY REQUIREMENTS
5.1 ENVIRONMENTAL REGULATION REQUIREMENTS
Section 2 - Technology Applications Analysis, Subsection 2.1 - Objectives - Performance versus
ARARs discusses specific environmental regulations pertinent to the overall activities associated with
the operation of the TGP.
Permits may be required by state regulatory agencies prior to implementing the TGP system.
Permits may also be required to operate the system and to store wastes during and after processing.
If off-site treatment/disposal of contaminated residuals and wastewater is required, they must be
taken off site by a licensed transporter to a permitted landfill under manifest documentation.
5.2 PERSONNEL ISSUES
Overall labor requirements for the activities associated with the operation of the TGP are discussed
in Section 3 - Economic Analysis.
The excavation and processing of hazardous waste-material requires the development of site-
specific health and safety plans that address personnel responsibilities, chemical and physical hazards,
PPE, site control, hazard-zone definition, decontamination procedures, exposure monitoring,
recordkeeping, and maintenance of Up-to-date specific material safety data sheets for all site-related
chemicals of concern. All technicians involved in excavation activities or operation of the TGP are
required to have completed OSHA hazardous waste operations training and must be familiar with all
relevant OSHA requirements. For most sites, minimum PPE for technicians will include gloves, hard
69

hats, steel toe boots, and coveralls. Depending on contaminant types and concentrations, additional
PPE may be required; excavation activities may require particulate protection with a cartridge-equipped
respirator and specific TGP operations mandate the need for chemical resistant/fire retardant coveralls.
5.3 COMMUNITY ACCEPTANCE
Community acceptance and other Superfund feasibility study evaluation criteria are addressed in
the Executive Summary. As mentioned above, Subsection 2.1 - Objectives - Performance versus
ARARs also discusses specific environmental regulations criteria that impact on the acceptance of a
TGP unit within a specific community or jurisdiction.
Fugitive emissions can be managed by watering down the soils prior to excavation and handling
and covering stockpiled soil with plastic.
The TGP’s solids grinding and slurry preparation system can include negative pressure enclosures,
nitrogen blanketing, baghouse collection of particulates and carbon adsorption for organics removal to
control fugitive emissions prior to the slurrying of the coal and soil with water..
The TGP unit can also respond to community noise concerns by the design and noise-dampening
of rotating equipment.
70

SECTION 6
TECHNOLOGY STATUS
6.1 PETROLEUM PRODUCTION TANK BOTTOMS DEMONSTRATION
A demonstration was conducted in 1988 at MRL for the California Department of Health Services
where petroleum tank bottoms from a California oil production field were co-gasified with low-sulfur,
western coal. This California-designated hazardous waste was fed to the gasifier at a rate of 600 lb/h
mixed with 2,450 lb/h of coal slurry. The dry syngas was composed of 39 percent carbon monoxide,
38 percent hydrogen, and 21 percent carbon dioxide. Texaco reported that the solids were non-
hazardous, based on California Assessment Manual limits for total and leachable metals in effect at the
time of the demonstration. Both the solids and wastewater were free of trace organics and EPA priority
pollutants. Treatment results are presented in Appendix II.
6.2 EL DORADO, KANSAS REFINERY PROJECT
Texaco has announced plans to build a 75-million dollar TGP power facility at its El Dorado,
Kansas refinery, which will convert about 170 tpd of non-commercial petroleum coke, hydrocarbon
streams, and RCRA-listed hazardous wastes into syngas. The syngas, combined with natural gas, will
power a gas turbine to produce approximately 40 megawatts of electrical power-enough to meet the
full needs of the refinery. The exhaust heat from the turbine will be used to produce 180,000 lb/h of
steam-approximately 40 percent of the refinery’s requirements. Construction will begin during the
first quarter of 1995, with start-up projected for the second quarter of 1996.
The U.S. EPA, Office of Solid Waste and Emergency Response, has reviewed the El Dorado
project and has judged that the gasifier would be an exempt recycling unit as provided under 40 CFR
261.6(c)(l) and does not meet the definition of an incinerator, a boiler, or an industrial furnace.
71

APPENDIX I
VENDOR CLAIMS
Appendix 1 summarizes claims made by Texaco regarding the SITE Demonstration and the Texaco
Gasification Process (TGP). The information presented herein represents Texaco’s point of view; its
inclusion in this Appendix does not constitute U.S. Environmental Protection Agency approval or
endorsement.
I. 1 INTRODUCTION
The TGP is a proven, commercial technology with a reputation for flexibility, reliability, efficiency,
and environmental superiority. This reputation is based on more than 40 years of worldwide commercial
experience and is supported by nearly 50 years of continuous research and development.
Texaco’s participation in the SITE Demonstration Program is part of a decade-long effort to expand
the use of the technology to waste treatment. The Demonstration showed that the TGP can effectively
treat soils and sludges that are contaminated with hazardous organic pollutants while producing a
syngas with commercial value. The Demonstration also showed that the process provides a means to
concentrate volatile heavy metals into a small stream of solids, potentially suitable for metal
reclamation.
The projected treatment costs are lower than other thermal treatment technologies. Also, the
nature of the process is such that a single unit can treat soils with varying properties, including type,
degree of contamination, moisture content, size distribution, and silica:clay ratio.
The balance of this Appendix I provides additional information related to the results of the
Demonstration. Appendix II presents case study results of other testing conducted by Texaco.
Together, Appendices I and II include information on:
72

l Texaco’s gasification testing programs and facilities;
l Independent data and test results gathered by Texaco during the Demonstration;
l Pilot-scale tests on other waste feeds conducted by Texaco (Case Studies - Appendix II).
1.2.1 Texaco’s Gasification Testing Programs and Facilities
The SITE Demonstration was held at the Montebello Research Laboratory (MRL) where pilot units
are available to support Texaco’s research and development efforts and to provide the design and
permitting data required for commercial projects. The reliability of MRL data for commercial design has
been validated over nearly 50 years of experience. Because of the relatively large scale of these units
(15-45 tpd of coal equivalent), they are also used to demonstrate and test commercial plant
configurations and components.
The scope of the test programs vary to meet the objectives of each project. Normally, such as
with a new feedstock, pilot-unit tests are preceeded by laboratory tests to characterize the feed and
to determine appropriate operating conditions. These tests are then followed by one or more pilot-unit
evaluations, generally of increasing length, ranging from one-half day to confirm operability, to up to
7 days or as needed to gather environmental data
1.2.2 Process Data Gathering and Analysis
MRL’s pilot development units are fully equipped and instrumented to gather detailed process
data. Operation of the HPSGU II, the Selexol Acid Gas Removal Unit, and the Sulfur Removal Unit,
used during the Demonstration, are controlled using a modern electronic distributed control system.
On-line instruments are used to provide continuous data on the flow rates, temperatures, and pressures
of the various process streams. Gas stream compositions are monitored using two on-line mass
spectrometers. Additional systems allow extensive sampling of the process streams for off-line testing.
Most of the analytical testing is done in the fully-equipped, on-site analytical laboratory.
Environmental sampling and analyses are usually contracted to independent laboratories.
Mass and energy balances are calculated by statistically adjusting the raw data to achieve 100
percent closure for carbon, hydrogen, oxygen, nitrogen and sulfur (major species). This is done with
the minimum overall change to the raw data while limiting the change in any one variable to no more
73

than the expected random variation in its measurement The adjusted data are used as the basis for
reporting results.
1.2.3 Syngas Composition
Important characteristics of the TGP are the stability of the process during steady-state operations
and the smooth accommodation to variations in the feed rate and composition. Syngas composition
data from the Demonstration illustrate this stability. Averages of data, recorded every 60 seconds
from the two on-line mass spectrometers during Runs 1-3, are shown in Table l-l; the data from each
run are in excellent agreement, with only minimal variations in the syngas composition. This reflects
the relatively steady operating conditions during the Demonstration and is consistent with previous
pilot-unit and commercial-plant experience.
Table I-1. Svnaas Composition Data - On-Line Analvsis
Test Run
Hydrogen (H,)
I Run 1 Run 2 Run 3
Syngas composition, vo l%
34.14
Carbon Monoxide (CO) 35.05 36.17 36.18
Carbon Dioxide (CO,) 27.05 25.54 25.81
Methane (CH,) 0.00 0.01 0.00
Argon (Ar) 0.15 0.15 0.15
II Nitrogen (NJ 2.98 3.11 2.96
II Total 1 1 0 0 . 1 9 1 1 0 0 . 1 6 1 100.15
1.2.4 Mass Balance Data
Unadjusted balances for carbon, hydrogen, nitrogen, sulfur and oxygen were calculated from the
compositions and flow rates of each of the streams entering and leaving the gasification pilot unit. For
all three runs, the unadjusted balances closed to within 99-101 percent for the five major species,
which indicates that the data were of very high quality.
74

The overall mass balances for Runs 1-3 show that essentially all of the organic matter in the feed
was converted to syngas. The unconverted carbon in the residuals represented less than 0.5 weight-
percent of the carbon in the feed slurry, and unconverted carbon was well below 0.05 weight-percent
of the total weight of the coarse and fine slag.
1.2.5 Metals Partitioning
During the initial stage of pilot-unit operations, there is a tendency for some residual solids to
accumulate in portions of the gasification pilot unit. These solids are generally the finer size materials
which also tend to be enriched in volatile metal species, such as lead. Recoveries of these species tend
to increase with time making it difficult to achieve consistently high recoveries of the residual solids
during short operating periods. Therefore, efforts are made to recover the remaining residual solids
after each test. The results obtained by Texaco, based on their post-demonstration sampling, are
presented in Table 1-2.
=
Table 1-2. Mass Flow Rates of Lead and Barium inSlurry Feed. and Solid Residuals
Slurry Coarse slag Fine slag Clarifier solids Total(SL-1) (S-3) (S-4) (S-5)** recovery
Dry solids
Avg. flow rate (lb/h) 443.9* 273.1 128.6 5.06
% of SL-1 61.5 29.0 1.1 91.6
Pb
Avg. flow rate (lb/h) 1.94 0.524 0.405 0.60
% of SL-1 27.0 20.0 30.9 78.8
Ba
Avg. flow rate (lb/h) 9.99 3.34 1.77 0.076
% of SL-1 33.5 17.7 0.8 I - -52.0 -
* Mass flow rate based on ash.l** Clarifier solids samples were taken over a 71 -hour period before and during the 3 test runs.
Slurry, coarse slag, and fine slag samples were taken during the 35-hour period of the 3 test runs.
Pb: LeadBa: Barium
75
1.2.6 Dioxins and Furans
It is known that dioxins and furans (PCDD/PCDF) are formed during the incineration of chlorinated
wastes and that they are perhaps not simply the products of incomplete combustion. However, in the
reducing atmosphere of a Texaco gasifier, these compounds cannot form and are, based on substantial
technical and operations data, destroyed, if present. The data from the SITE Demonstration run show
that concentrations of PCDD/PCDF above the detection limits of the analysis, in the range of parts per
quadrillion (actually less than 0.01 nglm’) , could not be reliably measured in the syngas. These
concentrations are significantly lower than those expected from incineration.
1.2.7 Slag Stability
The long-term stability of slag products from the TGP was tested indirectly in 1989 through 1992
by a research program at the College of Agricultural Sciences, Pennsylvania State University. Coal
gasification slag from the Cool Water Program was evaluated as a hydroponic medium. An unpublished
report concluded that chrysanthemums and poinsettias grown in slag-amended media had nutrient
contents in the normal range.
1.3 COMMERCIAL DESIGN DIFFERENCES
111111 1.3.1 Unit Design
The HPSGU II pilot gasifier used for the Demonstration is part of a research facility and would not
be copied for a commercial plant. A commercial plant would not be designed to handle the broad range
of feedstocks processed at MRL, which have included liquefied auto tires and plastics, oily wastes, and
sewage sludge. A commercial unit for soil remediation would be designed for a lower operating
pressure, have a larger lockhopper to handle the increased volume of slag, and incorporate a more
efficient gas cleaning system.
1.3.2 Thermal Efficiency
Most operating gasifiers are designed to maximize the production of hydrogen and carbon
monoxide. The TGP is capable of efficient gasification by consuming a minimal part of the fuel value
in the feed to maintain the process operating temperature. The use of oxygen rather than air, the small
76
reactor size with low heat losses, and the entrained-bed design, which allows low residence times, all
contribute to the improvement of thermal efficiency.
ln the application of TGP to soil remediation, operating at a high thermal efficiency may not be
as important as increasing the throughput of soil. Economics may justify using more of the available
heat to handle more slag-forming solids. Operation with more oxygen provides the extra heat and
results in a greater percentage of carbon dioxide in the syngas.
1.3.3 Uses of Syngas
The valuable constituents of syngas are hydrogen and carbon monoxide when used as chemical
feedstocks or used as fuels. Any equipment necessary to further process the syngas was not included
in the economic analysis presented in Section 3. The syngas can be combusted directly in a boiler or
an engine driving an electric generator, in which case combustion of the syngas will oxidize trace
compounds and further reduce their concentrations in the exhaust gases. If the plant is located near
a refinery or chemical plant, the syngas may be reformed via further processing to increase the
hydrogen or methane content.
1.3.4 Alternative Auxiliary Fuels
The Demonstration was carried out using coal as an auxiliary fuel to supplement the fuel value
of the soil. Any higher-Btu source could have been considered as an auxiliary fuel, including waste oil
or another high-Btu waste. Two auxiliary fuels that are considered suitable for contaminated soils are
oil and petroleum coke.
77

APPENDIX II
CASE STUDIES
The results of three previous demonstrations of gasification of wastes at the MRL are presented
for comparison. No organic compound heavier than methane was found in the raw syngas at a
concentration above 1 ppmv during any run. The volatile metals were concentrated in the clarifier solids
and in some cases resulted in classifying this small solids stream as a RCRA hazardous waste.
II. 1 PETROLEUM PRODUCTION TANK BOTTOMS
In December, 1988, a 25-hour gasification run was made in the Low Pressure Solids Gasification
Pilot Unit with a mixture of 20 weight-percent field tank bottoms from the Richfield East Dome Unit of
the Los Angeles basin and 80 weight-percent SUFCo Utah coal as part of a study for the California
Department of Health Services (Contract 88-T0339). The purpose of the test was to demonstrate the
gasification of a RCRA-exempt, low-Btu hazardous waste.
The tank bottoms had a higher heating value of 5,500 Btu/lb, a moisture content of 64.6 weight-
percent, and were contaminated with 3,000 mg/kg of benzene, toluene, ethylbenzene, and xylene. The
combined slurry feed rate was 2,976 lb/h with a solids concentration of 62 weight-percent.
The gasification process successfully and effectively converted the hazardous material to a useful
syngas product and non-hazardous effluents.
II. 2 MUNICIPAL SEWAGE SLUDGE
Thirty-four tons of dried sewage sludge produced at Newark, NJ from raw, dewatered sludge, and
4,000 gallons of condensate from the indirect dryers were shipped to MRL for a series of nine
gasification runs in December, 1990. The dried sludge was remixed with condensate and ground with
78

3 parts Pittsburgh #8 coal to 1 part sludge and fed to the HPSGU II in a 53 weight-percent solids slurry.
The slurry feed rate was 2,150 lb/h.
As in the SITE Demonstration, volatile heavy metals tended to partition to the clarifier solids. Lead
was present in the feed slurry at a concentration of 188 mg/kg and 85.7 weight-percent of the
recovered lead was found in the clarifier solids. This stream, representing just 3 weight-percent of the
total solids, exceeded the TCLP limits for lead and cadmium. The coarse slag and fine slag streams did
not exceed the test limits for any metal.
Il.3 HYDROCARBON-CONTAMINATED SOIL
The disposal of a hydrocarbon-contaminated soil by gasification with coal was demonstrated
during a 54-hour run in March, 1991. The HPSGU II pilot unit was used to gasify a mixture of 86
weight-percent of Pittsburgh #8 coal and 14 weight-percent topsoil contaminated with 4 weight-percent
heavy vacuum gas oil from Texaco’s Los Angeles refinery. A total of 3.8 m3 of topsoil and heavy gas
oil was gasified. The gasifier feed rate was 2,150 lb/h of slurry with a solids concentration of 65.
weight-percent.
The purpose of the test was to show that the addition of a small amount of contaminated soil
would have minimum impact on the operation of the coal gasifier. Extensive environmental data were
gathered during this test and demonstrated the feasibility of gasifying a contaminated soil while
producing a useful syngas.
The coarse and fine slag were non-hazardous under Federal and California standards. The clarifier
solids were above only the California WET-STLC regulatory limits for arsenic and lead. The clarifier
solids stream is minor and tends to concentrate the metals in the feed. In this case the volume
reduction of hazardous solids was 94 percent.
Typical syngas data from the three case studies described above are summarized in Table II-1.
79

Table 11-l. Raw Syngas Composition and Heating Value_ - _ ‘ I - -
Case Study II.1 I I .2 II.3
Waste Tank Sewagefeed bottoms sludge Soil
Svnaas composition. vol.%
Hydrogen (H,) 37.68 35.0 34.5’2
Carbon monoxide (CO) 39.45 38.5 48.36
Carbon dioxide (CO,) 21.21 23.5 15.64
Nitrogen (NJ 1.32 1.9 0.18
Argon (Ar)
Methane (CH.J, ppmv
,,
0.08 0.1 0.08
300 __ 420
31 ,“igh heating3;re. Btu/dsci2, ,
80