tesis doctoral - upm
TRANSCRIPT
UNIVERSIDAD POLITÉCNICA DE MADRID
ESCUELA TÉCNICA SUPERIOR DE
INGENIEROS AGRÓNOMOS
INFLUENCEMANAGEMENT
PERFORMANCE AND EGG QUALITY OF EGG
INFLUENCIA DE FACTORES NUTRICIONALES Y DE MANEJO SOBRE LA PRODUCTIVIDAD Y CALIDAD DEL HUEVO EN
GALLINAS PONEDORAS RUBIAS
TESIS DOCTORAL
Adriano Pérez Bonilla
INGENIERO AGRÓNOMO
UNIVERSIDAD POLITÉCNICA DE MADRID
ESCUELA TÉCNICA SUPERIOR DE
INGENIEROS AGRÓNOMOS
INFLUENCE OF NUTRITIONAL AND MANAGEMENT PRACTICES ON PRODUCTIVE
PERFORMANCE AND EGG QUALITY OF EGG-LAYING HENS
INFLUENCIA DE FACTORES NUTRICIONALES Y DE MANEJO SOBRE LA PRODUCTIVIDAD Y CALIDAD DEL HUEVO EN
GALLINAS PONEDORAS RUBIAS
TESIS DOCTORAL
Adriano Pérez Bonilla
INGENIERO AGRÓNOMO
2012
UNIVERSIDAD POLITÉCNICA DE MADRID
ESCUELA TÉCNICA SUPERIOR DE
INGENIEROS AGRÓNOMOS
AND ON PRODUCTIVE
PERFORMANCE AND EGG QUALITY OF BROWN
INFLUENCIA DE FACTORES NUTRICIONALES Y DE MANEJO SOBRE LA PRODUCTIVIDAD Y CALIDAD DEL HUEVO EN
DEPARTAMENTO DE PRODUCCIÓN ANIMAL
ESCUELA TÉCNICA
INFLUENCE OF NUTRITIONAL AND MANAGEMENT PRACTICES ON PRODUCTIVE
PERFORMANCE AND EGG QUALITY OF BROWN EGG
INFLUENCIA DE FACTORES NUTRICIONALES Y DE MANEJO SOBRE LA PRODUCTIVIDAD Y CALIDAD DEL HUEVO EN
GALLINAS
Adriano Pérez Bonilla
Gonzalo González Mateos
Dr.
DEPARTAMENTO DE PRODUCCIÓN ANIMAL
ESCUELA TÉCNICA SUPERIOR DE INGENIEROS AGRÓNOMOS
INFLUENCE OF NUTRITIONAL AND MANAGEMENT PRACTICES ON PRODUCTIVE
PERFORMANCE AND EGG QUALITY OF BROWN EGG-LAYING HENS
INFLUENCIA DE FACTORES NUTRICIONALES Y DE MANEJO SOBRE LA PRODUCTIVIDAD Y CALIDAD DEL HUEVO EN
GALLINAS PONEDORAS RUBIAS
Adriano Pérez Bonilla
INGENIERO AGRÓNOMO
DIRECTOR DE TESIS
Gonzalo González Mateos
Dr. INGENIERO AGRÓNOMO
2
DEPARTAMENTO DE PRODUCCIÓN ANIMAL
SUPERIOR DE INGENIEROS AGRÓNOMOS
INFLUENCE OF NUTRITIONAL AND MANAGEMENT PRACTICES ON PRODUCTIVE
PERFORMANCE AND EGG QUALITY OF BROWN
INFLUENCIA DE FACTORES NUTRICIONALES Y DE MANEJO SOBRE LA PRODUCTIVIDAD Y CALIDAD DEL HUEVO EN
Gonzalo González Mateos

3
“Lo importante es no dejar de hacerse preguntas”
“Una enorme cantidad de experimentos no pueden probar definitivamente que tengo razón, pero un solo
experimento puede probar que estoy equivocado”
“Se debe hacer todo tan sencillo como sea posible, pero no más sencillo”
Albert Einstein
“La ciencia es la progresiva aproximación del hombre al mundo real”
Max Planck
“El saber te hará libre” Anónimo

4
A mis padres, hermanos, abuelos, tios y a Clara

5
AGRADECIMIENTOS
¡Por fin!, después de mucho tiempo de estudio y trabajo a las espaldas llego a la
culminación de todo mi esfuerzo tanto profesional como personal, por ello, a estas
alturas de la “película” no me gustaría dejarme a nadie en el tintero.
En primer lugar agradecer a mis padres la educación recibida a lo largo de mi
vida, educarme en la filosofía del esfuerzo, del tesón, del compañerismo, de la
solidaridad, del “no todo vale”, en fin, gracias por todos los logros que he
conseguido gracias a vosotros, vuestro cariño, comprensión, aguante y esfuerzo.
A mis hermanos David e Israel, porque sin su apoyo y motivación hasta el
infinito hubiera sido imposible acabar esta tesis entre otras muchas cosas.
Especial mención a mi piticli, mi pequeña, mi niña, mi muro de las
lamentaciones, mi psicóloga, mi profesora de estadística, de Excel, de Word, de
Power Point, de SAS.. Clara, sabes que sin ti no lo hubiera consegido. Gracias
amor!.
A la dirección de mi empresa, Camar Agroalimentaria por permitirme la
realización de esta Tesis y confiar en mí a lo largo de todo este período, sin duda,
de una de las cosas de las que me siento más orgulloso es ver plasmado mi
trabajo en el día a día y sentir que contribuyo de forma importante en la mejora
del negocio. Muchas gracias.

6
A Gonzalo, simplemente decirte que te estaré eternamente agradecido por todo el
trabajo que hemos desarrollado juntos estos últimos años y sobre todo al enorme
esfuerzo que se que ha supuesto las correcciones, mirar datos, etc, mientras
estabas de punta a punta del mundo. Me siento un privilegiado al trabajar con
una persona con tanto prestigio y con tanta capacidad de trabajo.
A todo el personal de Camar Agroalimentaria y en especial a “mis granjeros”,
Félix, Ángel y Mario; y a los auxiliares de laboratorio Gianina y Eugenia por
todo el trabajo bien hecho, por todos esos fines de semana, por toda esa cantidad
de días de puesta, peso de huevo, contar gallinas, pesar gallinas…etc, por todos
esos detalles de manejo en nave y laboratorio, sin vosotros esto no hubiera sido
posible. Mil gracias.
Al mis compañeros del equipo de trabajo de Gonzalo (Mohamed, Martina,
Julio, Lourdes, Carine, Maziar, Sara, Beatriz, Pilar, Sergio, Vahid, Hissam
….) por el escrupuloso trabajo realizado en nave y laboratorio. Os debo mucho.
A mi compañero y amigo Samuel Novoa, por su inestimable ayuda en las naves,
por ser tan trabajador, tan buen profesional y ser un amigo en momentos
difíciles.
A la granja experimental de Nutreco (Poultry Research Center), mi segunda
familia, y en especial a Pedro Pérez de Ayala y Rosa Rocha por permitirme
“asaltar” la fábrica y a Marcos, Paco y Borja por su excelente trabajo en la
fabricación de los piensos. Gracias igualmente a Ángel Fernández por resolverme
las 1000 dudas sobre los métodos de análisis de laboratorio y al grupo de
7
investigadores de avicultura (Ángela y Jon) por resolverme dudas “existenciales”
y a mi antigua “jefa” Anabel por su apoyo incondicional.
A todos mis profesores de la rama de producción animal, tanto de la E.U.I.T.
Agrícolas como de la E.T.S.I. Agrónomos por formarme como persona y como
profesional a lo largo de estos 14 años, por “moldearme”, por generarme esta
inquietud interior sobre nuestra responsabilidad y compromiso con la sociedad.
A los editores de la sección de Metabolismo y Nutrición del Poultry Science
(Robert Elkin, Enric Esteve y Markus Rudehustcord) y a los revisores de los
artículos, por sus inestimables correcciones y comentarios en el desarrollo de los
artículos.
MUCHAS GRACIAS A TODOS
LO CONSEGUIMOS!!!!
Adriano Pérez Bonilla
8
INDEX
RESUMEN .................................................................................................................... 19
ABSTRACT .................................................................................................................. 25
CHAPTER 1: LITERATURE REVIEW AND OBJECTIVES ....... ........................ 30
1. LITERATURE REVIEW ................................................................................................ 31
1.1. Introduction ...................................................................................................... 31
1.2. Effect of the main cereal of the diet on hen productivity and egg quality ........ 34
1.3. Effect of supplemented fat of the diet on hen productivity and egg quality ..... 36
1.4. Effect of linoleic acid of the diet on hen productivity and egg quality ............. 38
1.5. Effect of protein and aminoacids content of the diet on hen productivity and
egg quality ............................................................................................................... 39
1.6. Effect of energy content of the diet on hen productivity and egg quality ......... 42
1.7. Effect of initial body weight at the onset of lay on hen productivity and egg
quality ...................................................................................................................... 44
2. OBJECTIVES ............................................................................................................. 46
3. REFERENCES ............................................................................................................ 47
CHAPTER 2: EFFECTS OF THE MAIN CEREAL AND TYPE OF F AT OF THE
DIET ON PRODUCTIVE PERFORMANCE AND EGG QUALITY OF B ROWN-
EGG LAYING HENS FROM 22 TO 54 WEEKS OF AGE (TRIAL 1 ) ................. 59
1. INTRODUCTION ........................................................................................................ 60
2. MATERIAL AND METHODS ........................................................................................ 62
2.1. Husbandry, Feeding Program, and Experimental Diets.................................. 62
2.2. Laboratory Analyses ........................................................................................ 64
9
2.3. Productive Performance and Egg Quality ....................................................... 65
2.4. Statistical Analysis ........................................................................................... 66
3. RESULTS .................................................................................................................. 67
3.1. Laboratory analysis.......................................................................................... 67
3.2. Productive performance ................................................................................... 67
3.3. Egg quality ....................................................................................................... 68
4. DISCUSSION ............................................................................................................. 68
4.1. Productive performance ................................................................................... 68
4.2. Egg quality ....................................................................................................... 71
5. CONCLUSIONS .......................................................................................................... 72
6. REFERENCES ............................................................................................................ 81
CHAPTER 3: EFFECT OF CRUDE PROTEIN AND FAT CONTENT OF THE
DIET ON PRODUCTIVE PERFORMANCE AND EGG QUALITY TRAI TS OF
BROWN EGG-LAYING HENS WITH DIFFERENT INITIAL BODY W EIGHT
(TRIAL 2) ...................................................................................................................... 87
1. INTRODUCTION ........................................................................................................ 88
2. MATERIALS AND METHODS ...................................................................................... 89
2.1. Husbandry, Feeding Program, and Experimental Diets.................................. 89
2.2. Analytical Evaluation of Ingredients and Feeds .............................................. 90
2.3. Productive performance and egg quality ......................................................... 91
2.4. Statistical analysis ............................................................................................ 92
3. RESULTS .................................................................................................................. 92
4. DISCUSSION ............................................................................................................. 93
5. REFERENCES .......................................................................................................... 103
10
CHAPTER 4: EFFECTS OF ENERGY CONCENTRATION OF THE D IET ON
PRODUCTIVE PERFORMANCE AND EGG QUALITY OF BROWN EGG -
LAYING HENS DIFFERING IN INITIAL BODY WEIGHT (TRIAL 3) ........... 108
1. INTRODUCTION ...................................................................................................... 109
2. MATERIALS AND METHODS .................................................................................... 110
2.1.Husbandry, Diets, and Experimental Design .................................................. 110
2.2. Laboratory Analysis ....................................................................................... 111
2.3. Productive Performance and Egg Quality ..................................................... 112
2.4. Statistical Analysis ......................................................................................... 113
3. RESULTS ................................................................................................................ 113
3.1. Productive Performance ................................................................................ 113
3.2. Egg Quality .................................................................................................... 114
4. DISCUSSION ........................................................................................................... 115
4.1. Productive Performance ................................................................................ 115
4.1.1. AMEn Concentration of the Diet .......................................................... 115
4.1.2. Initial Body Weight ............................................................................... 118
4.2. Egg Quality .................................................................................................... 119
4.2.1. AMEn Concentration of the Diet .......................................................... 119
4.2.2. Initial Body Weight ............................................................................... 121
5. REFERENCES .......................................................................................................... 122
CHAPTER 5: GENERAL DISCUSSION AND CONCLUSIONS ........................ 133
1. GENERAL DISCUSSION ............................................................................................ 134
1.1. Productive performance in egg-laying hens .................................................. 134
1.1.1. Effect of the main cereal of the diet ...................................................... 134
11
1.1.2. Effect of source, fatty acid profile, and level of supplemented fat of the
diet ....................................................................................................................... 135
1.1.3. Effect of linoleic acid of the diet ........................................................... 137
1.1.4. Effect of energy content of the diet ....................................................... 138
1.1.5. Effect of initial body weight of the hens ............................................... 141
1.2. Egg quality in brown egg-laying hens............................................................ 143
1.2.1. Effect of the main cereal of the diet ...................................................... 143
1.2.2. Effect of source, fatty acid profile, and level of supplemented fat of the
diet ....................................................................................................................... 144
1.2.3. Effect of linoleic acid of the diet ........................................................... 146
1.2.4. Effect of energy content of the diet ....................................................... 147
1.2.5. Effect of initial body weight of the hens ............................................... 149
ANNEX I: RESUMEN EN ESPAÑOL ..................................................................... 151
1. INTRODUCCIÓN ...................................................................................................... 152
2. REVISIÓN BIBLIOGRÁFICA ...................................................................................... 155
3. OBJETIVOS DE LA TESIS DOCTORAL ....................................................................... 169
EXPERIMENTO 1. EFECTOS DEL CEREAL PRINCIPAL Y EL TIPO DE GRASA EN LA DIETA
SOBRE LOS PARÁMETROS PRODUCTIVOS Y LA CALIDAD DE HUEVO EN GALLINAS
PONEDORAS RUBIAS EN EL PERIOD 22-54 SEMANAS DE VIDA ......................................... 170
1. MATERIAL Y METODOS .......................................................................................... 171
1.1. Crianza, Programa de Alimentación y Dietas Experimentales ..................... 171
1.2. Análisis de Laboratorio .................................................................................. 173
1.3. Variables Productivas y Calidad de Huevo ................................................... 174
1.4. Análisis Estadístico ........................................................................................ 175
2. RESULTADOS .......................................................................................................... 176
12
2.1. Variables Productivas .................................................................................... 176
2.2. Calidad del Huevo .......................................................................................... 177
3. DISCUSIÓN ............................................................................................................. 177
3.1. Variables Productivas .................................................................................... 177
3.2. Calidad de Huevo ........................................................................................... 179
4. CONCLUSIONES ...................................................................................................... 180
EXPERIMENTO 2. EFECTOS DEL NIVEL DE PROTEÍNA BRUTA Y EL CONTENIDO DE GRASA EN
LA DIETA SOBRE LOS PARÁMETROS PRODUCTIVOS Y LA CALIDAD DEL HUEVO EN GALLINAS
PONEDORAS RUBIAS CON DISTINTOS PESOS VIVOS ......................................................... 181
1. MATERIAL Y MÉTODOS .......................................................................................... 182
1.1. Crianza, Programa de Alimentación y Dietas Experimentales ..................... 182
1.2. Análisis de Laboratorio .................................................................................. 183
1.3. Variables Productivas y Calidad de Huevo ................................................... 184
1.4. Análisis Estadístico ........................................................................................ 185
2. RESULTADOS .......................................................................................................... 185
3. DISCUSIÓN ............................................................................................................. 186
4. CONCLUSIONES ...................................................................................................... 191
EXPERIMENTO 3. EFECTOS DE LA CONCENTRACIÓN ENERGETICA DE LA DIETA SOBRE LOS
PÁRAMETROS PRODUCTIVOS Y LA CALIDAD DE HUEVO EN GALLINAS PONEDORAS RUBIAS
CON DISTINTOS PESOS VIVOS .......................................................................................... 192
1. MATERIAL Y MÉTODOS .......................................................................................... 193
1.1. Crianza, Dietas y Diseño Experimental ......................................................... 193
1.2. Análisis de Laboratorio .................................................................................. 195
1.3. Productive Performance and Egg Quality ..................................................... 195
1.4. Statistical Analysis ......................................................................................... 196
13
2. RESULTADOS .......................................................................................................... 197
2.1. Variables Productivas .................................................................................... 197
2.2. Calidad de Huevo ........................................................................................... 198
3. DISCUSIÓN ............................................................................................................. 198
3.1. Variables Productivas .................................................................................... 198
4. CONCLUSIONES ...................................................................................................... 204
CONCLUSIONES GENERALES E IMPLICACIONES DE LA TESIS DOCTORAL ........................ 206
REFERENCES .................................................................................................................. 210

14
ABBREVIATIONS LIST
15
ABBREVIATION LIST ºC: degree Celsius; grado centígrado
*: P<0.05
**: P<0.01
***: P<0.001
%: percentage; porcentaje
AA: amino acid; aminoácido
ADFI: average daily feed intake
AMEn: nitrogen-corrected apparent metabolizable energy
Arg: arginine; arginina
AVO: acidulated vegetable oil soapstocks; oleina vegetal
BW: body weight
BWG: body weight gain
C18:2: linoleic acid; ácido linoleico
Ca: calcium; calcio
cm: centimeter; centímetro
cm2:centimeter square; centímetro cuadrado
CF: crude fiber; fibra bruta
CMD: consumo medio diario
CP: crude protein; protein bruta
Cys: cysteine, cisteina
DM: dry matter; material seca
d: day; día
EE: ether extract; extracto etéreo
EMAn: energía metabolizable aparente corregida en nitrógeno.
16
EnE: energy efficiency; eficiencia energética
et al.: and others; y colaboradores
FA: fatty acid; ácido graso
FCR: feed conversion ratio
FEDNA: Fundación Española para el Eesarrollo de la Nutrición Animal
FI: feed intake
g:gram
GE: gross energy; energía bruta
GLM: general lineal model
GMD: geometric mean diameter; diámetro geometric medio
GSD: geometric standard desviation; desviación estándart geométrica
h: hour; hora
HU: haugh unit; unidades haugh
IC: índice de conversión
Ile: isoleucine; isoleucina
IU: international unit(s); unidades internacionales
kcal: kilocalorie; kilocaloría
kg: kilogram; kilogramo
L: linear effect, efecto lineal
LNL: linoleic acid; acido linoleico
Lys: lysine, lisina
m: meter; metro
m2: square meter; metro cuadrado
mEq: miliequivalent, miliequivalentes
Met: methionine; metionina
mg: miligram; miligramo
17
mm: milimeter; milímetro
N: normal
n: number of replicates per treatment; numero de réplicas por tratamiento
nm: nanometer; nanometro
NRC: National Research Council
NS: not significant difference (P> 0.10); diferencia no significativa (P> 0,10)
NSP: nonstarch polysaccharides; polisacáridos no amiláceos
P: probability; probabilidad
P: phosphorus; fósforo
ppm: parts per million, partes por millon
PUFA: polyunsaturated fatty acid
PV: peso vivo
Q: quadratic effect, efecto cuadrático
SAS: Statistical Analysis Systems
SBO: Soy bean oil; aceite de soja
SCWL: Single Comb White Leghorn; gallinas Leghorn
SD: standard deviation
sem: semana
SEM: standard error of the mean
SFA: saturated fatty acid
SFAT: supplemental fat
Thr: threonine
Trp: tryptophan, triptófano
TSAA: total sufur amino acids; aminoácidos azufrados totales
Val: valine; valina
vs.: versus

18
µ: average; media
µm: micrometer, micrometros
wk: week
XL: extra large eggs; huevos de tamaño XL (>73 g)

Resumen
19
RESUMEN
Resumen
20
Resumen
El objetivo general de esta Tesis Doctoral fue estudiar la influencia de diversos factores
nutricionales y de manejo sobre la productividad y la calidad del huevo en gallinas
ponedoras comerciales rubias. Los factores estudiados fueron: 1) Cereal principal y tipo
de grasa en la dieta; 2) Nivel de proteína bruta y grasa en la dieta; 3) Nivel energético de
la dieta; 4) Peso vivo al inicio del período de puesta.
En el experimento 1, la influencia del cereal principal en la dieta y el tipo de grasa
suplementada en la dieta sobre los parámetros productivos y la calidad del huevo fue
estudiado en 756 gallinas rubias de la estirpe Lohmann desde la sem 22 hasta las 54 de
vida. El experimento se realizó mediante un diseño completamente al azar con 9
tratamientos ordenados factorialmente, con 3 cereales bases (maíz, trigo blando y cebada)
y 3 tipos de grasa que variaban en su contenido en ácido linoléico (aceite de soja, oleína
vegetal mezcla y manteca). Todas las dietas satisfacian las recomendaciones nutricionales
para gallinas ponedoras rubias según el NRC (1994) y FEDNA (2008). La unidad
experimental fue la jaula para todas las variables. Cada tratamiento fue replicado 4 veces,
y la unidad experimental estuvo formada por 21 gallinas alojadas en grupos de 7. Las
dietas fueron formuladas con un contenido nutritivo similar, excepto para el ácido
linoléico, que varió en función del tipo de cereal y grasa utilizado. Así, dependiendo de la
combinación de estos elementos el contenido de este ácido graso varió desde un 0.8%
(dieta trigo-manteca) a un 3.4% (dieta maíz-aceite de soja). Este rango de ácido linoléico
permitió estimar el nivel mínimo de este nutriente en el pienso que permite maximizar el
peso del huevo. Los parámetros productivos y la calidad del huevo se controlaron cada 28
días y el peso de las aves se midió individualmente al inicio y al final del experimento
con el objetivo de estudiar la variación en el peso vivo de los animales. No se observaron
interacciones entre el tipo de cereal y grasa en la dieta para ninguna de las variables

Resumen
21
productivas estudiadas. Los tratamientos experimentales no afectaron a las principales
variables productivas (porcentaje de puesta, peso del huevo y masa de huevo). Sin
embargo, la ganancia de peso fue mayor en gallinas alimentadas con maíz o trigo que las
gallinas alimentadas con cebada (243 vs. 238 vs. 202 g, respectivamente; P< 0.05). En el
mismo sentido, las gallinas alimentadas con manteca obtuvieron una mayor ganancia de
peso que las gallinas alimentadas con aceite de soja u oleína vegetal (251 vs. 221 vs. 210
g, respectivamente; P< 0.05). En cuanto a las variables estudiadas en relación con la
calidad del huevo, ninguna de las variables estudiadas se vio afectada por el tratamiento
experimental, salvo la pigmentación de la yema. Así, las gallinas alimentadas con maíz
como cereal principal obtuvieron una mayor puntuación en relación con la escala de color
que las gallinas alimentadas con trigo y con cebada (9.0 vs. 8.3 vs. 8.3, respectivamente;
P< 0.001). La pigmentación de la yema también se vio afectada por el tipo de grasa en la
dieta, así, las gallinas alimentadas con manteca obtuvieron una mayor puntuación de
color en relación con la escala de color que las gallinas alimentadas con aceite de soja u
oleína vegetal (8.9 vs. 8.5 vs. 8.2, respectivamente; P< 0.001). La influencia del
contenido en ácido linoléico respecto al peso de huevo y masa de huevo fue mayor a
medida que el contenido de dicho ácido graso se redujo en la dieta. Así, la influencia de
la dieta en los radios peso de huevo/g linoléico ingerido y masa de huevo/g linoléico
ingerido fue significativamente mayor a medida que el contenido en dicho ácido graso
disminuyo en la dieta (P< 0.001). Los resultados del ensayo indican que las gallinas
ponedoras rubias no necesitan más de un 1.0% de ácido linoléico en la dieta para
maximizar la producción y el tamaño del huevo. Además, se pudo concluir que los 3
cereales y las 3 grasas utilizadas pueden sustituirse en la dieta sin ningún perjuicio
productivo o referente a la calidad del huevo siempre que los requerimientos de los
animales sean cubiertos.
Resumen
22
En el experimento 2, la influencia del nivel de proteína bruta y el contenido de
grasa de la dieta sobre los parámetros productivos y la calidad del huevo fue estudiado en
672 gallinas ponedoras rubias de la estirpe Lohmann entre las sem 22 y 50 de vida. El
experimento fue conducido mediante un diseño completamente al azar con 8 tratamientos
ordenados factorialmente con 4 dietas y 2 pesos vivos distintos al inicio de puesta (1592
vs. 1860g). Tres de esas dietas diferían en el contenido de proteína bruta (16.5%, 17.5% y
18.5%) y tenían un contenido en grasa añadida de 1.8%. La cuarta dieta tenía el nivel
proteico más elevado (18.5%) pero fue suplementada con 3.6% de grasa añadida en vez
de 1.8%. Cada tratamiento fue replicado 4 veces y la unidad experimental consistió en 21
gallinas alojadas dentro de grupos de 7 animales en 3 jaulas contiguas. Todas las dietas
fueron isocalóricas (2750 kcal EMAn/kg) y cubrieron las recomendaciones en
aminoácidos para gallinas ponedoras rubias (Arg, Ile, Lys, Met, Thr, Trp, TSAA y Val)
según el NRC (1994) y FEDNA (2008). Los efectos de los tratamientos sobre las
variables productivas y la calidad de huevo fueron estudiados cada 28 días. La dieta no
afecto a ninguna de las variables productivas estudiadas a lo largo del período productivo.
Sin embargo, el peso inicial origino que las gallinas pesadas consumieran más (120.6 vs.
113.9 g; P< 0.001), obtuvieran un porcentaje de puesta mayor (92.5 vs. 89.8%; P< 0.01) y
un peso del huevo mayor (64.9 vs. 62.4 g; P< 0.001) que las gallinas ligeras. El peso
inicial de las gallinas no afecto al IC por kg de huevo ni a la mortalidad, sin embargo, la
ganancia de peso fue mayor (289 vs. 233 g; P< 0.01) y el IC por docena de huevos fue
mejor (1.52 vs. 1.57; P< 0.01) en las gallinas ligeras que en las gallinas pesadas. En
cuanto a la calidad del huevo, la dieta no influyó sobre ninguna de las variables
estudiadas.
Los resultados del ensayo muestran que las gallinas ponedoras rubias,
independientemente de su peso vivo al inicio de la puesta, no necesitan una cantidad de
proteína bruta superior a 16.5% para maximizar la producción, asegurando que las dietas
Resumen
23
cubren los requerimientos en AA indispensables. Asimismo, se puedo concluir que las
gallinas con un peso más elevado al inicio de puesta producen más masa de huevo que las
gallinas con un peso más bajo debido a que las primeras producen más cantidad de
huevos y más pesados. Sin embargo, ambos grupos de peso obtuvieron el mismo IC por
kg de huevo y las gallinas más livianas en peso obtuvieron un mejor IC por docena de
huevo que las pesadas.
En el experimento 3 la influencia de la concentración energética sobre los
parámetros productivos y la calidad del huevo fue estudiada en 520 gallinas ponedoras
rubias de la estirpe Hy-Line en el período 24-59 sem de vida. Se utilizaron 8 tratamientos
ordenados factorialmente con 4 dietas que variaron en el contenido energético (2650,
2750, 2850 y 2950 kcal EMAn/kg) y 2 pesos vivos distintos al inicio del período de
puesta (1733 vs. 1606g). Cada tratamiento fue replicado 5 veces y la unidad experimental
consistió en una jaula con 13 aves. Todas las dietas se diseñaron para que tuvieran una
concentración nutritiva similar por unidad energética. Las variables productivas y de
calidad de huevo se estudiaron mediante controles cada 28 días desde el inicio del
experimento. No se observaron interacciones entre el nivel energético y el peso inicial del
ave para ninguna de las variables estudiadas. Un incremento en la concentración
energética de la dieta incrementó la producción de huevos (88.8 % vs. 91.2 % vs. 92.7 %
vs. 90.5 %), masa de huevo (56.1 g/d vs. 58.1 g/d vs. 58.8 g/d vs. 58.1 g/d), y eficiencia
energética (5.42 vs. 5.39 vs. 5.38 vs. 5.58 kcal EMA/g huevo) de forma lineal y
cuadrática (P< 0.05) y afectó significativamente a la ganancia de peso (255 g vs. 300 g
vs. 325 g vs. 359 g; P<0.05) . Sin embargo, un incremento en la concentración energética
provocó un descenso lineal en el consumo de los animales (115 g vs. 114 g vs. 111 g vs.
110 g; P< 0.001) y un descenso lineal y cuadrático en el IC por kg de huevo (2.05 vs.
1.96 vs. 1.89 vs. 1.89; P< 0.01). En cuanto a la calidad del huevo, un incremento en el
contenido energético de la dieta provocó una reducción en la calidad del albumen de
Resumen
24
forma lineal en forma de reducción de Unidades Haugh (88.4 vs. 87.8 vs. 86.3 vs. 84.7;
P< 0.001), asimismo el incremento de energía redujo de forma lineal la proporción
relativa de cáscara en el huevo (9.7 vs. 9.6 vs. 9.6 vs. 9.5; P< 0.001). Sin embargo, el
incremento energético propició un incremento lineal en la pigmentación de la yema del
huevo (7.4 vs. 7.4 vs. 7.6 vs. 7.9; P< 0.001). El peso vivo al inicio de la prueba afecto a
las variables productivas y a la calidad del huevo. Así, los huevos procedentes de gallinas
pesadas al inicio de puesta tuvieron una mayor proporción de yema (25.7 % vs. 25.3 %;
P< 0.001) y menor de albumen (64.7 vs. 65.0; P< 0.01) y cáscara (9.5 vs. 9.6; P< 0.05)
respecto de los huevos procedentes de gallinas ligeras. Consecuentemente, el ratio
yema:albumen fue mayor (0.40 vs. 0.39; P< 0.001) para las gallinas pesadas. Según los
resultados del experimento se pudo concluir que las actuales gallinas ponedoras rubias
responden con incrementos en la producción y en la masa del huevo a incrementos en la
concentración energética hasta un límite que se sitúa en 2850 kcal EMAn/kg. Asimismo,
los resultados obtenidos entre los 2 grupos de peso al inicio de puesta demostraron que
las gallinas pesadas al inicio de puesta tienen un mayor consumo y producen huevos más
pesados, con el consecuente aumento de la masa del huevo respecto de gallinas más
ligeras. Sin embargo, el IC por kg de huevo fue el mismo en ambos grupos de gallinas y
el IC por docena de huevo fue mejor en las gallinas ligeras. Asimismo, la eficiencia
energética fue mejor en las gallinas ligeras.

Abstract
25
ABSTRACT
Abstract
26
Abstract The general aim of this PhD Thesis was to study the influence of different nutritional
factors and management on the productivity and egg quality of comercial Brown laying
hens. The factor studied were: 1) The effect of the main cereal and type of fat of the diet;
2) The effect of crude protein and fat content of the diet; 3) The effect of energy
concentration of the diet; 4) The effect of initial body weight of the hens at the onset of
lay period.
In experiment 1, the influence of the main cereal and type of supplemental fat in
the diet on productive performance and egg quality of the eggs was studied in 756
Lohmann brown-egg laying hens from 22 to 54 wk of age. The experiment was
conducted as a completely randomized design with 9 treatments arranged factorially with
3 cereals (dented corn, soft wheat, and barley) and 3 types of fat (soy oil, acidulated
vegetable soapstocks, and lard). Each treatment was replicated 4 times (21 hens per
replicate). All diets were formulated according to NRC (1994) and FEDNA (2008) to
have similar nutrient content except for linoleic acid that ranged from 0.8 (wheat-lard
diet) to 3.4% (corn-soy bean oil) depending on the combination of cereal and fat source
used. This approach will allow to estimate the minimum level of linoleic acid in the diets
that maximizes egg weight. Productive performance and egg quality traits were recorded
every 28 d and BW of the hens was measured individually at the beginning and at the end
of the experiment. No significant interactions between main factors were detected for any
of the variables studied. Egg production, egg weight, and egg mass were not affected by
dietary treatment. Body weight gain was higher (243 vs. 238 vs. 202 g; P<0.05) for hens
fed corn or wheat than for hens fed barley and also for hens fed lard than for hens fed soy
oil or acidulated vegetable soapstocks (251 vs. 221 vs. 210 g; P< 0.05). Egg quality was
not influenced by dietary treatment except for yolk color that was greater (9.0 vs. 8.3 vs.
Abstract
27
8.3; P< 0.001) for hens fed corn than for hens fed wheat or barley and for hens fed lard
than for hens fed soy oil or acidulated vegetable soapstocks (8.9 vs. 8.5 vs. 8.2,
respectivamente; P< 0.001). The influence of linoleic acid on egg weight and egg mass
was higher when the fatty acid was reduced in the diet. Thus, the influence of the diet in
egg weight/g linoleic acid intake and egg mass/g linolec acid intake was higher when the
amount of this fatty acid decreased in the diet (P< 0.001). It is concluded that brown egg
laying hens do not need more than 1.0% of linoleic acid in the diet (1.16 g/hen/d) to
maximize egg production and egg size. The 3 cereals and the 3 fat sources tested can
replace each other in the diet provided that the linoleic acid requirements to maximize
egg size are met.
In experiment 2, the influence of CP and fat content of the diet on performance
and egg quality traits was studied in 672 Lohmann brown egg-laying hens from 22 to 50
wk of age. The experiment was conducted as a completely randomized design with 8
treatments arranged factorially with 4 diets and 2 initial BW of the hens (1,592 vs. 1,860
g). Three of these diets differed in the CP content (16.5, 17.5, and 18.5%) and included
1.8% added fat. The fourth diet had also 18.5% CP but was supplemented with 3.6% fat
instead of 1.8% fat. Each treatment was replicated 4 times and the experimental unit
consisted of 21 hens allocated in groups of 7 in 3 adjacent cages. All diets were isocaloric
(2,750 kcal AME/kg) and met the recommendations of brown egg-laying hens for
digestible Arg, Ile, Lys, Met, Thr, Trp, TSAA, and Val. Productive performance and egg
quality were recorded by replicate every 28-d. For the entire experimental period, diet did
not affect any of the productive performance traits studied but the heavier hens had
higher ADFI (120.6 vs. 113.9g; P< 0.001), egg production (92.5 vs. 89.8%; P< 0.01), and
egg weight (64.9 vs. 62.4g; P< 0.001) than the lighter hens. Initial BW did not affect feed
conversion per kilogram of eggs or hen mortality but BW gain was higher (289 vs. 233g;
P< 0.01) and FCR per dozen of eggs was better (1.52 vs. 1.57; P< 0.01) for the lighter
Abstract
28
than for the heavier hens. None of the egg quality variables studied was affected by
dietary treatment or initial BW of the hens. It is concluded that brown egg-laying hens,
irrespective of their initial BW, do not need more than 16.5% CP to maximize egg
production provided that the diet meet the requirements for key indispensable amino
acids. Heavier hens produce more eggs that are larger than lighter hens but feed
efficiency per kilogram of eggs is not affected.
In experiment 3, the influence of AMEn concentration of the diet on productive
performance and egg quality traits was studied in 520 Hy-Line brown egg-laying hens
differing in initial BW from 24 to 59 wks of age. There were 8 treatments arranged
factorially with 4 diets varying in energy content (2,650, 2,750, 2,850, and 2,950 kcal
AMEn/kg) and 2 initial BW of the hens (1,733 vs. 1,606 g). Each treatment was
replicated 5 times (13 hens per replicate) and all diets had similar nutrient content per unit
of energy. No interactions between energy content of the diet and initial BW of the hens
were detected for any trait. An increase in energy concentration of the diet increased
(linear, P< 0.05; quadratic P< 0.05) egg production (88.8 % vs. 91.2 % vs. 92.7 % vs.
90.5 %), egg mass (56.1 g/d vs. 58.1 g/d vs. 58.8 g/d vs. 58.1 g/d), energy efficiency
(5.42 vs. 5.39 vs. 5.38 vs. 5.58 kcal AMEn/g of egg), and BW gain (255 g vs. 300 g vs.
325 g vs. 359 g; P<0.05) but decreased ADFI (115 g vs. 114 g vs. 111 g vs. 110 g; P<
linear, P< 0.001) and FCR per kg of eggs (2.05 vs. 1.96 vs. 1.89 vs. 1.89; linear, P< 0.01;
quadratic P< 0.01). An increase in energy content of the diet reduced Haugh units (88.4
vs. 87.8 vs. 86.3 vs. 84.7; P< 0.01) and the proportion of shell in the egg (9.7 vs. 9.6 vs.
9.6 vs. 9.5; P< 0.001). Feed intake (114.6 vs. 111.1 g/hen per day), AMEn intake (321 vs.
311 kcal/hen per day), egg weight (64.2 vs. 63.0 g), and egg mass (58.5 vs. 57.0 g) were
higher for the heavier than for the lighter hens (P<0.01) but FCR per kg of eggs and
energy efficiency were not affected. Eggs from the heavier hens had higher proportion of
yolk (25.7 % vs. 25.3 %; P< 0.001) and lower of albumen (64.7 vs. 65.0; P< 0.01) and
Abstract
29
shell (9.5 vs. 9.6; P< 0.05) than eggs from the lighter hens. Consequently, the yolk to
albumen ratio was higher (0.40 vs. 0.39; P< 0.001) for the heavier hens. It is concluded
that brown egg-laying hens respond with increases in egg production and egg mass, to
increases in AMEn concentration of the diet up to 2,850 kcal/kg. Heavy hens had higher
feed intake and produced heavier eggs and more egg mass than light hens. However,
energy efficiency was better for the lighter hens.

Chapter 1. Literature review and objectives
30
CHAPTER 1:
Literature review and objectives
Chapter 1. Literature review and objectives
31
1. Literature review
1.1. Introduction
Global egg production and trade have shown a remarkable and dynamic growth during
the last 40 years. From 1970 to 2009, egg production increased faster than production of
beef and veal or pig meat. In 1970 World egg production accounted for about 19,540
million tons with the 4 major producer countries being USA, Russia (URSS at this time),
Japan and China. In 2009 the production of eggs reached levels of 62,8 million tons with
China, USA, India and Japan as the leader countries (FAOSTAT, 2011). Egg production
growth between 1960 and 2007 was very fast in Asia, especially in China, medium to
slow with continuous upwards in Africa and South America and slow in Europe and
Oceania. In 2007, Asia production accounted for 38 million tons, Africa for 2.3 million
tons and South America for 3.4 million tons. Because of management and logistic
problems, relatively few eggs are traded internationally. In 2008, world exports of egg
reached a value of 4,083 million US dollars, a growth of about 17.7% as compared with
that of 2004. Major exporter countries, were The Netherlands, China, Spain and Poland.
The total importation of eggs in 2008 reached a value of 3,846 million dollars, an
increase of 15.3% as compared with that of 2004. The largest importers of eggs in 2008
were Germany, The Netherlands, France and China.
According to FAOSTAT (2011), egg consumption per person per year improved
steadily from 2000 to 2007. The global average consumption increased from 8.1 kg in
2001 to almost 8.6 kg in 2007. Egg consumption in Asia grew at a faster rate than in the
remaining areas of the world. By 2007, Asia reached a record of 8.8 kg of egg
consumption per person. Newest studies were not done but FAO data indicate that in
2010 the average yearly egg consumption in the world was above 9.2 kg per person.

Chapter 1. Literature review and objectives
32
According to MARM (2010) there were 44 million laying hens destined for egg
production in Spain in 2009. These hens were housed in a total of 1,370 registered layer
houses. Approximately, 95.7% of the birds were housed in cages, 2.4% were free range
and 1.7% were on floor. Organic production occupies only 0.1% of the census. These
numbers are expected to change in the new future because of the new Europe-Union
legislation on behalf of animal welfare. In 2004, Spain recorded the highest level of egg
production (1.13 x 10³M dozen of eggs). The highest production of eggs occurred in
Castilla-La Mancha (32%), followed by Castilla y Leon (17%), Valencia (9%), and
Cataluña (8%). Export market is very important for the Spanish egg industry. Egg
production covered local demand and allows exporting a large proportion (around 23% of
the total production in 2008 and 2009). The main destination of exports is the European
Union, with France being the first importer country (41%) followed by Germany (14%),
United Kingdom (12%), The Netherlands and Portugal (11% each) (MARM, 2010).
Between 2000 and 2009, egg consumption decreased from 17.5 to 11.3 kg per person per
year (a general decrease of about 36%). However, this decrease in egg consumption was
not linear; it suffered a fluctuation in 2004 and a sharply decrease thereafter.
The economic success of the egg industry depends on egg mass produced by each
hen during the whole lay period. This objective is influenced by the length of the laying
period but also by the number of eggs produced and the size of these eggs. Also, the
percentage of marketable eggs and the relative cost of raw materials are important factors
to be considered to reach the economic objectives. Egg loss produced from farm to
consumer because of egg handling accounts for 5 to 7% of all eggs laid (Roland, 1988).
Most of these losses are related to poor shell quality of eggs produced at the end of the
production cycle. In addition, the external and internal quality of the eggs is to be taken
into account to reduce the incidence of rejected eggs and improve selling prize. Egg rate
depends mainly on genetics but health status together with management and feeding
Chapter 1. Literature review and objectives
33
practices of pullets and hens are contributing factors. Thus, the economic success of a
laying hen operation requires a curve with a sharp, high peak of production at the start of
the laying cycle and a good persistency throughout the entire egg-laying cycle. It is
widely accepted that high peak productions are positively related with egg mass
production.
Egg size has important connotations related to the success of egg operation in
countries such as Spain in which consumers show preferences for large egg. In these
countries, under these circumstances, producers tend to increase the duration of the egg-
laying cycle because egg size increases with age of the hens. The objective of poultry
nutritionists is to formulate diets that maximize performance variables including egg
production and egg size early in the production cycle and reduce shell problems at the
end of the production cycle. In order to meet these objectives, nutritionists need to play
with level of nutrient requirements (energy concentration, crude protein and AA level),
use of raw materials (type of cereal and fat) and obtain a high uniformity and the target
body weight (BW) of the pullets at the onset of the laying cycle, to reach the optimum
performance of the hens.
Productive performance and optimal quality of the eggs produced are the two
main factors succeed in the egg industry and to meet both targets depends partially on the
good nutritional management of the birds. Thus, it is important to check effects of the
nutritional variables used in the lay period to improve productive performance on the
throughout external (percentage of unmarketable eggs: broken, dirty, shell-less eggs) and
the internal (albumen height, yolk color, and the different proportion of yolk and
albumen) quality of the eggs.
In the current research we investigated the effects of key nutritional components
or productive performance and egg quality of commercial brown egg-laying hens during
the whole laying cycle. The factors studied were: 1) The effect of main cereal and type of
Chapter 1. Literature review and objectives
34
fat in the diet, 2) The effect of crude protein level and added fat in the diet, 3) The effect
of energy level in the diet, 4) The effect of initial BW of the hens at the onset of lay
period on performance and egg quality variables.
1.2. Effect of the main cereal of the diet on hen productivity and egg quality
Cereals are rich in starch and are the most widely used ingredients as energy sources in
poultry feeds. In addition, cereals provide also part of the crude protein (CP) and AA
require by the birds. Starch utilization by poultry depends on the cereal used, because
cereals differing in the nature and the structure of their starch fraction. Moreover, starch
digestion depends on factors such as soluble cell-wall polysaccharide content, nature of
starch granule, presence of anti-nutritional factors in the grain, and the digestive capacity
of the animal (Classen, 1996). Many studies have been conducted to ascertain the
nutritive value of the different starch present in nature but the prediction of its nutritive
value and utilization by laying hens has not been elucidated yet. The most common
cereals produced in Spain and used in poultry diets are corn (Zea mays L.) wheat
(Triticum L.) and barley (Hordeum vulgare L.). Corn has less CP (7.5% vs. 10.2% vs.
9.6%) and crude fiber (2.3% vs. 2.6% vs. 4.7%) and more starch (63.3% vs. 60.2% vs.
53%), ether extract (3.6% vs. 1.6% vs. 1.8%), linoleic acid (1.81% vs. 0.64% vs. 0.71%),
and AMEn (3,280 vs. 3,100vs. 2,800 kcal/kg) than wheat or barley (Fundación Española
Desarrollo Nutrición Animal, 2010). In addition, the chemical composition and nutritive
value of corn is quite uniform compared with that of wheat and barley, but the contents
vary depending on factors such as cultivar, agronomic practices, weather conditions,
length of storage period, feed form, and type of bird (Pirgozliev et al., 2003; Gutiérrez-
Álamo et al., 2008; Frikha et al., 2011). Under commercial conditions, many egg
producers formulate diets for laying hens with a minimum of corn to ensure a high feed
intake and to maximize egg size early in the production cycle specially when the pullets
Chapter 1. Literature review and objectives
35
have a early lay stimulation. The reasons for this practice are unknown but might be
related to the more uniform nutritive value of corn and the better structure of the feed
when coarse corn is included in the diet (Frikha et al., 2009). Also, corn has more linoleic
acid (LNL) content than wheat and barley, and an increase in LNL content of the diet
might result in an improvement in egg weight, especially in young hens under hot
climate conditions in which feed intake is low (Jensen et al., 1958; Scragg et al., 1987;
Grobas et al., 1999a). On the other hand, wheat and barley contain a high and variable
amount of nonstarch polysaccharides (NSP) including arabinoxylans, and β-glucans,
which are known to increase digesta viscosity and reduce productive performance in
poultry (Lázaro et al., 2003, García et al., 2008). Thus, the level of inclusion of wheat and
barley in poultry diets depends on many factors such as, the species considered, age, and
nutrient profile, including AMEn, CP, and NSP. Several reports have compared corn,
wheat, and barley in the diet on productive performance of laying hens, broilers, and
pullets. In general, these studies suggest that wheat and barley are a good alternative to
corn in these species. In laying hens, Craig and Goodman (1993), Lázaro et al. (2003),
Liebert et al. (2005), and Safaa et al. (2009) have reported similar hen productivity when
the 3 cereals were compared and with wheat and barley diets supplemented with
exogenous enzymes. In contrast, Coon et al. (1988) compared corn and barley and
reported higher ADFI and poorer FCR in hens fed the enzyme-supplemented barley diets
than in corn fed. In broilers, Mathlouthi et al. (2002) reported similar performance when
60% of the corn was substituted by a combination of 40% wheat and 20% barley. Also,
Ruiz et al. (1987) reported similar BWG and FCR in broilers fed mash when corn was
substituted by wheat. However, Crouch et al. (1997) compared corn and two varieties of
wheat at 40% of inclusion in mash diets for broilers and found that BWG and FCR were
impaired with one of the two wheats. In pullets, Frikha et al. (2009) reported higher
BWG in pullets fed corn than in pullets fed wheat, both diets being supplemented with
Chapter 1. Literature review and objectives
36
enzymes. The reasons for these discrepancies are unknown but might be related to the use
with different enzyme complex and the estimated value in the increase of the energy.
The information available on the effects of the main cereal of the diet on egg-
quality is scarce. In general, the inclusion of barley and wheat increased the incidence of
dirty eggs compared with the inclusion of corn (Francesch et al., 1995). Similarly, Lázaro
et al. (2003) found that the substitution of corn by wheat affected the percentage of dirty
egg quality of Single Comb White Leghorn (SCWL) hens from 20 to 44 wk of age.
However, Jamroz et al. (2001) reported similar egg quality from hens fed wheat of barley
diets supplemented with enzymes. Moreover, Çiftci et al. (2003) and Safaa et al. (2009)
reported that the substitution of corn by wheat in enzyme supplemented diets did not
affect the percentage of dirty eggs in SCWL or brown egg-laying hens, respectively.
1.3. Effect of supplemented fat of the diet on hen productivity and egg quality
Fats are used in poultry to increase the energy content of the diets. The inclusion of fat in
the diet usually results in an increase in egg size. Fat inclusion resulted often in higher
energy intake, increased BW gain and egg weight (Grobas et al., 2001; Bouvarel et al.,
2010), probably because of improved palatability with less dust formation (ISA Brown,
2011). Also, supplemental fat has been shown to reduce rate of feed passage, facilitating
the contact between digesta and enzymes, improving digestibility and utilization of other
nutrients such as the lipid and carbohydrate fractions of dietary ingredients (Mateos and
Sell, 1980b, 1981).
Whitehead et al. (1993) studied the effect of supplemented fat on egg weight and
concluded that maize oil weight more compared with others sources of fat such as fish oil
(long chain polyunsaturated fatty acids (FA), coconut oil (shorter chain saturated FA) or
tallow (medium to long chain length saturated FA). Probably, readily absorbable
unsaturated FA of corn oil improves the increased egg. Grobas et al. (2001) studied the
Chapter 1. Literature review and objectives
37
effect of 4 different sources of supplemented fat on egg weight and reported that eggs
were heavier when hens were fed diets supplemented with soy oil than when
supplemented with linseed oil, olive oil, or tallow. On the other hand, supplemental fat
might reduce egg shell quality, especially in old hens. Atteh and Leeson (1983, 1984,
1985) studied the effect of FA profile on performance and mineral metabolism of egg-
laying hens and broilers and reported that fat and some minerals can interfere together,
leading to the formation of insoluble soaps responsible of the decrease in absorption of
both FA and minerals. Furthermore, they reported that soap formation was higher with
saturated (palmitic and stearic acids) that with unsaturated FA and that an increase in the
Ca content of the diet increased of soap formation.
Many studies have shown that a reduction in supplemental fat (SFAT)
significantly decrease egg size (Keshavarz and Nakajima, 1995; Grobas et al., 1999a,b;
Bohnsack et al., 2002; Sohail et al., 2003). Grobas et al. (2001) reported that SFAT
improved egg weight and egg mass output in both SCWL hens and brown egg-laying
hens throughout the production cycle. The same authors, Grobas et al. (1999b) compared
isonutritive diets for brown egg-laying hens differing in fat content (0 and 4 %) from 22
to 65 wk of age and observed that SFAT improved productive performance and egg size
but that FCR was not affected. In this research, the improvement in egg rate observed
occurred from 38 to 61 wk of age whereas the beneficial effects on egg weight were more
noticeable from 22 to 57 wk of age. Whitehead (1981) showed that supplementation of
the diets with 4 or 30 g fat/kg significantly increased egg weight. Whitehead et al. (1993)
compared 5 inclusion levels of fat (0, 10, 20, 40, and 60 g/kg diet) and concluded that,
with the exception of fish oil, which hindered productive performance when included at
the level of 20 g/kg, maize oil, tallow, and coconut oil perform well till 40 g/kg of fat
inclusion. Furthermore, Grobas et al. (1999b) showed that supplementation of the diet
with 40 g fat/kg increased egg weight as compared with a non supplemented diet.

Chapter 1. Literature review and objectives
38
However, the authors showed that further increases from 5 to 10% of fat supplementation
did not have any positive effect on egg weight (Grobas et al., 2001).
Added fat increased both yolk and albumen weights, but in some researches the
improvement was proportionally greater for the albumen than for the yolk (Grobas et al.,
1999b). Whitehead (1995) hypothesized that the beneficial effect of SFAT on albumen
weight was due to the influence of certain unsaturated FA on the production of oestrogen
which is the main responsible for albumen secretion
Regarding egg quality traits, Grobas et al. (1999a) observed that the increase in
egg weight with SFAT was accompanied by a similar increase (3.5%) in yolk and
albumen weights. The mechanism by which SFAT increases egg size is uncertain.
Whitehead et al. (1991) suggested that SFAT increased yolk weight by stimulating lipid
deposition and albumen weight by stimulating oestrogen secretion which controls protein
synthesis in the oviduct. Parsons et al. (1993) reported that a reduction in SFAT from 6 to
2% of the diet reduced the proportion of large and above eggs in SCWL. Same results
have been reported by Bohnsack et al. (2002) with similar type of diets. Haugh units were
not affected by SFAT (Usayran et al., 2001; Grobas et al., 2001).
Previous research has shown that SFAT exerts a favorable effect on egg weight
beyond that attributable to an increase in LNL content of the diet (Shannon and
Whitehead, 1974; Sell et al., 1987; Keshavarz, 1995; Grobas et al., 1999a).
1.4. Effect of linoleic acid of the diet on hen productivity and egg quality
The effect and requirement of LNL to maximize hen productivity and egg size is subject
of debate. Under commercial conditions, many guides for feeding laying hens (H& N
International, 2008; Lohmann, 2010) recommend increasing the level of LNL in the diet
to at least 1.8% to maximize egg size. In contrast, Shannon and Whitehead (1974) and
Whitehead (1984) recommended 1.0% LNL in the diet whereas Scragg et al. (1987)
Chapter 1. Literature review and objectives
39
recommended up to 2% dietary LNL to increase egg size in brown-egg laying hens.
Ribeiro et al. (2997) reported higher egg weight in broiler breeder hens fed 1.90 % LNL
diets than in hens fed 1.50 % LNL diets. In all these studies, other productive variables
studied, such as egg production, egg mass, and FI, were not affected by LNL content of
the diet. Grobas et al.(1999b) studying the effect of LNL level of brown egg-laying from
22 to 65 wk of age reported that a reduction from 1.65 to 1.15% in the level of LNL did
not affect performance variables. These authors concluded that the LNL requirement of
brown laying hens for maximal productivity from 22 to 65 wk of age is not greater than
1.15 % of the diet. In fact, Grobas et al. (1999c) reported that 0.79 % LNL tended to
reduce egg weight with respect to 1.03 or 2.23 % LNL in brown hens from 20 to 32 wk of
age but hen-day production, egg mass, FI, FCR, and BW were not affected by LNL.
In respect of egg quality traits, Grobas et al. (1999c) reported that LNL levels
ranged from 0.79 to 2.73% in diets for brown egg-laying hens did not affect the
percentage of marketable eggs and the percentage of broken and dirty eggs, Haugh units,
or the proportion of egg components. March and McMillan (1990) and Whitehead et al.
(1993) indicated that LNL supplementation to diets deficient in this essential FA
increased yolk weight, probably through an improvement in the mechanism by which
lipoproteins are synthesized or taken up by the developing ova.
1.5. Effect of protein and aminoacids content of the diet on hen productivity and
egg quality
The ideal protein can be defined as the exact AA balance, with no deficiencies or excess,
required for maintenance and production. It maximizes the effective use of dietary
protein and can substantially reduce production costs, increase farm profitability and
minimize nitrogen excretion. The CP level and level of AA have an important role in the
egg size. Thus, the daily requirements of an egg-laying hen are 2-4 g for maintenance
Chapter 1. Literature review and objectives
40
and 10-13 g for egg production. In the peak period, the hens needs at a least of 17 g of
balance CP to express the maximal genetic potential (Summers, 1986). Diets for laying
hens are formulated to meet the requirements for those indispensable AA that may limit
egg production, namely Lys, Met, Thr, and TSAA. According to NRC (1994) diets based
on corn and soybean meal with 15.0% CP can satisty the AA requirements of brown egg-
laying hens consuming 110g of feed per day. However, several commercial guidelines
for laying hens (Lohmann, 2010; ISA Brown, 2011) recommend CP levels varying from
17.4 to 18.2%.
Is accepted that egg size increased with increases in CP (Hawes and Kling, 1993;
Hussein et al., 1996; Bouvarel et al., 2010), especially at the onset of lay period (Parsons
et al., 1993) whereas others (Summers and Leeson, 1983) reported no benefits on egg
production and egg weight with dietary CP above NRC (1994) requirement (16.5%).
Keshavarz and Nakajima (1995) reported that the increased in egg weight with the
increase of CP was due to an increase in albumen proportion. In contrast, after peaking
the hens tend to overconsume and increased the fat proportion in the body (Proudfoot et
al., 1988). Thus, is a good practice to reduce the percentage of CP in the diet throughout
the lay period to improve the efficiency (Harms, 1986). Summers (1986) reported at the
end of the lay period an extra energetic cost in oxidation process to eliminate the excess
of nitrogen, producing liquid faeces, extre large eggs and poor egg quality. However,
some authors (Pilbrow and Morris, 1974; Wethli and Morris, 1978; Huyghebaert et al.,
1991; Joly, 1995) recommended maintain the CP level at the end of the lay period
according to the poor efficiency in the use of AA by old hens than in young hens.
Ballam (1985) reported that the AA requirements were higher to optimize the egg
weight than to optimize the egg production. This author estimated a 10% increase in Met
and Lys to improve the egg weight without any effect on egg production. Also, Summers
et al. (1991) reported that a deficiency in CP level in the diet affected more in the egg
Chapter 1. Literature review and objectives
41
size than in egg production. However, Morris and Gous (1988) showed in disagreement
because of the different coefficient of variation of both variables, thus, the coefficient of
variation for egg production and egg weight were 0.20 and 0.10 respectively. Therefore,
low difference in egg weight could be statistically different but this effect could not be
showed in egg production. These authors in a review of the CP and AA requirements in
laying hens reported similar reductions in egg weight and egg production with a
reduction of 10% in the level of CP in the diet, but, if the reduction is more severe the
reduction is higher in egg production than egg weight.
Schutte et al. (1994) reviewed a serie of experiment about TSAA and Met
requirements. Thus, Roland et al. (1992) recommended high levels of TSSA at the
beginning of the lay period whereas Summers and Leeson (1993) and Klien and Hawes
(1990) did not observed any improve on the performance. Lys is the second limitant AA
in practical feeds (March and Biely, 1963; Sell and Hodgson, 1966). Thus, Joly (1995)
reported that a deficient amount of lys in the diet decreased egg mass (reducing a 65% of
egg production and a 35% in egg weight). Moreover, Nathanael and Sell (1980) reported
that egg weight increased quadratically with the increase of lys level. In contrast, Harms
and Ivey (1993) and Prochaska et al. (1996) did not dettect any effect on performance
with increases in lys level. Is possible that in the research of Nathanael and Sell (1980)
other AA was limitant.
Egg quality including percentage of dirty eggs, albumen height, and eggshell
traits are affected by CP levels. Thus, Fariborz et a. (2007) compared isoenergetic diets
containing 16.3 or 17.8% CP and reported that albumen height, shell thickness, and shell
strength were not affected by the CP content of the diet. However, Hammershoj and
Kjaer (1999) reported that Haugh units (HU) declined as the level of CP of the diet
increased from 13.7% to 17.9%
Chapter 1. Literature review and objectives
42
1.6. Effect of energy content of the diet on hen productivity and egg quality
The analyze of energy balance is the usually form to calculate the amount of FI and the
animal production (De Blas, 1991). This author, in a series of researches, estimated 107,8
kcal AME/kg0,75 for maintenance energy requirements (from 90 to 120 kcal/kg0,75) and
8,39 kcal AME/g for increases of BW and 1,94-2,25 kcal AME/g for production energy
requirements. Thus, a egg-laying hen with a BW of 2.0 kg, with a BWG of 0.8 g/d with a
egg mass of 58 g/d, needs 300-320 kcal of AME per day. Hens eat to satisfy their energy
requirements and therefore an increase in the energy content of the diet should decrease
ADFI proportionally (Hill et al., 1956). Bouvarel et al. (2010) reviewed a series of
experiments conducted in laying hens during the last 20 years and reported that as an
average, a 10% increase in AMEn content of the diet reduced FI by only 5.5%. Changes
in energy concentration of the diet have resulted in contrasting results in respect to
productive performance (Harms et al., 2000). In laying hens, Grobas et al. (1999c)
reported that increasing the AMEn content of the diet from 2,680 to 2,810 kcal/kg (a
4.8% increase) decreased feed intake by the same proportion (a 5.0% decrease) but that
egg production and egg mass were not affected. Similarly, Peguri et al. (1991) reported a
5% decrease in FI but similar egg production when the AMEn of the diet was increased
from 2,700 to 2,910 kcal/kg (a 8% increase). In contrast, Joly and Bougon (1997)
reported in brown egg-laying hens from 19 to 68 wk of age a 1.3% increase in egg
production and a 4.5% increase in egg mass as the energy content of the diet increased
from 2,200 to 2,700 kcal AMEn/kg.
Most of published trials about the effect of energy level in the diet reported an
improve in egg weight with the increase in the energy concentration of the diet (De
Groote, 1972; Walker et al., 1991). The hens tend to maintain its energy intake modifying
the FI (Leeson et al., 1973; Newcombe and Summers, 1985), overconsuming energy in

Chapter 1. Literature review and objectives
43
high energy diets (Morris, 1968; De Groote, 1972; Walker et al., 1991). Thus, the excess
of nutrients improve the egg weight (De Groote, 1972; McDonald, 1984; Leclerq, 1986;
Walker y col., 1991). According to these authors the egg weight improved from 0.10 to
0.20% per each 100 Kcal. Bouvarel et al. (2010) analyzed data from 11 experiments
conducted for the last 20 years and reported that egg weight increased 0.96 g per each
100 kcal of increase in dietary AMEn. The reasons for the discrepancies among authors
in relation to the effects of an increase in energy content of the diet on egg weight are not
apparent but might be related with the level of fat and the LNL content of the control diet.
The effect of energy levels on egg production showed different results, thus, while
Mathlouthi et al. (2002) reported in SCWL hens that egg production increased as the
AMEn of the diet increased from 2,650 to 2,750 kcal/kg, Grobas et al., (1999c) in brown
hens fed diets varying from 2,680 to 2,810 kcal AMEn/kg, Harms et al. (2000) in brown-
and SCWL hens fed diets varying in AMEn from 2,500 to 3,100 kcal/kg , and Jalal et al.
(2006, 2007) in SCWL hens fed diets varying from 2,800 to 2,900 kcal AMEn/kg did not
detect any significant difference in egg production with changes in the energy content of
the diet. In commercial flocks, is a common practice increasing the energy concentration
of the diet at the onset of lay period, especially, when the pullets have not a homogeneous
BW or when the pullets have a low BW at the beginning of lay period. Thus, some
authors reported that in hot climate like Spain, the increase of energy concentration of the
diet improve the performance especially in light hens (Kling and Hawes, 1990; Daghir,
1995).
The reasons for the discrepancies among authors in respect to the variation in egg
quality values with increases in AMEn of the diet are not apparent but might be related
with the different use of basal diets and fats. Grobas et al. (1999a) reported that the
increase in energy concentration of the diet did not affect the percentage of dirty, broken,
or shell less throughout the laying period. Some authors reported effects with energy
Chapter 1. Literature review and objectives
44
increases on albumen quality. Zimmermann and Andrews (1987) and Junqueira et al.
(2006) reported that the increase in energy concentration of the diet did not affect the HU.
However, Wu et al. (2005) reported a decrease in HU when the AMEn of the diets was
increased from 2,720 to 2,960 kcal/kg. The reasons for the discrepancies among authors
in respect to the variation in HU values with increases in AMEn of the diet are not
apparent. Xanthophylls, the main pigment source responsible for egg yolk color, are
highly soluble in fat. Gunawardana et al. (2008) reported higher yolk pigmentation in
SCWL hens fed a diet with 5.0% added fat than in hens fed a control diet without any
added fat. Also, Lázaro et al. (2003) reported higher yolk pigmentation in SCWL hens
fed high AMEn diets. Also, when fat is used to increase the energy concentration of the
diet the proportion of shell in the egg might be affected. Junqueira et al. (2006) reported a
linear decrease in egg shell proportion as the AMEn increased from 2,850 to 3,050
kcal/kg in brown egg-laying hens from 76 to 84 wk of age. However, Gunawardana et al.
(2008) did not find any effect of energy content of the diet on egg shell proportion in
SCWL fed diets varying in AMEn content from 2,750 to 3,050 kcal/kg.
1.7. Effect of initial body weight at the onset of lay on hen productivity and egg
quality
Spanish consumers have a preference for heavy eggs for which they are willing to pay an
extra price. In consequence, egg producers need to obtain a high percentage of large and
extra large eggs. The amount of large eggs is a challenge for the first part of the laying
cycle. Thus, increase the percentage of large eggs early in the lay production cycle,
increase feed intake and BW of pullets and avoid poor uniformity of the flock at the
beginning of the egg production cycle, especially under hot weather conditions is a
challenge (Frikha et al., 2009).
Chapter 1. Literature review and objectives
45
The information available about the effects of initial body weight at the onset of
lay period in brown hens on productive performance and egg quality is very scarce. Body
weight at the onset of egg production is a major factor influencing hen productivity. Egg
weight throughout the production cycle is largely determined by the initial BW of the hen
(Harms et al., 1982; Leeson and Summers, 1987). Heavier hens at the onset of the laying
period consumed more feed and produced bigger eggs throughout the egg-cycle than
lighter hens (Summers and Leeson, 1983; El Zubeir and Mohammed, 1993). Bish et al.
(1985) reported that heavy SCWL hens (1,377 g) produced heavier eggs than medium
(1,256 g) and light (1,131 g). In addition, heavier hens produced more eggs but had
similar FCR per kg of eggs than lighter hens, confirming the results of Keshavarz (1995).
This author, reported a 1.4 g difference in egg weight between light (1,151 g) and heavy
(1,333 g) SCWL hens from 18 to 62 wk of age.
The information available about the effects of initial body weight on egg quality is
very limited. In general, is accepted that eggs from the heavy hens are heavier than light
hens. Also, heavy hens had higher proportion of yolk and lower of albumen than eggs
from the light hens. Probably, heavy hens produce heavier yolks than lighter hens,
because of their higher feed intake that results in eggs with higher proportion of yolk
(Leeson and Summers, 2005).
Chapter 1. Literature review and objectives
46
2. Objectives
The general aim of this Doctoral Thesis was to study the influence of nutritional factors
that might affect the productivity and egg quality of commercial brown laying hens.
Thus, to reach these goals three trials were carried out in the period 2009-2011 under
commercial management conditions. The effects of type of cereal and fat (trial 1), crude
protein level and initial body weight of the hen (trial 2) and energy level and initial body
weight of the hen (trial 3) were carried out. Also, the second objective was study the
influence of management, and nutritional factor and the use of some raw material
usefully in the nutrition of the hens conducing to a reduction in productive cost.
In experiment 1, a study was carried out from 22 to 54 wk of age in 756 brown
egg-laying hens (Lohmann) to study the effect of 3 main cereals (Corn, Wheat, and
Barley), and 3 types of fat (Soy oil, Acidulated Soapstocks, and Lard) in the diet on
productive performance and egg quality. As a result of the interaction between cereal and
fat used the effect of different levels of linoleic acid was obtained and its effects were
measured. (Chapter 2).
In experiment 2, a study was carried out to study the effect of 3 protein levels
(18.5%, 17.5%, and 16.5% of CP) and 2 levels of added fat (3.6% and 1.8%) on
performance and egg quality of brown egg-laying hens (Lohmann). The design was
carried out with 3 diets that differing in the level of CP (18.5%, 17.5%, and 16.5%) with
only 1.8% of added fat, and a fourth diet contained 18.5% CP but 3.6% of added fat. This
model was carried out in 2 groups of hens (heavy and light) differing in BW respect to
the target value (Lohmann guide at the age of starting experiment). (Chapter 3)
In experiment 3, a study was conducted to study the effect of 4 energy levels (2,950,
2,850, 2,750, and 2,650 kcal AMEn/kg) in 2 groups of Hy Line brown hens (heavy and
light) differing in BW respect to the target value (Hy Line guide at the age of starting

Chapter 1. Literature review and objectives
47
experiment). The diets was isonutritive per kcal. Productive performance and egg quality
was measured throughout lay period from 22 to 59 wk of age. (Chapter 4).
3. References
Atteh, J. O., S. Leeson, and R. J. Julian. 1983. Effects of dietary levels and types of fat on
performance and mineral metabolism of broiler chicks. Poult. Sci. 62:2403-2411.
Atteh, J. O., and S. Leeson. 1984. Effects of dietary saturated or unsaturated fatty acids
and calcium levels on performance and mineral metabolism of broiler chicks.
Poult. Sci. 63:2252-2260.
Atteh, J. O., and S. Leeson. 1985. Response of laying hens to dietary saturated and
unsaturated fatty acids in the presence of varying dietary calcium levels. Poult.
Sci. 64:520-528.
Ballam, G. C. 1985. Integrating nutrition and management to affect egg size. Poul.
Tribune. 91:40-44.
Bish, C. L., Beane, W. L., Rugzler, P. L. and Cherry, J. A. 1985. Body weight influence
on egg production. Poult. Sci. 64:2259-2262.
Bohnsack, C. R., R. H. Harms, W. D. Merkel, and G. B. Russell. 2002. Performance of
commercial layers when fed diets with four levels of corn oil or poultry fat. J.
Appl. Poult. Res. 11:68-76.
Bouvarel, I., Y. Nys, M. Panheleux, and P. Lescoat. 2010. Comment l’alimentation des
poules influence la qualité des oeufs. INRA Prod. Anim. 23:167-182.
Çiftci, I., E. Yenice, and H. Eleroglu. 2003. Use of triticale alone and in combination with
wheat or maize: effects of diet type and enzyme supplementation on hen
Chapter 1. Literature review and objectives
48
performance, egg quality, organ weights, intestinal viscosity and digestive system
characteristics. Anim. Feed Sci. Technol. 105:149–161.
Classen H. L. 1996. Cereal grain starch and exogenous enzymes in poultry diets. Anim.
Feed Sci. Technol. 62:21-27.
Coon, C. N., I. Obi, and M. L. Hamre. 1988. Use of barley in laying hens diets. Poult.
Sci. 67:1306-1313.
Craig, L.W. and T. Goodman. 1993. Utilization of feed enzymes in laying hen rations. J.
Appl. Poult. Res. 2:68-74.
Crouch, A. N., J. L. Grimes, P. R. Ferket, and L. N. Thomas. 1997. Enzyme
supplementation to enhance wheat utilization in starter diets for broilers and
turkeys. J. Appl. Poult. Res. 6:147-154.
Daghir, N. J. 1995. Replacement pullet and layer feeding and management in hot climate.
Poultry Production in Hot Climates. Eds.: Daghir, N.J. CAB International,
Cambridge. UK. pp.: 219-253
De Blas, C. 1991. Necesidades energéticas de las gallinas ponedoras. Nutrición y
alimentación de gallinas ponedoras. Eds.: De Blas, C. y Mateos, G.G. MAPA.
Madrid. AEDOS. Barcelona. Mundi-Prensa. Madrid. pp.:145-159.
De Groote, G. 1972. A marginal income, and cost analysis of the effect of nutrient
density on the performance of white leghorn hens in battery cages. Br. Poult.
Sci.13:503-520.
El Zubeir, E.A., and O.A. Mohammed. 1993. Dietary protein and energy effects on
reproductive characteristics of commercial egg type pullets reared in arid hot
climate. Anim. Feed Sci. Technol. 41:161-165.

Chapter 1. Literature review and objectives
49
FAOSTAT. 2011. Food and Agriculture Organization, production and trade.
faostat.fao.org. Visited July 2011.
Fariborz, K., M. Faraji, and S. K. Dehkordi. 2007. Effects of reduced-protein diets at
constant total sulfur amino acids: lysine ratio on pullet development and
subsequent laying hen performance. Am. J. Anim. Vet. Sci. 2:89-92.
Frikha, M., H. M. Safaa, M. P. Serrano, X. Arbe, and G. G. Mateos. 2009. Influence of
the main cereal and feed form of the diet on performance and digestive tract of
brown-egg laying pullets. Poult. Sci. 88:994–1002.
Frikha, M., H. M. Safaa, M. P. Serrano, E. Jiménez-Moreno, and G. G. Mateos. 2011.
Influence of the main cereal of the diet and particle size of the cereal on
peroductive performance and digestive traits of brown-egg laying pullets. Anim.
Feed. Sci. Technol. 164:106-115.
Francesch, M., A.M. Pérez-Vendrell, E. Esteve-García, and J. Brufau. (1995). Enzyme
supplementation of a barley and sunflower-based diet on laying hen performance.
J. Appl. Poult. Res. 4:32-40.
Fundación Española Desarrollo Nutrición Animal. 2010. Normas FEDNA para la
Formulación de Piensos Compuestos. C. de Blas, G. G. Mateos, and P. G.
Rebollar, ed. Fund. Esp. Desarro. Nutr. Anim., Madrid, Spain.
García, M., R. Lázaro, M. A. Latorre, M. I. Gracia, and G. G. Mateos 2008. Influence of
enzyme supplementation and heat processing of barley on digestive traits and
productive performance of broilers. Poult. Sci. 87:940-948.
Chapter 1. Literature review and objectives
50
Grobas, S., G. G. Mateos, and J. Mendez. 1999a. Influence of dietary linoleic acid on
productive and egg weight of eggs and egg components in young brown hens. J.
Appl. Poult. Res. 8:177-184.
Grobas, S., J. Mendez, C. De Blas, and G. G. Mateos. 1999b. Influence of dietary energy,
supplemental fat and linoleic acid concentration on performance of laying hens at
two ages. Br. Poult. Sci. 40:681-687.
Grobas, S., J. Mendez, C. De Blas, and G. G. Mateos. 1999c. Laying hen productivity as
affected by energy, supplemental fat, and linoleic acid concentration of the diet.
Poult. Sci. 78:1542-1551.
Grobas, S., J. Méndez, R. Lázaro, C. de Blas, and G. G. Mateos. 2001. Influence of
source and percentage of fat added to diet on performance on fatty acid
composition of egg yolks of two strains of laying hens. Poult. Sci. 80:1171-1179.
Gunawardana, P., D. A. Roland Sr., and M.M. Bryant. 2008. Effect of energy and protein
on performance, egg components, egg solids, egg quality, and profits in molted
Hy-line W-36 hens. J. Appl. Poult. Res. 17:432-439.
Gutiérrez-Álamo, A., P. Pérez de Ayala, M. W. A. Verstegen, L.A. Den Hartog, and M. J.
Villamide. 2008. Variability in wheat: factors affecting its nutritional value.
World’s Poult. Sci. J. 64:20–39.
H & N International. 2008. Brown Nick Management Guide. H & N International,
Cuxhaven, Germany.
Hammershoj, M. and J. B. Kjaer. 1999. Phase feeding for laying hens: effect of protein
and essential amino acids on egg quality and production. Acta Agric. Scand., Sect.
A, Animal Sci. 49:31-41.
Chapter 1. Literature review and objectives
51
Harms, R. H., P. T. Costa, and R. D. Miles. 1982. Daily feed intake and performance of
laying hens grouped according to their body weight. Poult. Sci. 61: 1021-1024.
Harms, R. H. 1986. Should phase feeding be used for laying hens?. Feedstuffs 58:18.
Harms, R. H. and Ivey, F. J. 1993. Performance of commercial laying hens fed various
supplemental amino acids in a corn-soybean meal diet. J. Appl. Poult. Res. 2: 273-
282.
Harms, R.H., G. B. Russell, and D. R. Sloan. 2000. Performance of four strains of
commercial layers with major changes in dietary energy. J. Appl. Poult. Res.
9:535-541.
Hawes, R. O. and Kling, L. J. 1993. The efficacy of using prelay and early-lay rations
for brown-egg pullets. Poul. Sci. 72:1641-1649.
Hill, F. W., D. L. Anderson, and L. M. Dansky. 1956. Studies of the energy requirements
of chickens 3. The effect of dietary energy level on the rate and gross efficiency of
egg production. Poult. Sci. 35:54-59.
Hussein, A. S., Cantor, A. H., Pescatore, A. J. and Johnson, T. H. 1996. Effect of dietary
protein and energy levels on pullet development. Poult. Sci. 75:973-978.
Huyghebaert, G., De Groote, G., Butler, E. A. and Morris, T. R. 1991. Optimun
isoleucine requirement of laying hens and the effect of age. Br. Poult. Sci. 32:
471-481.
Isa Brown. 2011. Nutrition Management Guide. Institut de Selection Animale. B.V,
Boxmeer, The Netherlands.

Chapter 1. Literature review and objectives
52
Jalal, M.A., S. E. Scheideler, and D. Marx. 2006. Effect of bird cage space and dietary
matabolizable energy level on production parameters in laying hens. Poult. Sci.
8:5306-5311.
Jalal, M.A., S. E. Scheideler, and E. M. Pierson. 2007. Strain response of laying hen to
varying dietary energy levels with and without avizyme supplementation. J. Appl.
Poult. Res. 16: 289-295.
Jamroz, D., J. Skokupinska, J. Orda, A. Wiliczkiewicz, and A. M. Klunter. 2001. Use of
wheat, barley or triticale in feed for laying hens supplemented with carbohydrates
derived from Trichoderma longibrachiatum. J. Appl. Anim. Res. 19:255-263.
Jensen, L. S., J. B. Allred, R. E. Fry, and J. McGinnis. 1958. Evidence for an unidentified
factor necessary for maximum egg weight in chickens. J.Nutri. 65:219-223.
Joly, P. (1995) Puesta al día de las necesidades de aminoácidos de las gallinas ponedoras.
XXXII Symposium de avicultura. Sección española de la Asociación Mundial de
Avicultura Científica (WPSA). Barcelona. Spain. pp.: 67-81.
Joly, P., and M. Bougon. 1997. Influence du niveau énergétique sur les performances des
pondeuses à oeufs roux et évolution de l´ingéré en fonction de l`âge. 2ême
Journée de la Recherche Avicole. Vol. 2:115-120.
Junqueira, O.M., A. C. de Laurentiz, R. da Silva Filardi, E. A. Rodrigues, and E. M.
Casartelli. 2006. Effects of energy and protein levels on egg quality and
performance of laying hens at early second production cycle. J. Appl. Poult. Res.
15:110-115.
Chapter 1. Literature review and objectives
53
Keshavarz, K., and S. Nakajima. 1995. The effect of dietary manipulations of energy,
protein, and fat during the growing and laying periods on early egg weight and
egg components. Poult. Sci. 74:50-61.
Keshavarz, K. 1995. Further investigations on the effect of dietary manipulations of
nutrients on early egg weight. Poult. Sci. 74:62-74.
Kling, L.J. and Hawes, R. O. 1990. Effect of fat, protein, and methionine concentrations
on egg size and production in early matured brown-egg-type pullets. Poult. Sci.
69:1943-1949.
Lázaro, R., M. García, M. J. Araníbar, and G.G. Mateos. 2003. Effect of enzyme
addition to wheat-, barley- and rye-based diets on nutrient digestibility and
performance of laying hens. Br. Poult. Sci. 44:256-265.
Leeson, S., Lewis, D. and Shrimpton, D. H. 1973. Multiple linear regression equations
for the prediction of food intake in the laying fowl. Br. Poult. Sci. 14: 595-608.
Leeson, S., and J. D. Summers. 1987. Effect of immature body weight on laying
performance. Poult. Sci. 66:1924-1928.
Leeson, S., and J. D. Summers. 2005. Comercial Poultry Nutrition, 3rd Edition.
Nottingham University Press. Nottingham, UK.
Liebert, F., J. K. Htoo, and A. Sünder. 2005. Performance and nutrient utilization of
laying hens fed low-phosphorus corn-soybean diets supplemented with microbial
phytase. Poult. Sci. 84:1576-1583.
Lohmann. 2010. Management Guide for Lohmann Brown-Classic. Lohmann Tierzucht.
GMBH. Cuxhaven, Germany.
Chapter 1. Literature review and objectives
54
March, B. E. and Biely, J. 1963. Control of egg size in chickens through dietary amino
acid balance. Nature. 200:702-703.
March, B. E. and McMillan, C. 1990. Linoleic acid as a mediator of egg size. Poult. Sci.
69:634-639.
MARM, 2010. Ministerio de Medio Ambiente y Medio Rural y Marino. El sector de la
avicultura de puesta en cifras. Principales indicadores económicos en 2009.
Subdirección general de productos ganaderos, Madrid, Spain.
Mateos, G. G. and J. L. Sell. 1980b. Influence of graded levels of fat on utilization of
pure carbohydrate by the laying hen. J. Nutr. 110:1894-903.
Mateos, G. G. and. J. L. Sell. 1981. Nature of the extrametabolic effect of supplemental
fat used in semipurified diets for laying hens. Poult. Sci. 60:1925-1930.
Mathlouthi, N., M. Larbier, M. A. Mohamed, and M. Lessire. 2002. Performance of
laying hens fed wheat, wheat-barley or wheat-barley-wheat bran based diets
supplemented with xylanase. Can. J. Anim. Sci. 82:193-199.
Morris, T. R. 1968. The effect of dietary energy level on the voluntary calorie intake of
laying hens. Br. Poul. Sci. 9:285-295.
Morris, T. R. and Gous, R. M. 1988. Partitioning of the response to protein between egg
number and egg weight. Br. Poul. Sci. 29:93-99.
Nathanael, A. S. and Sell, J. L. (1980) Quantitative measurements of the lysine
requirement of the laying hen. Poult. Sci. 59:594-597.

Chapter 1. Literature review and objectives
55
Newcombe, M. and Summers J. D. 1985. Effects on increasing cellulose in diets fed as
crumble or mash on the food intake and weight gains of broilers and Leghorn
chicks. Br. Poult. Sci. 26:35-42.
NRC. 1994. Nutrient Requirements of Poultry. 9th ed. Natl. Acad. Press, Washington,
DC.
Parsons, C. M., Koelkebeck, K. W., Zhang, Y., Wang, X. and Leeper, W. 1993. Effect of
dietary protein and added fat levels on performance of young laying hens. J. Appl.
Anim. Res. 2:214-220.
Peguri, A., and C. Coon. 1991. Effect of temperature and dietary energy on layer
performance. Poult. Sci. 70:126-138.
Pilbrow, P. W. and Morris, T. R. 1974. Comparison of lysine requirements amongst eight
stocks of laying fowl. Br. Poult. Sci. 15:51-73.
Pirgozliev, V. R., C. L. Birch, S. P. Rose, P. S. Kettlewell, and M. R. Bedford. 2003.
Chemical composition and the nutritive quality of different wheat cultivars for
broiler chickens. Br. Poult. Sci. 44:464–475.
Prochaska, J. F., Carey, J. B. and Shafer, D. J. 1996. The effect of L-lysine intake on egg
component yield and composition in laying hens. Poult. Sci. 75:1268-1277.
Proudfoot, F.G., Hulan, H. W. and McRae, K. B. 1988. Performance comparisons of
phased protein dietary regimens fed to commercial Leghorns during the laying
period. Poult. Sci. 67:1447-1454.
Ribeiro, B.R.C., L.J.C. Lara, N.C. Baiao, C.A.A. Lopez, M.A. Fiuza, S.V. Conçado, and
G.M.M. Silva. 2007. Effect of linoleic acid level in the diet on the weight,
Chapter 1. Literature review and objectives
56
composition and eclodibility of broiler breeders eggs. Arq. Bras. Med. Vet.
Zootec. 59: 789-796.
Ruiz, N., J. E. Marion, R. D. Miles, and R. B. Barnett. 1987. Nutritive value of new
cultivars of triticale and wheat for broiler chick diets. Poult. Sci. 66:90–97.
Roland, D. A., Kao, D. K., Bryant, M. M. and Self, J. (1992) Econometric nutrition:
Maximizing profits in commercial Leghorn by optimizing feeding method, total
sulfur amino acid intake and environmental temperature. Degussa Technical
Symposium. Degussa Corp., Indianapolis, IN. pp.:47-57
Roland, D. A., Sr. 1988. Research note: eggshell problems: Estimates of incidence and
economic impact. Poult. Sci. 67:1801-1803.
Safaa, H. M., E. Jiménez-Moreno, D. G. Valencia, M. Frikha, M. P. Serrano and G. G.
Mateos 2009. Effect of main cereal of the diet and particle size of the cereal on
productive performance and egg quality of brown egg-laying hens in early phase
of production. Poult. Sci. 88:608-614.
Schutte, J. B., De Jong, J. and Bertram, H. L. 1994. Requirements of the laying hen for
sulfur amino acids. Poult. Sci. 73:274-280.
Scragg, R. H., Loga, N. B. and Geddes, N. 1987. Response of egg weight to the inclusion
of various fats in layer diets. Br. Poul. Sci. 28:15-21.
Sell, J. L. and Hodgson, G. C. 1966. Wheat-soybean meal rations for laying hens. Poult.
Sci. 45:247-253.
Sell, J. L., Angel, C. R. and Escribano, F. 1987. Influence of supplemental fat on weights
of egg and yolks during early egg production. Poult. Sci. 66:1807-1812.
Chapter 1. Literature review and objectives
57
Shannon, D. W. F. and Whitehead, C .C. 1974. Lack of response in egg weight or output
to increasing levels of linoleic acid in practical layers’ diets. J. Sci. Food Agric.
25:553-561.
Sohail, S. S., M. M. Bryant, and D. A. Roland, Sr. 2003. Influence of dietary fat on
economic returns of commercial Leghorns. J. Appl. Poult. Res. 12:356–361.
Summers, J. D. 1986. Feeding light hibrids in lay. Poultry International. 25:22-26.
Summers, J. D., Atkinson, J. L. and Spratt, D. 1991. Supplementation of low protein diet
in an attempt to optimize egg mass output. Can. J. Anim. Sci. 71:211-220
Summers, J.D. and S. Leeson. 1983. Factors influencing early egg size. Poult. Sci.
62:1155-1159.
Usayran, N., M. T. Farran, H. H. O. Awadallah, I. R. Al-Hawi, R. J. Asmar, and V. M.
Ashkarian. 2001. Effects of added dietary fat and phosphorus on the performance
and egg quality of laying hens subjected to a constant high environmental
temperature. Poult. Sci. 80:1695–1701.
Walker, A. W., Tucker, S. A. and Lynn, N. J. 1991. Effects of nutrient density and fat
content on the performance of laying hens. Br. Poult. Sci. 32:1138-1139.
Wethli, E. and Morris, T. R. 1978. Effects of age on the tryptophan requirements of
laying hens. Br. Poult. Sci. 19:559-565.
Whitehead, C. C. 1981. The response of egg weight to the inclusion of different amounts
of vegetable oil and linoleic acid in the diet of laying hens. Br. Poult. Sci. 22:525-
532.
Chapter 1. Literature review and objectives
58
Whitehead, C. C. 1984. Essential fatty acids in poultry nutrition. Fats in animal nutrition.
Eds.: WISEMAN, J. Butterworths. London. UK. pp.: 153-166
Whitehead, C. C., Bowman, A. S. and Griffin, G. D. 1991. The effects of dietary fat and
bird age on the weights of eggs and egg components in the laying hen. Br. Poult.
Sci. 32:565-574.
Whitehead, C. C., Bowman, A. S. and Griffin, G. D. 1993. Regulation of plasma
oestrogen by dietary fats in the laying hen: relationship with egg weight. Br.
Poult. Sci. 34:999-1010.
Whitehead, C. C. 1995. Plasma oestrogen and the regulation of egg weight in laying hens
by dietary fats. Anim. Feed. Sci. Technol. 53:91-98.
Wu, G., M. M. Bryant, R. A. Voitle, and D.A. Roland Sr. 2005. Effect of dietary energy
on performance and egg composition of Bovans white and Dekalb white hens
during phase I. Poult. Sci. 84:1610-1615.
Zimmermann, N. G., and D. K. Andrews. 1987. Comparison of several induced molting
methods on subsequent performance of Single Comb White Leghorn hens. Poult.
Sci. 66:408-417.
Effects of the main cereal and type of fat of the diet
on productive performance and egg quality of
brown-egg laying hens from 22 to 54 weeks of age
POULTRY SCIENCE 90:2801
Chapter 2. Effects of the main cereal and type of fat of the diet
CHAPTER 2:
ffects of the main cereal and type of fat of the diet
on productive performance and egg quality of
egg laying hens from 22 to 54 weeks of age
(Experiment 1)
PUBLISHED IN:
POULTRY SCIENCE 90:2801-2810 doi:10.3382/ps.2011-01503
nd type of fat of the diet
59
ffects of the main cereal and type of fat of the diet
on productive performance and egg quality of
egg laying hens from 22 to 54 weeks of age

Chapter 2. Effects of the main cereal and type of fat of the diet
60
1. Introduction
Corn (Zea mays L.) and soft wheat (Triticum aestivum L.) are two cereals commonly used
as energy sources in poultry diets.In some countries, barley (Hordeum vulgare L.) is also
an attractive commercial alternative.Corn has less protein and dietary fiber and more
starch, fat, AMEn, and linoleic acid (LNL ) content than wheat or barley. In addition, the
chemical composition and nutritive value of corn is quite uniform compared to that of
wheat and barley, but all grain contents vary depending on factors such as cultivar,
agronomic practices, weather conditions, and length of the storage period (Pirgozliev et
al., 2003; Gutiérrez-Alamo et al., 2008; Frikha et al. 2011).
In commercial practice, many egg producers formulate diets for laying hens with
at least 20-30% corn to insure high feed intake and maximize egg size early in the
production cycle, in spite of the frequent higher relative cost of corn. The reasons for this
practice is unknown but might be related to the more uniform nutritive value of corn and
the better feed structure when coarse corn is included in the diet (Frikha et al., 2009).
Also, corn has more LNL content than wheat and barley, and an increase in LNL content
of the diet might result in an improvement in egg weight, especially in young pullets
under hot climate conditions in which FI is low (Jensen et al., 1958; Scragg et al., 1987;
Grobas et al., 1999a). In addition, wheat and barley contain a high and variable amount of
non starch polisaccharides (NSP) that is known to increase digesta viscosity and reduce
productive performance in poultry (Lázaro et al., 2003, Garcia et al., 2008).
The effect of the main cereal of the diet on egg quality has not been studied in
detail. In general, the inclusion of barley and wheat increased the incidence of dirty eggs
as compared with the inclusion of corn (Francesch et al., 1995) but the problem was
reduced to levels similar to that of corn when diets were supplemented with enzymes
(Lázaro et al., 2003).

Chapter 2. Effects of the main cereal and type of fat of the diet
61
Fats are used in poultry to increase the energy content of the diets. The inclusion of fat
resulted often in lower feed consumption but higher energy intake, egg weight, and BW
gain (Grobas et al., 2001; Bouvarel et al., 2010), probably because of improved
palatability with less dust formation (ISA Brown, 2011). Also, supplemental fat has been
shown to reduce rate of feed passage, facilitating the contact between digesta and
enzymes and improving digestibility and utilization of other nutrients such as the lipid
and carbohydrate fractions of dietary ingredients (Mateos and Sell, 1980b, 1981).
Soybean oil (SBO), acidulated vegetable oil soapstocks (AVO ), a by-product of the oil
industry for human consumption, and lard, are the most commonly used fat sources in
laying hen diets in Spain. Soybean oil contains more LNL and AMEn than AVO and lard
(Fundación Española Desarrollo Nutrición Animal, 2003). In addition, the LNL and
AMEn content of AVO may be more variable than that of SBO or lard because they
depend on the characteristics of the original oils and the refining process used. Scragg et
al. (1987) reported increases in egg weight with increases in dietary levels of LNL of up
to 2.0%. Moreover, some commercial guidelines on management and nutrition of laying
hens (H & N International, 2008; Bábolna Tetra, 2009; Lohman, 2010) recommend
dietary LNL levels higher than 1.8% (2.0 g/hen/d) to optimize egg production and insure
a rapid increase in egg size at the beginning of the laying period. However, Shutze et al.
(1959), Grobas et al. (1999b,c), and Safaa et al. (2009) reported no benefits with levels
of LNL in the diet above 1.0-1.15%.
The hypothesis of this research was that when the diet is supplemented with
enzymes, wheat and barley can substitute corn as the main cereal of the diet without any
negative effect on performance or egg quality. Similarly, the 3 fat sources tested could be
used indistinctly as a source of dietary energy without any loss of performance or egg
quality. Also, we hypothesize that egg weight of hens fed diets containing 4.3%
Chapter 2. Effects of the main cereal and type of fat of the diet
62
supplemental fat could be maximized with levels of LNL in the diet of approximately
1.0% (1.16 g/hen/d).
The aim of this study was to determine the influence of the main cereal of the diet (corn,
wheat, and barley) and type of supplemental fat (soy oil, acidulated vegetable soapstocks,
and lard) on productive performance and egg quality of brown laying hens from 22 to 54
wks of age.
2. Material and methods
2.1. Husbandry, Feeding Program, and Experimental Diets
All experimental procedures were approved by the animal Ethics Committee of the
Universidad Politécnica de Madrid and were in compliance with the Spanish guidelines
for the care and use of animals in research (Boletín Oficial del Estado, 2005).
In total, 756 20-wk-old Lohmann Brown laying hens were obtained from a
commercial flock (El Canto Agroalimentaria S.L, Toledo, Spain). From 20 to 22 wks of
age all hens were fed a common corn-soybean meal diet. At 22 wks, the hens were
weighed individually and placed at random in cages (7 hens) provided with an open
trough feeder and 2 nipple drinkers in an environmentally controlled barn. Each treatment
was replicated 4 times and the experimental unit consisted of 3 adjacent cages (21 hens)
(600 x 575 mm; General Ganadera S.A, Valencia, Spain). The ambient temperature in the
barn varied according to the month considered (22 ± 3 ºC in March, first month of the
trial and 28 ± 3 ºC in July, last month of the trial). The light program was constant and
consisted of 16 h light per day.
The cereals used were grown in Spain and were obtained from commercial
sources; the SBO was supplied by Bunge Ibérica S.A. (Barcelona, Spain), the AVO by
Oleínas y Grasas S.L. (Tarragona, Spain), and the lard from Ibergrasa S.A. (Madrid,

Chapter 2. Effects of the main cereal and type of fat of the diet
63
Spain). The AVO was a commercial mixture of vegetable soapstocks and was composed
primarily of by-products of the palm oil and soy oil refinery industry. Two different
batches of cereals and lipid sources were used during the trial: one batch for the first four
28-d periods and a second batch for the last four 28-d periods of the experiment. The
calculated and determined composition of the cereals and fat sources used are shown in
Tables 1 and 2, respectively.
The experiment was conducted as a completely randomized design with 9 diets
organized factorially with 3 main cereals and 3 sources of supplemental fat. Barley and
wheat were included in their respective diets in substitution of 45 percentage units of
corn. The ingredient composition of these diet was adjusted to insure that all had similar,
AMEn and indispensible AA content (Fundacion Española Desarrollo Nutricion Animal,
2003). However, no attempt was made to equalize the LNL content of these diets. Within
each cereal series of diets, the 3 fat sources were introduced (wt:wt) at a level of 4.3%
and no attempt was made to maintain constant their AMEn and LNL contents. Thus, diets
based on SBO contained slightly more AME (2.750, 2.727, and 2.730 Kcal/kg,
respectively) and more LNL than diets based on AVO or lard (Table 3). Because of the
experimental design, the levels of LNL varied from 0.8 to 3.4% depending on the
combination of cereal and fat source used, with the lower values reported for diets based
on wheat and lard and the higher for diets based on SBO and corn. The LNL content of
diets based on wheat or barley and supplemented with lard, was lower than 1.1%, the
value recommended by NRC (1994) for brown-egg laying hens consuming 110 g
feed/d.Moreover, most of the experimental diets had lower levels of LNL than currently
used by the industry (1.7 to 2.0%). Otherwise, all the diets met or exceeded the nutrient
requirements for brown egg-laying hens (Fundacion Española Desarrollo Nutricion
Animal, 2008). A commercial enzyme complex that included β-glucanase and xylanase
activity (Endofeed, GNC Bioferm Inc., Saskatoon, SK, Canada), was included at the dose
Chapter 2. Effects of the main cereal and type of fat of the diet
64
recommended by the supplier in all diets to insure maximal nutrient utilization. Also, a
commercial additive (Lucanmix, BASF Ibérica, Tarragona, Spain) based on canthaxantin
and ester of β-apo-8-carotenoic was included in fixed amounts in all the diets to satisfy
consumer preference for egg yolk pigmentation. The ingredient composition and the
calculated nutritive value of the experimental diets are presented in Tables 3 and 4,
respectively. The cereal fraction of the feeds was ground using a hammer mill provided
with a 7.5 mm screen.
2.2. Laboratory Analyses
Representative samples of cereals and diets were ground in a laboratory mill (Model Z-I,
Retsch Stuttgart, Germany) provided with a 1-mm screen and analyzed for moisture by
the oven-drying (method 930.01), total ash using a muffle furnace (method 942.05),
nitrogen by combustion (method 990.03) using a LECO analyzer (Model FP-528, LECO,
St. Joseph, MI), starch by the α-amylase glucosidase (method 996.11), CF by sequential
extraction with diluted acid and alkali (method 962.09), and Ca and P by
spectrophotometry (methods 968.08 and 965.17) as described by AOAC International
(2000). Neutral and acid detergent fiber of the cereals were determined sequentially as
described by Van Soest et al. (1991) and expressed on an ash-free basis. Ether extract was
determined by Soxhlet analysis after 3 N HCl acid hydrolysis (Boletín Oficial del Estado,
1995), and gross energy using an isoperibol bomb calorimeter (Model 356, Parr
Instrument Company, Moline, IL). The fatty acid content of cereals and fat sources were
determined by gas-liquid chromatography (GC-14B, Shimadzu, Kyoto, Japan) as
indicated by Grobas et al. (1999b). Quality traits of the fat sources, including insoluble
impurities (method 926.12), moisture (method 984.20), and unsaponifiable material
(method 933.08) were determined as indicated by AOAC International (2000). Non
eluted material, which reflects the indigestible portion of fat in the sample, was
Chapter 2. Effects of the main cereal and type of fat of the diet
65
determined by gas chromatography (method 977.17) as indicated by AOAC International
(2000). The acid value, which measures the amount of KOH in mg needed for
neutralizing the free fatty acids present in 1 g of the fat sample, was determined by
method Cd-3d-63 of AOCS (1998). The initial peroxide index (method 16) was
determined as indicated by Boletín Oficial del Estado (1995). All these analyses were
conducted in duplicate samples. The geometric mean diameter of cereals (Table 1) and
diets (Table 4) for each of the two periods considered were determined in triplicate in 100
g samples using a Retsch shaker (Retsch, Stuttgart, Germany) provided with 8 sieves
ranging in mesh from 5,000 to 40 µm according to the methodology outlined by ASAE
(1995).
2.3. Productive Performance and Egg Quality
Eggs were collected daily and egg weight was measured in all eggs produced the last 2
days of each of the eight 28-d periods. Also, feed intakewas measured by replicate by
period and cumulative and mortality was recorded as produced. From these data, hen-day
egg production, egg weight, egg mass, ADFI, and feed conversion ratio (FCR) per
kilogram and per dozen of eggs, were calculated by period and cumulatively. Also, the
ratio (g/g) between average egg mass or egg weight and LNL intake by treatment were
calculated. In addition, all the hens were weighed individually at the beginning and at the
end of the experiment, and the BW gain per replicate was calculated.
The number of clean, dirty, broken, shell-less, and double-yolked eggs was
recorded daily by replicate. An egg was considered as dirty when a spot of any kind or
size was detected on the shell as evaluated by two independent observers blind to
treatment. In addition, all the eggs used for egg weight determination (produced the last
2-d of each 28-d period), were graded as described by the European Council Directive
(2006). The categories recorded were extra large (>73 g), large (73 to 63 g), medium (63
Chapter 2. Effects of the main cereal and type of fat of the diet
66
to 53 g), and small (< 53 g). Also, shell density and internal quality (Haugh unit and yolk
color by Roche color fan) were measured in 10 eggs per replicate chosen at random from
eggs produced the last day of each 28-d period. A multitester equipment (QCM System,
Technical Services and Supplies, Dunnington, York, UK) was used. In addition, shell
thickness of 5 eggs collected at random from eggs produced the last day of each 28-d
period from each replicate was measured with a digital micrometer (model IT-014UT,
Mitotuyo, Kawasaki, Japan). The average of 3 measurements was used to estimate shell
thickness of each egg. At the end of the second experimental period the proportion of
albumen and yolk were determined in the 10 eggs per replicate used for egg quality
measurements as indicated by Safaa et al. (2008). Also, the pH value of the yolk and
albumen fractions was measured in these eggs using a pH meter (Accumet 910, Kent
City, MI) as indicated by Shang et al. (2004).
2.4. Statistical Analysis
The experimental design was completely randomized with 9 treatments arranged
factorially and the main effects (type of cereal and of supplemental fat) and its
interactions were analyzed by ANOVA using the GLM procedure of SAS Institute
(1990). No significant interactions between main effects were observed for any of the
traits studied and therefore, the interaction was removed from the model. The
homogeneity of the variance of the data for all traits was tested by the Levene´s Test
(Hovtest option of the GLM procedure). All performance and egg quality data were
homogeneous, except for mortality; therefore, mortality data were analyzed after arcsin
transformation. When the effects of cereal and fat source were significant, the Tukey test
was used to make pairwise comparisons to separate treatment means. Results in tables are
presented as means, and differences were considered significant at P < 0.05.
Chapter 2. Effects of the main cereal and type of fat of the diet
67
3. Results
3.1. Laboratory analysis
The determined chemical composition of cereals (Table 1) and lipid sources (Table 2)
were similar to expected values (Fundación Española Desarrollo Nutrición Animal,
2003). The LNL content of the 2 batches of fats used was 58.6 and 55.7% for SBO, 23.9
and 21.6% for AVO, and 8.4 and 8.0% for lard. Gross energy was lowest for AVO,
consistent with its higher moisture, insoluble impurities, and non-eluted material content
as compared with SBO or lard. The geometric mean diameter of the 2 batches of cereals
and diets used was higher for barley than for corn with that of wheat being intermediate
(Tables 1 and 4, respectively).
3.2. Productive performance
No interactions between cereal and supplemental fat on performance of laying hens were
detected and therefore, only the P-values for main effects are presented (Table 5). Also,
dietary treatment had no significant effects on productive performance in any of the
periods considered and therefore, only cumulative effects are presented.For the entire
experimental period,egg production (92.9, 91.5, and 92.1 % for corn, wheat, and barley,
respectively) and egg weight (64.5, 63.6, and 64.1 g for corn, wheat, and barley,
respectively) were not affected by type of cereal. Consequently, egg mass did not differ
among treatments (59.9, 58.2, and 59.1 g for hens fed corn, wheat, or barley,
respectively). In contrast, hens fed wheat and corn had higher BW gain than hens fed
barley (243, 238, and 202 g, respectively; P< 0.05).Source of fat did not affect any of the
productive traits studied except for BW gain that was higher for hens fed lard than for
hens fed SBO or AVO (251, 221, and 210 g, respectively; P< 0.05). Cumulatively,
average mortality was 7.5% and was not affected by dietary treatment.

Chapter 2. Effects of the main cereal and type of fat of the diet
68
The ratio between g of egg weight or g of egg mass produced and g of LNL intake
according to treatment is shown in Table 6. The ratio was lowest for hens fed SO,
irrespective of the main cereal of the diet and highest for hens fed lard and wheat,
followed by hens fed lard and barley, and lard and corn (P < 0.001).
3.3. Egg quality
For the entire experimental period the percentage of dirty, broken, shell-less, and double-
yolked eggs, as well as Haugh units, and shell thickness and density of the eggs were not
affected by diet (Table 7).Yolk pigmentation was higher (P< 0.001) for hens fed corn
than for hens fed wheat or barley. Also, yolk eggs from hens fed lard were better
pigmented (P< 0.001) than yolks from hens fed SBO or AVO. At 30 wks of age, dietary
treatment did not affect percentage of yolk or albumen weight, or the pH of these two egg
fractions (Table 8).
4. Discussion
4.1. Productive performance
For the entire experimental period, ADFI, egg production, egg weight, and FCR were
similar for the 3 cereals, results that agree with previous reports (Craig and Goodman.,
1993; Lázaro et al., 2003; Safaa et al., 2009) that have shown that when wheat and barley
diets were supplemented with exogenous enzymes, laying hen productivity was not
affected by the main cereal of the diet. Moreover, Mathlouthi et al. (2002) reported
similar performance in broilers when 60% of corn was substituted by a combination of
40% wheat and 20% barley supplemented with enzymes. Also, Ruiz et al. (1987)
reported similar BW gain and FCR for diets based on corn than for diets based on wheat
in broilers from 1 to 21 d of age. In contrast, Coon et al. (1988) reported higher ADFI and
poorer FCR in hens fed enzyme supplemented barley diets than in hens fed corn diets. In
Chapter 2. Effects of the main cereal and type of fat of the diet
69
the current experiment, BW gain was greater in hens fed corn or wheat than in hens fed
barley, results that agree with data of Berg et al. (1959) who reported higher BW gain for
hens fed corn than for hens fed barley. In contrast, Frikha et al. (2009) reported higher
BW gain in pullets fed corn than in pullets fed wheat, both diets being supplemented with
enzymes. In general, the information available indicated that when the diets are
supplemented with enzymes, wheat and barley can substitute for corn in poultry diets, in
agreement with the data of the current experiment.
For the entire experimental period, the substitution of SBO by AVO or lard in the
diet did not affect any of the productive performance traits studied except for BW gain
that was higher for hens fed lard than for hens fed SBO or AVO. We are not aware of any
published paper reporting on the effects of these 3 supplemental fats on BW gain of the
hens. In the current research, a higher percentage of the energy intake of the hens fed lard
was diverted to BW gain rather than to energy deposition in eggs was compared with
hens fed lard than when fed SBO or AVO. Vila and Esteve-Garcia (1996) and Sanz et al.
(1999, 2000) reported that broilers fed diets supplemented with tallow or lard had higher
abdominal fat deposition than broilers fed isoenergetic diets based on more unsaturated
vegetable oils, consistent with the results of the current experiment.
The effect of dietary LNL on egg size is a subject of debate. Under commercial
conditions, many commercial guides for feeding laying hens (H&N International, 2009;
Lohmann, 2010) recommend to increase the level of LNL in the diet to at least 1.8% (2.0
g/hen/d) to maximize egg size. Moreover, Scragg et al. (1987) recommended up to 2%
dietary LNL to increase egg size in brown-egg laying hens and Ribeiro et al. (2007)
reported higher egg weight in broiler breeder hens fed 1.9% LNL diets than in hens fed
1.5% LNL diets. However, data from Jensen et al. (1958), Shutze et al., (1959), and
Grobas et al. (1999a, b) do not support current feeding practices of using 1.8% LNL in
the diet to maximize egg size. The reasons for the discrepancies between practical
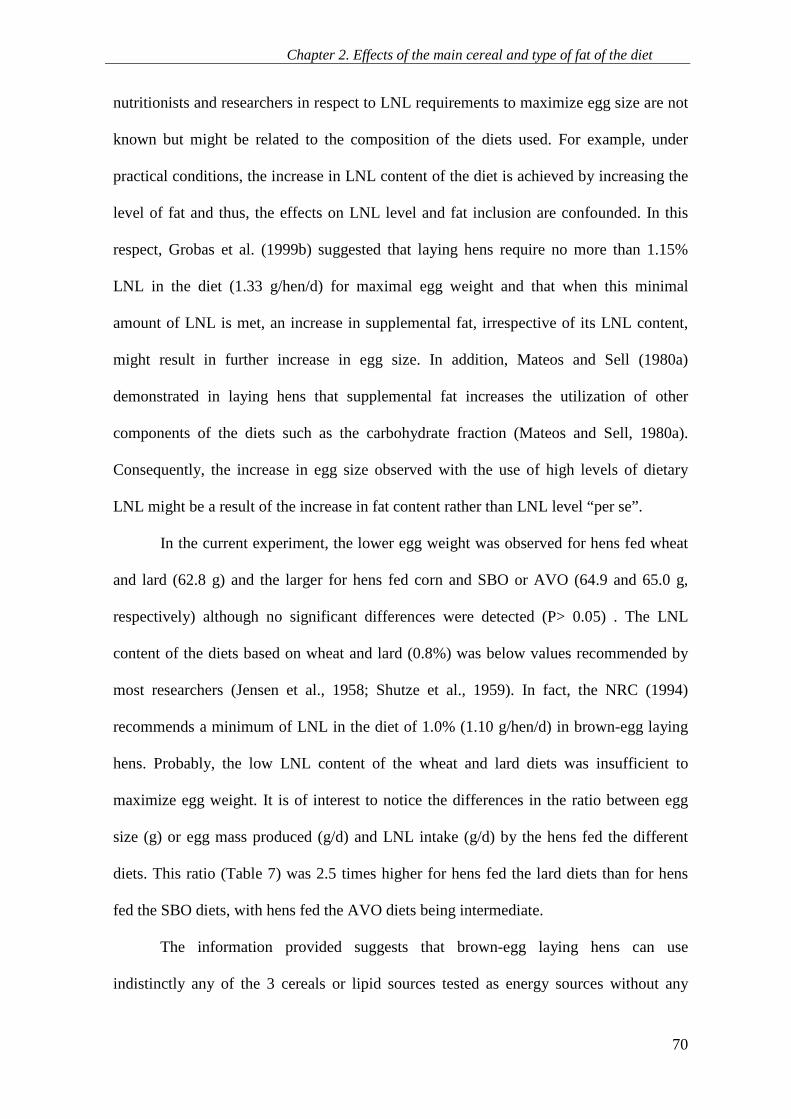
Chapter 2. Effects of the main cereal and type of fat of the diet
70
nutritionists and researchers in respect to LNL requirements to maximize egg size are not
known but might be related to the composition of the diets used. For example, under
practical conditions, the increase in LNL content of the diet is achieved by increasing the
level of fat and thus, the effects on LNL level and fat inclusion are confounded. In this
respect, Grobas et al. (1999b) suggested that laying hens require no more than 1.15%
LNL in the diet (1.33 g/hen/d) for maximal egg weight and that when this minimal
amount of LNL is met, an increase in supplemental fat, irrespective of its LNL content,
might result in further increase in egg size. In addition, Mateos and Sell (1980a)
demonstrated in laying hens that supplemental fat increases the utilization of other
components of the diets such as the carbohydrate fraction (Mateos and Sell, 1980a).
Consequently, the increase in egg size observed with the use of high levels of dietary
LNL might be a result of the increase in fat content rather than LNL level “per se”.
In the current experiment, the lower egg weight was observed for hens fed wheat
and lard (62.8 g) and the larger for hens fed corn and SBO or AVO (64.9 and 65.0 g,
respectively) although no significant differences were detected (P> 0.05) . The LNL
content of the diets based on wheat and lard (0.8%) was below values recommended by
most researchers (Jensen et al., 1958; Shutze et al., 1959). In fact, the NRC (1994)
recommends a minimum of LNL in the diet of 1.0% (1.10 g/hen/d) in brown-egg laying
hens. Probably, the low LNL content of the wheat and lard diets was insufficient to
maximize egg weight. It is of interest to notice the differences in the ratio between egg
size (g) or egg mass produced (g/d) and LNL intake (g/d) by the hens fed the different
diets. This ratio (Table 7) was 2.5 times higher for hens fed the lard diets than for hens
fed the SBO diets, with hens fed the AVO diets being intermediate.
The information provided suggests that brown-egg laying hens can use
indistinctly any of the 3 cereals or lipid sources tested as energy sources without any
Chapter 2. Effects of the main cereal and type of fat of the diet
71
effect on performance provided that the amount of dietary LNL is maintained around 0.9-
1.0% (1.04 -1.16 g/hen/d).
4.2. Egg quality
Type of cereal did not affect any of the egg quality traits studied, except for egg yolk
pigmentation that was increased when corn was used. The beneficial effect on yolk
pigmentation observed with corn feeding was expected because all the diets, independent
of the cereal used, were supplemented with the same amount of exogenous pigment
source. The information available on the effects of the main cereal of the diet on egg
quality traits, other than yolk pigmentation, is scarce. Jamroz et al. (2001) reported
similar egg quality from hens fed wheat or barley diets supplemented with enzymes. On
the other hand, Francesch et al. (1995) have reported a higher incidence of dirty eggs in
hens fed barley than in hens fed corn. The only report available comparing egg quality in
hens fed high levels of these 3 cereals is that of Lázaro et al. (2003). In this report, the
inclusion of barley and wheat increased the percentage of dirty eggs as compared with the
inclusion of corn. However, no other quality traits (shell weight, percentage of shell-less,
and Haugh units) were affected by the main cereal of the diet. Moreover, when enzymes
were added to the wheat and barley diets, the incidence of dirty eggs decreased to levels
similar to those found for the corn diet. Çiftci et al. (2003) and Safaa et al. (2009)
reported that the substitution of corn by wheat in enzyme supplemented diets, did not
affect the percentage of dirty eggs in Single Comb White Leghorn and brown egg-laying
hens, respectively, in agreement with the results of the current trial.
In the current experiment, Roche color fan values of the yolks were greater with lard-
than with SBO- or AVO supplemented diets. We have not found any report in the
literature comparing the influence of type of fat on yolk pigmentation. The fatty acid
profile of lard was more saturated than that of the SBO or AVO and thus, dietary
Chapter 2. Effects of the main cereal and type of fat of the diet
72
pigments were probably more stable in the presence of lard than in the presence of more
unsaturated fat sources, both in the feed and in the gastrointestinal tract.
Cereal source did not affect the pH of yolk and albumen in fresh eggs. Woodward et al.
(1987) reported that yolk rupture strength of 50-wk-old hens decreased with the age of
the eggs but that the decline was more rapid for egg yolks from birds fed a corn diet than
from birds fed a wheat diet. Scheideler et al. (2010) reported that supplementation of the
diet with 250 IU vitamin E/kg improved vitelline membrane strength of fresh eggs. These
authors reported that vitamin E supplementation increased yolk pH and reduced albumen
pH and that these changes in pH were responsible for the beneficial effects observed on
vitelline membrane strength. In the current experiment, no effects of cereal or fat source
on albumen and yolk pH were detected. Thus, neither cereal type nor supplemental fat
source was expected to affect this aspect of egg quality.
5. Conclusions
We conclude that corn, wheat, and barley can be used successfully in laying hen diets to
levels of up to 45% provided that the diets supplied a minimal amount of linoleic acid.
Also, soybean oil, acidulated vegetable soapstocks, and lard can be used as a source of
energy in the diet without any significant effect on performance or egg quality provided
that the diets met the requirements in linoleic acid of the hens. Under practical feeding
conditions, the requirements of hens for linoleic acid to maximize egg size is lower than
recommended by most practical nutritionists and guidelines for laying hens. Therefore,
current practices of formulating commercial diets with at least 1.8% linoleic acid are not
justified.
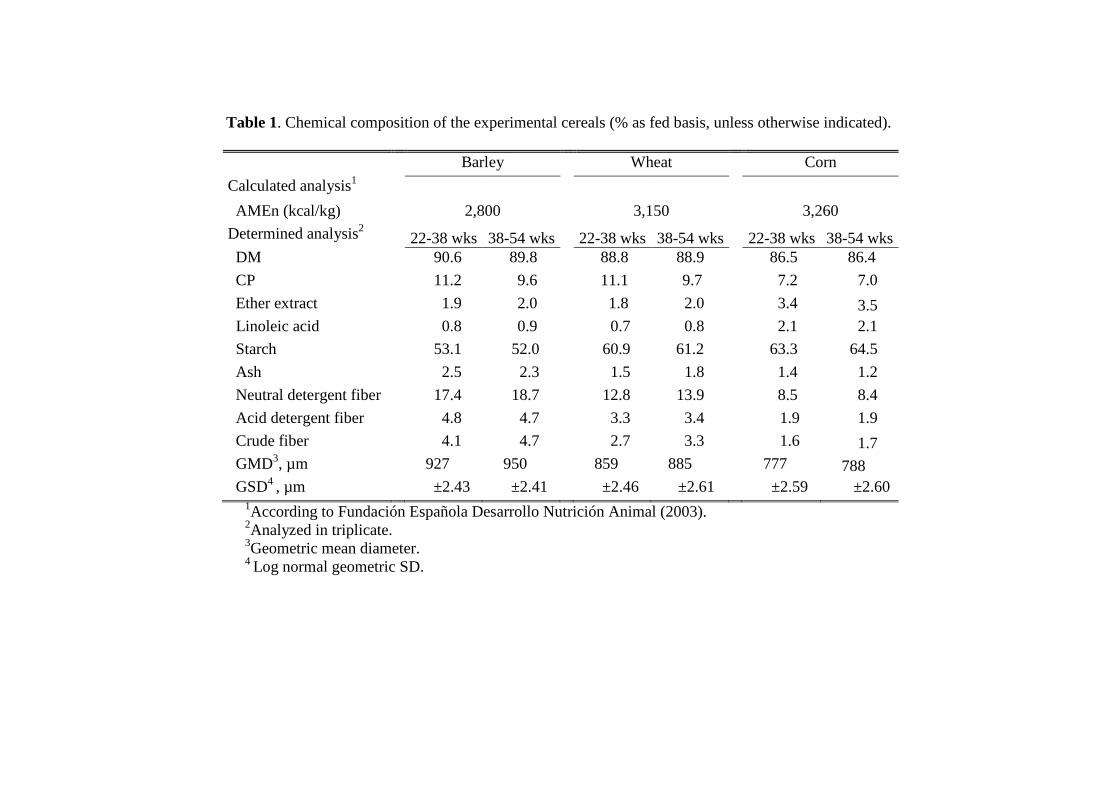
Table 1. Chemical composition of the experimental cereals (% as fed basis, unless otherwise indicated).
Barley Wheat Corn
Calculated analysis1
AMEn (kcal/kg) 2,800 3,150 3,260
Determined analysis2 22-38 wks 38-54 wks 22-38 wks 38-54 wks 22-38 wks 38-54 wks DM 90.6 89.8 88.8 88.9 86.5 86.4
CP 11.2 9.6 11.1 9.7 7.2 7.0
Ether extract 1.9 2.0 1.8 2.0 3.4 3.5 Linoleic acid 0.8 0.9 0.7 0.8 2.1 2.1
Starch 53.1 52.0 60.9 61.2 63.3 64.5
Ash 2.5 2.3 1.5 1.8 1.4 1.2
Neutral detergent fiber 17.4 18.7 12.8 13.9 8.5 8.4
Acid detergent fiber 4.8 4.7 3.3 3.4 1.9 1.9
Crude fiber 4.1 4.7 2.7 3.3 1.6 1.7 GMD3, µm 927 950 859 885 777 788 GSD4 , µm ±2.43 ±2.41 ±2.46 ±2.61 ±2.59 ±2.60
1According to Fundación Española Desarrollo Nutrición Animal (2003). 2Analyzed in triplicate. 3Geometric mean diameter. 4 Log normal geometric SD.
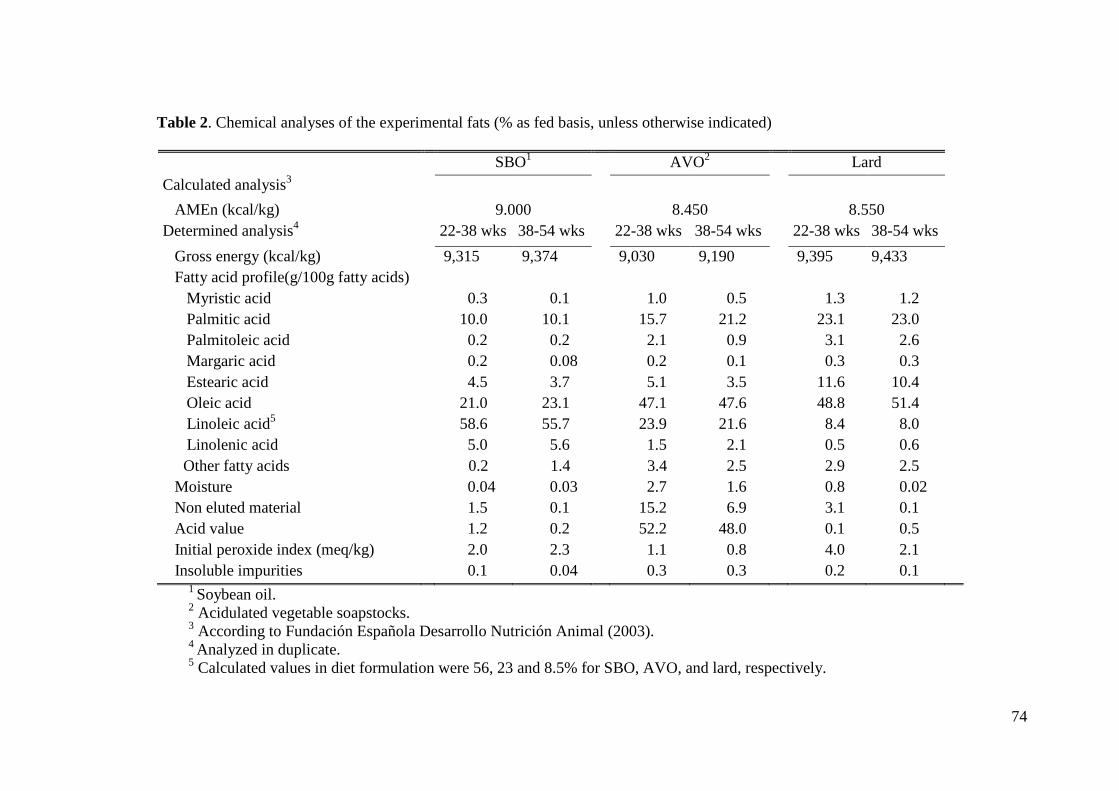
74
Table 2. Chemical analyses of the experimental fats (% as fed basis, unless otherwise indicated)
SBO1 AVO2 Lard
Calculated analysis3
AMEn (kcal/kg) 9.000 8.450 8.550 Determined analysis4 22-38 wks 38-54 wks 22-38 wks 38-54 wks 22-38 wks 38-54 wks
Gross energy (kcal/kg) 9,315 9,374 9,030 9,190 9,395 9,433 Fatty acid profile(g/100g fatty acids) Myristic acid 0.3 0.1 1.0 0.5 1.3 1.2 Palmitic acid 10.0 10.1 15.7 21.2 23.1 23.0 Palmitoleic acid 0.2 0.2 2.1 0.9 3.1 2.6 Margaric acid 0.2 0.08 0.2 0.1 0.3 0.3 Estearic acid 4.5 3.7 5.1 3.5 11.6 10.4 Oleic acid 21.0 23.1 47.1 47.6 48.8 51.4 Linoleic acid5 58.6 55.7 23.9 21.6 8.4 8.0 Linolenic acid 5.0 5.6 1.5 2.1 0.5 0.6
Other fatty acids 0.2 1.4 3.4 2.5 2.9 2.5 Moisture 0.04 0.03 2.7 1.6 0.8 0.02 Non eluted material 1.5 0.1 15.2 6.9 3.1 0.1 Acid value 1.2 0.2 52.2 48.0 0.1 0.5 Initial peroxide index (meq/kg) 2.0 2.3 1.1 0.8 4.0 2.1 Insoluble impurities 0.1 0.04 0.3 0.3 0.2 0.1
1 Soybean oil. 2 Acidulated vegetable soapstocks. 3 According to Fundación Española Desarrollo Nutrición Animal (2003). 4 Analyzed in duplicate. 5 Calculated values in diet formulation were 56, 23 and 8.5% for SBO, AVO, and lard, respectively.
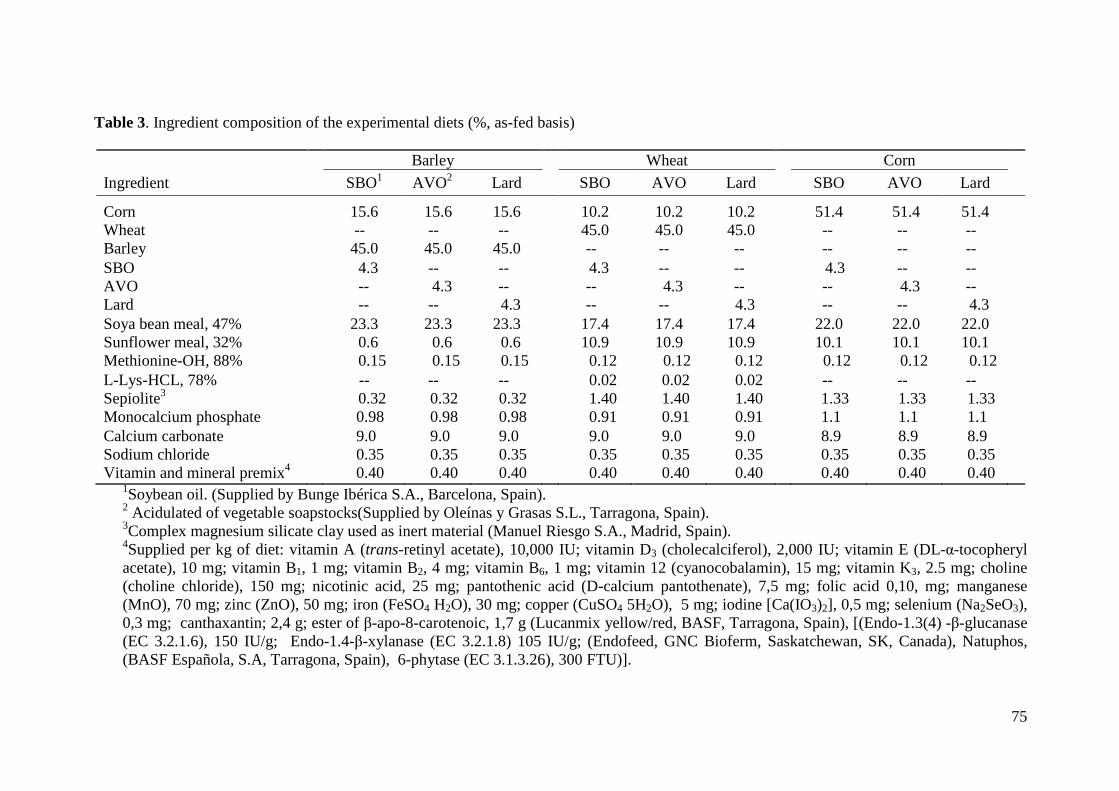
75
Table 3. Ingredient composition of the experimental diets (%, as-fed basis)
1Soybean oil. (Supplied by Bunge Ibérica S.A., Barcelona, Spain). 2 Acidulated of vegetable soapstocks(Supplied by Oleínas y Grasas S.L., Tarragona, Spain). 3Complex magnesium silicate clay used as inert material (Manuel Riesgo S.A., Madrid, Spain). 4Supplied per kg of diet: vitamin A (trans-retinyl acetate), 10,000 IU; vitamin D3 (cholecalciferol), 2,000 IU; vitamin E (DL-α-tocopheryl acetate), 10 mg; vitamin B1, 1 mg; vitamin B2, 4 mg; vitamin B6, 1 mg; vitamin 12 (cyanocobalamin), 15 mg; vitamin K3, 2.5 mg; choline (choline chloride), 150 mg; nicotinic acid, 25 mg; pantothenic acid (D-calcium pantothenate), 7,5 mg; folic acid 0,10, mg; manganese (MnO), 70 mg; zinc (ZnO), 50 mg; iron (FeSO4 H2O), 30 mg; copper (CuSO4 5H2O), 5 mg; iodine [Ca(IO3)2], 0,5 mg; selenium (Na2SeO3), 0,3 mg; canthaxantin; 2,4 g; ester of β-apo-8-carotenoic, 1,7 g (Lucanmix yellow/red, BASF, Tarragona, Spain), [(Endo-1.3(4) -β-glucanase (EC 3.2.1.6), 150 IU/g; Endo-1.4-β-xylanase (EC 3.2.1.8) 105 IU/g; (Endofeed, GNC Bioferm, Saskatchewan, SK, Canada), Natuphos, (BASF Española, S.A, Tarragona, Spain), 6-phytase (EC 3.1.3.26), 300 FTU)].
Barley Wheat Corn
Ingredient SBO1 AVO2 Lard SBO AVO Lard SBO AVO Lard
Corn 15.6 15.6 15.6 10.2 10.2 10.2 51.4 51.4 51.4 Wheat -- -- -- 45.0 45.0 45.0 -- -- -- Barley 45.0 45.0 45.0 -- -- -- -- -- -- SBO 4.3 -- -- 4.3 -- -- 4.3 -- -- AVO -- 4.3 -- -- 4.3 -- -- 4.3 -- Lard -- -- 4.3 -- -- 4.3 -- -- 4.3 Soya bean meal, 47% 23.3 23.3 23.3 17.4 17.4 17.4 22.0 22.0 22.0 Sunflower meal, 32% 0.6 0.6 0.6 10.9 10.9 10.9 10.1 10.1 10.1 Methionine-OH, 88% 0.15 0.15 0.15 0.12 0.12 0.12 0.12 0.12 0.12 L-Lys-HCL, 78% -- -- -- 0.02 0.02 0.02 -- -- -- Sepiolite3 0.32 0.32 0.32 1.40 1.40 1.40 1.33 1.33 1.33 Monocalcium phosphate 0.98 0.98 0.98 0.91 0.91 0.91 1.1 1.1 1.1 Calcium carbonate 9.0 9.0 9.0 9.0 9.0 9.0 8.9 8.9 8.9 Sodium chloride 0.35 0.35 0.35 0.35 0.35 0.35 0.35 0.35 0.35 Vitamin and mineral premix4 0.40 0.40 0.40 0.40 0.40 0.40 0.40 0.40 0.40
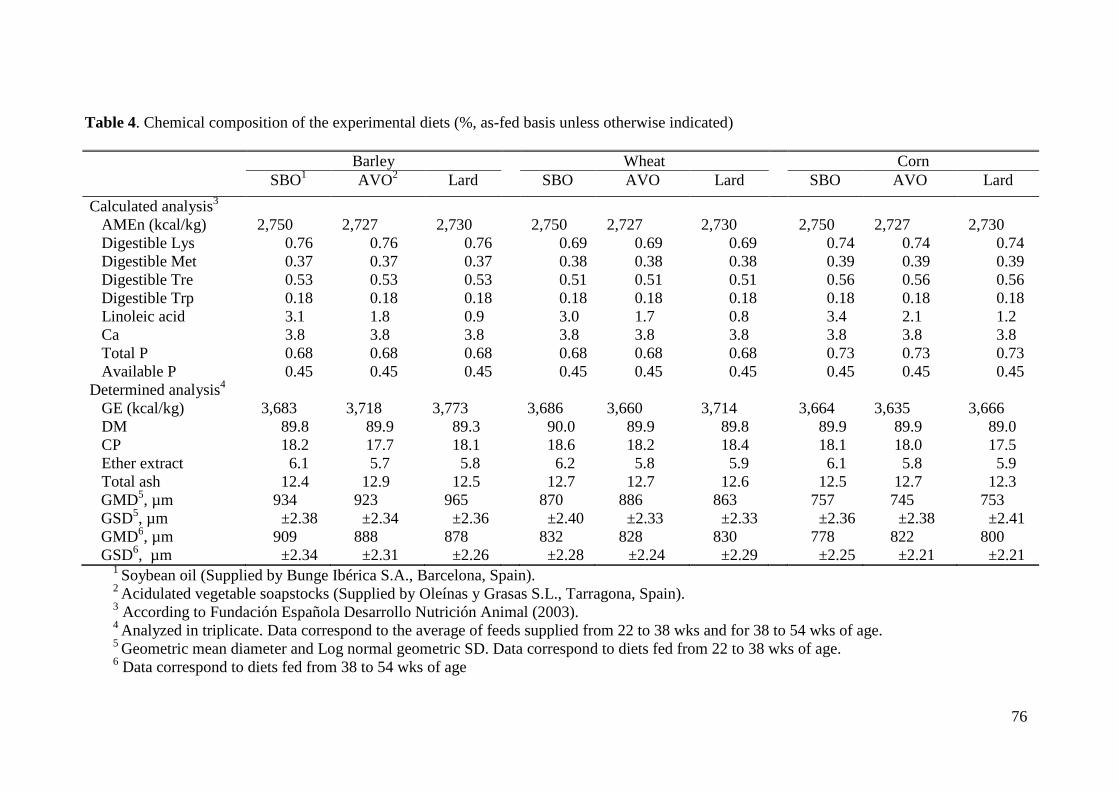
76
Table 4. Chemical composition of the experimental diets (%, as-fed basis unless otherwise indicated) Barley Wheat Corn SBO1 AVO2 Lard SBO AVO Lard SBO AVO Lard Calculated analysis3 AMEn (kcal/kg) 2,750 2,727 2,730 2,750 2,727 2,730 2,750 2,727 2,730 Digestible Lys 0.76 0.76 0.76 0.69 0.69 0.69 0.74 0.74 0.74 Digestible Met 0.37 0.37 0.37 0.38 0.38 0.38 0.39 0.39 0.39 Digestible Tre 0.53 0.53 0.53 0.51 0.51 0.51 0.56 0.56 0.56 Digestible Trp 0.18 0.18 0.18 0.18 0.18 0.18 0.18 0.18 0.18 Linoleic acid 3.1 1.8 0.9 3.0 1.7 0.8 3.4 2.1 1.2 Ca 3.8 3.8 3.8 3.8 3.8 3.8 3.8 3.8 3.8 Total P 0.68 0.68 0.68 0.68 0.68 0.68 0.73 0.73 0.73 Available P 0.45 0.45 0.45 0.45 0.45 0.45 0.45 0.45 0.45 Determined analysis4 GE (kcal/kg) 3,683 3,718 3,773 3,686 3,660 3,714 3,664 3,635 3,666 DM 89.8 89.9 89.3 90.0 89.9 89.8 89.9 89.9 89.0 CP 18.2 17.7 18.1 18.6 18.2 18.4 18.1 18.0 17.5 Ether extract 6.1 5.7 5.8 6.2 5.8 5.9 6.1 5.8 5.9 Total ash 12.4 12.9 12.5 12.7 12.7 12.6 12.5 12.7 12.3 GMD5, µm 934 923 965 870 886 863 757 745 753 GSD5, µm ±2.38 ±2.34 ±2.36 ±2.40 ±2.33 ±2.33 ±2.36 ±2.38 ±2.41 GMD6, µm 909 888 878 832 828 830 778 822 800 GSD6, µm ±2.34 ±2.31 ±2.26 ±2.28 ±2.24 ±2.29 ±2.25 ±2.21 ±2.21
1 Soybean oil (Supplied by Bunge Ibérica S.A., Barcelona, Spain). 2 Acidulated vegetable soapstocks (Supplied by Oleínas y Grasas S.L., Tarragona, Spain). 3 According to Fundación Española Desarrollo Nutrición Animal (2003). 4 Analyzed in triplicate. Data correspond to the average of feeds supplied from 22 to 38 wks and for 38 to 54 wks of age. 5 Geometric mean diameter and Log normal geometric SD. Data correspond to diets fed from 22 to 38 wks of age. 6 Data correspond to diets fed from 38 to 54 wks of age
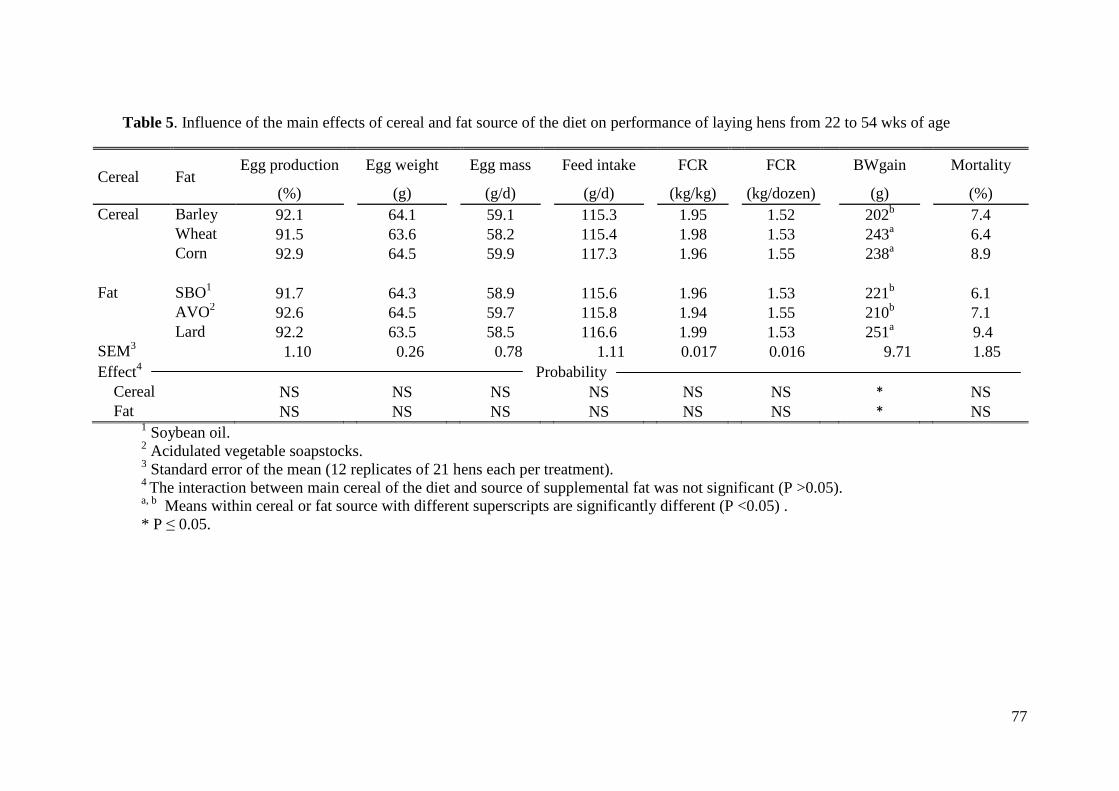
77
Table 5. Influence of the main effects of cereal and fat source of the diet on performance of laying hens from 22 to 54 wks of age
Cereal Fat Egg production
Egg weight
Egg mass
Feed intake
FCR
FCR
BWgain Mortality
(%) (g) (g/d) (g/d) (kg/kg) (kg/dozen) (g) (%) Cereal Barley 92.1 64.1 59.1 115.3 1.95 1.52 202b 7.4 Wheat 91.5 63.6 58.2 115.4 1.98 1.53 243a 6.4 Corn 92.9 64.5 59.9 117.3 1.96 1.55 238a 8.9 Fat SBO1 91.7 64.3 58.9 115.6 1.96 1.53 221b 6.1 AVO2 92.6 64.5 59.7 115.8 1.94 1.55 210b 7.1 Lard 92.2 63.5 58.5 116.6 1.99 1.53 251a 9.4 SEM3 1.10 0.26 0.78 1.11 0.017 0.016 9.71 1.85 Effect4 Probability
Cereal NS NS NS NS NS NS * NS
Fat NS NS NS NS NS NS * NS 1 Soybean oil. 2 Acidulated vegetable soapstocks. 3 Standard error of the mean (12 replicates of 21 hens each per treatment). 4 The interaction between main cereal of the diet and source of supplemental fat was not significant (P >0.05). a, b Means within cereal or fat source with different superscripts are significantly different (P <0.05) . * P ≤ 0.05.
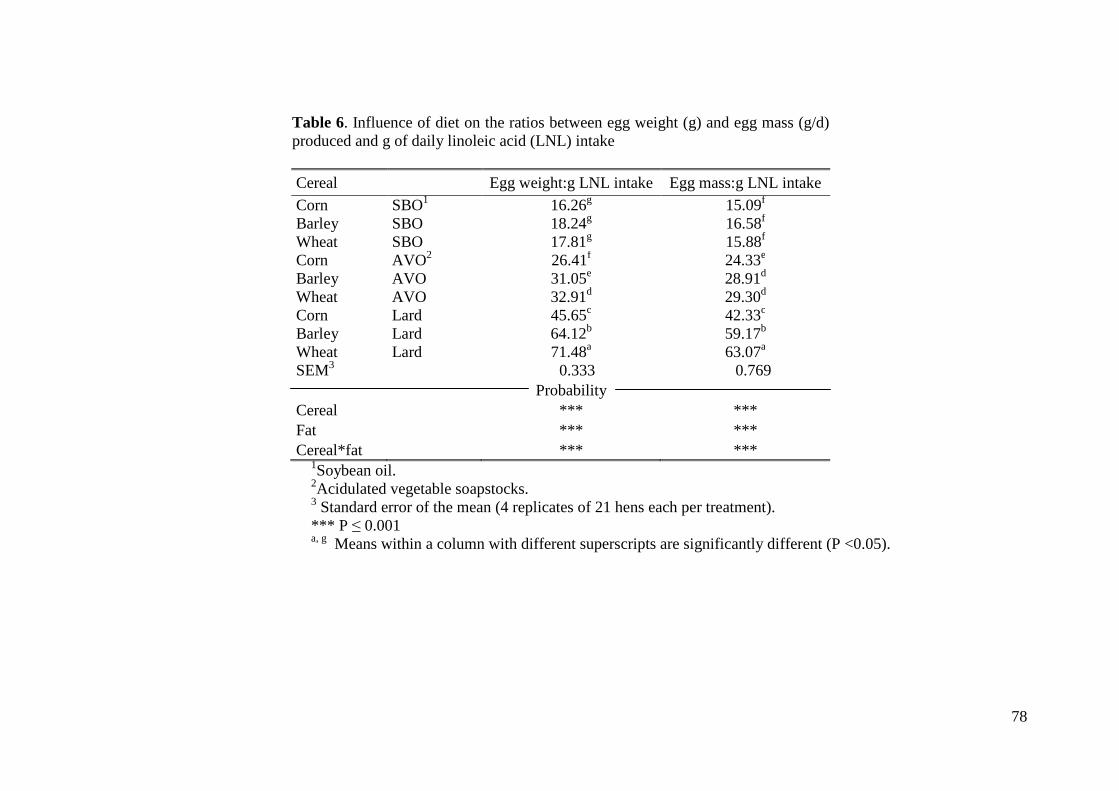
78
Table 6. Influence of diet on the ratios between egg weight (g) and egg mass (g/d) produced and g of daily linoleic acid (LNL) intake
Cereal
Egg weight:g LNL intake Egg mass:g LNL intake
Corn SBO1 16.26g 15.09f Barley SBO 18.24g 16.58f Wheat SBO 17.81g 15.88f Corn AVO2 26.41f 24.33e Barley AVO 31.05e 28.91d Wheat AVO 32.91d 29.30d Corn Lard 45.65c 42.33c Barley Lard 64.12b 59.17b Wheat Lard 71.48a 63.07a SEM3 0.333 0.769
Probability Cereal *** *** Fat *** *** Cereal*fat *** ***
1Soybean oil. 2Acidulated vegetable soapstocks.
3 Standard error of the mean (4 replicates of 21 hens each per treatment). *** P ≤ 0.001 a, g Means within a column with different superscripts are significantly different (P <0.05).
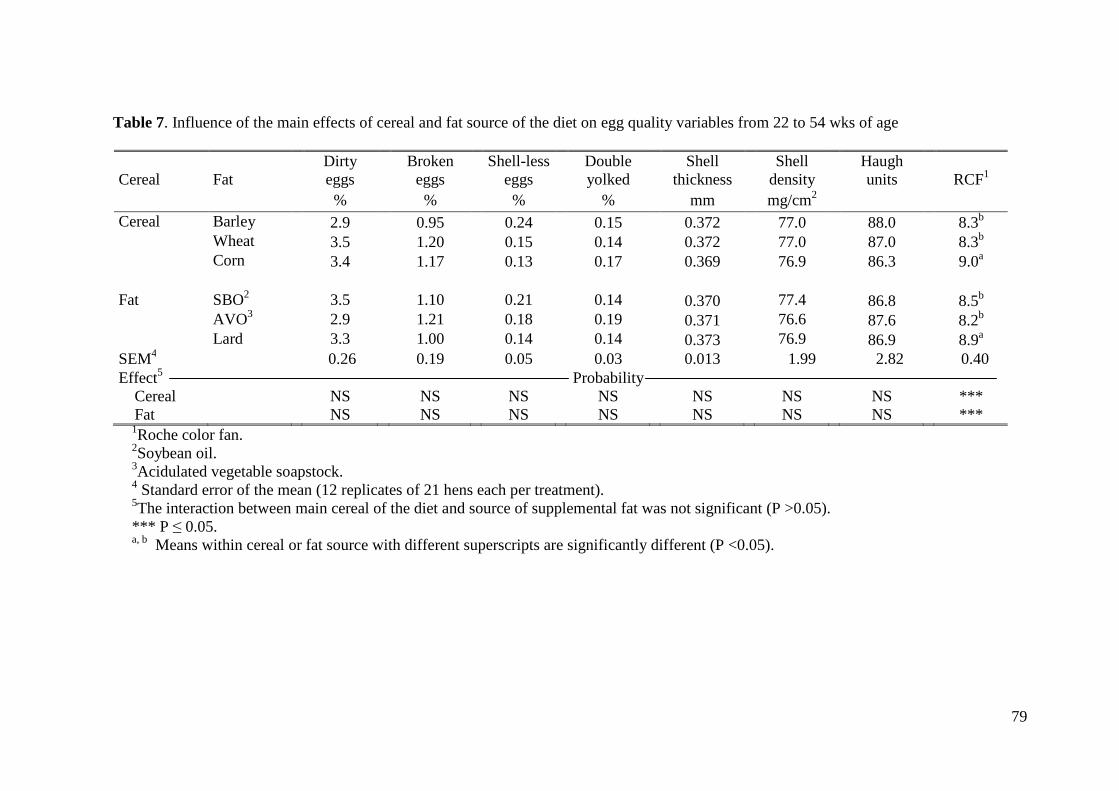
79
Table 7. Influence of the main effects of cereal and fat source of the diet on egg quality variables from 22 to 54 wks of age Cereal
Fat
Dirty eggs
Broken eggs
Shell-less eggs
Double yolked
Shell thickness
Shell density
Haugh units RCF1
% % % % mm mg/cm2 Cereal Barley 2.9 0.95 0.24 0.15 0.372 77.0 88.0 8.3b Wheat 3.5 1.20 0.15 0.14 0.372 77.0 87.0 8.3b Corn 3.4 1.17 0.13 0.17 0.369 76.9 86.3 9.0a Fat SBO2 3.5 1.10 0.21 0.14 0.370 77.4 86.8 8.5b AVO3 2.9 1.21 0.18 0.19 0.371 76.6 87.6 8.2b Lard 3.3 1.00 0.14 0.14 0.373 76.9 86.9 8.9a SEM4 0.26 0.19 0.05 0.03 0.013 1.99 2.82 0.40 Effect5 Probability
Cereal NS NS NS NS NS NS NS *** Fat NS NS NS NS NS NS NS *** 1Roche color fan. 2Soybean oil. 3Acidulated vegetable soapstock.
4 Standard error of the mean (12 replicates of 21 hens each per treatment). 5The interaction between main cereal of the diet and source of supplemental fat was not significant (P >0.05). *** P ≤ 0.05. a, b Means within cereal or fat source with different superscripts are significantly different (P <0.05).
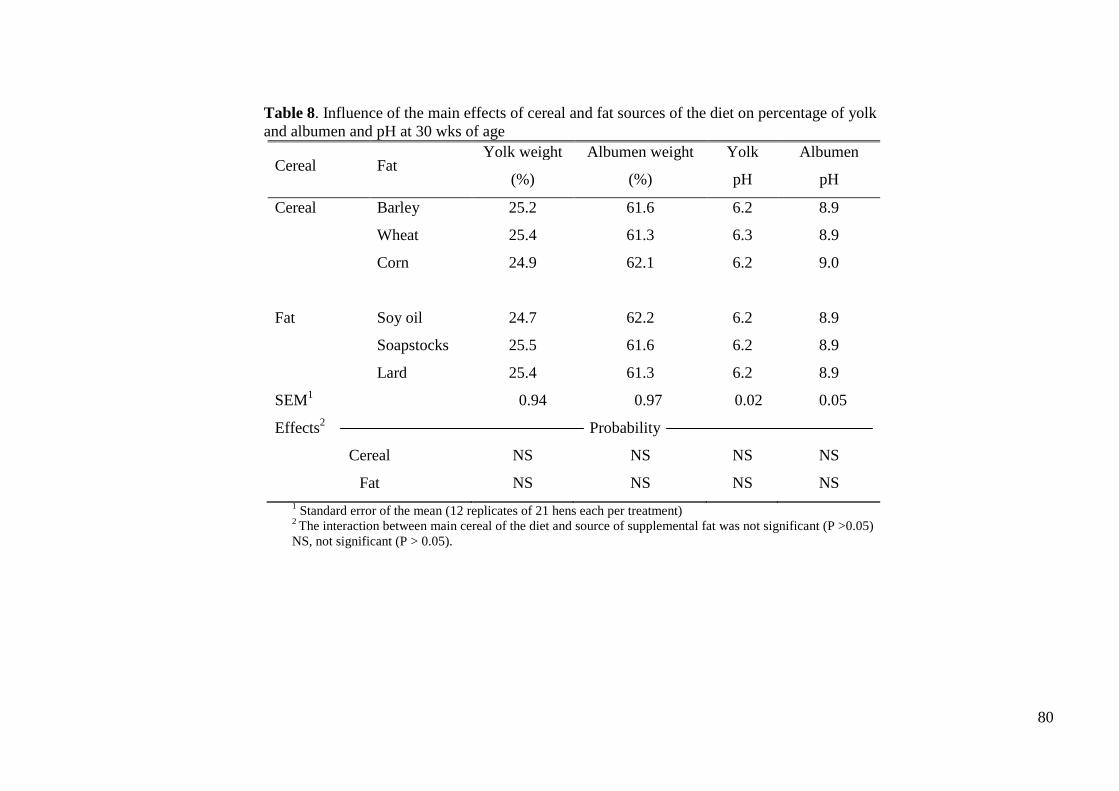
80
Table 8. Influence of the main effects of cereal and fat sources of the diet on percentage of yolk and albumen and pH at 30 wks of age
Cereal Fat Yolk weight
(%)
Albumen weight
(%)
Yolk
pH
Albumen
pH
Cereal Barley 25.2 61.6 6.2 8.9
Wheat 25.4 61.3 6.3 8.9
Corn 24.9 62.1 6.2 9.0
Fat Soy oil 24.7 62.2 6.2 8.9
Soapstocks 25.5 61.6 6.2 8.9
Lard 25.4 61.3 6.2 8.9
SEM1 0.94 0.97 0.02 0.05
Effects2 Probability
Cereal NS NS NS NS
Fat NS NS NS NS 1 Standard error of the mean (12 replicates of 21 hens each per treatment) 2 The interaction between main cereal of the diet and source of supplemental fat was not significant (P >0.05) NS, not significant (P > 0.05).
Chapter 2. Effects of the main cereal and type of fat of the diet
81
6. References
ASAE. 1995. Method of determining and expressing fineness of feed materials by
sieving. Pages 461-462 in Agriculture Engineers Yearbook of Standards. American
Society of Agriculture Engineers. Standard S319.2. Am. Soc. Agric. Eng., St.
Joseph, MO.
AOAC International. 2000. Official Methods of Analysis of Association of Official
Analytical Chemists International. 17th ed. AOAC Int., Gaithersburg, MD.
AOCS. 1998. Official Methods and Recommended Practices of the American Oil
Chemists Society. 5th ed., AOCS, Champaign, IL.
Bábolna Tetra. 2009. Commercial Layer Hybrids Management Guide. Tetra-SL. Bábolna
Tetra Ltd, Petófy, Hungary.
Berg, L. R. 1959. Enzyme supplementation of barley diets for laying hens. Poult. Sci.
38:1132-1139.
Boletín Oficial del Estado. 1995. Real Decreto 2257/1994 por el que se aprueba los
métodos oficiales de análisis de piensos o alimentos para animales y sus primeras
materias. BOE 52:7161-7237.
Boletín Oficial del Estado. 2005. Real Decreto 1201/2005 sobre protección de los
animales utilizados para experimentación y otros fines científicos. BOE 252:34367-
34391.
Bouvarel, I., Y. Nys, M. Panheleux, and P. Lescoat. 2010. Comment l’alimentation des
poules influence la quite des oeufs. INRA Prod. Anim. 23:167-182.
Çiftci, I., E. Yenice, and H. Eleroglu. 2003. Use of triticale alone and in combination with
wheat or maize: Effects of diet type and enzyme supplementation on hen
performance, egg quality, organ weights, intestinal viscosity and digestive system
characteristics. Anim. Feed Sci. Technol. 105:149-161.
Chapter 2. Effects of the main cereal and type of fat of the diet
82
Craig, L.W. and T. Goodman. 1993. Utilization of feed enzymes in laying hen rations. J.
Appl. Poult. Res. 2:68-74.
Coon, C. N., I. Obi, and M. L. Hamre. 1988. Use of barley in laying hens diets. Poult.
Sci. 67:1306-1313.
European Council Directive. 2006. Certain marketing standards for eggs. Chapter II:
Grades of eggs. Article 7: Grading of grade A eggs of regulation (EC) Nº.
2295/2003, Brussells, Belgium.
Francesch, M., A.M. Pérez-Vendrell, E. Esteve-García, and J. Brufau. (1995). Enzyme
supplementation of a barley and sunflower-based diet on laying hen performance. J.
Appl. Poult. Res. 4:32-40.
Frikha, M., H. M. Safaa, M. P. Serrano, X. Arbe, and G. G. Mateos. 2009. Influence of
the main cereal and feed form of the diet on performance and digestive tract of
brown-egg laying pullets. Poult. Sci. 88:994–1002.
Frikha, M., H. M. Safaa, M. P. Serrano, E. Jiménez-Moreno, and G. G. Mateos. 2011.
Influence of the main cereal of the diet and particle size of the cereal on
peroductive performance and digestive traits of brown-egg laying pullets. Anim.
Feed. Sci. Technol. 164:106-115.
Fundación Española Desarrollo Nutrición Animal. 2003. Normas FEDNA para la
Formulación de Piensos Compuestos. C. de Blas, G. G. Mateos, and P. G. Rebollar,
ed. Fund. Esp. Desarro. Nutr. Anim., Madrid, Spain.
Fundación Española Desarrollo Nutrición Animal. 2008. Necesidades Nutricionales para
Avicultura: Pollos de Carne y Aves de Puesta. In: R. Lázaro and G. G. Mateos
ed. Fund. Esp. Desarro. Nutr. Anim., Madrid, Spain.
García, M., R. Lázaro, M. A. Latorre, M. I. Gracia, and G. G. Mateos 2008. Influence of
enzyme supplementation and heat processing of barley on digestive traits and
productive performance of broilers. Poult. Sci. 87:940-948.

Chapter 2. Effects of the main cereal and type of fat of the diet
83
Grobas, S., G. G. Mateos, and J. Mendez. 1999a. Influence of dietary linoleic acid on
productive and egg weight of eggs and egg components in young brown hens. J.
Appl. Poult. Res. 8:177-184.
Grobas, S., J. Mendez, C. De Blas, and G. G. Mateos. 1999b. Influence of dietary energy,
supplemental fat and linoleic acid concentration on performance of laying hens at
two ages. Br. Poult. Sci. 40:681-687.
Grobas, S., J. Mendez, C. De Blas, and G. G. Mateos. 1999c. Laying hen productivity as
affected by energy, supplemental fat, and linoleic acid concentration of the diet.
Poult. Sci. 78:1542–1551.
Grobas, S., J. Méndez, R. Lazaro, C. de Blas, and G. G. Mateos. 2001. Influence of
source and percentage of fat added to diet on performance and fatty acid
composition of egg yolks of two strains of laying hens. Poult. Sci. 80:1171-1179.
Gutiérrez-Álamo, A., P. Pérez de Ayala, M. W. A. Verstegen, L.A. Den Hartog, and M. J.
Villamide. 2008. Variability in wheat: factors affecting its nutritional value.
World’s Poult. Sci. J. 64:20–39.
H & N International, 2008. Brown Nick Management Guide. H & N International,
Cuxhaven, Germany.
ISA Brown, 2011. Nutrition Management Guide. Institut de Selection Animale. B.V,
Boxmeer, The Netherlands.
Jamroz, D., J. Skokupinska, J. Orda, A. Wiliczkiewicz, and A. M. Klunter. 2001. Use of
wheat, barley or triticale in feed for laying hens supplemented with carbohydrates
derived from Trichoderma longibrachiatum. J. Appl. Anim. Res. 19:255-263.
Jensen, L. S., J. B. Allred, R. E. Fry, and J. McGinnis, 1958. Evidence for an unidentified
factor necessary for maximum egg weight in chickens. J. Nutr. 65:219-233.
Chapter 2. Effects of the main cereal and type of fat of the diet
84
Lázaro, R., M. García, M. J. Araníbar, and G. G. Mateos. 2003. Effect of enzyme
addition to wheat, barley and rye based diets on nutrient digestibility and
performance of laying hens. Br. Poult. Sci. 44:256-265.
Lohmann, 2010. Management Guide for Lohmann Brown-Classic. Lohmann Tierzucht.
GMBH. Cuxhaven, Germany.
Mateos, G. G. and. J. L. Sell. 1980a. Influence of graded levels of fat on utilization of
pure carbohydrate by the laying hen. J. Nutr. 110:1894-1903.
Mateos, G. G. and. J. L. Sell. 1980b. Influence of carbohydrate and supplemental fat
source on the metabolizable energy of the diet. Poult. Sci. 59:2129-2135.
Mateos, G. G. and. J. L. Sell. 1981. Nature of the extrametabolic effect of supplemental
fat used in semipurified diets for laying hens. Poult. Sci. 60:1925-1930.
Mathlouthi, N., S. Mallet, L. Saulnier, B. Quemener, and M. Larbier. 2002. Effect of
xylanase and β-glucanase addition on performance, nutrient digestibility and
physico-chemical conditions in the small intestine contents and caecal microflora of
broiler chickens fed a wheat and barley-based diet. Anim. Res. 51:395–406.
NRC. 1994. Nutrient Requirements of Poultry. 9 threv. ed. Natl. Acad. Press,
Washington, DC.
Pirgozliev, V. R., C. L. Birch, S. P. Rose, P. S. Kettlewell, and M. R. Bedford. 2003.
Chemical composition and the nutritive quality of different wheat cultivars for
broiler chickens. Br. Poult. Sci. 44:464–475.
Ribeiro, B.R.C., L.J.C. Lara, N.C. Baiao, C.A.A. Lopez, M.A. Fiuza, S.V. Conçado, and
G.M.M. Silva. 2007. Effect of linoleic acid level in the diet on the weight,
composition and eclodibility of broiler breeders eggs. Arq. Bras. Med. Vet. Zootec.
59: 789-796.
Ruiz, N., J. E. Marion, R. D. Miles, and R. B. Barnett. 1987. Nutritive value of new
cultivars of triticale and wheat for broiler chick diets. Poult. Sci. 66:90–97.

Chapter 2. Effects of the main cereal and type of fat of the diet
85
SAS Institute. 1990. SAS STATs User's Guide: Version 6, 4th ed. SAS Inst. Inc., Cary,
NC.
Safaa, H. M., M. P. Serrano, D. G. Valencia, M. Frikha, E. Jiménez-Moreno, and G. G.
Mateos 2008. Productive performance and egg quality of brown egg-laying hens in
late phase of production as influenced by level and source of calcium in the diet.
Poult. Sci. 87:2043-2051.
Safaa, H. M., E. Jiménez-Moreno, D. G. Valencia, M. Frikha, M. P. Serrano and G. G.
Mateos 2009. Effect of main cereal of the diet and particle size of the cereal on
productive performance and egg quality of brown egg-laying hens in early phase of
production. Poult. Sci. 88:608-614.
Sanz, M., A. Flores, and C.J. Lopez-Bote. 1999. Effect of fatty acid saturation in broiler
diets on abdominal fat and breast muscle fatty acid composition and susceptibility
to lipid oxidation. Poult. Sci. 78:378-382.
Sanz, M., A. Flores, P. Perez de Ayala, and C.J. Lopez-Bote. 2000. Higher lipid
accumulation in broilers fed saturated fats than in those fed unsaturated fats. Br.
Poult. Sci. 40:95.101.
Scheideler, S.E., P. Weber, and D. Monsalve. 2010. Supplemental Vitamin E and
selenium effects on egg production and egg deposition of α-tocopherol and
selenium. J. Appl. Poult. Res. 19:354-360.
Scragg, R. H., N. B. Logan, and N. Geddes. 1987. Response of egg weight to the
inclusion of various fats in layer diets. Br. Poult. Sci. 28:15-21.
Shang, X. G., F. L. Wang, D. F. Li, J.D. Yin, and J. Y. Li. 2004. Effects of dietary
conjugated linoleic acid on the productivity of laying hens and egg quality during
refrigerated storage. Poult. Sci. 83:1688-1695.
Shutze, J.V., L. S. Jensen, and J. McGinnis. 1959. Further studies on unidentified
nutritional factors affecting egg size. Poult. Sci. 38:1247-1252.
Chapter 2. Effects of the main cereal and type of fat of the diet
86
Van Soest, P.J., J.B. Robertson, and A. Lewis. 1991. Methods for dietary fiber, neutral
detergent fiber, and nonsarch polysaccharides in relation to a nimal nutrition. J.
Dairy Sci. 74:3583-3597.
Vila, B., and E. Esteve-Garcia. 1996. Studies on acid oils and fatty acids for chickens. 1.
Influence of age, rate of inclusion and degree of saturation on fat digestibility and
metabolisable energy of acid oils. Br. Poult. Sci. 37:105-117.
Woodward, S. A., R. C. Fluck, M. D. Ouart, and D.M. Janky. 1987. Influence of Florida
301 wheat in laying hen diets on egg yolk rupture strength. Poult. Sci. 66:1414-
1416.
CHAPTER 3:
Effect of crude protein and fat content of diet
on productive performance and egg quality traits of
brown egg-laying hens with different initial body
POULTRY SCIENCE 91:1400
Chapter 3. Effect of crude protein and fat content of the diet
CHAPTER 3:
ffect of crude protein and fat content of diet
on productive performance and egg quality traits of
laying hens with different initial body
weight
(Experiment 2)
PUBLISHED IN:
POULTRY SCIENCE 91:1400-1405 doi:10.3382/ps.2011-01917
crude protein and fat content of the diet
87
ffect of crude protein and fat content of diet
on productive performance and egg quality traits of
laying hens with different initial body
Chapter 3. Effect of crude protein and fat content of the diet
88
1. Introduction
Diets for laying hens are formulated to meet the requirements for those indispensable
amino acid (AA ) that may limit egg production, namely Lys, Met, Thr, and TSAA.
According to NRC (1994), diets based on corn and soybean meal with 16.5% CP satisfy
the AA requirements of brown egg-laying hens consuming 110 g feed per day. However,
in many countries it is a common practice to formulate diets with CP levels in excess of
16.5%. In fact, several commercial guidelines for laying hens (H & N International, 2008;
Lohmann, 2010; Isabrown, 2011) recommend CP levels varying from 17.4% to 18.2%
(19.1 to 20.0 g CP/hen/d) for the first part of the production cycle. The reasons behind
this practice are unknown but might be related to the interest to maximize egg size and
reduce the possibility of a non-conventional indispensable AA (i.e., Arg, Ile, Val)
limiting egg weight and hen production. In this respect, Bouvarel et al. (2010) reported
that egg size was a function of the amount of CP ingested and that per each extra g of CP
ingested, egg weight increased by 1.3 g. However, an excess of CP in the diet increases
nitrogen load to the environment (Summers, 1993; Blair et al., 1999; Roberts et al.,
2007a; Latshaw and Zhao, 2011), might impair feed efficiency (Vieira et al., 2004), and
often results in increased feed cost.
Supplemental fat may play an important role in improving productive performance and
egg size of laying hens at the beginning of the egg production cycle (Grobas et al., 1999b;
Pérez-Bonilla et al., 2011). The effects of supplemental fat on egg size depend on level
and type of fat used as well as on the linoleic acid (LNL ) content of the diet (Jensen et
al., 1958; Shutze et al., 1962; Grobas et al., 1999c; Bohnsack et al., 2002). In addition,
supplemental fat might improve the digestibility of other components of the diet (Mateos
and Sell, 1980a, b) as well as egg mass production and feed efficiency (Grobas et al.,
1999a; Bouvarel at al., 2010).

Chapter 3. Effect of crude protein and fat content of the diet
89
Body weight at the onset of egg production is a major factor influencing hen productivity.
Egg weight throughout the production cycle is largely determined by the initial BW of
the hen (Harms et al., 1982; Leeson and Summers, 1987). Therefore, heavier birds at the
onset of egg production will produce larger eggs during the whole laying cycle than small
birds (Summers and Leeson, 1983; El Zubeir and Mohammed, 1993). Because of genetic
improvement, pullets reach sexual maturity at younger ages than traditionally and
consequently, BW is reduced at this stage. The authors have not found any research
conducted in the last years comparing productive performance in brown egg-laying hens
varying in initial BW. The objectives of this research were to determine the effects of
increased dietary CP from 16.5% to 18.5% and fat content from 1.8 to 3.6% of otherwise
isonutritive diets, on productive performance and egg quality of Lohmann Brown egg-
laying hens differing in initial BW from 22 to 50 wk of age.
2. Materials and methods
2.1. Husbandry, Feeding Program, and Experimental Diets
All experimental procedures were approved by the animal Ethics Committee of the
Universidad Politécnica de Madrid and were in compliance with the Spanish guidelines
for the care and use of animals in research (Boletín Oficial del Estado, 2007).
In total, 672 Lohmann Brown hens were obtained at 20 wk of age from a
commercial flock (El Canto Agroalimentaria S.L, Toledo, Spain), weighed individually,
and classified as light (1,592 ± 75 g) or heavy (1,860 ± 86 g). These BW compared with
an expected value of 1,640 ± 57 g for similar type of birds at same age (Lohmann, 2010).
Within each BW group, hens were randomly distributed into 16 replicates formed by 21
birds housed in groups of 7 in 3 adjacent cages (600 × 575 mm; General Ganadera S.A,
Valencia, Spain) provided with an open trough feeder and 2 nipple drinkers. For 2 wk
Chapter 3. Effect of crude protein and fat content of the diet
90
prior to the beginning of the experiment (20-22 wk of age), the hens were fed a common
commercial diet based on corn and soybean meal. Room temperature was recorded daily
throughout the experiment with the minimum average value (20 ± 3ºC) recorded in
March (beginning of the experiment) and the maximum (27 ± 3ºC) recorded in July. The
lighting program consisted of 16 h light per day throughout the experiment. All the diets
were isocaloric (2,750 kcal AMEn/kg) and had similar digestible TSAA content. The
main difference among the first 3 diets was the CP content (16.5, 17.5, and 18.5%,
respectively). The last diet had also 18.5% CP content but included 3.6% fat rather than
1.8% fat. Adjustments in the ingredient compositionwere made to maintain constant the
nutritive value of all the diets. Because of the experimental design, diets with the higher
CP content had also more digestible Arg, Ile, Lys, Thr, and Val content than diets with
the lower CP content, but in all cases the level of all these AA were higher than
recommended by NRC (1994) and Fundacion Española Desarrollo Nutricion Animal
(2008)for brown laying hens. The cereal portion of these diets was ground using a
hammer mill provided with a 7.5 mm screen.
2.2. Analytical Evaluation of Ingredients and Feeds
Representative samples of the diets were ground using a laboratory mill (Model Z-I,
Retsch Stuttgart, Germany) provided with a 1-mm screen and analyzed for moisture by
oven-drying (method 930.01),total ash using a muffle furnace (method942.05), nitrogen
by combustion (method 990.03) using a LECO analyzer (Model FP-528, LECO, St.
Joseph, MI) and Ca and P by spectrophotometry (methods 968.08 and 965.17)as
described by AOAC International (2000). Ether extract was determined by Soxhlet
analysis (method 4b) after 3N HCl acid hydrolysis as indicated inBoletín Oficial del
Estado (1995) and GE was determined using an isoperibol calorimeter bomb (Model
1356, Parr Instrument Company, Moline, IL). The geometric mean diameter of the diets

Chapter 3. Effect of crude protein and fat content of the diet
91
was determined in triplicate in 100 g samples using a Retsch shaker (Retsch, Stuttgart,
Germany) provided with 8 sieves ranging in mesh from 5,000 to 40 µm according to the
methodology outlined by ASAE (1995). The ingredient composition and the calculated
and determined chemical analyses of the diets are presented in Table 1.
2.3. Productive performance and egg quality
Eggs were collected daily and egg weight was measured in all eggs produced the last 2
days of each of the seven 28-d periods. Feed intake was controlled by replicate every 28-
d period, and mortality was recorded as produced. From these data, ADFI, egg
production, egg weight, egg mass, and feed conversion ratio (FCR) per kilogram and per
dozen of eggs were calculated by period and cumulatively. In addition, all the hens were
weighed individually at the beginning of the experiment and at the end of each of the
seven 28-d laying periods, and the BW gain (BWG) per replicate was calculated.
The number of dirty, broken, and shell-less eggs was recorded daily by replicate.
An egg was considered dirty when a spot of any kind or size was detected on the shell, as
evaluated by two independent observers blind to treatment. Egg quality was measured in
10 eggs collected randomly from each replicate the last day of each 28-d period. Eggs
were individually weighed and broken, and albumen and shell quality variables were
determined using an egg multitester equipment (QCM-System, Technical Services and
Supplies, Dunnington, York, UK). Albumen height was measured using an electronic
height gauge (QCH-System, TSS). Yolk color was determined with the Roche Color Fan
(QCC-System, TSS) as indicated by Vuilleumier et al. (1969). Shell density (mg/cm2)
was calculated as the weight of the dry shell divided by the surface area using the QCM
System equipment (Technical Services and Supplies, Dunnington, York, UK). In
addition, shell thickness was measured in 5 eggs per replicate chosen at random at the
end of each 28-d period using a digital micrometer (model IT-014UT, Mitotuyo,
Chapter 3. Effect of crude protein and fat content of the diet
92
Kawasaki, Japan). The average of three measurements taken at the centre of the egg was
used forfurther evaluation.
2.4. Statistical analysis
The experimental design was completely randomized with 8 treatments arranged
factorially and the main effects (diet and initial BW of the pullets) and the interaction
were analyzed by ANOVA using the GLM procedure of SAS Institute (1990). No
significant interactions between main effects were observed for any of the traits studied
and therefore, the interaction was removed from the model.The homogeneity of the
variance of the data for all traits was tested using the Levene´s Test (Hovtest option of
GLM procedures). All data on performance and egg quality traits were homogeneous,
except for mortality and therefore, mortality data were analysed after arcsin
transformation. When the effects of diet and BW of the hens were significant, a Tukey
test was used to make pairwise comparisons to separate treatment means. Results in
tables are presented as means, and differences were considered significant at P < 0.05.
3. Results
No significant interactions between dietary treatment and period were detected for any of
the variables studied and therefore, only cumulative data are discussed. Mortality was
considered normal (4.9%) and not related to treatment. Diet did not affect any of the
productive performance traits studied. However, ADFI (120.6 vs. 113.9 g; P< 0.001), egg
production (92.5 vs. 89.8%; P< 0.01), egg weight (64.9 vs. 62.4 g; P< 0.001), and egg
mass (60.0 vs. 56.1 g; P< 0.001) were higher for the heavier than for the lighter hens
(Table 2). The FCR per kilogram of eggs was not affected by initial BW of the hens but
FCR per dozen of eggs was better for the lighter than for the heavier hens (1.52 vs. 1.57;
P< 0.01). Also, cumulative BWG was higher for the lighter than for the heavier hens (289
Chapter 3. Effect of crude protein and fat content of the diet
93
vs. 233 g; P< 0.01). Data by period on the main effects of initial BW of the hens onADFI,
egg production, egg weight, FCR, and BWG of the hens are shown in Figure 1. Feed
intake and egg weight were higher (P< 0.001) for the heavier than for the lighter hens in
all periods. Body weight gain was higher (P < 0.001) for the lighter than for the heavier
hens from 22 to 26 wk of age but no significant differences were found after this period.
Incidence of dirty eggs, percentage of broken and shell-less eggs, albumen
quality, shell density, and shell thickness were not affected by diet or by the initial BW of
the hens. However, yolk pigmentation was greater (P< 0.01) in eggs from hens fed the
1.8% fat diets than in eggs from hens fed the 3.6% fat diet (Table 3).
4. Discussion
Crude protein content of the diet did not affect any of the productive performance traits
studied, results that are consistent with NRC (1994) recommendations, indicating that the
requirements for all indispensable AA are satisfied when the ADFI of the hens was 110 g
of a diet with 16.5% CP (corresponding to a CP intake of 18.1 g CP/d). In fact, in the
current study, the average CP intake of the hens fed the 16.5% CP diets was in excess of
NRC (1994) recommendations (18.6 g/d for the light pullets and 19.8 g/d for the heavy
pullets, corresponding to a feed intake of 112.6 and 119.7 g/hen/d, respectively). Kling et
al. (1985) compared in two different experiments with brown egg-laying hens from
housing to 66 wk of age, 4 diets organized factorially with 2 levels of Met (0.3% vs.
0.4%) and 2 levels of CP (17% and 19%) and observed that an increase in the CP content
of the diet did not affect hen performance in any of the two experiments. Similarly,
Junqueira et al. (2006) reported that increasing the CP of the diet of molted brown egg-
laying hens from 16 to 20%, while maintaining constant the AMEn concentration and the
Met content, did not affect performance.Also, Summers and Leeson (1983) reported
similar performance and egg size of Single Comb White Leghorn (SCWL) hens from 20

Chapter 3. Effect of crude protein and fat content of the diet
94
to 32 wk of age fed dietsbalanced for AMEn and Met that contained 17% or 22% CP.In
contrast, Roberts et al. (2007b) reported that a decrease in CP content (19.8% to 19.1%
from 23 to 31 wk, 18.1% to 17.1% from 32 to 44 wk, and 16.9% to 15.8% from 45 to 58
wk of age) of isoenergetic diets with similar indispensable AA profile, reduced egg
production, egg mass, and feed efficiency of SCWL.However, egg weight, ADFI, and
BWG were not affected by a decrease in CP content. Keshavarz (1995), using isocaloric
diets organized as 3 × 3 factorial, reported that an increase in CP content (17, 19, and
21%) of diets with increased levels of Met (0.34, 0.38, and 0.42%) did not affect egg
production, egg weight, ADFI, or BWG of SCWL hens from 18 to 38 wk of age.
However, it was observed that from 26 to 34 wk of age egg weight increased when hens
were fed the 21% CP diets. The results of the current experiment support that
indispensable AA intake rather than nitrogen intake “per se” modulates egg size and hen
performance. Moreover, the data indicate than an excess of CP intake did not impaired
feed efficiency. In contrast, Vieira et al. (2004) reported that feed efficiency was impaired
in broilers from 14 to 35 d of age when the level of CP of diets balanced for
indispensable AA, was increased from 20.5% to 26%.
The effects of supplemental fat on ADFI, egg production, and egg weight are a
subject of debate. Usually, an increase in energy concentration of the diet is accompanied
by an increase in supplemental fat and in LNL content (Grobas et al., 2001; Frikha et al.,
2009). Consequently, the 3 effects (AMEn concentration, level of supplemental fat, and
LNL content) are confounded and can not be separated under most practical feeding
conditions. In the current experiment, an increase in supplemental fat from 1.8 to 3.6% in
isocaloric diets in which LNL was in excess of hen requirements (1.9 to 2.5%) did not
affect egg weight or productive performance of the hens, in agreement with the report of
Grobas et al. (1999c). Keshavarz (1995) compared in SCWL from 18 to 38 wk of age
isocaloric diets based on corn or barley that included 3 sources of fat (tallow, blended fat,
Chapter 3. Effect of crude protein and fat content of the diet
95
or corn oil) at 2 levels of supplementation (2% and 4%) with an unsupplemental control
diet.The author reported no difference in egg weight, egg production, or BWG among
treatments, consistent with the results of the current trial. Keshavarz and Nakajima (1995)
reported that the inclusion of 4% of a blended animal and vegetable fat in isocaloric diets
for SCWL from 18 to 34 wk of age increased egg weight and BWG as compared with a
control non-fat supplemented diet. However, in this research egg production was reduced
with fat supplementation. Bohnsack et al. (2002) compared diets supplemented with 2, 4,
and 6% of either corn oil or poultry fat to SCWL hens from 26 to 38 wk of age and
reported that hens fed 4 or 6% fat produced heavier eggs than those fed 0 or 2% fat, but
that egg production was not affected. However, in this research the concentration in
AMEn of the diets increased with the level of supplemental fat and therefore, the effects
of AMEn concentration of the diet and level of supplemental fat were confounded.
Grobas et al. (1999b) reported that the supplementation of isonutritive diets for Isa Brown
hens with 4% of different mixtures of acid oil soapstocks and animal fat, while
maintaining constant the LNL level at 1.15%, increased egg weight in young hens (22 to
26 wk of age) but not in older hens (74 to 78 wk of age). Safaa et al. (2008) reported that
an increase in added fat from 1.1 to 3.0% while maintaining constant the AMEn
concentration (2,700 kcal/kg) of the diets improved egg production, egg weight, and FCR
per kilogram of eggs in Hy-Line Brown egg-laying hens from 59 to 70 wk of age.
However, no effects were observed in a second experiment using similar type of diets in
Lohmann Brown hens of similar age.
Pullets that were heavier at the onset of egg production ate more feed and produced
heavier eggs than pullets that were lighter. However, FCR per kilogram of eggs was not
affected and in fact, FCR per dozen of eggs was better for the lighter pullets. The authors
have not found any recent report on the effects of initial BW of brown egg-laying pullets
on egg production. In the current experiment, ADFI increased 2.7 g and egg weight 0.93
Chapter 3. Effect of crude protein and fat content of the diet
96
g per each 100 g increase in initial BW of the pullets. Similar results have been reported
by Harms et al. (1982) in two separate experiments with SCWL hens from 31 to 47 wk of
age. In a first experiment, these authors reported an increase of 0.88 g in egg weight per
each 100 g of extra initial BW in hens varying in BW from 1,411 g to 1,546 g whereas in
the second experiment, conducted with hens weighing 1,546 g and 1,684 g, the increase
was of 1.6 g. In both experiments egg production was similar and feed efficiency was
poorer for the heavier hens. Summers and Leeson (1983) compared egg performance of
SCWL pullets sorted by BW at 18 wk of age into 4 groups (1,107, 1,205, 1,281, and
1,383 g). They observed that from 19 to 25 wk of age, the heavier pullets laid more eggs
than the lighter pullets and that per each 100 g of extra initial BW, egg weight increased
by 0.9 g. Moreover, egg production decreased with the reduction in BW but FCR per
kilogram of eggs was not affected. Similarly, Leeson and Summers (1987) distributed
SCWL pullets into 3 BW groups; 997, 1,100, and 1,226 g at 15 wk of age in experiment 1
and 1,308, 1,411, and 1,564 g BW at 19 wk of age in experiment 2. The authors reported
that ADFI increased 3.2 g (experiment 1) and 3.6 g (experiment 2) per each 100 g of
extra BW from housing to 67 wk of age, values that were slightly higher than the value of
2.7 g observed in the current experiment. Keshavarz (1995) compared the performance of
light (1,151 g) and heavy (1,333 g) SCWL pullets from 18 to 62 wk of age and reported
similar egg production but a 2 g increase in feed intake and a 1.4 g increase in egg weight
per each 100 g of extra initial BW. Furthermore, the author reported that cumulative
BWG from 17 to 62 wk was 24.2% higher for the lighter than for the heavier hens,
consistent with the value of 20.8% reported in the current experiment.
Egg quality, including percentage of dirty eggs, albumen height, and egg shell traits were
not affected by dietary treatment or by the initial BW of the hens. The data agree with
results of Junqueira et al. (2006) who observed that an increase in CP content of the diet
did not affect Haugh units or egg shell thickness. Similar results have been reported for
Chapter 3. Effect of crude protein and fat content of the diet
97
egg shell quality by Wolford and Tanaka (1970). Also, Fariborz et al. (2007) comparing
isoenergetic diets containing 16.3 or 17.8% CP reported that albumen height, shell
thickness, and shell strength were not affected by the CP content of the diet. In fact,
Williams (1992) indicated that hen strain and age were the most important factors
affecting albumen quality and that nutrition did not have a great impact on this variable.
However, Hammershoj and Kjaer (1999) reported that Haugh units declined as the level
of CP of the diet increased from 13.7 to 17.9%. The authors did not give any explanation
for their finding.
Supplementation of the high CP diet with 3.6% fat did not affect any of the shell
and albumen quality traits studied. In broilers, Atteh et al. (1983) indicated that the
inclusion of saturated fats in the diet increased the formation of soaps between fatty acids
and the Ca salts, resulting in lower Ca retention. In the current experiment, no effects of
extra fat supplementation of the diet on shell quality were observed, data that agree with
results of Safaa et al. (2008) who reported similar egg shell quality in late phase of
production in hens fed diets with 1.1 or 3% supplemental fat (soy oil or palm oil).
Probably, the amount of Ca soaps present at the small intestine level in the hens of the
current experiment was limited, because the fat used was unsaturated and the soaps
formed may dissociate at the pH values encountered in this section of the gastrointestinal
tract. Yolk pigmentation was lower in eggs from hens fed the diet containing 3.6% fat
than in hens fed the diets containing 1.8% fat, a difference that was expected because
corn was included only in the 1.8% fat supplemented diets.
It is concluded that increasing the levels of CP of the diet from 16.5 to 18.5% and
of fat from 1.8 to 3.6% does not affect performance or egg quality in hens from 22 to 50
wk of age, irrespective of the initial BW of the pullets. Egg production, egg weight, and
ADFI are higher in heavier than in lighter hens but egg quality is not affected by the
initial BW of the hens. Moreover, FCR expressed as kilogram of feed per kilogram of
Chapter 3. Effect of crude protein and fat content of the diet
98
eggs is not affected by the initial BW of the pullets and in fact, FCR per dozen of eggs
improves with the lighter BW. Cumulative BWG is higher for the light BW group than
for the heavy BW group. Thus, the practice of increasing the CP content of the diet over
NRC (1994) recommendations to maximize egg weight and hen productivity is not
justified in any of the two groups of hens. In general, overall hen productivity is
improved when heavier hens are used, but the economical advantage of this practice
might depend on price difference between egg weight grades as well as on relative cost of
feed ingredients.
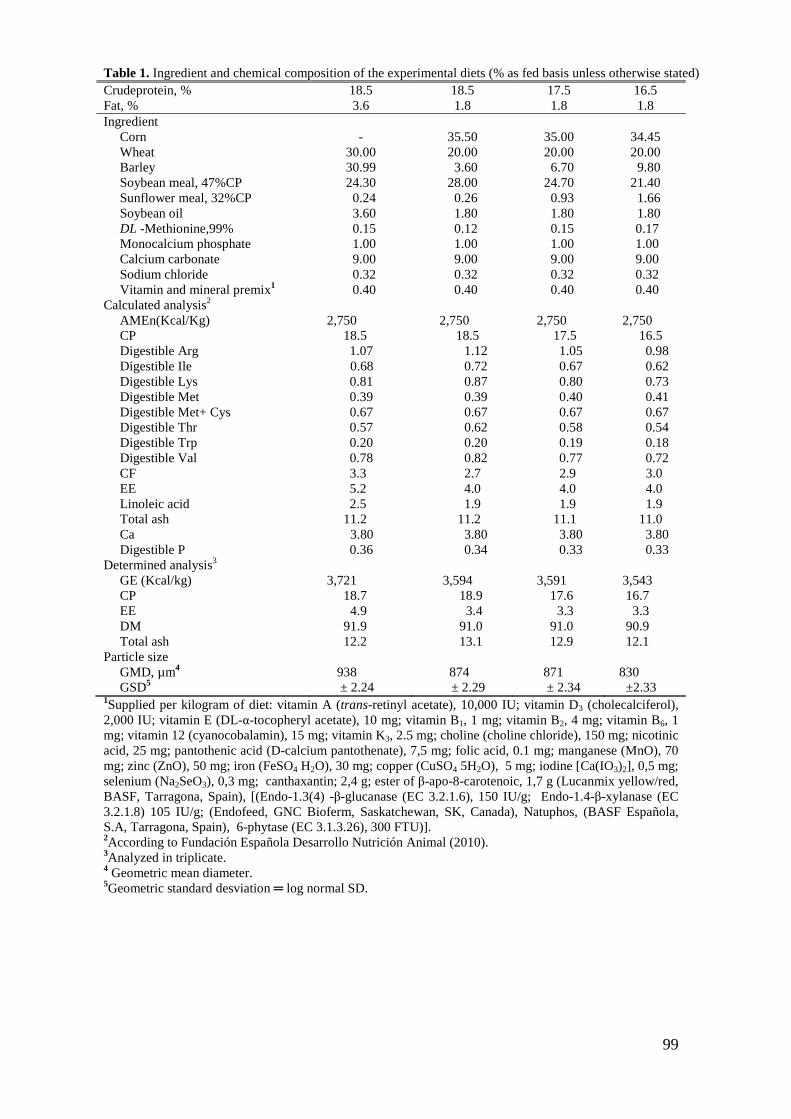
99
Table 1. Ingredient and chemical composition of the experimental diets (% as fed basis unless otherwise stated) Crudeprotein, % 18.5 18.5 17.5 16.5 Fat, % 3.6 1.8 1.8 1.8 Ingredient
Corn - 35.50 35.00 34.45 Wheat 30.00 20.00 20.00 20.00 Barley 30.99 3.60 6.70 9.80 Soybean meal, 47%CP 24.30 28.00 24.70 21.40 Sunflower meal, 32%CP 0.24 0.26 0.93 1.66 Soybean oil 3.60 1.80 1.80 1.80 DL -Methionine,99% 0.15 0.12 0.15 0.17 Monocalcium phosphate 1.00 1.00 1.00 1.00 Calcium carbonate 9.00 9.00 9.00 9.00 Sodium chloride 0.32 0.32 0.32 0.32 Vitamin and mineral premix1 0.40 0.40 0.40 0.40
Calculated analysis2 AMEn(Kcal/Kg) 2,750 2,750 2,750 2,750 CP 18.5 18.5 17.5 16.5 Digestible Arg 1.07 1.12 1.05 0.98 Digestible Ile 0.68 0.72 0.67 0.62 Digestible Lys 0.81 0.87 0.80 0.73 Digestible Met 0.39 0.39 0.40 0.41 Digestible Met+ Cys 0.67 0.67 0.67 0.67 Digestible Thr 0.57 0.62 0.58 0.54 Digestible Trp 0.20 0.20 0.19 0.18 Digestible Val 0.78 0.82 0.77 0.72 CF 3.3 2.7 2.9 3.0 EE 5.2 4.0 4.0 4.0 Linoleic acid 2.5 1.9 1.9 1.9 Total ash 11.2 11.2 11.1 11.0 Ca 3.80 3.80 3.80 3.80 Digestible P 0.36 0.34 0.33 0.33
Determined analysis3 GE (Kcal/kg) 3,721 3,594 3,591 3,543 CP 18.7 18.9 17.6 16.7 EE 4.9 3.4 3.3 3.3 DM 91.9 91.0 91.0 90.9 Total ash 12.2 13.1 12.9 12.1
Particle size GMD, µm4 938 874 871 830 GSD5 ± 2.24 ± 2.29 ± 2.34 ±2.33
1Supplied per kilogram of diet: vitamin A (trans-retinyl acetate), 10,000 IU; vitamin D3 (cholecalciferol), 2,000 IU; vitamin E (DL-α-tocopheryl acetate), 10 mg; vitamin B1, 1 mg; vitamin B2, 4 mg; vitamin B6, 1 mg; vitamin 12 (cyanocobalamin), 15 mg; vitamin K3, 2.5 mg; choline (choline chloride), 150 mg; nicotinic acid, 25 mg; pantothenic acid (D-calcium pantothenate), 7,5 mg; folic acid, 0.1 mg; manganese (MnO), 70 mg; zinc (ZnO), 50 mg; iron (FeSO4 H2O), 30 mg; copper (CuSO4 5H2O), 5 mg; iodine [Ca(IO3)2], 0,5 mg; selenium (Na2SeO3), 0,3 mg; canthaxantin; 2,4 g; ester of β-apo-8-carotenoic, 1,7 g (Lucanmix yellow/red, BASF, Tarragona, Spain), [(Endo-1.3(4) -β-glucanase (EC 3.2.1.6), 150 IU/g; Endo-1.4-β-xylanase (EC 3.2.1.8) 105 IU/g; (Endofeed, GNC Bioferm, Saskatchewan, SK, Canada), Natuphos, (BASF Española, S.A, Tarragona, Spain), 6-phytase (EC 3.1.3.26), 300 FTU)]. 2According to Fundación Española Desarrollo Nutrición Animal (2010). 3Analyzed in triplicate. 4 Geometric mean diameter. 5Geometric standard desviation ═ log normal SD.
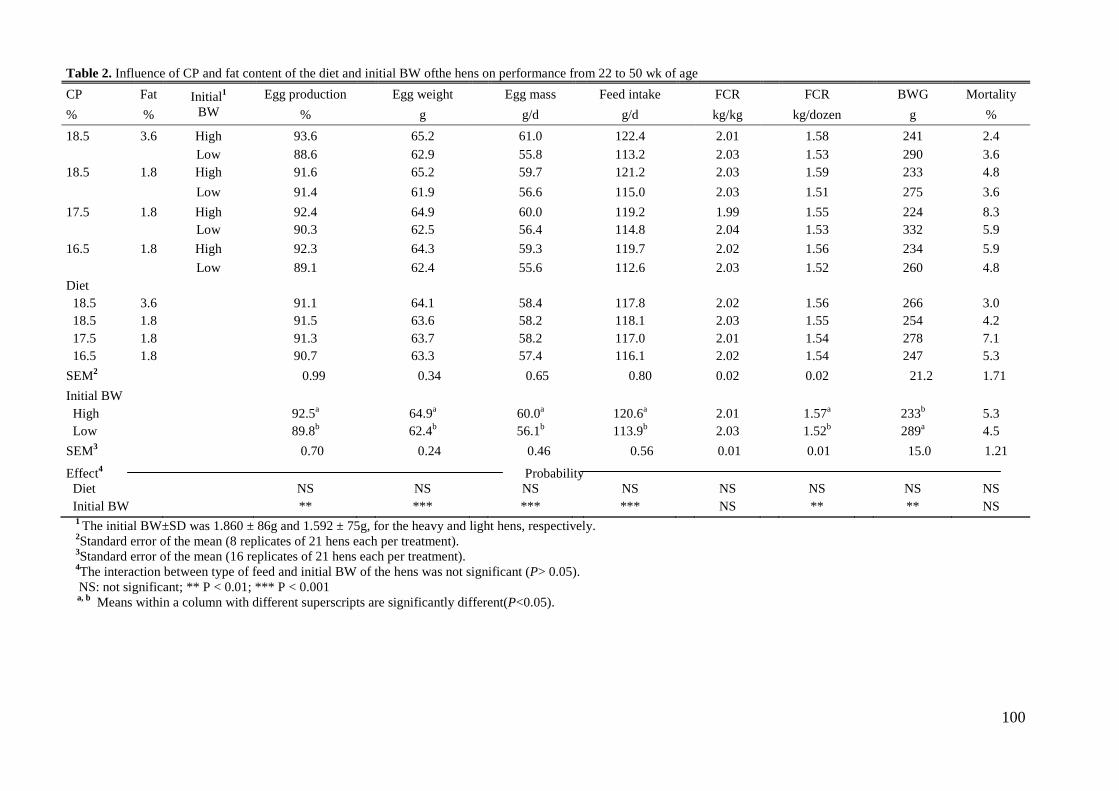
100
Table 2. Influence of CP and fat content of the diet and initial BW ofthe hens on performance from 22 to 50 wk of age
CP Fat Initial1 BW
Egg production
Egg weight
Egg mass
Feed intake
FCR
FCR
BWG Mortality
% % %
g
g/d
g/d
kg/kg
kg/dozen
g %
18.5 3.6 High 93.6
65.2
61.0
122.4
2.01
1.58
241 2.4
Low 88.6
62.9
55.8
113.2
2.03
1.53
290 3.6
18.5 1.8 High 91.6
65.2
59.7
121.2
2.03
1.59
233 4.8
Low 91.4
61.9
56.6
115.0
2.03
1.51
275 3.6
17.5 1.8 High 92.4
64.9
60.0
119.2
1.99
1.55
224 8.3
Low 90.3
62.5
56.4
114.8
2.04
1.53
332 5.9
16.5 1.8 High 92.3
64.3
59.3
119.7
2.02
1.56
234 5.9
Low 89.1
62.4
55.6
112.6
2.03
1.52
260 4.8
Diet
18.5 3.6
91.1
64.1
58.4
117.8
2.02
1.56
266 3.0
18.5 1.8
91.5
63.6
58.2
118.1
2.03
1.55
254 4.2 17.5 1.8
91.3
63.7
58.2
117.0
2.01
1.54
278 7.1
16.5 1.8
90.7
63.3
57.4
116.1
2.02
1.54
247 5.3
SEM2
0.99
0.34
0.65
0.80
0.02
0.02
21.2 1.71
Initial BW
High
92.5a
64.9a
60.0a
120.6a
2.01
1.57a
233b 5.3
Low
89.8b
62.4b
56.1b
113.9b
2.03
1.52b
289a 4.5
SEM3
0.70
0.24
0.46
0.56
0.01
0.01
15.0 1.21
Effect4 Probability
Diet
NS
NS
NS
NS
NS
NS
NS NS Initial BW
**
***
***
***
NS
**
** NS
1 The initial BW±SD was 1.860 ± 86g and 1.592 ± 75g, for the heavy and light hens, respectively. 2Standard error of the mean (8 replicates of 21 hens each per treatment). 3Standard error of the mean (16 replicates of 21 hens each per treatment).
4The interaction between type of feed and initial BW of the hens was not significant (P> 0.05). NS: not significant; ** P < 0.01; *** P < 0.001
a, b Means within a column with different superscripts are significantly different(P<0.05).
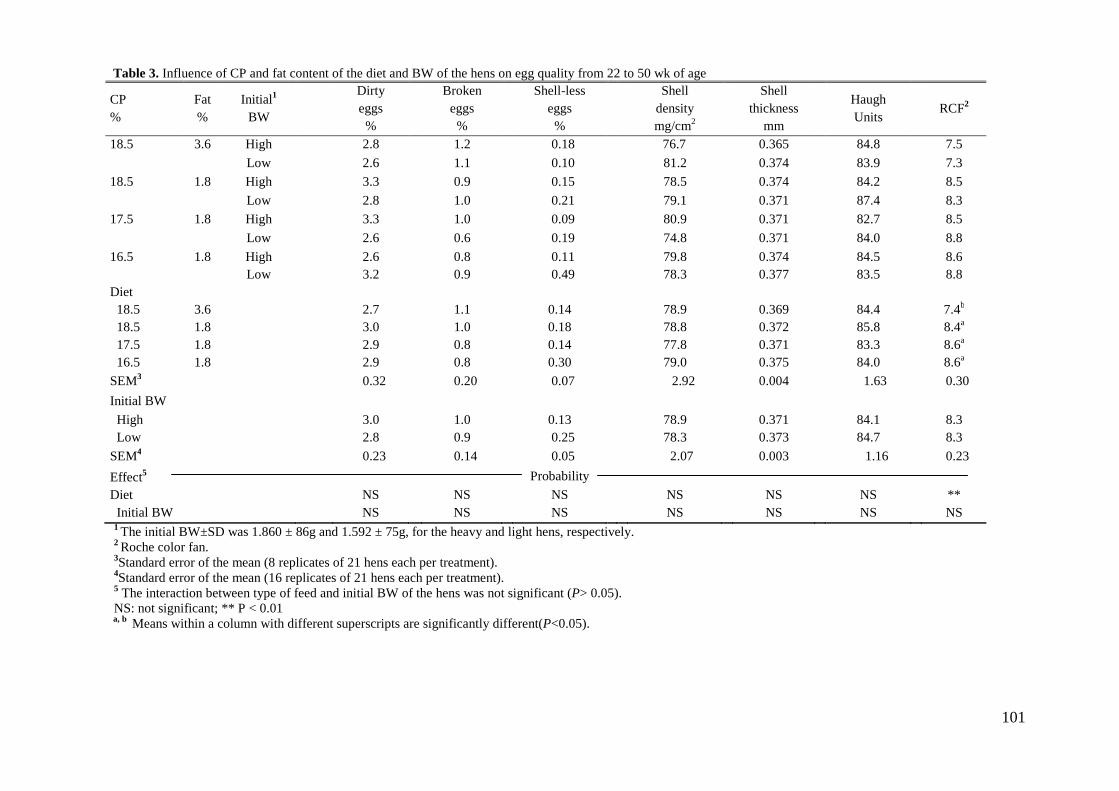
101
Table 3. Influence of CP and fat content of the diet and BW of the hens on egg quality from 22 to 50 wk of age
CP %
Fat %
Initial1 BW
Dirty eggs %
Broken eggs %
Shell-less
eggs %
Shell
density mg/cm2
Shell
thickness mm
Haugh Units
RCF2
18.5 3.6 High 2.8 1.2
0.18
76.7
0.365
84.8
7.5
Low 2.6 1.1
0.10
81.2
0.374
83.9
7.3
18.5 1.8 High 3.3 0.9
0.15
78.5
0.374
84.2
8.5
Low 2.8 1.0
0.21
79.1
0.371
87.4
8.3
17.5 1.8 High 3.3 1.0
0.09
80.9
0.371
82.7
8.5
Low 2.6 0.6
0.19
74.8
0.371
84.0
8.8
16.5 1.8 High 2.6 0.8
0.11
79.8
0.374
84.5
8.6
Low 3.2 0.9
0.49
78.3
0.377
83.5
8.8
Diet 18.5 3.6
2.7 1.1
0.14
78.9
0.369
84.4
7.4b
18.5 1.8
3.0 1.0
0.18
78.8
0.372
85.8
8.4a 17.5 1.8
2.9 0.8
0.14
77.8
0.371
83.3
8.6a
16.5 1.8
2.9 0.8
0.30
79.0
0.375
84.0
8.6a
SEM3
0.32 0.20
0.07
2.92
0.004
1.63
0.30
Initial BW
High
3.0 1.0
0.13
78.9
0.371
84.1
8.3 Low
2.8 0.9
0.25
78.3
0.373
84.7
8.3
SEM4
0.23 0.14
0.05
2.07
0.003
1.16
0.23
Effect5
Probability
Diet NS NS
NS
NS
NS
NS
** Initial BW NS NS
NS
NS
NS
NS
NS
1 The initial BW±SD was 1.860 ± 86g and 1.592 ± 75g, for the heavy and light hens, respectively. 2 Roche color fan. 3Standard error of the mean (8 replicates of 21 hens each per treatment). 4Standard error of the mean (16 replicates of 21 hens each per treatment). 5 The interaction between type of feed and initial BW of the hens was not significant (P> 0.05). NS: not significant; ** P < 0.01 a, b Means within a column with different superscripts are significantly different(P<0.05).
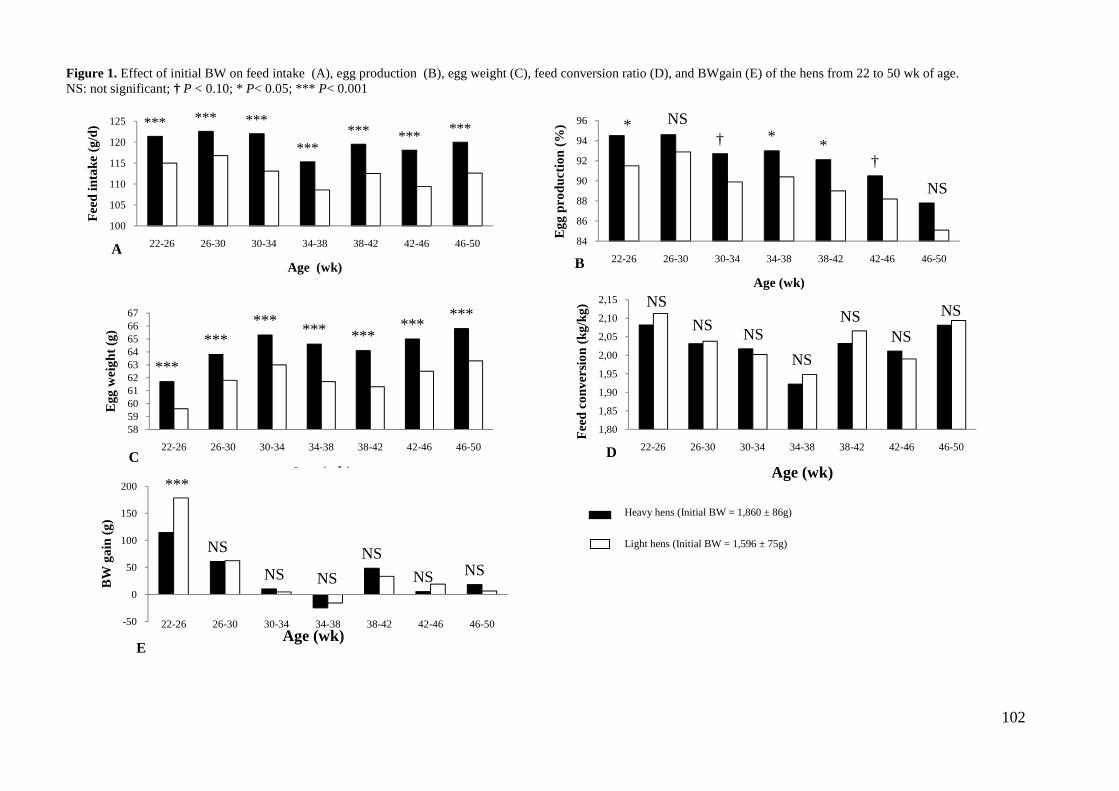
102
***
******
*** ******
***
58596061626364656667
22-26 26-30 30-34 34-38 38-42 42-46 46-50
Egg
wei
ght (
g)
Age (wk)C
Figure 1. Effect of initial BW on feed intake (A), egg production (B), egg weight (C), feed conversion ratio (D), and BWgain (E) of the hens from 22 to 50 wk of age. NS: not significant; † P < 0.10; * P< 0.05; *** P< 0.001
*** *** ***
****** *** ***
100
105
110
115
120
125
22-26 26-30 30-34 34-38 38-42 42-46 46-50
Fee
d in
take
(g/
d)
Age (wk)A
* NS† *
*†
NS
84
86
88
90
92
94
96
22-26 26-30 30-34 34-38 38-42 42-46 46-50
Egg
pro
duct
ion
(%)
Age (wk)B
NS
NSNS
NS
NSNS
NS
1,80
1,85
1,90
1,95
2,00
2,05
2,10
2,15
22-26 26-30 30-34 34-38 38-42 42-46 46-50
Fee
d co
nver
sion
(kg
/kg)
Age (wk)D
***
NS
NS NS
NS
NS NS
-50
0
50
100
150
200
22-26 26-30 30-34 34-38 38-42 42-46 46-50
BW
gai
n (g
)
Age (wk)E
Heavy hens (Initial BW = 1,860 ± 86g)
Light hens (Initial BW = 1,596 ± 75g)
Chapter 3. Effects of crude protein and fat content of the diet
103
5. References
AOAC International. 2000. Official Methods of Analysis of Association of Official
Analytical Chemists International. 17th ed. AOAC Int., Gaithersburg, MD.
ASAE. 1995. Method of determining and expressing fineness of feed materials by
sieving. Pages 461-462 in Agriculture Engineers Yearbook of Standards. American
Society of Agriculture Engineers. Standard S319.2. Am. Soc. Agric. Eng., St.
Joseph, MO.
Atteh, J. O., S. Leeson, and R. J. Julian. 1983. Effects of dietary levels and types of fat on
performance and mineral metabolism of broiler chicks. Poult. Sci. 62:2403-2411.
Blair, R., J. P. Jacob, S. Ibrahim, and P. Wang. 1999. A quantitative assessment of
reduced protein diets and supplements to improve nitrogen utilization. J. Appl.
Poult. Res. 8:25-47.
Bohnsack, C. R., R. H. Harms, W. D. Merkel, and G. B. Russell. 2002. Performance of
commercial layers when fed diets with four levels of corn oil or poultry fat. J. Appl.
Poult. Res. 11:68-76.
Boletín Oficial del Estado. 1995. Real Decreto 2257/1994 por el que se aprueba los
métodos oficiales de análisis de piensos o alimentos para animales y sus primeras
materias. BOE 52:7161-7237.
Boletín Oficial del Estado. 2007. Ley 32/2007 de 7 de Noviembre para el cuidado de los
animales, en su explotación, transporte, experimentación y sacrificio. BOE
268:45914-45920.
Bouvarel, I., Y. Nys, M. Panheleux, and P. Lescoat. 2010. Comment l’alimentation des
poules influence la qualité des oeufs. INRA Prod. Anim. 23:167-182.

Chapter 3. Effects of crude protein and fat content of the diet
104
El Zubeir, E. A., and O. A. Mohammed. 1993. Dietary protein and energy effects on
reproductive characteristics of commercial egg type pullets reared in arid hot
climate.Anim. Feed Sci. Technol. 41:161-165.
Fariborz, K., M. Faraji, and S. K. Dehkordi. 2007. Effects of reduced-protein diets at
constant total sulfur amino acids: lysine ratio on pullet development and subsequent
laying hen performance. Am. J. Anim. Vet. Sci. 2:89-92.
Frikha, M., H. M. Safaa, E. Jiménez-Moreno, R. Lázaro, and G. G. Mateos.
2009.Influence of energy concentration and feed form of the diet on growth
performance and digestive traits of brown egg-laying pullets from 1 to 120 days of
age. Anim. Feed Sci. Technol. 153:292-302.
Fundación Española Desarrollo Nutrición Animal. 2008. Necesidades nutricionales para
avicultura: Pollos de carne y aves de puesta. R. Lázaro, and G. G. Mateos, ed.
Fund. Esp. Desarro. Nutr. Anim., Madrid, Spain.
Fundación Española Desarrollo Nutrición Animal. 2010. Normas FEDNA para la
Formulación de Piensos Compuestos. C. de Blas, G. G. Mateos, and P. G. Rebollar,
ed. Fund. Esp. Desarro. Nutr. Anim., Madrid, Spain.
Grobas, S., G. G. Mateos, and J. Mendez. 1999a. Influence of dietary linoleic acid on
productive and egg weight of eggs and egg components in young brown hens. J.
Appl. Poult. Res. 8:177-184.
Grobas, S., J. Mendez, C. De Blas, and G. G. Mateos. 1999b. Influence of dietary energy,
supplemental fat and linoleic acid concentration on performance of laying hens at
two ages. Br. Poult. Sci. 40:681-687.
Grobas, S., J. Mendez, C. De Blas, and G. G. Mateos. 1999c. Laying hen productivity as
affected by energy, supplemental fat, and linoleic acid concentration of the diet.
Poult. Sci. 78:1542-1551.
Chapter 3. Effects of crude protein and fat content of the diet
105
Grobas, S., J. Méndez, R. Lázaro, C. de Blas, and G. G. Mateos. 2001. Influence of
source and percentage of fat added to diet on performance on fatty acid
composition of egg yolks of two strains of laying hens. Poult. Sci. 80:1171-1179.
H & N International. 2008. Brown Nick Management Guide. H & N International,
Cuxhaven, Germany.
Hammershoj, M. and J. B. Kjaer. 1999. Phase feeding for laying hens: effect of protein
and essential amino acids on egg quality and production. Acta Agric. Scand., Sect.
A, Animal Sci. 49:31-41.
Harms, R. H., P. T. Costa, and R. D. Miles. 1982. Daily feed intake and performance of
laying hens grouped according to their body weight. Poult. Sci. 61: 1021-1024.
Isabrown. 2011. Nutrition Management Guide. Institut de Selection Animale. B.V,
Boxmeer, The Netherlands.
Jensen, L. S., J. B. Allred, R. E. Fry, and J. McGinnis. 1958. Evidence for an unidentified
factor necessary for maximum egg weight in chickens. J. Nutr. 65:219-223.
Junqueira, O.M., A. C. de Laurentiz, R. da Silva Filardi, E. A. Rodrigues, and E. M.
Casartelli. 2006. Effects of energy and protein levels on egg quality and
performance of laying hens at early second production cycle. J. Appl. Poult. Res.
15:110-115.
Keshavarz, K. 1995. Further investigations on the effect of dietary manipulations of
nutrients on early egg weight. Poult. Sci. 74:62-74.
Keshavarz, K., and S. Nakajima. 1995. The effect of dietary manipulations of energy,
protein, and fat during the growing and laying periods on early egg weight and egg
components. Poult. Sci. 74:50-61.
Kling, L. J., R. O. Hawes, and R. W. Gerry. 1985. Effects of early maturation, layer
protein level, and methionine concentration on production performance of brown-
egg-type pullets. Poult. Sci. 64:640-645.
Chapter 3. Effects of crude protein and fat content of the diet
106
Latshaw, J. D. and L. Zhao. 2011. Dietary protein effects on hen performance and
nitrogen excretion. Poult. Sci. 90:99-106.
Leeson, S., and J. D. Summers. 1987. Effect of immature body weight on laying
performance. Poult. Sci. 66:1924-1928.
Lohmann. 2010. Management Guide for Lohmann Brown-Classic. Lohmann Tierzucht.
GMBH. Cuxhaven, Germany.
Mateos, G. G. and J. L. Sell. 1980a. Influence of carbohydrate and supplemental fat
source on the apparent metabolizable energy of the diet. Poult. Sci. 59:2129-2135.
Mateos, G. G. and J. L. Sell. 1980b. Influence of graded levels of fat on utilization of
pure carbohydrate by the laying hen. J. Nutr. 110:1894-1903.
NRC. 1994. Nutrient Requirements of Poultry. 9threv. ed. Natl. Acad. Press, Washington,
DC.
Pérez-Bonilla, A., M. Frikha, S. Mirzaie, J. García, and G. G. Mateos. 2011. Effects of
the main cereal and type of fat of the diet on productive performance and egg
quality of brown egg-laying hens from twenty-two to fifty-four weeks of age. Poult.
Sci. 90: In press.
Roberts, S.A., H. Xin, B. J. Kerr, J. R. Russell, and K. Bregendahl. 2007a. Effects of
dietary fiber and reduced crude protein on ammonia emission from laying-hen
manure. Poult. Sci. 86:1625-1632.
Roberts, S.A., H. Xin, B. J. Kerr, J. R. Russell, and K. Bregendahl. 2007b. Effects of
dietary fiber and reduced crude protein on nitrogen balance and egg production in
laying hens. Poult. Sci. 86:1716-1725.
Safaa, H. M., M. P. Serrano, D. G. Valencia, X. Arbe, E. Jiménez-Moreno, R. Lazaro,
and G. G. Mateos. 2008. Effects of the levels of methionine, linoleic acid, and
added fatin the diet on productive performance and egg qualityof brown laying hens
in the late phase of production. Poult. Sci. 87:1595-1602.
Chapter 3. Effects of crude protein and fat content of the diet
107
SAS Institute. 1990. SAS STATs User's Guide: Version 6, 4th ed. SAS Inst. Inc., Cary,
NC.
Shutze, J. V., L. S. Jensen, and J. McGinnis. 1962. Accelerated increase in egg weight of
young pullets fed diets supplemented with corn oil. Poult. Sci. 41:1846-1851.
Summers, J. D. and S. Leeson. 1983. Factors influencing early egg size. Poult. Sci.
62:1155-1159.
Summers, J. D. 1993. Reducing nitrogen excretion of the laying hen by feeding lower
crude protein diets. Poult. Sci. 72:1473-1478.
Vieira, S. L., A. Lemme, G. B. Goldenberg, and I. Brugalli. 2004. Responses of growing
broilers to diet with increased sulfur amino acids to lysine ratios at two dietary
protein levels. Poult. Sci. 83:1307-1313.
Vuilleumier, J. P., 1969. The Roche yolk colour fan – An instrument for measuring yolk
colour. Poult. Sci. 48:767-779.
Williams, K. C. 1992. Some factors affecting albumen quality with particular reference to
Haugh unit score. World´s Poult. Sci. J. 48:5-16.
Wolford, J. H. and K. Tanaka. 1970. Factors influencing egg shell quality- A review.
World´s Poult. Sci. J. 26:763-780.
CHAPTER 4:
Effects of energy concentration of the diet on
productive performance and egg quality of brown
egg-laying hens differing in initial body weight
ACCEPTED FOR PUBLISHED IN:
POULTRY SCIENCE doi:10.3382/ps.201
Chapter 4. Effect of energy concentration of the diet
CHAPTER 4:
Effects of energy concentration of the diet on
productive performance and egg quality of brown
laying hens differing in initial body weight
(Experiment 3)
ACCEPTED FOR PUBLISHED IN:
POULTRY SCIENCE TBC: 1-11 doi:10.3382/ps.2012-02526
energy concentration of the diet
108
Effects of energy concentration of the diet on
productive performance and egg quality of brown
laying hens differing in initial body weight
Chapter 4. Effect of energy concentration of the diet
109
1. Introduction
A major problem affecting egg production and egg weight of modern strains of laying
hens is the reduced feed intake (FI) often observed at the onset of egg production
(Summers and Leeson, 1983). A low FI results in hens that do not reach the standard BW
at this stage of growth which in turn reduces egg size during the whole egg laying cycle
(Harms et al., 1982; Leeson and Summers, 1987). Changes in energy concentration of the
diet have resulted in contrasting results in respect to energy intake, feed efficiency, and
productive performance of the hens (Harms et al., 2000). Grobas et al. (1999c) reported
that a 4.8% increase in the AMEn content (from 2,680 to 2,810 kcal/kg) of diets with a
constant AME: Lys ratio decreased feed intake by 5.0% without affecting egg production
or egg mass. In contrast, Peguri et al. (1991) reported an increase in egg production of
0.30% and a decrease in FI of 2.75 g per each 100 kcal increased in diets ranged from
2,700 to 2910 kcal AMEn/kg. Also, Valkonen et al. (2008) reported an increase in egg
production as the AMEn content of the diet increased from 2,340 to 2,630 kcal/kg. These
data suggest that an increase in energy content might be more beneficial when low
density energy diets are used. Hens adjust FI to satisfy their energy requirements (Hill et
al., 1956). Consequently, an increase in energy concentration of the diet should reduce FI
proportionally. An increase in energy is usually obtained by adding fat to the diet and
supplemental fat might improve the utilization of other components of the diet (Mateos
and Sell, 1980a,b). Consequently, and increase in the AMEn content of the diet might
improve nutrient utilization and egg size (Grobas et al., 1999b).
The influence of energy concentration of the diet on egg quality traits has not been
studied in detail. Junqueira et al. (2006) did not detect any difference in HU or eggshell
quality in brown egg-laying hens fed diets varying in AMEn content from 2,850 to 3,050
kcal/kg.

Chapter 4. Effect of energy concentration of the diet
110
On the other hand, Gunawardana et al. (2008) did not detect any difference in the
proportion of yolk and albumen in eggs in SCWL hens fed diets varying in AMEn
content from 2,750 to 3,055 kcal/kg. In contrast, Wu et al. (2005) reported that yolk
weight increased and haugh units (HU) decreased as the AMEn of the diet increased from
2,720 to 2,955 kcal/kg.
The authors have not found any information on the effects of energy concentration
of the diet on egg quality of hens differing in initial BW. The hypothesis of the current
research was that an increase in AMEn concentration of the diet could improve energy
intake and productive performance of the hens and that the beneficial effects could be
more pronounced for the light than for the heavy hens. The objectives of the present
research were to study the effects of energy concentration of the diet on productive
performance and egg quality of brown egg-laying hens differing in initial BW from 24 to
59 wk of age.
2. Materials and methods
2.1.Husbandry, Diets, and Experimental Design
All experimental procedures were approved by the animal Ethics Committee of the
Universidad Politécnica de Madrid and were in compliance with the Spanish guidelines
for the care and use of animals in research (Boletín Oficial del Estado, 2007).
Hy-Line Brown laying hens (n=520) were obtained from a commercial flock (Camar
Agroalimentaria S.L, Toledo, Spain) and housed in a total environmentally controlled
barn. The hens were housed in groups of 13 in enriched cages (635 x 1,200 mm; Facco
S.A., Padova, Italy) equipped with an open trough feeder and 2 nipple drinkers. They
were weighed individually at 21 wk of age and sorted into 2 groups according to BW;
heavy (1,733 ± 48g) and light (1,606 ± 39g). These values differed from the target weight
Chapter 4. Effect of energy concentration of the diet
111
of 1,685± 35g recommended by the supplier (Hy-Line International, 2011). Room
temperature was recorded daily throughout the experiment with a minimum average
value of 19 ± 3ºC recorded in January (start of the experiment) and a maximum of 28 ±
3ºC recorded in July. The light program was constant and consisted of 16 h light per day.
From 21 to 24 wks of age all hens were fed a common corn-soybean meal diet (2,750
kcal AME/kg, 17.5% CP, and 0.39% Met). From 24 (start of the experiment) to 59 wk of
age hens were fed one of 4 diets that varied in AMEn from 2,650 to 2,950 kcal/kg but had
similar nutrient content per unit of energy. For the manufacturing of the feeds the two
extreme diets were formulated (Fundacion Española Desarrollo Nutricion Animal, 2010)
and the intermediate feeds were obtained by judicious mixing of these two summit diets
in adequate proportions. All the diets met or exceeded the nutrient requirements for
brown egg-laying hens (Fundacion Española Desarrollo Nutricion Animal, 2008). An
enzyme complex that included β-glucanase and xylanase activity (Endofeed, GNC
Bioferm Inc., Saskatoon, SK, Canada), was included at the dose recommended by the
manufacturer in all diets to insure maximal nutrient utilization. Also, a commercial
pigment mixture based on canthaxantin and the ester of β-apo-8-carotenoic (Miavit
Nutrición Animal S.L., Tarragona, Spain) was included in fixed amounts in these feeds.
The ingredient composition and the calculated and determined nutrient content of the
experimental diets are presented in Table 1.
The experimental design was completely randomized with 8 treatments arranged
factorially with 4 energy levels (2,650, 2,750, 2,850, and 2950 kcal AMEn/kg) and 2
initial BW of the hens (1,733 vs. 1,606 g). Each treatment was replicated 5 times and the
experimental unit was a cage with 13 hens.
2.2. Laboratory Analysis
Chapter 4. Effect of energy concentration of the diet
112
Representative samples of the diets were ground in a laboratory mill (Model Z-I, Retsch
Stuttgart, Germany) provided with a 1-mm screen and analyzed for moisture by oven-
drying (method 930.01), total ash using a muffle furnace (method 942.05), and nitrogen
by combustion (method 990.03) using a LECO analyzer (Model FP-528, LECO, St.
Joseph, MI), as described by AOAC International (2000). Ether extract was determined
by Soxhlet analysis after 3 N HCl acid hydrolysis (Boletín Oficial del Estado, 1995) and
gross energy using an isoperibol bomb calorimeter (Model 356, Parr Instrument
Company, Moline, IL). The geometric mean diameter of the diets were determined in
triplicate in 100 g samples using a Retsch shaker (Retsch, Stuttgart, Germany) provided
with 8 sieves ranging in mesh from 5,000 to 40 µm (Table 1) according to the
methodology outlined by ASAE (1995).
2.3. Productive Performance and Egg Quality
All eggs produced were collected daily and egg weight was measured in all eggs laid
during the last 2 days of each of the nine 28-d periods. Feed intake was measured by
replicate every 28-d and mortality was recorded as produced. All the hens were weighed
individually at the beginning and at the end of each experimental period. From these data,
hen-day egg production, egg weight, egg mass, ADFI, daily energy intake, feed
conversion ratio (FCR) per kilogram and per dozen of eggs, energy efficiency expressed
as kilocalories of AMEn per gram of egg, and BW gain were calculated by period and
cumulatively.
The number of dirty, broken, and shell-less eggs were recorded daily by replicate.
An egg was considered as dirty when a spot of any kind or size was detected on the shell
as evaluated by two independent observers blind to treatment. Haugh units and yolk
pigmentation were measured per replicate in 10 eggs chosen at random from eggs
produced the last day at 39, 48, 55, and 59 wk of age, using a Multitester equipment
Chapter 4. Effect of energy concentration of the diet
113
(QCM System, Technical Services and Supplies, Dunnington, York, UK) as indicated by
Pérez-Bonilla et al. (2011). Proportion of shell, albumen, and yolk of the eggs, and the
yolk to albumen ratio were determined per replicate in the same 10 eggs collected for egg
quality measurements. The yolk and the shell were separated from the albumen using a
paper tissue to remove any adhered material (Safaa et al., 2008). Albumen weight was
calculated by difference between egg weight and the weights of the yolk and the shell.
2.4. Statistical Analysis
The experiment was conducted as a completely randomized design with 8 treatments
arranged factorially and main effects (energy level and initial BW) and its interactions
were analyzed by ANOVA using the GLM procedure of SAS Institute (1990). Normal
distribution of residuals and variance homogeneity of the data was tested by
UNIVARIATE procedure and the Levene´s Test, respectively. Mortality data were
analyzed by GENMOD procedure of SAS Institute (1990), using a binomial distribution.
The link function was logit transformation (ln(µ/1-µ)). When the effects of energy and
initial BW were significant, the Tukey test was used to make pairwise comparisons to
separate treatment means. In addition, polinomial contrasts were performed using the
REG procedure of SAS Institute (1990) to study the linear (L) and quadratic (Q) effects
of dietary energy on the different traits studied. Results in tables are presented as means
and differences were considered significant at P < 0.05.
3. Results
3.1. Productive Performance
No interactions between energy content of the diet and initial BW of the hens were
detected for any of the traits studied and therefore, only main effects are presented. For
the entire experimental period, egg production (88.8, 91.2, 92.7, and 90.5 %; L, P< 0.01;
Chapter 4. Effect of energy concentration of the diet
114
Q, P< 0.01), egg mass (56.1, 58.1, 58.8, and 58.1 g/d; L, P< 0.01; Q, P< 0.01), AMEn
intake (304, 313, 316, and 324 kcal/hen per day; L, P< 0.001), energy efficiency (5.42,
5.39, 5.38, and 5.58 kcal AMEn/g egg; L, P< 0.001; Q, P< 0.001), and BW gain (255,
300, 325, and 359 g; L, P< 0.001) increased as the AMEn content of the diet increased
from 2,650 to 2,950 kcal/kg (Table 2). However, ADFI (114.8, 114.0, 111.0, and 110.0 g;
L, P< 0.001), FCR per kilogram (2.05, 1.96, 1.89, and 1.89 kg/kg; L, P< 0.001; Q, P<
0.01) and per dozen of eggs (1.54, 1.48, 1.42, and 1.44 kg/dozen; L, P< 0.01; Q, P< 0.01)
decreased as the energy content of the diet increased (Table 2). Egg weight and mortality
rate were not affected by diet. The effects of energy concentration of the diet on ADFI,
egg production, egg weight, and BW gain by each of the nine 28-d period are shown in
Figure 1.
Initial BW of the hens affected most productive variables studied, including egg
weight, egg mass, ADFI, and FCR per dozen of eggs. For the entire experimental period,
heavier hens had higher ADFI (113.9 vs. 111.0 g; P< 0.001) and AME intake (321 vs.
311 kcal/hen per day; P < 0.001) and produced more egg mass (58.5 vs. 57.0 g; P <0.01)
and bigger eggs (64.2 vs. 63.0 g; P< 0.01) than lighter hens. However, egg production,
FCR per kilogram of eggs, energy efficiency, BW gain, and mortality rate were not
affected by the initial BW of the hens. The effects of initial BW of the hen on ADFI, egg
production, egg weight, and BW gain by each of the nine 28-d period are shown in Figure
2.
3.2. Egg Quality
Diet did not affect percentage of dirty, broken, and shell-less egg, or the proportion of
yolk and albumen in the egg (Table 3). However, HU (L, P< 0.001) and shell weight
decreased (L, P< 0.001) and yolk pigmentation increased (L, P< 0.001) as the energy
concentration of the diet increased (Table 3). Initial BW of the hens did not affect

Chapter 4. Effect of energy concentration of the diet
115
percentage of dirty eggs, broken eggs, or shell-less. The proportion of yolk was higher
(P< 0.001) and that of albumen lower (P< 0.01) for heavy than for the light hens.
Consequently, the yolk to albumen ratio was higher (P< 0.001) for the heavier than for
the lighter hens (Table 3). The effects of energy content of the diet and initial BW of the
hens on HU, proportion of shell in the egg, and yolk to albumen ratio in the different
periods studied are shown in Figure 3 and 4, respectively.
4. Discussion
4.1. Productive Performance
4.1.1. AMEn Concentration of the Diet
Hens eat to satisfy energy requirements and therefore an increase in the energy content of
the diet should decreased ADFI proportionally (Hill et al., 1956). However, in the current
research, a 11% in the energy content of the diet (from 2,650 to 2,950 kcal AMEn/kg)
decreased FI by only 4% resulting in an increase in energy intake of 7%. These results
agree with data of Bouvarel et al. (2010) who reviewed a series of experiments conducted
in laying hens during the last 20 years and reported that as an average, a 10% increase in
AMEn content of the diet reduced feed intake by only 5.5%. Moreover, Keshavarz (1998)
reported in SCWL from 18 to 66 wk of age that a 8% increase in the AMEn concentration
of the diet (from 2,815 to 3,035 kcal/kg) increased energy intake by 9%. The data
indicate that laying hens tend to overconsume energy when the AMEn of the diet is
increased. Probably, the inclusion of extra-amounts of fat to those diets might improve
palatability resulting in higher than expected feed consumption.
Egg production increased as the AMEn concentration of the diet increased from
2,650 to 2,850 kcal/kg, but a further increase to 2,950 kcal/kg did not result in further
improvements. Similarly, Mathlouthi et al. (2002) reported in SCWL hens that egg
Chapter 4. Effect of energy concentration of the diet
116
production increased as the AMEn of the diet increased from 2,650 to 2,750 kcal/kg. In
contrast, Grobas et al., (1999c) in brown hens fed diets varying from 2,680 to 2,810 kcal
AMEn/kg, Harms et al. (2000) in brown-and SCWL hens fed diets varying in AMEn
from 2,500 to 3,100 kcal/kg , and Jalal et al. (2006, 2007) in SCWL hens fed diets
varying from 2,800 to 2,900 kcal AMEn/kg, and, did not detect any significant difference
in egg production with changes in the energy content of the diet.
Egg weight was not affected by energy concentration of the diet, consistent with
data of Grobas et al. (1999b), Ciftci et al. (2003), and Valkonen et al. (2008). However,
Harms et al. (2000) and Wu et al. (2005, 2007b) reported that egg weight increased
linearly with increases in dietary energy. Bouvarel et al. (2010) analyzed data from
experiments conducted for the last 20 years and reported that egg weight increased 0.96 g
per each 100 kcal of increase in dietary AMEn. The reasons for the discrepancies among
authors in relation to the effects of an increase in energy content of the diet on egg weight
are not apparent but might be related with the linoleic acid (LNL) and fat contents of the
control diet. When the energy concentration of the diet increases, there is usually a
concomitant increase in both LNL and fat content. If the control diet had a LNL content
below hen requirements, an increase in AMEn will result in higher intakes of this nutrient
and in increases in egg size. In the current study, the LNL content of the control diet was
1.35%, probably above hen requirements for maximizing egg weight (Jensen et al., 1958;
Shutze et al., 1962; Irandoust et al., 2012). In addition, the level of added fat used for
increase the the energy content of the diet was increased from 0.92 to 6.02% and Grobas
et al. (1999c) reported that an increase in fat content of the diet resulted in increases in
egg weight. In this respect, Grobas et al. (1999b) suggested that laying hens require no
more than 1.15% LNL in the diet (1.33 g/hen per day) for maximal egg weight and that
when this minimal amount of LNL was met, an increase in supplemental fat, irrespective
of its LNL content, resulted in further increases in egg size.
Chapter 4. Effect of energy concentration of the diet
117
In the current research, egg mass increased as the AMEn of the diet increased from 2,650
to 2,750 kcal/kg but a further increase to 2,850 or 2,950 kcal/kg did not result in any
further improvement. These results agree with data of Keshavarz (1998) who reported
similar egg mass in SCWL hens fed diets with 2,820 or 3,040 kcal AMEn/kg. Also, Wu
et al. (2005) reported that an increase in the AME of the diet from 2,720 to 2,960 kcal/kg
did not affect egg mass in SCWL hens from 21 to 36 wk of age. In contrast, Joly and
Bougon (1997) reported an increase in egg mass of 4.5% as the AMEn of the diet
increased from 2,200 to 2,700 kcal/kg in brown hens from 19 to 68 week of age.
Probably, an increase in the energy concentration of the diet might be more effective in
improving egg mass production, when the diets were low than when the diets were high
in energy content.
Feed conversion ratio improved as the energy content of the diet increased, in
agreement with most published reports (Grobas et al., 1999a,b; Wu et al., 2005). In
contrast, Keshavarz (1998) reported no differences in feed efficiency in SCWL hens from
18 to 66 wk of age fed diets with 2,820 or 3,040 kcal AMEn/kg. Similarly, Valkonen et
al. (2008) reported no differences in energy efficiency between two feeding programs in
SCWL hens from 41 to 73 wk of age that consisted in two set of diets differing in 230
kcal in the 3 periods considered (2,380 vs. 2,610 kcal AMEn/kg as an average) . In the
current research, hens fed the higher energy diet (2,950 kcal AMEn/kg) had lower FI but
higher energy intake than hens fed the other diets but the excess of energy was derived to
increases in BW gain rather than to improvements in egg mass production. Consequently,
the efficiency of converting feed energy to egg mass was hindered when the high energy
diet (2,950 kcal AMEn/kg) was used. On the other hand, hens fed the low energy diet
(2,650 kcal AMEn/kg) consume less energy than hens fed the other diets. Probably the
amount of energy consumed by the hens fed the low energy diet was less than precised
for optimal egg production, which resulted in reduced egg mass. It seems possible that
Chapter 4. Effect of energy concentration of the diet
118
hens fed the low energy diets were not able to increase feed intake to satisfy their energy
requirements because of limited GIT capacity.
Daily BWG increased 0.11 g/hen per day per each 100 kcal increase in AMEn
concentration of the diet a value that is below the 0.20 g reported by Grobas et al. (1999c)
in brown laying-hens from 22 to 65 wk of age fed diets varying in AMEn content from
2,680 to 2,810 kcal/kg and the 0.45 g reported by Harms et al. (2000) in SCWL from 36
to 44 wk of age fed diets with 2,520 to 3,080 kcal AMEn/kg. In contrast, Keshavarz
(1998) reported an increase in BW of the hens of 0.014 in SCWL hens fed diets varying
in AMEn content from 2,820 to 3,040 kcal/kg from 20 to 66 wk of age. Modern brown
egg-laying hens might respond to increases in energy content of the diets with moderate
increases in BW gain, with higher increases when high energy diets were used.
The results of the current trial suggest that modern brown-egg laying hens might
not regulate precisely feed intake according to energy requirements, when extreme
AMEn concentrations of the diet are used. Hens fed high AMEn diets (i.e., 2,950 kcal/kg)
tended to overconsume energy with a positive effect on BWG but not in egg mass
production whereas hens fed low AMEn diets (i.e., 2,650 kcal/kg) tended to
underconsume energy, with a negative impact on egg mass production.
4.1.2. Initial Body Weight
The information available on the effects of initial BW of brown egg-laying hens on
productive performance is very limited. Heavier hens at the onset of the laying period ate
more feed and produced bigger eggs throughout the cycle than lighter hens (Summers and
Leeson, 1983; El Zubeir and Mohammed, 1993). Bish et al. (1985) reported that heavy
SCWL hens (1,377 g) produced heavier eggs than medium (1,256 g) and light (1,131 g)
hens, results that are consistent with the findings of the current research. In addition,
heavier hens produced more eggs but had similar FCR per kilogram of eggs than lighter

Chapter 4. Effect of energy concentration of the diet
119
hens, confirming the results of Keshavarz (1995) and Pérez-Bonilla et al. (2012). Also,
egg weight increased significantly with increases in initial BW of the hens. Keshavarz
(1995) reported a 1.4 g difference in egg weight between light (1,151 g) and heavy (1,333
g) SCWL hens from 18 to 62 wk of age. Similarly, Pérez-Bonilla et al. (2012) reported
that egg weight was 2.5 g higher in heavy (1,860 g) than in light (1,592 g) brown laying-
hens from 22 to 50 wk of age.
One of the hypothesis of the present research was that light hens could show
higher increases in energy intake and BW gain with increases in energy concentration of
the diet than heavy hens. However, no interactions between initial BW and AMEn
concentration were observed for any of the traits studied. In fact, the BW of the heavy
and light hens were 18 and 19% higher at 50 wk of age than at 24 wk of age. These
results indicate that modern brown egg-laying hens respond similarly to increases in
energy content of the diet, irrespective of BW at the onset of egg production, data that are
consistent with the report of Pérez-Bonilla et al. (2012) who observed increases inBW
with age of 18 and 12% in heavy and light hens, respectively.
4.2. Egg Quality
4.2.1. AMEn Concentration of the Diet
Energy concentration of the diet did not affect the percentage of dirty, broken, or shell
less eggs throughout the laying period, consistent with data of Grobas et al. (1999a).
However, albumen quality decreased linearly with increases in AME concentration of the
diet, in disagreement with data of Zimmermann and Andrews (1987) and Junqueira et al.
(2006). Moreover, Wu et al. (2005) reported a decrease in HU when the AMEn of the
diets was increased from 2,720 to 2960 kcal/kg. The reasons for the discrepancies among
authors in respect to the variation in HU values with increases in AMEn of the diet are
not apparent. In the experiment of Wu et al. (2005), diets were not balanced for CP and
Chapter 4. Effect of energy concentration of the diet
120
AA content with increases in energy content, and the authors suggested that the decrease
in HU observed was possibly due to the lower AA intake of the hens fed the high energy
diets. However, in the current experiment HU decreased with increases in AMEn
concentration in spite of all diets having similar CP and AA content per unit of energy.
The main differences with respect to ingredient composition of the diets in the current
experiment were that the high energy diets had more fat and wheat and less barley than
the low energy diets. But Grobas et al. (1999a,b) and Safaa et al. (2008) did not observe
any effect of supplemental fat on HU of the eggs and Lázaro et al. (2003) and Pérez-
Bonilla et al. (2011) did not observe any effect of the main cereal of the diet on albumen
quality.
Yolk pigmentation increased linearly with increases in energy concentration of the
diet, in spite of all diets having similar levels of corn and pigmenting additives.
Xanthophylls, the main pigment source responsible for egg yolk color, are highly soluble
in fat. As we increased the energy concentration of the diet, the level of fat increased,
favoring the absorption of xanthophylls in the gastro intestinal tract of the hen. Similar
data have been reported by Lázaro et al. (2003) in SCWL hens fed high AMEn diets.
Also, Gunawardana et al. (2008) observed higher yolk pigmentation in SCWL hens fed a
diet with 5% added fat than in hens fed a control diet without any added fat.
The proportion of shell in the egg decreased linearly as the energy content of the
diet increased in agreement with the results of Junqueira et al. (2006) who reported a
linear decrease (Y = 13.252 – 0.0016x, R2 = 0.57) in egg shell proportion as the AMEn
increased from 2,850 to 3,050 kcal/kg in brown hens from 76 to 84 wk of age. However,
Gunawardana et al. (2008) did not find any effect of energy content of the diet on egg
shell proportion in SCWL using 4 added energy levels (from 0 to 238 kcal AMEn/kd).
The level of dietary fat increased the energy content of the diet increased fat, might form
soaps with the Ca salts present in the feed, resulting in a reduction in Ca retention and in
Chapter 4. Effect of energy concentration of the diet
121
the relative weight of the shell (Atteh and Leeson; 1983b, 1984). In contrast, Safaa et al.
(2008) in brown laying-hens reported similar egg shell quality in late phase of production
in hens fed diets that included 1.1 or 3% of a 40:60 mixture of soy oil and palm oil.
Probably the proportion of saturated fatty acids in the lipid fraction might affect soap
formation and final quality of the shell.
4.2.2. Initial Body Weight
The percentage of dirty, broken, and shell-less eggs, and the HU and yolk pigmentation
of the eggs were not affected by the initial BW of the hens, in agreement with data of
Pérez-Bonilla et al. (2012). However, eggs from the heavy hens had higher proportion of
yolk and lower of albumen than eggs from the light hens. Consequently, yolk to albumen
ratio was higher for the heavier than for the lighter hens. The authors have not found any
published report on the effects of initial BW of the hens on egg quality or on the
proportion of egg components to compare with the data of the current research. Probably,
heavy hens produce heavier yolks than lighter hens because of their higher feed intake,
resulting in eggs with higher proportion of yolk (Leeson and Summers, 2005).
In summary, an increase in energy content of the diets from 2,650 to 2,950 kcal
AMEn/kg affected performance and egg quality of the hens. Hens fed the higher energy
diet (2,950 kcal AMEn/kg) had higher energy intake than hens fed the 2,750 and 2,850
kcal AME/kg diets but the energy excess was derived to increases in BW gain rather than
to improvement in egg production. On the other hand, hens fed the 2,650 kcal AME/kg
diet had a reduced energy intake below requirements for optimal productive performance.
An increase in energy concentration of the diet reduced HU and the proportion of shell in
the egg but did not affect yolk to albumen ratio. Heavy hens had higher feed intake and
produced more mass of eggs than light hens but energy efficiency was not affected. An
increase in the energy content of the diet increased BW of the hens but the response was
Chapter 4. Effect of energy concentration of the diet
122
similar for all hens irrespective of the initial BW. Heavy hens had higher yolk to albumen
ratio than lighter hens. Productive performance was higher for heavier than for lighter
hens but the economical advantage of increasing BW of the hens at the start of the laying
cycle might depend on price difference between egg weight grades as well as on relative
cost of feed ingredients.
5. References
AOAC International. 2000. Official Methods of Analysis. 17th ed. AOAC Int.,
Gaithersburg, MD.
ASAE. 1995. Method of determining and expressing fineness of feed materials by
sieving. Pages 461-462 in Agriculture Engineers Yearbook of Standards. American
Society of Agriculture Engineers. Standard S319.2. Am. Soc. Agric. Eng., St.
Joseph, MO.
Atteh, J. O., and S. Leeson. 1983b. Effects of dietary fatty acids and calcium levels on
performance and mineral metabolism of broiler chickens. Poult. Sci. 62:2412-2419.
Atteh, J. O., and S. Leeson. 1984. Effects of dietary saturated or unsaturated fatty acids and
calcium levels on performance and mineral metabolism of broiler chicks. Poult. Sci.
63:2252-2260.
Bish, C.L, W. L. Beane, P. L. Ruszler, and J. A. Cherry. 1985. Body weight influence on
egg production. Poult. Sci. 64:2259-2262.
Boletín Oficial del Estado, 1995. Real Decreto 2257/1994 por el que se aprueba los
métodos oficiales de análisis de piensos o alimentos para animales y sus primeras
materias. BOE 52: 7161–7237.
Boletín Oficial del Estado. 2007. Ley 32/2007 de 7 de Noviembre para el cuidado de los
animales, en su explotación, transporte, experimentación y sacrificio. BOE
268:45914-45920.
Chapter 4. Effect of energy concentration of the diet
123
Bouvarel, I., Y. Nys, M. Panheleux, and P. Lescoat. 2010. Comment l´alimentation des
poules influence la qualité des oeufs. INRA Prod. Anim. 23: 167-182.
Çiftci, I., E. Yenice, D. Gökҫeyrek, and E. Öztürk. 2003. Effects of energy level and
enzyme supplementation in wheat-base layer diets on hen performance and egg
quality. Acta Agric. Scand. Sect. A Anim. Sci. 53:113-119.
El Zubeir, E. A., and O. A. Mohammed. 1993. Dietary protein and energy effects on
reproductive characteristics of commercial egg type pullets reared in arid hot
climate. Anim. Feed Sci. Technol. 41:161-165.
Fundación Española Desarrollo Nutrición Animal. 2008. Necesidades Nutricionales para
Avicultura: Pollos de Carne y Aves de Puesta. R. Lázaroand G. G. Mateos, ed.
Fund. Esp. Desarro. Nutr. Anim., Madrid, Spain
Fundación Española Desarrollo Nutrición Animal. 2010. Normas FEDNA para la
Formulación de Piensos Compuestos. C. de Blas, G. G. Mateos, and P. G. Rebollar,
3ª ed. Fund. Esp. Desarro. Nutr. Anim., Madrid, Spain.
Grobas, S., G. G. Mateos, and J. Mendez. 1999a. Influence of dietary linoleic acid on
production and weight of eggs and egg components in young brown hens. J.
Appl. Poult. Res. 8:177-184.
Grobas, S., J. Mendez, C. De Blas, and G. G. Mateos. 1999b. Influence of dietary energy,
supplemental fat and linoleic acid concentration on performance of laying hens at
two ages. Br. Poult. Sci. 40:681-687.
Grobas, S., J. Mendez, C. De Blas, and G. G. Mateos. 1999c. Laying hen productivity as
affected by energy, supplemental fat, and linoleic acid concentration of the diet.
Poult. Sci. 78:1542–1551.
Gunawardana, P., D. A. Roland Sr., and M.M. Bryant. 2008. Effect of energy and protein
on performance, egg components, egg solids, egg quality, and profits in molted Hy-
line W-36 hens. J. Appl. Poult. Res. 17:432-439.
Chapter 4. Effect of energy concentration of the diet
124
Harms, R. H., P. T. Costa, and R. D. Miles. 1982. Daily feed intake and performance of
laying hens grouped according to their body weight. Poult. Sci. 61: 1021-1024.
Harms, R.H., G. B. Russell, and D. R. Sloan. 2000. Performance of four strains of
commercial layers with major changes in dietary energy. J. Appl. Poult. Res. 9:535-
541.
Hill, F. W., D. L. Anderson, and L. M. Dansky. 1956. Studies of the energy requirements
of chickens 3. The effect of dietary energy level on the rate and gross efficiency of
egg production. Poult. Sci. 35:54-59.
Hy-Line International, 2011. Hy-Line Variety Brown, Commercial Management Guide
2009-2011. Hy-Line International, West Des Moines, IA, USA.
Irandoust, H., A. H. Samie, H. R. Rahmani, M. A. Edriss, and G. G. Mateos. 2012.
Influence of source of fat and supplementation of the diet with vitamin E and C on
performance and egg quality of laying hens from forty four to fifty six weeks of
age. Anim. Feed Sci. Technol. (In-Press).
Jalal, M.A., S. E. Scheideler, and D. Marx. 2006. Effect of bird cage space and dietary
matabolizable energy level on production parameters in laying hens. Poult. Sci.
8:5306-5311.
Jalal, M.A., S. E. Scheideler, and E. M. Pierson. 2007. Strain response of laying hen to
varying dietary energy levels with and without avizyme supplementation. J. Appl.
Poult. Res. 16: 289-295.
Jensen, L. S., J. B. Allred, R. E. Fry, and J. McGinnis. 1958. Evidence for an unidentified
factor necessary for maximum egg weight in chickens. J. Nutr. 65:219-223.
Joly, P., and M. Bougon. 1997. Influence du niveau énergétique sur les performances des
pondeuses à oeufs roux et évolution de l´ingéré en fonction de l`âge. 2ême journée de la
Recherche Avicole. 1997.2:115-120.
Chapter 4. Effect of energy concentration of the diet
125
Junqueira, O.M., A. C. de Laurentiz, R. da Silva Filardi, E. A. Rodrigues, and E. M.
Casartelli. 2006. Effects of energy and protein levels on egg quality and
performance of laying hens at early second production cycle. J. Appl. Poult. Res.
15:110-115.
Keshavarz, K. 1995. Further investigations on the effect of dietary manipulations of
nutrients on early egg weight. Poult. Sci. 74:62-74.
Keshavarz, K. 1998. The effect of light regimen, floor space, and energy and protein levels
during the growing period on body weight and early egg size. Poult. Sci. 77:1266-
1279.
Lázaro, R., M. García, M. J. Araníbar, and G. G. Mateos. 2003. Effect of enzyme addition to
wheat, barley and rye based diets on nutrient digestibility and performance of laying
hens. Br. Poult. Sci. 44:256-265.
Leeson, S., and J. D. Summers. 1987. Effect of immature body weight on laying
performance. Poult. Sci. 66:1924-1928.
Leeson, S., and J. D. Summers. 2005. Comercial Poultry Nutrition, 3rd Edition.
Nottingham University Press.
Mateos, G. G. and. J. L. Sell. 1980a. Influence of graded levels of fat on utilization of
pure carbohydrate by the laying hen. J. Nutr. 110:1894-1903.
Mateos, G. G. and. J. L. Sell. 1980b. Influence of carbohydrate and supplemental fat
source on the metabolizable energy of the diet. Poult. Sci. 59:2129-2135.
Mathlouthi, N., M. Larbier, M. A. Mohamed, and M. Lessire. 2002. Performance of
laying hens fed wheat, wheat-barley or wheat-barley-wheat bran based diets
supplemented with xylanase. Can. J. Anim. Sci. 82:193-199.
Peguri, A., and C. Coon. 1991. Effect of temperature and dietary energy on layer
performance. Poult. Sci. 70:126-138.
Chapter 4. Effect of energy concentration of the diet
126
Pérez-Bonilla, A., M. Frikha, S. Mirzaie, J. Garcia, and G. G. Mateos. 2011. Effects of the
main cereal and type of fat of the diet on productive performance and egg quality of
brown-egg laying hens from 22 to 54 weeks of age. Poult. Sci. 90:2801-2810.
Pérez-Bonilla, A., C. Jabbour, M. Frikha, S. Mirzaie, J. Garcia, and G. G. Mateos. 2012.
Effect of crude protein and fat content of the diet on productive performance and
egg quality traits of brown egg-laying hens with different initial body weight.
Poult.Sci. 91:1400-1405.
Safaa, H. M., M. P. Serrano, D. G. Valencia, M. Frikha, E. Jiménez-Moreno, and G. G.
Mateos. 2008. Productive performance and egg quality of brown egg-laying hens in
late phase of production as influenced by level and source of calcium in the diet.
Poult. Sci. 87:2043-2051.
SAS Institute, 1990. SAS STATs User’s Guide.Version 6, 4th ed. SAS Institute Inc.,
Cary, NC.
Shutze, J. V., L. S. Jensen, and J. McGinnis. 1962. Accelerated increase in egg weight of
young pullets fed diets supplemented with corn oil. Poult. Sci. 41:1846-1851.
Summers, J. D. and S. Leeson. 1983. Factors influencing early egg size. Poult. Sci.
62:1155-1159.
Valkonen , E., E. Venalainen, L. Rossow, J. Valaja. 2008. Effects of dietary energy
content on the performance of laying hens in furnished and conventional cages.
Poult. Sci. 87:844-852.
Vuilleumier, J.P., 1969. The Roche yolk colur fan – An instrument for measuring yolk
colour. Poult. Sci. 48:767-779.
Wu, G., M. M. Bryant, R. A. Voitle, and D.A. Roland Sr. 2005. Effect of dietary energy
on performance and egg composition of Bovans white and Dekalb white hens
during phase I. Poult. Sci. 84:1610-1615.

Chapter 4. Effect of energy concentration of the diet
127
Wu, G., P. Gunawardana, M. M. Bryant, R. A. Voitle, D.A Roland Sr. 2007b. Effect of
molting method and dietary energy on postmolt performance, egg components, egg
solid, and egg quality in Bovans white and Dekalb white hens during second cycle
phases two and three. Poult. Sci. 86:869-876.
Zimmermann, N. G., and D. K. Andrews. 1987. Comparison of several induced molting
methods on subsequent performance of Single Comb White Leghorn hens. Poult. Sci.
66: 408-417.
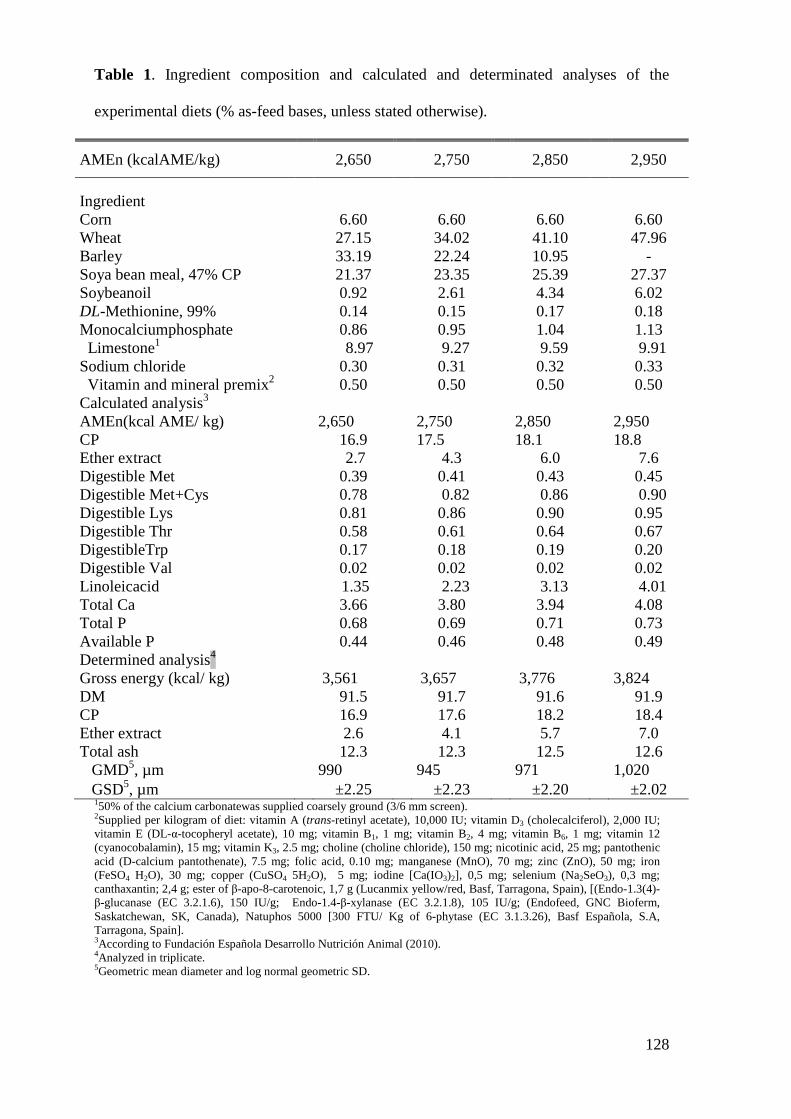
128
Table 1. Ingredient composition and calculated and determinated analyses of the
experimental diets (% as-feed bases, unless stated otherwise).
AMEn (kcalAME/kg) 2,650 2,750 2,850 2,950
Ingredient Corn 6.60 6.60 6.60 6.60 Wheat 27.15 34.02 41.10 47.96 Barley 33.19 22.24 10.95 - Soya bean meal, 47% CP 21.37 23.35 25.39 27.37 Soybeanoil 0.92 2.61 4.34 6.02 DL-Methionine, 99% 0.14 0.15 0.17 0.18 Monocalciumphosphate 0.86 0.95 1.04 1.13 Limestone1 8.97 9.27 9.59 9.91 Sodium chloride 0.30 0.31 0.32 0.33 Vitamin and mineral premix2 0.50 0.50 0.50 0.50 Calculated analysis3 AMEn(kcal AME/ kg) 2,650 2,750 2,850 2,950 CP 16.9 17.5 18.1 18.8 Ether extract 2.7 4.3 6.0 7.6 Digestible Met 0.39 0.41 0.43 0.45 Digestible Met+Cys 0.78 0.82 0.86 0.90 Digestible Lys 0.81 0.86 0.90 0.95 Digestible Thr 0.58 0.61 0.64 0.67 DigestibleTrp 0.17 0.18 0.19 0.20 Digestible Val 0.02 0.02 0.02 0.02 Linoleicacid 1.35 2.23 3.13 4.01 Total Ca 3.66 3.80 3.94 4.08 Total P 0.68 0.69 0.71 0.73 Available P 0.44 0.46 0.48 0.49 Determined analysis4
Gross energy (kcal/ kg) 3,561 3,657 3,776 3,824 DM 91.5 91.7 91.6 91.9 CP 16.9 17.6 18.2 18.4 Ether extract 2.6 4.1 5.7 7.0 Total ash 12.3 12.3 12.5 12.6 GMD5, µm 990 945 971 1,020 GSD5, µm ±2.25 ±2.23 ±2.20 ±2.02
150% of the calcium carbonatewas supplied coarsely ground (3/6 mm screen). 2Supplied per kilogram of diet: vitamin A (trans-retinyl acetate), 10,000 IU; vitamin D3 (cholecalciferol), 2,000 IU; vitamin E (DL-α-tocopheryl acetate), 10 mg; vitamin B1, 1 mg; vitamin B2, 4 mg; vitamin B6, 1 mg; vitamin 12 (cyanocobalamin), 15 mg; vitamin K3, 2.5 mg; choline (choline chloride), 150 mg; nicotinic acid, 25 mg; pantothenic acid (D-calcium pantothenate), 7.5 mg; folic acid, 0.10 mg; manganese (MnO), 70 mg; zinc (ZnO), 50 mg; iron (FeSO4 H2O), 30 mg; copper (CuSO4 5H2O), 5 mg; iodine [Ca(IO3)2], 0,5 mg; selenium (Na2SeO3), 0,3 mg; canthaxantin; 2,4 g; ester of β-apo-8-carotenoic, 1,7 g (Lucanmix yellow/red, Basf, Tarragona, Spain), [(Endo-1.3(4)-β-glucanase (EC 3.2.1.6), 150 IU/g; Endo-1.4-β-xylanase (EC 3.2.1.8), 105 IU/g; (Endofeed, GNC Bioferm, Saskatchewan, SK, Canada), Natuphos 5000 [300 FTU/ Kg of 6-phytase (EC 3.1.3.26), Basf Española, S.A, Tarragona, Spain]. 3According to Fundación Española Desarrollo Nutrición Animal (2010). 4Analyzed in triplicate. 5Geometric mean diameter and log normal geometric SD.

129
Table 2. Influence of the AMEn of the diet and initial BW of the laying hens on productive performancefrom 24 to 59 wks of age1
AMEn (kcal AME/kg)
Initial BW
Eggproduction (%)
Eggweight
(g)
Eggmass (g/d)
Feed intake
(g/hen/d) FCR2(kg/kg)
FCR (kg/dozen)
AME intake (kcal/hen/d)
EnE3
(kcal AME/ g egg)
BW gain (g)
Mortality4 (%)
2,650 High5 88.8 63.5 56.4 115.9 2.06 1.55 307 5.45 272 1.5 Low5 88.9 62.8 55.8 113.6 2.05 1.52 301 5.40 239 1.5 2,750 High 91.7 64.5 59.1 115.4 1.95 1.49 317 5.37 284 3.1 Low 90.8 62.9 57.1 112.5 1.98 1.47 309 5.42 316 3.1 2,850 High 93.2 64.1 59.8 113.0 1.90 1.44 322 5.39 331 0.0 Low 92.2 62.8 57.9 108.9 1.88 1.40 310 5.36 320 1.5 2,950 High 91.0 64.6 58.8 111.1 1.89 1.45 328 5.58 365 3.1 Low 90.1 63.7 57.4 108.9 1.89 1.43 321 5.60 352 6.1 SEM6 0.84 0.39 0.65 0.98 0.015 0.014 2.7 0.043 24.5 Main effects AMEn 2,650 88.8c 63.1 56.1b 114.8a 2.05a 1.54a 304c 5.42b 255c 1.5
2,750 91.2ab 63.7 58.1a 114.0a 1.96b 1.48b 313b 5.39b 300bc 3.1 2,850 92.7a 63.5 58.8a 111.0b 1.89c 1.42c 316b 5.38b 325ab 0.8 2,950 90.5bc 64.1 58.1a 110.0b 1.89c 1.44c 324a 5.58a 359a 4.6
SEM7 0.59 0.27 0.46 0.69 0.010 0.010 1.9 0.030 17.3 Initial BW High 91.2 64.2a 58.5a 113.9a 1.95 1.49a 319a 5.45 313 1.9
Low 90.5 63.0b 57.0b 111.0b 1.95 1.46b 310b 5.44 307 3.1 SEM8 0.42 0.19 0.32 0.49 0.008 0.007 1.4 0.021 12.2 Effect9 Probability AMEn *** NS ** *** *** *** *** *** ** NS Initial BW NS *** ** *** NS *** *** NS NS NS Contrasts AMEn linear L*** NS L** L*** L*** L** L*** L*** L*** NS AMEn quadratic Q*** NS Q** NS Q** Q** NS Q*** NS NS
a,b,c Means with different superscript within each main effect are significantly different (P < 0.05). 1 Data presented correspond to the means of 9 periods of 28-d each. 2 FCR = Feed conversion ratio. 3 EnE = Energy efficiency. 4 Analyzed by GENMOD procedure. 5 Initial BW±SD of 1,733 ± 48g and 1,606 ± 39g, for the heavy and light hens, respectively. 6 SEM (5 replicates of 13 hens each per treatment). 7 SEM (10 replicates of 13 hens each per treatment). 8 SEM (20 replicates of 13 hens each per treatment). 9 The interaction between AMEn and initial BW was not significant (P > 0.05). *P < 0.05; **P< 0.01; ***P< 0.001.
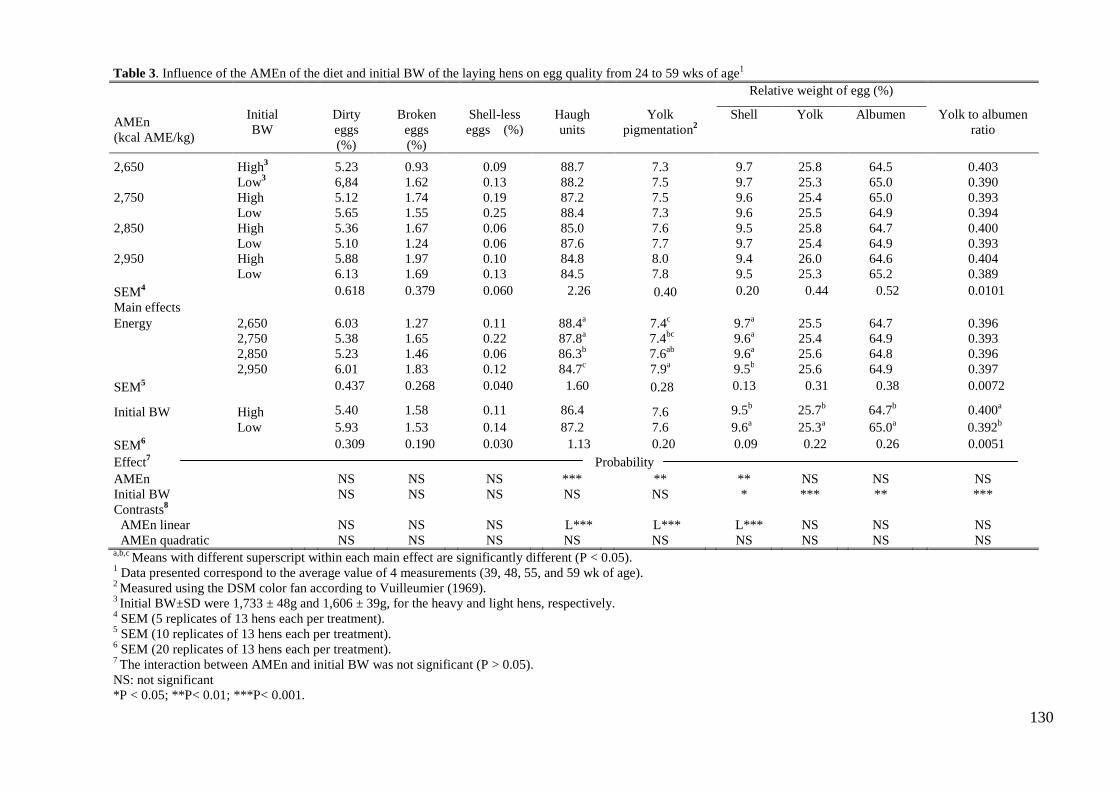
130
Table 3. Influence of the AMEn of the diet and initial BW of the laying hens on egg quality from 24 to 59 wks of age1
Relative weight of egg (%)
AMEn (kcal AME/kg)
Initial BW
Dirty eggs (%)
Broken eggs (%)
Shell-less eggs (%)
Haugh units
Yolk pigmentation2
Shell Yolk Albumen Yolk to albumen ratio
2,650 High3
5.23
0.93
0.09
88.7
7.3
9.7
25.8
64.5
0.403 Low3
6,84
1.62
0.13
88.2
7.5
9.7
25.3
65.0
0.390
2,750 High
5.12
1.74
0.19
87.2
7.5
9.6
25.4
65.0
0.393 Low
5.65
1.55
0.25
88.4
7.3
9.6
25.5
64.9
0.394
2,850 High
5.36
1.67
0.06
85.0
7.6
9.5
25.8
64.7
0.400 Low
5.10
1.24
0.06
87.6
7.7
9.7
25.4
64.9
0.393
2,950 High
5.88
1.97
0.10
84.8
8.0
9.4
26.0
64.6
0.404 Low
6.13
1.69
0.13
84.5
7.8
9.5
25.3
65.2
0.389
SEM4 0.618
0.379
0.060
2.26
0.40 0.20
0.44
0.52
0.0101
Main effects
Energy 2,650
6.03
1.27
0.11
88.4a
7.4c
9.7a
25.5
64.7
0.396 2,750
5.38
1.65
0.22
87.8a
7.4bc
9.6a
25.4
64.9
0.393
2,850
5.23
1.46
0.06
86.3b
7.6ab
9.6a
25.6
64.8
0.396 2,950
6.01
1.83
0.12
84.7c
7.9a
9.5b
25.6
64.9
0.397
SEM5 0.437
0.268
0.040
1.60
0.28 0.13
0.31
0.38
0.0072
Initial BW High 5.40
1.58
0.11
86.4
7.6 9.5b
25.7b
64.7b
0.400a
Low
5.93
1.53
0.14
87.2
7.6
9.6a
25.3a
65.0a
0.392b SEM6
0.309
0.190
0.030
1.13
0.20
0.09
0.22
0.26
0.0051 Effect7
Probability
AMEn
NS
NS
NS
***
**
**
NS
NS
NS
Initial BW
NS
NS
NS
NS
NS
* *** ** *** Contrasts8 AMEn linear NS NS NS L*** L*** L*** NS NS NS AMEn quadratic NS NS NS NS NS NS NS NS NS a,b,c Means with different superscript within each main effect are significantly different (P < 0.05). 1 Data presented correspond to the average value of 4 measurements (39, 48, 55, and 59 wk of age). 2 Measured using the DSM color fan according to Vuilleumier (1969). 3 Initial BW±SD were 1,733 ± 48g and 1,606 ± 39g, for the heavy and light hens, respectively. 4 SEM (5 replicates of 13 hens each per treatment). 5 SEM (10 replicates of 13 hens each per treatment). 6 SEM (20 replicates of 13 hens each per treatment). 7 The interaction between AMEn and initial BW was not significant (P > 0.05). NS: not significant *P < 0.05; **P< 0.01; ***P< 0.001.
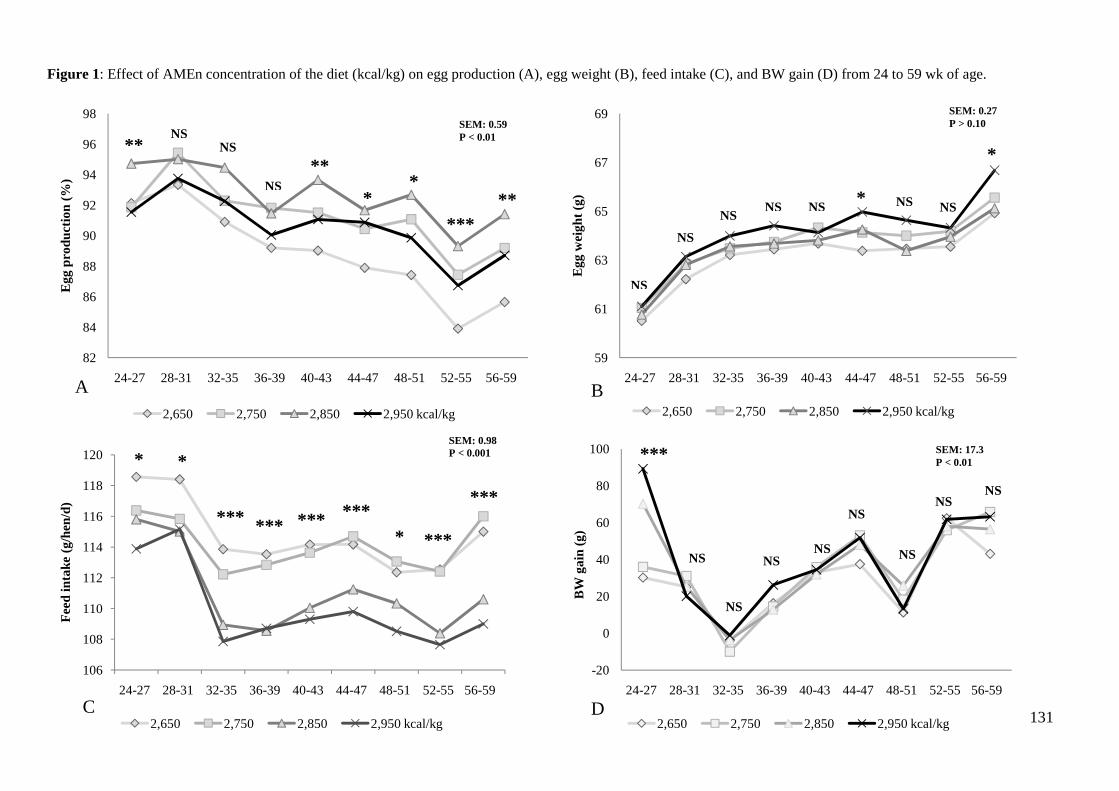
131
Figure 1: Effect of AMEn concentration of the diet (kcal/kg) on egg production (A), egg weight (B), feed intake (C), and BW gain (D) from 24 to 59 wk of age.
82
84
86
88
90
92
94
96
98
24-27 28-31 32-35 36-39 40-43 44-47 48-51 52-55 56-59
Egg
pro
duct
ion
(%)
2,650 2,750 2,850 2,950 kcal/kg
A
59
61
63
65
67
69
24-27 28-31 32-35 36-39 40-43 44-47 48-51 52-55 56-59
Egg
wei
ght (
g)
2,650 2,750 2,850 2,950 kcal/kg
106
108
110
112
114
116
118
120
24-27 28-31 32-35 36-39 40-43 44-47 48-51 52-55 56-59
Fee
d in
take
(g/
hen/
d)
2,650 2,750 2,850 2,950 kcal/kg
-20
0
20
40
60
80
100
24-27 28-31 32-35 36-39 40-43 44-47 48-51 52-55 56-59
BW
gai
n (g
)
2,650 2,750 2,850 2,950 kcal/kg
**
*
** *
*** **
NS NS
NS
*
*
NS
NS
NS NS NS NS NS
SEM: 0.98 P < 0.001 * *
** * ** * ** * ** *
** * * ** *
SEM: 17.3 P < 0.01 ***
NS
NS
NS
NS
NS NS
NS NS
SEM: 0.59 P < 0.01
SEM: 0.27 P > 0.10
B
C D
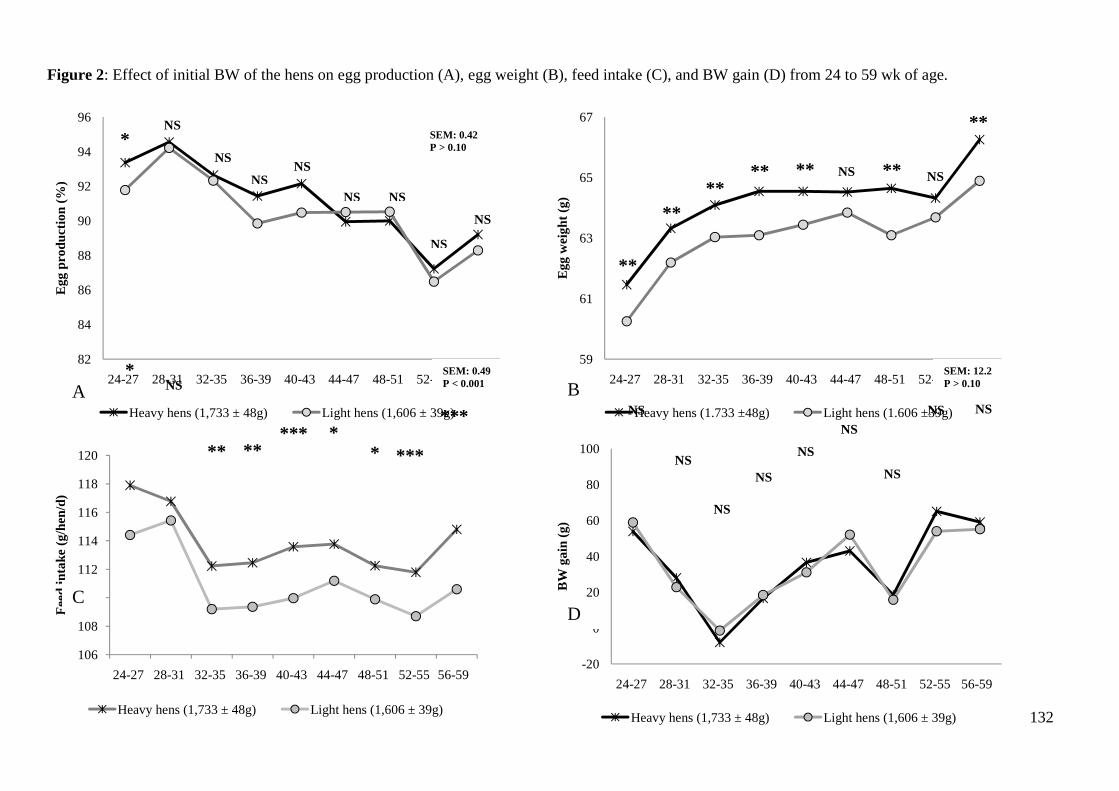
132
Figure 2: Effect of initial BW of the hens on egg production (A), egg weight (B), feed intake (C), and BW gain (D) from 24 to 59 wk of age.
82
84
86
88
90
92
94
96
24-27 28-31 32-35 36-39 40-43 44-47 48-51 52-55 56-59
Egg
pro
duct
ion
(%)
Heavy hens (1,733 ± 48g) Light hens (1,606 ± 39g)
59
61
63
65
67
24-27 28-31 32-35 36-39 40-43 44-47 48-51 52-55 56-59
Egg
wei
ght (
g)
Heavy hens (1.733 ±48g) Light hens (1.606 ±39g)
106
108
110
112
114
116
118
120
24-27 28-31 32-35 36-39 40-43 44-47 48-51 52-55 56-59
Fee
d in
take
(g/
hen/
d)
Heavy hens (1,733 ± 48g) Light hens (1,606 ± 39g)
-20
0
20
40
60
80
100
24-27 28-31 32-35 36-39 40-43 44-47 48-51 52-55 56-59
BW
gai
n (g
)
Heavy hens (1,733 ± 48g) Light hens (1,606 ± 39g)
* NS
NS
NS NS
NS NS
NS
NS
SEM: 0.42 P > 0.10
**
** * *
** ** **
**
NS NS
*
** * ** **
*
NS
***
** *
*
SEM: 0.49 P < 0.001
NS
NS
NS
NS
NS
NS
NS
NS NS
SEM: 12.2 P > 0.10
A B
C D

CHAPTER
General discussion and conclusions
Chapter 5. General discussion and conclusions
CHAPTER 5:
General discussion and conclusions
General discussion and conclusions
133
General discussion and conclusions
Chapter 5. General discussion and conclusions
134
1. General discussion
1.1. Productive performance in egg-laying hens
1.1.1. Effect of the main cereal of the diet
In trial 1, from 22 to 54 weeks of age, important variables like egg production, egg
weight, egg mass, FI, and FCR per kilogram and per dozen of egg and mortality did not
differ independent of the cereal used in agreement with previous studies (Craig and
Goodman., 1993). As a result of experimental design and in order to avoid the effects of
NSP of the diet that included wheat and barley, diets were supplemented with exogenous
enzymes. This fact produced that laying hen productivity was not affected by the use of
wheat and barley in agreement with Lázaro et al. (2003) who reported in SCWL hens
(Hy-line W-77) located individually that cereals with soluble fiber like wheat and barley
can replace corn successfully in laying hen diets. Also, the same author reported that
viscosity due to NSP was reduced via enzyme supplementation improved digestibility of
nutrients and hen performance. Also, Safaa et al. (2009) reported no difference in
Lohman brown hens fed with two diets that contained 50% of dented corn and 50% of
hard wheat. It is noticeable to comment that in both studies (Lazaro et al., 2003 and Safaa
et al., 2009) was used the same commercial enzyme complex that contained β-glucanase
(EC 3.2.1.6.) andxylanase activity (Endofeed, GNC Bioferm Inc., Saskatoon,
Saskatchewan, Canada). In contrast of the current research, Coon et al. (1988) reported
higher FI and poorer FCR per kilogram in hens fed enzyme-supplemented barley diets
than in hens fed corn diets. The only effect founded in the current research related with
the use of different cereal was the BW gain. Thus, BW gain was greater in hens fed corn
or wheat than in hens fed barley, which were results agree with data of Berg (1959) who
reported higher BW gain for hens fed corn than for hens fed barley.

Chapter 5. General discussion and conclusions
135
1.1.2. Effect of source, fatty acid profile, and level of supplemented fat of the diet
In trial 1, the substitution of SBO by AVO or lard in the diet did not affect any of
the productive performance traits studied except to BW gain of the birds. Thus, BW gain
of hens fed lard was higher than hens fed SBO or AVO confirming that more energy
consumed by the hens fed lard was diverted to BW gain rather than to energy deposition
in eggs as compared with hens fed SBO or AVO. In broilers, Vila and Esteve-García
(1996) reported that broilers fed diets supplemented with tallow or lard had higher
abdominal fat deposition than broilers fed isoenergetic diets based on more unsaturated
vegetable oils, which is consistent with the results of the current experiment. In contrast,
Grobas et al. (2001) in brown hens did not find this effect in BW gain of the hens using 2
types of unsaturated fat (soy oil and linseed oil) and 2 types of monounsaturated fat
(tallow and olive oil) respect to control diet without added fat. Although no significant
difference were found throughout experiment for all performance variables except to BW
gain, the lower egg weight was observed for hens fed lard (saturated fat), and the larger
EW was observed for hens fed SBO or AVO (unsaturated fat) confirming previous data
of Grobas et al. (2001). This authors reported tha thens fed with tallow and olive oil
improve EW (3 g as average) respect to hens fed the monounsaturated fat (tallow or olive
oil). This result was expected by the authors because the LNL content of the
monounsaturated diets were less than 1% which has been shown to be insufficient to
maximize egg size (Grobas et al., 1999c).
The effects of supplemental fat on performance of hens were a subject of debate
in trial 2. The increase of added fat from 1.8 to 3.6% of soy oil in the diet did not affect
any performance variables throughout experiment 2 in agreement with the finding of
Usayran et al. (2001) who reported in SCWL hens from no difference among diets with 0
or 4% of added fat from 28 wk of age to peak of lay. In contrast, Mateos and Sell (1981)
Chapter 5. General discussion and conclusions
136
indicated that SFAT might benefit hen productivity by slowing down the rate of food
passage, allowing more time for the contact of enzymes and dietary components which in
turn might result in an improvement in performance variables, especially in EW. Parsons
et al. (1993) reported in SCWL hens from 21 to 40 wk of age an improved in egg
production and EW using diets with added fat (from 2 to 6%) respect to diets without
added fat. Also, Safaa et al. (2008) reported that egg production (77.0 vs. 79.3%), EW
(64.9 vs. 66.3 g), egg mass (49.8 vs. 52.5%), and FCR (2.36 vs. 2.26) improved with the
increase in SFAT from 1.1 to 3.0%. Moreover, Grobas et al. (1999b) reported in brown
hens from 22 to 65 wk of age an improvement in egg production (88.0 vs. 89.8%), EW
(64.1 vs. 65.3 g) and egg mass (56.4 vs. 58.6 g/d), but FCR (2.08 vs. 2.06) was not
affected in diet with 0 or 4.0%. Improves in productive performance by the use of added
fat have been reported by several authors (Jensen et al. 1983; Bohnsack et al. 2002;
Sohail et al. 2003). The reasons for the discrepancies among authors are not know but
might be related to the type of diet and the confusing effect between added fat, AMEn,
and LNL content.
Due to experimental design, to increase added fat was accompanied by an increase
in energy concentration and LNL content of the diet (1.9 vs. 2.5%, respectively). Grobas
et al. (1999b,c) reported in brown hens from 22 to 74 wks of age that an increase in the
dietary SFAT with LNL held constant at 1.15% increase food consumption and energy
intake and this increase in energy intake resulted in an additional increase in BW and in
an improvement in egg production and EW. Also, the same authors reported that an
interaction between age an SFAT. Thus, EW increased with SFAT in young but not in
old hens.
Chapter 5. General discussion and conclusions
137
1.1.3. Effect of linoleic acid of the diet
The effect of LNL content of the diet was studied in trial 1 as a consequence of
experimental design. Thus, due to the interaction of the main cereal of the diet and the
type of fat 9 levels of LNL were obtained (from 3.4% to 0.8, for corn-SBO and wheat-
lard respectively). Opposite to the initial hypothesis about the expected effect of LNL on
performance variables, especially, the improve of EW, there were not significant different
between diets on productive variables, thus the level of LNL did not affect the
performance results, specially the EW. In spite of this results, and although no significant
differences were detected, the lower EW was observed for hens fed wheat and lard (62.8
g), and the larger EW was observed for hens fed corn and SBO or AVO (64.9 and 65.0 g,
respectively). Probably, the low LNL content of the wheat and lard, below values
recommended by most researchers (Jensen et al., 1958; Shutze et al., 1959), was
insufficient to maximize EW. Also, was interested to notice the difference in the ratio
between egg size or egg mass produced and LNL intake by the hens fed the different
diets. The ratio was 2.5 times higher for hens fed the lard diets than for hens fed the SBO
diets, with hens fed the AVO diets being intermediate. The information provided in the
current study about the minimum level of LNL to maintain the performance variables was
around 0.9-1.0% whereas under commercial conditions, many commercial guides for
feeding laying hens (H & N international, 2008; Lohmann, 2010) recommend increasing
the level of LNL in the diet to at least 1.8% (2.0 g/hen per d) to maximize egg size. Also,
in experimental conditions Scragg et al. (1987) recommended up to 2.0% dietary LNL to
increase egg size in brown egg-laying hens. However, Shutze et al. (1959), and Grobas et
al. (1999a,b) do not support current feeding practices of using 1.8% LNL in the diet to
maximize egg size in agreement with the current study. In fact, Grobas et al. (1999b) in
brown hens from 22 to 74 wk of age reported no differences in EW among diets differing
Chapter 5. General discussion and conclusions
138
in LNL content from 1.10 to 1.60%.This authors reported that once the LNL requirement
of hens is fulfilled with 1.15% of the diet, the SFAT increased EW independently of the
LNL content of the diet.
In the trial 3, the design of diets provoked that when the energy concentration of
the diet increases, there is usually a concomitant increase in both fat and LNL content.
Thus, the level of added fat used in the diets, increased from 0.92 to 6.02% as the energy
content of the diet increased from 2,650 to 2,950 and the level of LNL increased from
1.35 to 4.0% respectively. In spite of this, the increase in the energy concentration did not
affect the EW among diets in disagreement with the results of Grobas et al. (1999c) who
reported brown hens from 22 to 65 wk of age that an increase in added fat from 0 to 4%
content of the diet resulted in increases in EW. Grobas et al. (1999b) suggested that
laying hens require no more than 1.15% LNL in the diet to maximize EW and that when
this minimal amount of LNL was met, an increase in supplemental fat resulted in further
increases in egg size, irrespective of its LNL content. Therefore, the effects of increasing
the energy content of the diet on EW might depend on the fat and LNL contents of the
basal diet.
1.1.4. Effect of energy content of the diet
The influence of energy content of the diet was studied in experimental 3. Thus,
important variables like FI, EW, FCR, and BW of the hens were affected by treatment.
Thus, in this research, an increase in the energy content of the diet from 2,650 to 2,950
kcal AMEn/kg (an 11% increase) decreased FI by 4% resulting in an increase in energy
intake of 7% in agreement with the results of Bouvarel et al. (2010) who reviewed a
series of experiments conducted in laying hens during the last 20 years and reported that
as an average, a 10% increase in AMEn content of the diet resulted in a reduction in feed
intake of only 5.5% in agreement with the results of the current experiment. However,
Chapter 5. General discussion and conclusions
139
Keshavarz (1998) reported in SCWL from 18 to 66 wk of age that an increase in the
AMEn concentration of the diet from 2,815 to 3,035 kcal/kg (an 8% increase) resulted in
a 9% increase in energy intake.The data indicate that laying hens do not regulate
precisely FI according to requirements and tended to overconsume energy as the AMEn
of the diet increases. Egg production increased as the AMEn concentration of the diet
increased from 2,650to 2,850 kcal/kg but an increase to 2,950 kcal/kg did not result in
any further improvement. Similarly, Mathlouthi et al. (2002) reported in SCWL hens that
egg production increased as the AMEn of the diet increased from 2,650 to 2,750 kcal/kg.
In contrast, Grobas et al., (1999c) in brown hens fed diets varying from 2,680 to 2,810
kcal AMEn/kg, Harms et al. (2000) in brown-and SCWL hens fed diets varying in AMEn
from 2,500 to 3,100 kcal/kg, and Jalal et al. (2006, 2007) in SCWL hens fed diets varying
from 2,800 to 2,900 kcal AMEn/kg did not detect any significant difference in egg
production with changes in the energy content of the diet. These data support the
hypothesis that an excess in energy intake caused by changes in diet composition, results
primarily in increases in BW gain rather than in further increases in egg mass
production.Egg weight was not affected by energy concentration of the diet, consistent
with data of Grobas et al. (1999b), Ciftci et al. (2003), and Valkonen et al. (2008).
However, Harms et al. (2000) and Wu et al. (2005, 2007b) reported that EW increased
linearly with increases in dietary energy. Bouvarel et al. (2010) analyzed data from
11experiments conducted for the last 20 years and reported that EW increased 0.96 g per
each 10 kcal of extra energy intake per day. The reasons for the discrepancies among
authors in relation to the effects of an increase in energy content of the diet on EW are
not apparent but might be related with the level of fat and the linoleic acid (LNL) content
of the experimental diets. Feed conversion ratio improved as the energy content of the
diet increased, in agreement with most published reports (Grobas et al., 1999a,b;Wu et
al., 2005).Hens eat feed to satisfy their energy requirements and therefore, high AMEn

Chapter 5. General discussion and conclusions
140
diets results in better FCR. Moreover, supplemental fat has been shown to reduce rate of
feed passage, facilitating the contact between digesta and enzymes and improving
digestibility and utilization of other nutrients such as the lipid and carbohydrate fractions
of the diet (Mateos and Sell, 1980b, 1981).In contrast, Keshavarz (1998) reported no
differences in feed efficiency in SCWL hens from 18 to 66 wk of age fed diets with 2,820
or 3,040 kcal AMEn/kg. Similarly, Valkonen et al. (2008) reported no differences in
energy efficiency in SCWL hens from 41 to 73 wk of age fed very low (2,380 kcal
AMEn/kg as an average) or low (2,610 kcal AMEn/kg as an average) energy diets. In the
current research, hens fed the higher energy diet (2,950 kcal AMEn/kg) had lower FI but
higher energy intake than hens fed the other diets but the excess of energy was derived to
increases in BW gain rather than to improvements in egg mass production. Consequently,
the efficiency of converting feed energy to egg mass was hindered when the high energy
diet was used. On the other hand, hens fed the low energy diet (2,650 kcalAMEn/kg)
consumed less energy than hens fed the other diets. Probably because of physical
limitation of the gastro intestinal tract (GIT), the amount of energy consumed by the hens
fed the low energy diet was below requirements for optimal egg production, resulting in
reduced egg mass. Body weight gain increased 0.11 g/hen per day per each 100 kcal
increase in AMEn concentration of the diet, a value that was below the 0.20 g reported by
Grobas et al. (1999c) in brown egg-laying hens from 22 to 65 wk of age fed diets varying
in AMEn content from 2,680 to 2,810 kcal/kg, and the 0.45 g reported by Harms et al.
(2000) in SCWL from 36 to 44 wk of age fed diets with 2,520 to 3,080 kcal AMEn/kg. In
contrast, Keshavarz (1998) reported an increase in BW of the hens from 20 to 66 wk of
age of only 0.014, in SCWL hens fed diets varying in AMEn content from 2,820 to 3,040
kcal/kg. Modern brown egg-laying hens might respond to increases in energy content of
the diets with increases in BW gain with effects being more noticeable when high energy
diet sare used.
Chapter 5. General discussion and conclusions
141
The results suggest that modern brown-egg laying hens might not regulate
accurately feed intake according to energy requirements when very high or low energy
diets are used. Hens fed high AMEn diets (i.e., 2,950 kcal/kg in the current trial) tended
to overconsume energy with a positive effect on BWG but not in egg mass production.
On the other hand, hens fed low AMEn diets (i.e., 2,650 kcal/kg in the current trial)
tended to underconsume energy, with a negative impact on egg mass production.
1.1.5. Effect of initial body weight of the hens
The influence of initial body weight of the hens at the onset of lay period was subject of
debate in trials 2 and 3. Nowadays, laying pullets are coming into production and peaking
several weeks earlier than was the case a few years ago. Although there may be some
debate as to the contribution of genetics, management, and nutrition in bringing about this
change, most researchers agree that earlier maturing pullets usually result in more
profitable layers (Leeson and Summers, 2005). One of the problems with earlier maturing
pullets, and a factor that continues to keep them from being readily accepted by the
industry is a higher percentage of small eggs. In spite of this, the potential studies that
could be realized with an earlier maturing pullet and hens at the onset of lay cycle
continues to generate research interest.
The influence of initial body weight of the hens was studied in trial 2 in 672
Lohmann Brown hens which were weighed individually and classified as light (1,592 ±
75 g) or heavy (1,860 ± 86 g) compared with a target BW of 1,640 ± 57 g. Thus,
throughout experimental period ADFI (P< 0.001), egg production (P< 0.001), EW (P<
0.001), and egg mass (P< 0.001) were higher for the heavier than for the lighter hens.
In trial 3 the influence of two groups differing in initial BW was studied in 520
Hy-Line brown hens. Hens were weighed individually and classified as light (1,606 ± 39
g) and heavy (1,733 ± 48g) with a target BW of 1,685± 35g for hens of this age. Like the
Chapter 5. General discussion and conclusions
142
trial 2, heavy hens obtained higher FI (P< 0.001), EW (P< 0.001), egg mass (P< 0.01) and
FCR per dozen of eggs whereas egg production and FCR per kilogram of egg was not
different in this case between both groups of hens. In both studies data are in agreement
with Harms et al. (1982) who reported in three groups of SCWL divided as light (range
from 1,301 to 1,500 g), medium (range from 1,501 to 1,580 g), and heavy (range from
1,581 to 1,780 g), higher FI, egg production, EW, and egg mass (P< 0.05) in heavy hens
than in light hens. Also, Summers and Leeson (1983) reported in SCWL hens divided in
four groups of weight at 18 wks of age as very light (1,107 g), light (1,205 g), medium
(1,281 g), and heavy (1,383 g); higher egg production, FI, and EW (P< 0.05) from 19 to
25 wks. Moreover, Bish et al. (1985) reported in SCWL hens divided into three body
weight categories as light (1,131 g), medium (1,256 g), and heavy (1,377 g) at 20 wks of
age no significant different in egg production but the FI (P< 0.05), FCR per kilogram and
per dozen of egg (P< 0.05) was higher in the heavy hens than lighter hens with the
medium being intermediate. The result of Bish et al. (1985) is partially agreed with the
results of trial 2 and 3.
It is noticeable to comment the different range of weight between trials. In trial 2
the difference between both groups was 268 g as average, while in trial 3 this difference
was 127 g as average. Consequently, the differences in performance variables were more
consistent in trial 2 than in trial 3. Thus, in trial 2 the severe range of BW resulted in light
hens obtained higher BW throughout the laying cycle respect to heavy hens whereas this
effect was not observed in trial 3. In spite of this, the increase in FI and BW of the hens
per each 100 g increased was similar. Thus, in trial 2 FI increased 2.7 g and EW 0.93 g,
and in trial 3 FI increased 2.4 g and EW 0.94 g per each 100 g increase in initial BW of
the hens.
The results of trial 2 and 3 are consistent with Harms et al. (1982) who reported
that the BW increased in all groups of weight but the increase was higher in the light hens

Chapter 5. General discussion and conclusions
143
group. In contrast, Summers and Leeson (1983) reported in four SCWL hens weight
groups from 19 to 25 wks of age that body weight appeared to be the main factor
controlling EW for the young pullet and all four groups of pullets gained a similar
amount of BW from 19 to 25 wks of age, results that are in disagreement with both trials
2 and 3.
1.2. Egg quality in brown egg-laying hens
1.2.1. Effect of the main cereal of the diet
The effects of the main cereal on egg quality were studied in trial 1. The initial hypothesis
about the use of this three cereal was that barley and wheat in high proportion could
increase the percentage of dirty eggs. Also it was though that the high percentage of
wheat will disturb the quality of albumen with a reduction in albumen quality especially
in summer when FI is low. Opposite of the initial hypothesis, the type of cereal did not
affect any of the egg quality traits studied (dirty, broken, shell-less, double yolked egg,
and HU) except for egg yolk colour, which was increased when corn was used. This
effect was expected because all of the diets, independent of the cereal used, were
supplemented with the same amount of exogenous pigment source. The available
information about the effect of the main cereal in the diet on egg quality is scarce. Thus,
the only report available the last year was that of Lázaro et al. (2003a) who compared in
SCWL from 20 to 44 wk of age this 3 cereals in the diet. In this experiment, the inclusion
of barley and wheat increased the percentage of dirty eggs as compared with the inclusion
of corn in disagreement with the current research. However, no other egg quality
variables were affected by the inclusion of corn. This author reported in SCWL that
wheat and barley supplemented with enzymes improves digestibility and could replace
corn successfully in laying hens diets. Thus, when enzymes were added to the wheat and
barley diets, the incidence of dirty eggs decreased to levels similar to those found for the
Chapter 5. General discussion and conclusions
144
corn diet in agreement with the current study. In fact, Safaa et al. (2009) reported that
substitution of corn by wheat in enzyme supplemented diets did not affect the percentage
of dirty eggs in brown hens in agreement with the results of the current trial. Moreover,
Mathlouthi et al. (2003), Lázaro et al. (2003b, 2004), and García et al. (2008) reported
that enzymes reduce intestinal viscosity in poultry and thus improve the consistency of
the excreta. In contrast, Francesch et al. (1995) reported a higher incidence of dirty eggs
in hens fed barley than in hens fed corn.
Shell thickness and shell density was not affected by type of cereal in agreement
with results of Çiftci et al. (2003) who reported in SCWL from 27 to 43 wk of age that
egg shell thickness were not affected when 30% of corn was substituted by wheat. Our
result is strongly consistent because the corn substituted in the current study was 45%.
According with the initial hypothesis of the study, the effect of type of cereal on
albumen quality was studied with the albumen pH measurement. Thus, no effects of
cereal on albumen pH were detected. Woodward et al. (1987) reported that yolk rupture
strength of 50-wk-old hens decreased with the age of the eggs, but that the decline was
more rapid for egg yolks from birds fed a corn diet that from birds fed a wheat diet.
1.2.2. Effect of source, fatty acid profile, and level of supplemented fat of the diet
In trial 1, the type of fat and its effects of egg quality traits were studied. The information
available about the effect of this three fats is scarce. The initial hypothesis about the use
of this three fats were that AVO could increase the percentage of dirty eggs and also it
was though that the high percentage of this fat included in the diet might provoked
problems in egg shell quality. In this context, Lard was the fat source that could be used
in mixtures with AVO to avoid problems. Soybean oil was the control fat used in this
experiment. In spite of the initial hypothesis, the type of fat did not affect any of the egg
quality variables studied including dirty, broken, shell-less, and double-yolked eggs.
Chapter 5. General discussion and conclusions
145
Also, shell characteristics like shell thickness, shell density and HU did not affected by
treatment. This results are in agreement with Fraga-Benitez et al. (1987) who reported in
SCWL hens no effect in shell thickness using 0, 2, 4, 6, 8, or 10% of nonacidulated
sunflower soapstock for 168 d of lay cycle. Also, Pardío et al. (2005) reported in SCWL
hens from 20 to 35 wk of age that increases in soybean soapstock from 25 to 100% in the
diet did not affect shell thickness respect to control diet including SBO. This authors
reported that HU was not affected by treatment in agreement with current study.
Moreover, Safaa et al. (2008) did not find any significant effect in shell quality and HU in
brown hens from 56 to 68 wk of age using palm oil and soy bean oil in the diet.
However, Grobas et al. (2001) using four types of fat (Tallow, olive oil, soy oil, and
linseed oil) respect to the control diet without fat reported higher shell thickness in soy oil
and olive oil respect to tallow and linseed oil. The same authors did not find effect in HU.
The yolk color was the only egg quality variable affected by treatment. Thus, the color
fan values of the yolks were greater with lard than with SBO or AVO supplemented diets.
The fatty acid profile of lard was more saturated than that of the SBO or AVO, an thus,
dietary pigments were probably more stable in the presence of lard than in the presence of
more unsaturated fat sources, both in the feed and in the gastrointestinal tract, result that
is in disagreement with Grobas et al. (2001) who reported in brown hens similar yolk
color among 4 different fat sources (Tallow, olive oil, soy oil, and linseed oil).
The effect of SFAT on egg quality traits was studied in trial 2 and trial 3. Thus, in
trial 2 supplementation of the high CP diet with 3.6% fat did not affect any of the shell
and albumen quality traits studied. In broilers, Atteh et al. (1983) indicated that the
inclusion of saturated fats in the diet increased the formation of soaps between fatty acids
and the Ca salts, resulting in lower Ca retention. In the current experiment, no effects of
extra fat supplementation of the diet on shell quality were observed, data that agree with
results of Safaa et al. (2008) who reported similar egg shell quality in late phase of
Chapter 5. General discussion and conclusions
146
production in hens fed diets with 1.1 or 3% supplemental fat (soy oil or palm oil).
Probably, the amount of Ca soaps present at the small intestine level in the hens of the
current experiment was limited, because the fat used was unsaturated and the soaps
formed may dissociate at the pH values encountered in this section of the gastrointestinal
tract. Yolk pigmentation was lower in eggs from hens fed the diet containing 3.6% fat
than in hens fed the diets containing 1.8% fat, a difference that was expected because
corn was included only in the 1.8% fat supplemented diets. In trial 3, the level of dietary
fat increased from 2.6 to 7.0% as the energy content of the diet increased and the free
added fat might form soaps with the Ca salts present in the feed, resulting in a reduction
in Ca retention and in the relative weight of the shell (Atteh and Leeson, 1983, 1984). In
contrast, Safaa et al. (2008) did not find any difference in hes fed diets with 1.1 or ·3% of
supplemental fat. Probably, the ratio saturated:unsaturated fatty acids in the lipid fraction
of the diet, might affect soap formation, fat digestibility, and final deposition of Ca in the
egg shell.
1.2.3. Effect of linoleic acid of the diet
Due to experimental design of the diets the effect of LNL was studied in trial 1, 2 and 3.
Thus, in trial 1 the LNL content varied among diets depending of the type and fat used in
the diet, thus, the level of LNL ranged between 0.8% (wheat-lard diet) and 3.4% (corn-
SBO). In trial 2, the effect of 3.6 or 1.8% of added fat in the diet provoked the variation
in the LNL content (from 2.5% to 1.9% for the 3.6% and 1.8% of added fat,
respectively). In trial 3, the increase of AMEn of the diet with increases in the fat content
increased the LNL level from 1.35% to 4.01% for the 2,650 and 2,950 kcal/kg diet,
respectively.
The level of LNL did not affect any of the variables studied in trial 1 and trial 2 in
agreement with Safaa et al. (2008) who reported in brown hens that reducing the LNL
Chapter 5. General discussion and conclusions
147
content of the diet from 1.6 to 1.12% did not affect egg quality or proportion of egg
components, which agrees with Grobas et al. (1999c), who reported that LNL levels
ranging from 0.79 to 2.73% in diets for brown hens did not affect the percentage of
broken and dirty eggs, HU, or the proportion of egg components.
In trial 3 the increase in LNL content of the diet did not affect any of the egg
quality variables. The effects on HU, yolk pigmentation, and shell proportion of the egg
in this trial might be related with the SFAT in agreement with Grobas et al. (1999b) who
reported that once the LNL requirement of hen is fulfilled (1.15% of the diet or less),
SFAT increased egg weight independently of LNL and AMEn content of the diet and
might was the origin of differences in shell, yolk, and albumen proportion, and yolk to
albumen ratio.
March and McMillan (1990) and Whitehead et al. (1993) indicated that LNL
supplementation to diets deficient in this essential fatty acid increased yolk weight,
probably through an improvement in the mechanism by which lipoproteins are
synthesized or taken up by the developing ova. In the present study, the increase in LNL
content of the diet did not increase yolk weight, indicating that LNL was not limiting egg
size (including the level of 0.8% in the wheat-lard diet of trial 1).
1.2.4. Effect of energy content of the diet
The effect of energy on egg quality traits was studied in trial 3. Energy concentration of
the diet did not affect the percentage of dirty, broken, or shell less eggs throughout the
laying period, consistent with data of Grobas et al. (1999a). However, albumen quality
decreased linearly with increases in AME concentration of the diet, in disagreement with
data of Zimmermann and Andrews (1987) and Wu et al. (2005). The reasons for the
discrepancies are not apparent but in the experiment of Wu et al. (2005) diets were not
balanced for CP and AA content with increases in energy content, and the authors
Chapter 5. General discussion and conclusions
148
suggested that the decrease in HU observed was possibly due to the lower AA intake of
the hens fed the high energy diets. However, in the current experiment HU decreased
with increases in AMEn concentration, in spite of all diets having similar CP and AA
content per unit of energy. Also, Valkonen et al. (2008) reported in SCWL hens no
significant differences in HU comparing diets from 2,340 to 2,630 kcal AME/kg from 36
to 68 wk of age. Moreover, Gunawardana et al. (2008) did not observe any difference in
albumen quality comparing diets from 2,750 to 3,053 kcal AMEn/kg. Some authors have
been reported that the nutrition of the hens do not appear to have any great effect of
albumen quality (Wells, 1968; Naber, 1979) whereas other authors reported that
ingredient composition might affect albumen quality (Mateos and Puchal, 1982). In this
respect, the main differences in ingredient composition of the 4 diets used in trial 3 were
that the high energy diets had more fat and wheat and less barley than the low energy
diets. However, Grobas et al. (1999a,b) and Safaa et al. (2008) did not observe any effect
of supplemental fat on HU of the eggs, and Lázaro et al. (2003) did not observe any effect
of the main cereal of the diet on albumen quality.
Yolk pigmentation increased linearly with increases in energy concentration of the
diet, in spite of all diets having similar levels of corn and pigmenting additives.
Xanthophylls, the main pigment source responsible for egg yolk color, are highly soluble
in fat. As we increased the energy concentration of the diet, the level of fat increased,
favoring the absorption of xanthophylls in the gastro intestinal tract of the hen in
agreement with Lázaro et al. (2003).
The proportion of shell in the egg decreased linearly as the energy content of the
diet increased, in agreement with the results of Junqueira et al. (2006) who reported in
brown egg-laying hens from 76 to 84 wk of age, a linear decrease in egg shell proportion
as the AMEn increased from 2,850 to 3,050 kcal/kg. However, Gunawardana et al.
(2008) did not find any effect of energy content of the diet on egg shell proportion in
Chapter 5. General discussion and conclusions
149
SCWL fed diets varying in AMEn content from 2,750 to 3,050 kcal/kg. The level of
dietary fat increased as the energy content of the diet increased and the free added fat
might form soaps with the Ca salts present in the feed, resulting in a reduction in Ca
retention and in the relative weight of the shell (Atteh and Leeson, 1983, 1984). In
contrast, Safaa et al. (2008) reported similar egg shell quality in the late phase of the
production cycle of brown egg-laying hens fed diets that included 1.1% or 3% of
supplemental fat (soy oil and palm oil). Probably, the ratio saturated:unsaturated fatty
acids in the lipid fraction of the diet, might affect soap formation, fat digestibility, and
final deposition of Ca in the egg shell.
1.2.5. Effect of initial body weight of the hens
The effect of initial BW of the hens on egg quality variables was subject of debate in trial
2 and 3. In general, the information available about the effect of initial BW of the hens on
egg quality variables in very limited. In trial 2, the hens differing in 2 groups as heavy
(1,860 ± 86 g) and light (1,592 ± 75 g) did not show any difference in egg quality traits
throughout lay period. In trial 3, the hens differing in 2 groups as heavy (1,733 ± 48g)
and light (1,606 ± 39g) the percentage of dirty, broken, and shell-less eggs, and the
albumen quality and yolk pigmentation of the eggs were not affected by the initial BW of
the hens, in agreement with data of trial 2. However, in trial 3, eggs from the heavy hens
had higher proportion of yolk and lower of albumen than eggs from the light hens.
Consequently, yolk to albumen ratio was higher for the heavier than for the lighter hens.
The authors have not found any published report on the effects of initial BW of the hens
on egg quality or on the proportion of egg components to compare with the data of the
current research. Probably, heavy hens produce heavier yolks than lighter hens, because
of their higher feed intake, which may result in eggs with higher proportion of yolk
(Leeson and Summers, 2005).

Annex 1: Resumen en Español
150
UNIVERSIDAD POLITÉCNICA DE MADRID
DEPARTAMENTO DE PRODUCCIÓN ANIMAL
ESCUELA TÉCNICA SUPERIOR DE INGENIEROS AGRÓNOMOS
El amplio resumen en lengua castellana que se presenta a continuación
se presenta para cumplir con uno de los requisitos necesarios para la
presentación de la Tesis Doctoral en Inglés y poder optar así al título de
Doctor Ingeniero Agrónomo.
EL DOCTORANDO
Adriano Pérez Bonilla
INGENIERO AGRÓNOMO
VºBº
DIRECTOR DE TESIS
Gonzalo González Mateos
Dr. INGENIERO AGRÓNOMO

Resumen en Español
Annex 1: Resumen en Español
ANNEX I:
esumen en Español
Annex 1: Resumen en Español
151
Annex 1: Resumen en Español
152
1. Introducción
La producción global de huevos y su comercialización han mostrado un remarcable y
dinámico crecimiento durante los últimos 40 años. Desde el año 1970 hasta el año 2009
la producción de huevo se incremento de una manera más rápida que la producción de
carne de bovino como de porcino. En 1970 la producción mundial de huevo contabilizaba
19.540 millones de toneladas, situándose USA, Rusia, Japón y China como los 4
principales países productores. En 2009 la producción de huevo alcanzó niveles de 62,8
millones de toneladas siendo China, USA, India y Japón los países que lideran la
producción (FAOSTAT, 2011).
La producción de huevos creció entre los años 1960 y 2007 de manera consistente
y rápida en Asia, especialmente en China. En el mismo sentido, África y América del Sur
obtuvieron crecimientos continuos, sin embargo en Europa y Oceanía dichos incrementos
tuvieron una menor importancia cuantitativa (FAOSTAT, 2011). En el año 2007, la
producción asiática contabilizó 38 millones de toneladas de huevo, 2.3 millones de
toneladas en África y 3.4 millones de toneladas en América del Sur.
Debido al manejo y problemas relacionados con la logística, es importante los
huevos que son comercializados internacionalmente. De hecho, en el año 2008 las
exportaciones mundiales de huevo llegaron a valores de 4.083 millones de dólares, un
crecimiento de un 17.7% comparado con datos del año 2004 (FAOSTAT, 2011). Los
países exportadores de huevo sin Holanda, China, España y Polonia. La importación total
de huevos en 2008 supuso un valor de 3.850 millones de dólares, un incremento del
15.3% comparado con datos del año 2004 (FAOSTAT, 2011). Los principales países
importadores de hubo son Alemania, Holanda, Francia y China.
Según datos del FAOSTAT (2011), el consume per capita de huevo mejoró en el
período comprendido entre el año 2000 y el 2007. La media global se incrementó desde
Annex 1: Resumen en Español
153
8.1 kg hasta 8.6 kg por persona y año en 2007. Particularmente incipiente es el
crecimiento del consumo per cápita en Asia (8.8 kg de huevo por persona y año).
Estudios llevados a cabo por la FAO indican que en el año 2010 el consumo medio
mundial se situó en 9.2 kg por persona y año (un incremento de un 7% respecto al año
2007).
Según el MARM (2010) el número total de ponedoras en España se situó en 44
millones de aves. Este censo representó un total de 1370 explotaciones.
Aproximadamente, 95.7% de las ponedoras presentes en España se alojaron en jaulas,
4.2% supusieron las ponedoras explotadas en suelo (camperas y aviario) y sólo u 0.1%
fueron ponedoras explotadas bajo el régimen de producción biológica u orgánica. La
legislación referente al bienestar animal ha producido variaciones en estos.
La producción española obtuvo en el año 2004 el mejor dato productivo de su
historia (1.13 x 10³ millones de docenas). De esta producción Castilla-La Mancha (32%),
Castilla y León (17%), Valencia (9%) y Cataluña (8%) representaron más del 60% de la
producción global española. En general la avicultura de puesta española tiene un marcado
carácter exportador, de hecho, del total de la producción española, aproximadamente un
23% del total de la producción fue utilizado para la exportación. Los principales países
destinatarios de esta mercancía se sitúan dentro de la Unión Europea con Francia (41%),
Alemania (14%), Reino Unido (12%), Holanda (11%) y Portugal (11%) (MARM, 2010).
En cuanto a la tendencia en el consumo de huevo, en el período comprendido
entre el año 2000 y 2009, el consumo de huevo descendió desde 17.5 kg por persona y
año a 11.3 kg por persona y año (un descenso de un 36%).
El éxito económico de toda industria dedicada a la producción de huevos depende
de la masa de huevo producida por cada ave alojada en la instalación a lo largo de todo el
período de puesta. Este objetivo depende de la duración del período de puesta así como
del número de huevos producidos y el tamaño de los mismos. Secundariamente, el
Annex 1: Resumen en Español
154
porcentaje de huevos comercializables y el coste relativo de las materias primas son
importantes factores que han de ser considerados para alcanzar estos objetivos
económicos. La obtención del mayor número de huevos comercializables, está
relacionado con la calidad externa e interna del huevo, reduciéndose la incidencia de
huevos rechazados antes de su comercialización. Unos datos productivos óptimos
dependen principalmente de la capacidad genética del animal unido a un óptimo estatus
sanitario. En este sentido, el manejo de la nutrición y alimentación tanto en pollitas como
en ponedoras son factores que contribuyen a la mejora de dichos parámetros productivos.
Así, el éxito económico de las explotaciones de gallinas ponedoras requiere una curva de
producción óptima, con una persistencia alta a lo largo de todo el período de puesta y un
pico de puesta máximo, acorde con la genética del ave. Es generalmente aceptado que un
pico de producción elevado está positivamente relacionado con una masa de huevo por
ave alojada elevada.
El tamaño del huevo tiene unas importantes connotaciones relacionadas con el
éxito económico de toda explotación de ponedoras, especialmente en países como España
donde el consumidor prefiere huevos con un peso mayor para el consumo.
Consecuentemente, bajo estas circunstancias, los productores tienden a incrementar la
duración del período de puesta debido a que las gallinas incrementan el peso del huevo a
medida que incrementan su edad. El objetivo del nutricionista es formular dietas que
maximicen las variables productivas (porcentaje de puesta y peso del huevo), desde los
primeros estadios productivos y reduciendo los problemas que aparecen al final del ciclo
productivo. Para cumplir con estos objeticos, el nutricionista necesita jugar con los
niveles de nutrientes, requerimientos energéticos, proteicos y aminoacídicos, así como el
uso de distintas materias primas que tienen una importancia clave en cuanto al coste de
las fórmulas (cereales y grasas). Secundariamente, el nutricionista necesita obtener lotes
Annex 1: Resumen en Español
155
con una alta uniformidad y peso vivo adecuados a la estirpe al inicio del período de
puesta.
Unas variables productivas y una calidad del huevo óptima son los 2 principales
factores que tienen que producirse en una industria de avicultura de puesta. Para alcanzar
estos 2 objetivos, un buen manejo nutricional de las aves es clave. Es importante, por
tanto, comprobar los efectos del manejo nutricional de las aves a lo largo del periodo de
puesta mediante la comprobación sistemática de la calidad externa del huevo (porcentaje
de huevos rotos, sucios y fárfaras) e interna del huevo (altura de albumen, color de yema,
y proporciones de yema y albumen). En general, según datos de Roland et al., (1988) las
pérdidas desde las granjas hasta el consumidor final se situó entre un 5-7% para el total
de la producción. La mayoría de esas pérdidas están relacionadas con una calidad pobre
de la cáscara especialmente al final del período de puesta.
En el presente trabajo de investigación se estudiaron los efectos de componentes
nutricionales clave tanto para las variables productivas como para la calidad del huevo en
gallinas ponedoras rubias a lo largo de todo el período experimental. Los factores
estudiados fueron: 1) El efecto del cereal principal y el tipo de grasa en la dieta, 2) El
efecto del nivel de proteína bruta y grasa añadida en la dieta, 3) El efecto del nivel
energético in la dieta, 4) El efecto del peso inicial de las gallinas al inicio del período de
puesta, sobre las variables productivas y la calidad del huevo..
2. Revisión bibliográfica
Los cereales son ricos en almidón y son comúnmente utilizados como fuentes energéticas
en raciones para avicultura. Además, los cereales suministran parte de proteína bruta y
aminoácidos requeridos por las aves. La utilización del almidón por las aves depende
principalmente del cereal utilizado ya que difieren en la naturaleza y estructura. La
digestión del almidón depende de factores como el contenido de la pared celular, la
Annex 1: Resumen en Español
156
naturaleza granular del almidón y la presencia de factores antinutritivos en el grano, así
como la capacidad digestiva del animal (Classen, 1996). Numerosos estudios han sido
realizados para obtener el valor nutricional de diferentes almidones provenientes de
cereales en gallinas ponedoras. Sin embargo, el valor nutricional de dichos almidones no
ha sido ajustado todavía.
Los principales cereals producidos en España y utilizados en dietas para
ponedoras son el Maíz (Zea mays L.), Trigo (Triticum L.) y Cebada (Hordeum vulgare
L.). El Maíz tiene menos proteína bruta (7.5% vs. 10.2% vs. 9.6%) y fibra bruta (2.3% vs.
2.6% vs. 4.7%). Sin embargo, tiene más almidón (63.3% vs. 60.2% vs. 53%), grasa bruta
(3.6% vs. 1.6% vs. 1.8%), ácido linoléico (1.81% vs. 0.64% vs. 0.71%) y energía (3,280
vs. 3,100 vs. 2,800 kcal/kg) que el trigo y la cebada. (Fundación Española Desarrollo
Nutrición Animal, 2010). La composición química y el valor nutricional de maíz is
bastante uniforme comparada con la del trigo y la cebada, sin embargo, dichas
características dependen principalmente de factores como el cultivar de origen, las
prácticas agronómicas, las condiciones climáticas, el tiempo de almacenaje, las
características físicas del grano y en último caso el tipo de ave (Pirgozliev et al., 2003;
Gutiérrez-Álamo et al., 2008; Frikha et al., 2011).
En condiciones prácticas, muchos productores de huevo formulan dietas para
ponedoras con una mínima cantidad de maíz con el objetivo de asegurar altos consumos,
maximizando de esta manera el tamaño del huevo sobre todo en las primeras fases del
ciclo de puesta, momento especialmente importante cuando una estimualción temprana es
utilizada en las pollitas. En general, las razones de esta práctica son desconocidas pero
quizá estén relacionadas con la mayor uniformidad del valor nutricional del maíz y la
obtención de una mejor estructura del pienso al utilizar una molienda grosera en dicho
cereal (Frikha et al., 2009). Asimismo, el maíz tiene una mayor concetración de ácido
linoleico (LNL) en comparación con el trigo y la cebada, con lo cual, el mayor contenido

Annex 1: Resumen en Español
157
de LNL en la dieta quizá resulte en incrementos en el peso del huevo sobre todo en aves
jóvenes bajo condiciones climáticas que propicien bajos consumos (Jensen et al., 1958;
Scragg et al., 1987; Grobas et al., 1999a).
Por otro lado, el trigo y la cebada contienen altas cantidades de factores
antinutritivos como son los polisacáridos no amiláceos en forma de arabinoxilanos y β-
glucanos, los cuales, incrementan la viscosidad de la digesta y producen una disminución
en los rendimientos productivos de los animales (Lázaro et al., 2003, García et al., 2008).
Por ello, el nivel de inclusión del trigo y la cebada en dietas para aves depende de varios
factores como son la especie, la edad de los animales y el perfil de nutrientes incluyendo
la energía, el contenido en proteína y los polisacáridos no amiláceos. Diversos estudios se
han llevado a cabo con el objetivo de comparar estos tres cereales (maíz, trigo y cebada)
y su efecto en las variables productivas de ponedoras, broilers y pollitas. En general, estos
estudios sugieren que el trigo y la cebada son una buena alternativa al maíz en dietas para
estas 3 especies. En ponedoras, Craig y Goodman. (1993), Lázaro et al. (2003), Liebert et
al. (2005), y Safaa et al. (2009) han obtenido resultados productivos similares
comparando el maíz con el trigo y la cebada suplementadas con enzimas exógenas
(xilanasas y β-glucanasas) mientras que otros autores como es el caso de Coon et al.
(1988) obtuvieron mayores consumes y peor IC en animales alimentados con cebada
suplementada con enzima, respesto de los animals alimentados con maíz. En broiler,
Mathlouthi et al. (2002) obtuvo parametros productivos similares cuando un 60% de maíz
en la dieta fue sustituido por una combinación de 40% de trigo y 20% de cebada. En el
mismo sentido, Ruiz et al. (1987) obtuvo una ganancia diara e IC similar en broilers
alimentados en harina cuando el maíz fue sustituido por el trigo. Sin embargo,
contrariamente a estos resultados Crouch et al. (1997) al comparar el maíz con dos
variedades de trigo en un 40% de inclusión en dietas en harina, obtuvo mejor ganancia
media diaria e IC en animales alimentados con una de las dos variedades de trigo. En
Annex 1: Resumen en Español
158
pollitas, Frikha et al. (2009) obtuvo una mayor ganancia media diaria en pollitas
alimentadas con maíz que las que fueron alimentadas con trigo, siendo ambas dietas
suplementadas con enzimas. Las razones de estas discrepancias son desconocidas pero
quizá estén relacionadas con el diseño de las dietas basales.
La infomación disponible sobre los efectos de la utilización de distintos cereales
en la dieta sobre la calidad del huevo es escasa. En general, la inclusión de cebada y trigo
ha sido asociada a un aumento en la incidencia de huevos sucios en comparación con el
maíz (Francesch et al., 1995). En este sentido, Lázaro et al. (2003) al sustituir maíz por
trigo en dietas de gallinas ponedoras blancas en el período 20-44 sem de vida obtuvo un
mayor porcentaje de huevos sucios en los animales alimentados con trigo respecto de los
alimentados con maíz. Sin embargo, otros autores (Jamroz et al., 2001; Çiftci et al., 2003;
Safaa et al., 2009) informan que dietas basadas en trigo y cebadas suplementadas con
enzimas obtuvieron los mismos resultados en cuanto al porcentaje de huevos sucios que
los animales alimentados con maíz.
Las grasas son utilizadas en avicultura con el objetivo de incrementar la energía
de las dietas. La inclusión de grasa en la dieta normalmente esta asociada a un incremento
en la peso del huevo. La utilización de grasas produce a menudo incrementos en la
energía ingerida por el ave, asi como incrementos en el peso vivo y el peo del huevo
(Grobas et al., 2001; Bouvarel et al., 2010), probablemente debido a una mejora en la
palatabilidad del pienso como consecuencia de una menor formación de finos (ISA
Brown, 2011). La suplementación de grasa ha demostrado tener un efecto positivo en la
reducción del tránsito digestivo, facilitando el contacto de la digesta con las enzimas
digestivas, mejorando la digestibilidad y utilización de otros componentes de la dieta
como son los carbohidratos (Mateos y Sell, 1980b, 1981). Whitehead et al. (1993)
estudiaron los efectos de la grasa suplementada en la dieta sobre el peso del huevo
concluyendo que los animales alimentados con aceite de maíz obtuvieron un mayor peso
Annex 1: Resumen en Español
159
de huevo respecto de los animales alimentados con grasa poliensaturada de cadena larga
(aceite de pescado), saturadas de cadena media y larga (Sebo) y saturada de cadena corta
(aceite de cacahuete). La razón para la mejora del aceite de maíz respecto del resto de
grasas fuera un perfil de ácidos grasos más apropiado (poliinsaturado de cadena media-
larga) para el incremento del peso del huevo. Grobas et al. (2001) estudiaron el efecto de
cuatro grasas suplementadas en la dieta sobre el peso del huevo, y reporta que las gallinas
alimentadas con aceite de soja obtuvieron huevos con un peso mayor que las gallinas
alimentadas con aceite de linaza, aceite de oliva o sebo. Un factor a tener en cuenta en el
manejo de las grasas en la dieta es el que comentan Atteh and Leeson (1983, 1984, 1985)
al estudiar el efecto del perfil de los ácidos grasos sobre el metabolismo mineral de la
ponedora y el broiler. Estos autores reportan que la grasa y algunos minerales en la dieta
pueden interferirse mutuamente, llegándose a la formación de sopas o jabones insolubes
responsables del descenso en la absorción tanto de los ácidos grasos presentes en la grasa
como de los minerales. Según estos autores, dicho efecto tendría una mayor relevancia
dependiendo de la presencia de ácidos grasos saturados (palmítico y estárico) en la dieta.
Diversos estudios han mostrado que la reducción en la grasa añadida al pienso
produce una disminución en el tamaño del huevo (Keshavarz y Nakajima, 1995; Grobas
et al., 1999a,b; Bohnsack et al., 2002; Sohail et al., 2003). Así, Grobas et al. (2001)
reportan que la grasa suplementada en la dieta mejora el peso del huevo y la masa de
huevo exportada tanto en gallinas blancas como en gallinas rubias a lo largo de todo el
período de puesta. El mismo autor Grobas et al. (1999b) al comparar dietas isonutritivas
que diferían en el contenido de grasa añadida desde 0 a 4% en gallinas rubias en el
período 22-65 sem, observan que la grasa añadida mejora las rendimientos productivos y
el peso del huevo. Sin embargo el mismo autor (Grobas et al., 2001) no obtuvo nuevos
incrementos en el peso del huevo al aumentar la inclusión de grasa en la dieta desde 5% a
10%. Whitehead et al. (1993) utilizando 5 niveles de inclusion de grasa (0, 10, 20, 40,

Annex 1: Resumen en Español
160
and 60 g/kg dieta) y 4 tipos de grasas (aceite de maíz, aceite de cacahuete, sebo y aceite
de pescado) observó que a excepción del aceite de pescado, el cual mejoraba los
rendimientos productivos hasta niveles de 20 g/kg de dieta, el resto de grasas obtuvieron
buenos resultados productivos hasta niveles de 40 g/kg dieta.
Los principales efectos de la grasa añadida al pienso sobre la calidad del huevo
están relacionados con la proporción relativa tanto de yema como de albumen. Grobas et
al. (1999a) observaron que el incremento en el peso del huevo, como consecuencia de la
inclusión de grasa añadida al pienso, incremento tanto el porcentaje de yema como de
albumen en una cantidad cercana al 3.5%. Posteriormente, dichos autores (Grobas et al.,
1999b) observaron incrementos tanto en la proporción de yema como de albumen pero el
incremento fue proporcionalmente mayor en el albumen. Whitehead et al. (1991)
observaron que la grasa añadida incrementó el peso de la yema debido a la estimulación
en la deposición lipídica y el peso del albumen mediante la estimulación estrogénica.
Posteriormente, Whitehead (1995) reportó que los efectos beneficiosos de la grasa
añadida al pienso sobre la proporción de albumen son debidos a la influencia de ciertos
ácidos grasos insaturados en la producción estrogénica, la cual, es la principal
responsable de la secreción de albumen. Sin embargo, (Usayran et al., 2001; Grobas et
al., 2001) no observaron ningún efecto en las unidades haugh con la grasa añadida al
pienso. En cuanto al efecto de la grasa añadida al pienso sobre el resto de variables
relacionadas con la calidad del huevo destacar que Parsons et al. (1993) observarón que
una reducción en la grasa añadida al pienso desde un 6% a un 2% redujo la proporción de
huevos de gramaje L y XL en gallinas blancas al igual que Bohnsack et al. (2002).
Trabajos experimentales previos han mostrado que la grasa añadida tiene un
efecto positivo sobre el peso del huevo, debido entre otras cosas, a un incremento en LNL
de la dieta a medida que la grasa se incrementa en la dieta (Shannon and Whitehead,
1974; Sell et al., 1987; Keshavarz, 1995; Grobas et al., 1999a). De este modo, el efecto y
Annex 1: Resumen en Español
161
necesidades de LNL para maximizar la productividad de las ponedoras y el peso del
huevo es objeto de debata. En condiciones comerciales, muchas guías de manejo de
gallinas ponedoras (H& N International, 2008; Lohmann, 2010) recomiendan
incrementar el nivel de LNL en la dieta con un mínimo de 1.8% con el objetivo de
maximizar le peso del huevo. Sin embargo, Shannon and Whitehead (1974) y Whitehead
(1984) recomendaron niveles de 1.0% en la dieta mientras Scragg et al. (1987)
recomendó niveles por encima de un 2.0% para maximizar el peso del huevo en gallinas
rubias. Ribeiro et al. (1997) observaron un mayor peso del huevo en reproductoras
pesadas alimentadas con un nivel de LNL de 1.9% respecto de gallinas alimentadas con
niveles de un 1.5%. Grobas et al. (1999b) estudió el efecto del nivel de LNL en gallinas
ponedoras rubias en el período 22-65 sem de vida y observó que la reducción desde
1.65% hasta 1.15% en el nivel de LNL no afectó a las variables productivas. Estos
autores concluyeron que las necesidades en LNL en gallinas ponedoras rubias con el
objetivo de maximizar la productividad en el período 22-65 sem no es mayor que 1.15%.
Asimismo, Grobas et al. (1999c) observaron que niveles de LNL de 0.79% tendió a
reducir el peso del huevo respecto de niveles de 1.03 o 2.23% en gallinas ponedoras
rubias en el período 20-32 sem de vida, sin embargo, el resto de variables productivas no
se vieron afectadas por el tratamiento.
Respecto de la influencia del nivel de LNL sobre los parámetros de calidad del
huevo, Grobas et al. (1999c) observaron que el nivel de LNL no afectó al porcentaje de
huevos comercializables, porcentaje de huevos rotos, sucios, unidades haugh, o la
proporción de yema o albumen. March y McMillan (1990) y Whitehead et al. (1993)
indicaron que la suplementación con LNL en dietas deficitarias en este ácido graso
esencial, incremento el peso de la yema, probablemente mediante una mejora en el
mecanismo de síntesis de lipoproteínas llevado a cabo en el oviducto.
Annex 1: Resumen en Español
162
El concepto de perfil de proteína ideal puede ser definido como el balance exacto
de AA, sin deficiencias ni excesos, necesarios para el mantenimiento y la producción del
ave. Maximizar la efectividad en el uso de proteína conlleva el reducir las emisiones de
nitrógeno, reducir los costes de producción e incrementar el beneficio de la explotación.
El nivel de proteína bruta y el nivel de AA tienen un importante rol en el tamaño del
huevo. Así, las necesidades de una gallina ponedora son entre 2-4 g para su
mantenimiento y entre 10-13 g para la producción de huevo. En el período de puesta, las
gallinas necesitan al menos 17 g de proteína bruta para expresar su máximo potencial
genético (Summers, 1986). Las dietas para gallinas ponedoras están formuladas para
cubrir las necesidades para los AA limitantes en la producción de huevo como son la Lys,
Met, Thr y TSSA. Según el NRC (1994) las dietas basadas en maíz y harina se soja con
un 15.0% de proteína bruta pueden satisfacer las necesidades en AA en gallinas
ponedoras que consumo de media diaria 110 g. Sin embargo, las actuales guías de manejo
comercial de ponedoras (Lohmann, 2010; ISA Brown, 2011) recomiendan niveles de
proteína bruta que varían entre 17.4 %-18.2 %.
Existen discrepancias sobre el efecto del nivel de proteína bruta y el peso del
huevo. En general es aceptado que el peso del huevo se incrementa a medida que el nivel
de proteína bruta es incrementado (Hawes y Kling, 1993; Hussein et al., 1996; Bouvarel
et al., 2010) especialmente al comienzo del período de puesta (Parsons et al., 1993). Sin
embargo, otros autores no observarón beneficios en los parámetros productivos utilizando
niveles por encima de los recomendados por el NRC (1994) de 16.5%. Keshavarz y
Nakajima (1995) observaron que el incremento en el peso del huevo con el incremento en
el nivel de proteína bruta fue debido a un incremento en la proporción de albumen. Sin
embargo, después del pico de puesta las gallinas tendieron a consumir más viéndose
aumentado la proporción de grasa corporal en estos animales (Proudfoot et al., 1988). Por
ello, es una buena práctica reducir el porcentaje de proteína en la dieta a lo largo del
Annex 1: Resumen en Español
163
período de puesta con el objetivo de mejorar la eficacia nutricional (Harms, 1986).
Summers (1986) observó al final del ciclo de puesta la existencia de un coste energético
extra producido como consecuencia de los procesos oxidativos para eliminar el exceso de
nitrógeno, produciéndose heces líquidas, huevos de mayor tamaño y una calidad de
cáscara pobre. Como contraste, diversos autores (Pilbrow y Morris, 1974; Wethli y
Morris, 1978; Huyghebaert et al., 1991; Joly, 1995) recomiendan mantener un nivel de
proteína al final del período de puesta debido a la pobre eficiencia en el uso de los AA
por parte de las gallinas viejas.
Ballam (1985) observó que las necesidades en aminoácidos fueron mayores para
optimizar el peso del huevo que para optimizar el porcentaje de puesta de los animales.
Este autor estimó que se puedía utilizar un incremento del 10% en Met y Lys para
incrementar el peso del huevo sin ningún efecto en el porcentaje de puesta. En el mismo
sentido, Summers et al. (1991) observaron que una deficiencia en el nivel de proteína
bruta de la dieta afectó de manera más importante al tamaño del huevo que a la
producción de huevo. Sin embargo, Morris y Gous (1988) se mostraron en desacuerdo
con estos resultados ya que observaron que los coeficientes de variación para ambas
variables (peso del huevo y porcentaje de puesta) eran distintos, concretamente 0.20 y
0.10 respectivamente; con lo cual, pequeñas diferencias en el peso del huevo darían
diferencias significativas mientras que las mismas diferencias en el caso del porcentaje
de puesta no serían significativamente distintas. Estos mismos autores realizaron una
revisión de las necesidades en proteína bruta y AA en gallinas ponedoras, observando
reducciones similares en el peso del huevo y en la producción de huevo con reducciones
de un 10% en el nivel de proteína bruta de la dieta, sin embargo, con reducciones
mayores la reducción fue mas severa en la puesta que en el peso del huevo.
Schutte y col. (1994) realizaron una revision sobre una serie de experimentos
basados en las necesidades de AA azufrados y Met. Así, Roland et al. (1992)
Annex 1: Resumen en Español
164
recomiendan altos niveles de AA azufrados al comienzo del periodo de puesta, mientras
que Summers y Leeson (1993) y Klien y Hawes (1990) no observaron ninguna mejora en
los parámetros productivos. El segundo aminoácido limitante en las dietas es la Lys
(March y Biely, 1963; Sell y Hodgson, 1966). Joly (1995) observó que una deficiencia
en la cantidad de lys en la dieta producía una disminución en la masa de huevo, debido a
una reducción en la producción de huevo y en peso de huevo de 65% y 35%
respectivamente. En el mismo sentido, Nathanael y Sell (1980) observaron que el peso
del huevo se incrementó de forma cuadrática con el incremento del nivel de lys en la
dieta. Contrariamente, Harms y Ivey (1993) y Prochaska et al. (1996) no detectaron
ningun efecto sobre las variables productivas al incrementar el nivel de lys en la dieta. Es
posible que en el estudio de Nathanael y Sell (1980) otro AA fuera limitante.
En general es aceptado que la calidad del huevo, incluyendo el porcentaje de
huevos sucios, la altura de albumen y la calidad de cáscara son afectados por el
contenido de proteína en la dieta. En este sentido, Hammershoj y Kjaer (1999)
observaron un empeoramiento en las unidades haugh a medida que el nivel de proteina
bruta se incrementó desde 13.7% hasta 17.9%. Sin embargo, Fariborz et a. (2007)
observaron en dietas isoenergéticas que diferían en el contenido de protein bruta (16.3
vs. 17.8%) que la altura de albumen, espesor de cáscara y resistencia a la fractura de la
cáscara no fueron afectadas por el nivel de proteína en la dieta.
El análisis del balance energético es la manera de calcular el consumo de alimento
diario y la producción diaria en el ave (De Blas, 1991). Este autor, analizó una serie de
experimentos estimando unas necesidades medias de mantenimiento de 107,8 kcal
EMA/kg0,75 con unos márgenes desde 90 a 120 kcal EMA/kg0,75, 8,39 kcal EMA/g para
incrementos en el PV y 1,94-2,25 kcal EMA/g para cubrir las necesidad energéticas de
producción. Así, una gallina ponedora con un PV de 2.0 kg con una GMD de 0.8 g/d, con
una massa exportada de huevo de 58 g/d, necesita entre 300-320 kcal de EMA por día.
Annex 1: Resumen en Español
165
Las gallinas comen para satisfacer sus necesidades energéticas, consecuentemente, un
incremento en el nivel energético de la dieta debería disminuir el consumo
proporcionalmente (Hill et al., 1956). Bouvarel et al. (2010) revisaron una serie de
experimentos llevados a cabo en gallinas ponedoras en los últimos 20 años llegando a la
conclusion que, como media, un incremento del 10% en el contenido energetico de la
dieta reduce sólo un 5.5% el consumo de los animales. Los cambios en la concentración
energética de la dieta han producido resultados contradictorios respecto a la
productividad de las aves (Harms et al., 2000). Grobas et al. (1999c) observaron que un
incremento en la EMAn desde 2,680 a 2,810 kcal/kg (un incremento de un 4.8%)
disminuyó el consumo en la misma proporción (un 5.0%) pero la producción de huevos y
la masa exportada por animal no fue afectada por el tratamiento. En el mismo sentido,
Peguri et al. (1991) observaron un descenso de un 5% en el consumo cuando el nivel
energético de la dieta fue incrementado desde 2,700 a 2,910 kcal/kg ( un incremento de
un 8%). Sin embargo, Joly y Bougon (1997) observarón en gallinas rubias en el período
19-68 sem de vida un incremento de un 1.3% en la puesta y un 4.5% en la masa de huevo
a medida que el contenido energético se incremento desde 2,200 a 2,700 kcal de EMAn.
Diversos trabajos publicados sobre el efecto del nivel energético de la dieta
informan que el incremento en el nivel de EMA en la dieta conlleva un incremento en el
peso del huevo (De Groote, 1972; Walker et al., 1991). En general, las gallinas tienden a
mantener su ingesta de energía modificando el consumo (Leeson et al., 1973; Newcombe
y Summers, 1985), sobreconsumiendo energía en dietas altas en energía (Morris, 1968;
De Groote, 1972; Walker et al., 1991) y con ello este exceso de nutrientes produce el
incremento en el peso del huevo (De Groote, 1972; McDonald, 1984; Leclerq, 1986;
Walker y col., 1991). Según estos autores el peso del huevo mejora en unos márgenes
entre 0.10% - 0.21% por cada 100 kcal. Bouvarel et al. (2010) analizando datos de 11
trabajos experimentales llevados a cabo en los últimos 20 años informó que el peso del
Annex 1: Resumen en Español
166
hubo se incremento en 0.96 g por cada 100 kcal de incremento en la energía de la dieta.
Las razones de las discrepancias entre autores en relación con los efectos de incrementar
el contenido energético de la dieta sobre el peso del huevo no son claros pero quizá estén
relacionados con el nivel de grasa y LNL en la dieta control.
Los efectos del nivel energetico de la dieta sobre las variables productivas en
ponedoras muestran diferentes resultados. Mathlouthi et al. (2002) observó en gallinas
blancas que la producción de huevo aumentaba a medida que el contenido energético de
la dieta aumentó desde 2,650 a 2,750 kcal EMA/kg, mientras, Grobas et al., (1999c) en
gallinas rubias observó el mismo efecto utilizando dietas desde 2,680 a 2,810 kcal
EMAn/kg. Sin embargo, Jalal et al. (2006, 2007) en gallinas blancas utilizando dietas que
variaron desde 2,800 a 2,900 kcal EMA/kg no detectaron ningún efecto en la producción
de las aves. En general, en condiciones prácticas es una práctica común incrementar el
nivel energético de la dieta al inicio del período de puesta, especialmente, cuando las
pollitas recibidas en la nave de puesta no tienen un peso adecuado ni homogéneo. Así,
algunos autores observan que en climas cálidos el incremento de la concentración
energética de la dieta mejora los parámetros productivos especialmente en gallinas ligeras
(Kling y Hawes, 1990; Daghir, 1995).
Respecto al efecto del nivel energético sobre la calidad del huevo, existen
discrepancias entre autores. Así, Grobas et al. (1999a) observaron que el incremento en el
contenido energético de la dieta no afecto al porcenaje de huevos sucios, rotos o
fárfararas a lo largo del período de puesta. Algunos autores han observado que el nivel
energético de la dieta tiene influencia en la calidad del albumen. Así, Wu et al. (2005)
observaron que un incremento en el contenido energético de la dieta desde 2,720 a 2,960
kcal EMA/kg oiriginó un descenso en las unidades haugh. Sin embargo, Zimmermann y
Andrews (1987) y Junqueira et al. (2006) no observaron ningun efecto en la calidad del
albumen cuando el contenido energético de la dieta fue incrementado.
Annex 1: Resumen en Español
167
Las xantofilas, la principal fuente de pigmentación de la yema de huevo son
solubles principalmente en la grasa. Gunawardana et al. (2008) observaron una mayor
pigmentación de la yema en gallinas blancas alimentadas con un 5.0% de grasa añadida
respect de gallinas alimentadas con una dieta control sin grasa añadida. Lázaro et al.
(2003) observaron una mayor pigmentación de yema en gallinas blancas con dietas que
contenían una mayor concentración energética. Además, cuando la grasa es utilizada para
incrementar el nivel energético de la dieta la proporción de cáscara presente en el huevo
puede verse afectada. Junqueira et al. (2006) observaron en gallinas ponedoras rubias un
descenso lineal en la proporción de cáscara a medida que el nivel energético de la dieta se
incremento desde 2,850 a 3,050 kcal EMA/kg en el período 76-84 sem de vida.
Contrariamente, Gunawardana et al. (2008) no observaron ningun efecto al aumentar en
nivel energético de la dieta desde 2,750 a 2,050 kcal EMA/kg sobre la proporción de
cáscara.
El consumidor español tiene preferencia por huevos con mayor gramaje, por los
cuales paga un mayor precio en el Mercado. En consecuencia, los productores de huevo
necesitan obtener un alto porcentaje de huevos de tamaños L y XL. La cantidad de
huevos L en la primera parte del ciclo de puesta es un reto. Así, el incremento del
porcentaje de huevos de mayor tamaño, el consumo diario, el peso vivo y una adecuada
uniformidad del lote de pollitas que inicia el período de puesta bajo condiciones de clima
calido como es el caso de España, es un reto a alcanzar (Frikha et al., 2009).
La información disponible sobre los efectos del peso vivo inicial al comienzo del
período de puesta sobre los parámetros productivos y la calidad del huevo es muy escasa.
El peso vivo al inicio del período de puesta es el principal factor que influye en la
productividad de las gallinas ponedoras. El peso del huevo a lo largo del ciclo de puesta
esta fuertemente influenciado por el peso vivo inicial del ave al inicio de puesta (Harms
et al., 1982; Leeson and Summers, 1987). Las gallinas que inicial el ciclo de puesta con
Annex 1: Resumen en Español
168
un peso por encima del estándar racial, tienen consumos mayores y producen huevos de
mayor gramaje a lo largo del ciclo de puesta respecto de gallinas que inician la puesta con
un peso inferior al estándar racial (Summers and Leeson, 1983; El Zubeir and
Mohammed, 1993). Bish et al. (1985) observó que gallinas blancas pesadas (1,377 g)
producían huevos más pesados que gallinas de peso medio (1,256 g) o gallinas ligeras
(1,131 g). Además, las gallinas pesadas produjeron mayor masa de huevo pero tuvieron
un IC por kg similar a las gallinas ligeras, confirmando los resultados de Keshavarz
(1995) el cual observó diferencias en el peso del huevo de 1.4 g entre 2 grupos de
ponedoras clasificadas como pesadas (1,333 g) o ligeras (1.151 g) en el período
productivo 18-62 sem de vida.
La información disponible sobre los efectos del peso vivo inicial sobre la calidad
del huevo es muy escasa. En general, es aceptado que los huevos procedentes de gallinas
más pesadas (por encima del estándar racial), son más pesados que los procedentes de
gallinas ligeras (por debajo del estándar racial). Asimismo, las gallinas pesadas poseen
una mayor proporción de yema y menor de albumen que las gallinas ligeras.
Probablemente, las gallinas pesadas producen yemas de mayor tamaño ya que su
consumo diario es mayor y como consecuencia el tamaño del huevo es mayor (Leeson
and Summers, 2005)
Annex 1: Resumen en Español
169
3. Objetivos de la Tesis Doctoral
El objetivo principal de la presente Tesis Doctoral fue estudiar la influencia de diversos
factores que afectan tanto a la productividad como a la calidad del huevo en gallinas
ponedoras rubias. Así, para alcanzar estos objetivos, se llevaron a cabo 3 experimentos en
el período 2009-2011 bajo condiciones comerciales de manejo. El efecto del tipo de
cereal principal y el tipo de grasa en la dita (experimento 1), el nivel de proteína bruta en
la dieta y el peso vivo inicial de la gallina al inicio de puesta (experimento 2), y el nivel
de energía en la dieta y el peso vivo inicial de la gallina al inicio de puesa (experimento
3) fueron diseñados bajo los anteriores objetivos. Secundariamente, se estudio la
influencia del manejo sobre los factores nutricionales y el uso de materias primas clave
en la nutricion de ponedoras con el objetivo de reducir los costes de producción a nivel
práctico.
Efectos del cereal principal y el tipo de grasa en la
dieta sobre los parámetros productivos y la calid
del huevo en gallinas ponedoras rubias en el
periodo
POULTRY SCIENCE 90:2801doi:10.3382/ps.2011
Annex 1: Resumen en Español
Efectos del cereal principal y el tipo de grasa en la
dieta sobre los parámetros productivos y la calid
huevo en gallinas ponedoras rubias en el
o 22-54 semanas de vida
(Experimento 1)
PUBLICADO EN:
POULTRY SCIENCE 90:2801-2810 doi:10.3382/ps.2011-01503
Annex 1: Resumen en Español
170
Efectos del cereal principal y el tipo de grasa en la
dieta sobre los parámetros productivos y la calidad
huevo en gallinas ponedoras rubias en el
Annex 1: Resumen en Español
171
La hipotesis del presente experimento fue que cuando una dieta basada en trigo y cebada
es suplementada con enzimas, ambos cereales pueden sustituir al maiz sin ningun efecto
negativo sobre las variables productivas o la calidad del huevo. De forma similar, se
podría utilizar indistintamente, oleína vegetal o manteca en sustitución de aceite de soja
sin ningun efecto negativo en los parámetros productivos o en la calidad de huevo. El
peso del huevo en gallinas alimentadas con dietas que contenían 4.3% de grasa añadida al
pienso podrían maximizarse con niveles de ácido linoléico en la dieta de 1.0%
aproximadamente, suponiendo un consumo medio de los animales de 116 g/gallina y dia
y una ingesta de 1.16 g LNL/gallina/dia. El objetivo de este experimento fue estudiar la
influencia del cereal principal en la dieta (maíz, trigo y cebada) y el tipo de grasa añadida
al pienso (aceite de soja, oleína vegetal y manteca) sobre los parámetros productivos y a
calidad de huevo en gallinas ponedoras rubias en el período 22-54 semanas de vida.
1. Material y metodos
1.1. Crianza, Programa de Alimentación y Dietas Experimentales
Todos los procedimientos experimentales realizados fueron aprobados por el comite de
ética de la Universidad Politécnica de Madrid y estuvo acorde con la Guía Española para
el cuidado y el uso de animales en experimentación (Boletín Oficial del Estado, 2005).
En total, 756 gallinas ponedoras rubias de la estirpe Lohmann fueron obtenidas de
un lote comercial (El Canto Agroalimentaria S.L, Toledo, Spain). Desde la semana 20 a
la 22 de vida todos los animales comieron un pienso pre-experimental común basado en
maíz-harina de soja. En la semana 22 de vida todas las gallinas fueron pesadas
individualmente y alojadas al azar en grupos de 7 animales en jaulas provistas de un
comedero y 2 bebederos de tetina en una nave bajo control automatizado ambiental. Cada
tratamiento fue replicado 4 veces y la unidad experimental consistió en 3 jaulas (600 x

Annex 1: Resumen en Español
172
575 mm; General Ganadera S.A, Valencia, Spain) adjacentes (21 gallinas). La
temperatura ambiental en la nave varió acorde con el mes considerado (22 ± 3 ºC en
Marzo, primer mes de la prueba y 28 ± 3 ºC en Julio, último més de la prueba). El
programa de luz fue constante y consistió en 16 horas de luz al día.
Los cereales utilizados en la prueba provenían de proveedores comerciales. Las
grasas (aceite de soja, oleína vegetal y manteca) fueron suministradas por Bunge Ibérica
S.A. (Barcelona, Spain), Oleínas y Grasas S.L. (Tarragona, Spain), e Ibergrasa S.A.
(Madrid, Spain) respectivamente. La oleína vegetal fue una mezcla comercial compuesta
principalmente por subproductos de la industria del refino del aceite de palma y soja. Dos
lotes de cereales y grasas fueron utilizados durante el experimento: el primer lote para los
primeros 4 períodos de 28 dias y el segundo lote para los últimos 4 períodos de 28 dias
del experimento.
El experimento fue realizado mediante un diseño completamente al azar con 9
dietas organizadas factorialmente con 3 cereales principales en la dieta y 3 tipos de
grasas. La cebada y el trigo fueron incluidos en sus respectivas dietas en sustitución de un
45% de maíz. La composición de las dietas fue ajustado para asegurar que tuvieran una
EMAn y contenido en AA similar según (Fundacion Española Desarrollo Nutricion
Animal, 2003). Sin embargo, no se intento igualar el nivel de LNL de dichas dietas. La
principal variación en las 3 dietas que contenían el mismo tipo de cereal fue que al incluir
un mismo nivel de grasa (4.3%) tanto la EMAn como el LNL varió acorde a esta
inclusión. Así, las dietas basadas en aceite de soja contuvieron una mayor proporción de
energía y más LNL que las dietas basadas en oleína vegetal o manteca. Debido al diseño
experimental, el nivel de LNL de la dieta varió desde 0.8 to 3.4% dependiendo de la
combinación del cereal y la grasa utilizada, así el valor mas bajo de LNL fue la dieta que
contenía trigo y manteca y el mas alto fue la dieta basada en aceite de soja y maíz. El
contenido en LNL de la dieta basada en trigo o cebada suplementados con manteca fue

Annex 1: Resumen en Español
173
más baja que 1.1%, siendo este nivel el recomendado por el NRC (1994) para gallinas
ponedores rubias que consumen 110 g. Además, la mayoría de las dietas diseñadas
tuvieron niveles inferiores de LNL que los utilizados actualmente por la industria (1.7%-
2.0%). Sin embargo, todas las dietas cubrieron o excedieron las necesidades en
nutrientes recomendadas por Fundacion Española Desarrollo Nutricion Animal (2008).
Se utilizó un complejo enzimático commercial, el cual, incluía β-glucanasas y xylanasas
(Endofeed, GNC Bioferm Inc., Saskatoon, SK, Canada), y fue utilizado en la dosis
recomendada por el fabricante. Asimismo, se utilizó un pigmentante sintético basado en
canthaxantina y ésteres de carotenoides (β-apo-8-carotenoide) que fueron incluidos en
cantidades fijas en todas las dietas. Todas las dietas fueron molidas con un molino de
martillos a través de una criba de 7.5 mm.
1.2. Análisis de Laboratorio
Muestras representativas de cereales y piensos fueron molidas en el laboratorio con un
molino de martillos (Model Z-I, Retsch Stuttgart, Germany) provisto de un tamiz de 1-
mm. Posteriormente, se analizó humedad mediante estufa (método 930.01), cenizas totals
mediante mufla (método 942.05), nitrógeno por combustión-Dumas (método 990.03)
utilizando un analizador LECO (Modelo FP-528, LECO, St. Joseph, MI), almidón
mediante la medida de la α-amilasa glucosidasa (metodo 996.11), fibra bruta mediante
extracción con dilución ácido-básica (método 962.09), Ca y P mediante
espectrofotometría (métodos 968.08 y 965.17) según describe la AOAC Internacional
(2000). La fibra neutro detergente y ácido detergente fue determinada de forma
secuencial según describe Van Soest et al. (1991). El extracto etéreo fue determinado
mediante Soxhlet después de una hidrólisis ácida según describe el Boletín Oficial del
Estado (1995) y la energía bruta fue analizada mediante bomba calorimétrica adiabática
Modelo 356, Parr Instrument Company, Moline, IL). El contenido en ácidos grasos de los
Annex 1: Resumen en Español
174
cereales y grasas fue determinado mediante cromatografía líquida de gases (GC-14B,
Shimadzu, Kyoto, Japan) según la metodología descrita por Grobas et al. (1999b). La
calidad de las grasas, incluyendo impurezas insolubles (método 926.12), humedad
(método 984.20) y material insaponificable (método 933.08) fueron determinados según
describe la AOAC International (2000). La materia no elucible, la cual refleja la fracción
indigestible de la grasa fue determinada mediante cromatografía de gases (método
977.17) según indica la AOAC International (2000). La acidez oleíca, la cual mide la
cantidad de KOH en mg necesarios para neutralizar los ácidos grasos libres presentes en
1 g de grasa fue determinado mediante el método Cd-3d-63 de la AOCS (1998). El índice
de peróxidos (método 16) fue determinado según indica el Boletín oficial del Estado
(1995). Todos los análisis fueron realizados en muestras por duplicado. El tamaño medio
de partícula de los cereales y las dietas de cada lote fabricado, fue determinado por
triplicado en muestras de 100 g utilizando un tamizador Retsch (Retsch, Stuttgart,
Germany) provisto de 8 tamices con una luz de malla que oscilo entre 5,000 y 40 µm
según la metología descrita por ASAE (1995).
1.3. Variables Productivas y Calidad de Huevo
Los huevos fueron recogidos diáriamente y el peso del huevo fue medido en todos los
huevos producidos 2 días antes de cada control de 28 días. El consumo fue medido por
réplica, obteniendo consumos por período y acumulado. La mortalidad fue recogida
según se produjo a lo largo de la prueba. Mediante estos registros, el porcentaje de
puesta, peso de huevo, masa de huevo, consumo medio diario, e IC por kg y por docena
de huevos fue calculado por período y acumulado. El ratio (g/g) entre la masa de huevo o
peso de huevo y LNL ingerido por tratamiento fue calculado para todo el período
experimental. Asimismo, todas las gallinas fueron pesadas individualmente al inicio y al
final de la prueba obteniéndose la ganancia de peso vivo por réplica.
Annex 1: Resumen en Español
175
El número de huevos limpios, sucios, rotos, fárfaras y dobles yemas fue recogido
diariamente por réplica. Un huevo fue considerado como sucio cuando cualquier tipo de
material o mancha fue detectado en la cáscara mediante la evalución de 2 observadores
independientes. Todos los huevos utilizados para el cálculo del gramaje fueron
clasificados según la European Council Directive (2006) como extra large (> 73 g), large
(73-63 g), medium (63-53 g) y small (< 53 g). La densidad de cáscara y la calidad interna
del huevo (Unidades Haugh y color de yema) fueron medidas en 10 huevos por réplica,
elegidos al azar, el último día de cada período de 28 días. Un equipo multitest QCM
System, Technical Services and Supplies, Dunnington, York, UK) fue utilizado para tal
fin. De los 10 huevos anteriores, en 5 de ellos, fue medido el espesor de cáscara
mediante un micrómetro digital (modelo IT-014UT, Mitotuyo, Kawasaki, Japan)
utilizando la media de 3 medidas. Por último, al final del segundo período experimental
se midió la proporción de albumen y yema en 10 huevos de cada réplica según la
metodología descrita por Safaa et al. (2008). En estos mismos huevos se midió el pH de
ambas fracciones mediante un pHmetro (Accumet 910, Kent City, MI) según la
metodología descrita por Shang et al. (2004).
1.4. Análisis Estadístico
El diseño experimental se baso en un modelo completamente al azar con 9 tratamientos
organizados factorialmente. Los efectos principales (tipo de cereal y grasa) y sus
interacciones fueron analizados mediante un análisis de varianza utilizando el
procedimiento GLM de SAS (SAS Institute, 1990). No se observaron interacciones
significativas entre el tipo de cereal y grasa, como consecuencia la interacción fue
eliminada del modelo. La homogeneidad de varianzas de los datos de todas las variables
fue analizada mediante el Test de Levene (Opción Hovtest del procedimiengo GLM).
Todas las variables productivas y de calidad de huevo fueron homogéneas, excepto para
Annex 1: Resumen en Español
176
la mortalidad. De este modo, la mortalidad fue analizada después de realizar una
transformación logarítmica (arcoseno). Cuando los efectos del cereal y la grasa fueron
significativos, se utilizó el Test de Tukey como medida de separción y comparación de
medias. Una diferencia fue considerada significativa cuando P< 0.05.
2. Resultados
2.1. Variables Productivas
No se detectaron interacciones entre el tipo de cereal grasa a lo largo del período
experimental. Los tratamientos no tuvieron efecto sobre las variables productivas en
ninguno de los períodos considerados. Teniendo el cuenta el período global, el porcentaje
de puesta (92.9, 91.5 y 92.1 % para el máiz, trigo y cebada, respectivamente) y el peso
del huevo (64.5, 63.6 y 64.1 g para el máiz, trigo y cebada, respectivamente) no fueron
afectados por el tipo de cereal. Consecuentemente, la masa de huevo no fue distinta entre
tratamientos (59.9, 58.2 y 59.1 g para el máiz, trigo y cebada, respectivamente). Sin
embargo, las gallinas alimentadas con trigo y maíz tuvieron una mayor ganancia de peso
que las gallinas alimentadas con cebada (243, 238 y 202 g, respectivamente; P< 0.05). La
fuente de grasa no afecto a ninguna de las variables productivas estudiadas, excepto para
la ganancia de peso, que fue mayor en las gallinas que consumieron manteca respecto de
las gallinas que consumieron aceite de soja u oleína vegetal (251, 221 y 210 g,
respectivamente; P< 0.05). La mortalidad media del experimento fue 7.5% y no fue
afectada por el tratamiento. En cuanto al ratio entre los g de peso de huevo o g de masa
de huevo producidos por g de LNL ingerido, fue menor en gallinas alimentadas con
aceite de soja, independientemente del cereal utilizado. Sin embargo dicho ratio fue
mayor en gallinas alimentadas con manteca y trigo, seguidas de las alimentadas con
manteca-cebada, y manteca-máiz (P < 0.001).
Annex 1: Resumen en Español
177
2.2. Calidad del Huevo
Para el periodo global, el porcentaje de huevos sucios, rotos, fárfaras y dobles yemas, así
como las unidades haugh y el espesor de cáscara y densidad de cáscara no fueron
afectados por la dieta. El color de yema fue mayor (P< 0.001) en huevos de gallinas
alimentadas con maíz que en huevos de gallinas alimentadas con trigo o cebada.
Asimismo, los huevos de gallinas alimentadas con manteca obtuvieron una pigmentación
de huevo mayor (P< 0.001) que los huevos de gallinas alimentadas con aceite de soja u
oleína vegetal. En la semana 30 de vida de los animales, la dieta no influyó sobre el
porcentaje de yema o albumen, así como el pH de ambas fracciones.
3. Discusión
3.1. Variables Productivas
Para el periodo global, el consumo medio diario, el porcentaje de puesta, el peso del
heuvo y el IC fue similar para los 3 tipos de cereales, resultados que están en
concordancia con experimentos previos (Craig and Goodman., 1993; Lázaro et al., 2003;
Safaa et al., 2009) los cuales mostraron que cuando dietas basadas en trigo y cebada son
suplementadas con enzimas, la productividad de la ponedora no se ve afectada.
Mathlouthi et al. (2002) en broilers, observó que cuando el 60% del maíz en la dieta era
suplementado con una combinación de 40% de trigo y 20 de cebada suplementados con
enzimas, las variables productivas eran similares. Sin embargo Coon et al. (1988)
observaron mayor consumo y peor IC en gallinas alimentadas con dietas basadas en
cebada que gallinas que se alimentaron con dietas basadas en maíz.
En el presente trabajo, la ganancia de peso fue mayor en gallinas alimentadas con
maíz y trigo que las gallinas alimentadas con cebada, resultados que están acorde con los
presentados por Berg et al. (1959) el cual, observó una mayor ganancia de peso en
Annex 1: Resumen en Español
178
gallinas alimentadas con maíz que en gallinas alimentadas con cebada. En el mismo
sentido, Frikha et al. (2009) observó una mayor ganancia de peso en pollitas alimentadas
con maíz respecto a las pollitas alimentadas con dietas basadas en trigo y cebada
suplementadas con enzimas.
En el periodo global la sustitución de aceite de soja por oleína vegetal o manteca
no afectó a ninguna de las variables estudiadas excepto para la ganancia media diaria que
fue mayor para las gallinas alimentadas con aceite de soja u oleína vegetal. Los autores
del presente trabajo no han encontrado ninguna publicación comparando el efecto de
estas 3 grasas sobre la ganancia de peso en gallinas. En el presente trabajo, un alto
porcentaje de la energía ingerida por las ponedoras que consumieron manteca fue
derivado a incrementar la ganancia de peso en vez de depositarse en el huevo en
comparación con las gallinas que consumieron aceite de soja u oleína vegetal. Vila y
Esteve-García (1996) y Sanz et al. (1999, 2000) observaron que los pollos alimentados
con dietas que contenían sebo o manteca tenían una mayor deposición de grasa
abdominal respecto de los pollos que consumieron piensos basados en grasas vegetales
insaturadas, resultados que son consistentes con los obtenidos en el presente trabajo.
Los efectos del LNL sobre el tamaño del huevo fue objeto de debate en el presente
trabajo. Bajo condiciones comerciales, muchas guías de manejo de ponedoras (H&N
International, 2009; Lohmann, 2010) recomiendan incrementar el nivel de LNL en la
dieta, al menos un 1.8% con el objetivo de incrementar el peso del huevo. Scragg et al.
(1987) recomendaron niveles por encima de un 2.0% para incrementar el peso del huevo
en gallinas rubias. Ribeiro et al. (2007) observaron mayores pesos de huevo en gallinas
reproductoras pesadas cuando fueron alimentadas con dietas que tenían niveles de 1.9%
de LNL respecto de dietas que contenían 1.5%. Sin embargo, Jensen et al. (1958), Shutze
et al., (1959) y Grobas et al. (1999a,b) no apoyan estas prácticas en el uso de niveles de
1.8% de LNL. Las razones de las discrepancias entre nutricionistas a nivel práctico e
Annex 1: Resumen en Español
179
investigadores residen en la composición de las dietas utilizadas. Por ejemplo, bajo
condiciones comerciales, el incremento del nivel de LNL en la dieta es alcanzado
mediante el incremento de grasa en la dieta. De este modo los efectos del nivel de LNL y
la inclusión de grasa están confundidos. En este sentido, Grobas et al. (1999b) sugirieron
que las gallinas ponedoras no requerían mas de un 1.15% de LNL en la dieta para
maximizar el peso del huevo cuando; y que cuando una cantidad mínima de LNL es
satisfecha en la dieta, un incremento en la grasa añadida al pienso resulta en nuevos
incrementos de peso de huevo.
3.2. Calidad de Huevo
El tipo de cereal no afectó a ninguna de las variables estudiadas excepto para el color de
yema que fue mayor en los huevos de gallinas que consumieron maíz. El efecto
beneficioso de la pigmentación de la yema mediante la utilización de maíz era esperada
ya que independientemente del cereal utilizado todas las dietas fueron suplementadas con
la misma cantidad de pigmentante sintético. La información disponible sobre los efectos
del tipo de cereal en la dieta sobre la calidad del huevo es escasa. Jamroz et al. (2001)
observó una calidad de huevo similar en gallinas alimentadas con trigo o maíz, ambas
dietas suplementadas con enzimas. Çiftci et al. (2003) y Safaa et al. (2009) observaron
que la sustitución de maíz por trigo suplementado con enzimas no afectó al porcentaje de
huevos sucios en gallinas leghorn blancas o en ponedoras rubias, respectivamente. Sin
embargo, Francesch et al. (1995) observó una mayor incidencia de huevos sucios en
gallinas alimentadas con cebada respecto a gallinas alimentadas con maíz..
Annex 1: Resumen en Español
180
4. Conclusiones
× El Maíz, trigo y cebada pueden utilizarse de forma exitosa en dietas para ponedoras en
niveles de un 45% asegurándose una cantidad mínima de ácido linoléico.
× El aceite de soja, oleína vegetal o manteca pueden ser utilizadas como fuente de energía
en la dieta sin ningún tipo de efecto perjudicial.
× Bajo condiciones prácticas los requerimientos de las gallinas ponedoras con el objetivo
de maximizar el peso del huevo son menores que las recomendaciones de la mayoría de
guías de manejo comerciales.
× Las actuales prácticas en el manejo de la nutrición de la gallina ponedora comercial de
disponer, al menos, de un nivel de ácido linoléico de 1.8% o mayor no están justificadas.
Efectos del nivel de proteína bruta y el contenido de
grasa en la dieta sobre los parámetros productivos y
la calidad del huevo en gallinas ponedoras rubias
con distintos pesos vivos
POULTRY SCIENCE 91:1400doi:10.3382/ps.2011
Annex 1: Resumen en Español
Efectos del nivel de proteína bruta y el contenido de
grasa en la dieta sobre los parámetros productivos y
la calidad del huevo en gallinas ponedoras rubias
con distintos pesos vivos
(Experimento 2)
PUBLICADO EN:
POULTRY SCIENCE 91:1400-1406 doi:10.3382/ps.2011-01917
Annex 1: Resumen en Español
181
Efectos del nivel de proteína bruta y el contenido de
grasa en la dieta sobre los parámetros productivos y
la calidad del huevo en gallinas ponedoras rubias
Annex 1: Resumen en Español
182
La hipótesis del presente trabajo fue que en gallinas que comienzan el ciclo de puesta con
un peso por debajo del estándar racial, sería recomendable utilizar niveles altos de
proteína bruta en la dieta y AA con el objetivo de optimizar las variables productivas de
estos animales. Asimismo, el aumento del nivel de grasa en la dieta conllevaría una
recuperación del peso de los animales y como consecuencia una mejora en las variables
productivas. El aumento del nivel de proteína y grasa no tendría ningún efecto negativo
sobre la calida del huevo. Por ello el objetivo del presente trabajo experimental fue
determinar los efectos del incremento de proteína bruta de la dieta desde 16.5% hasta
18.5% y del contenido en grasa de la dieta desde 1.8% hasta 3.6% en dietas isonutritivas
sobre los parámetros productivos y la calidad del huevo en el período 22-50 semanas de
vida.
1. Material y métodos
1.1. Crianza, Programa de Alimentación y Dietas Experimentales
Todos los procedimientos experimentales realizados fueron aprobados por el comite de
ética de la Universidad Politécnica de Madrid y estuvo acorde con la Guía Española para
el cuidado y el uso de animales en experimentación (Boletín Oficial del Estado, 2007).
En total 672 gallinas rubias de la estirpe Lohmann que fueron obtenidas de un lote
comercial (El Canto Agroalimentaria S.L, Toledo, Spain), fueron pesadas
individualmente y clasificadas como ligeras (1,592 ± 75 g) o pesadas (1,860 ± 86 g)
respecto de un peso vivo esperado según la guía de manejo de 1,640 ± 57 g (Lohmann,
2010). Dentro de cada grupo de peso, las gallinas fueron distribuidas al azar dentro de 16
réplicas. Cada réplica estuvo compuesta por 21 gallinas (7 gallinas en 3 jaulas
adyacentes) (600 × 575 mm; General Ganadera S.A, Valencia, España). Las 2 semanas
anteriores al comienzo del ensayo (20-22 sem) las gallinas fueron alimentadas con un
Annex 1: Resumen en Español
183
pienso común basado en maíz y harina de soja. La temperatura de la instalación fue
recogida diariamente a lo largo del experimento con una mínima temperatura recogida en
marzo (20 ± 3ºC , comienzo del experimento) y una máxima temperatura recogida en
Julio (27 ± 3ºC). El programa de luz consistió en 16 horas de luz y 8 de escuridad a lo
largo de todo el período experimental.
Todas las dietas fueron isoenergéticas (2,750 kcal EMAn/kg) y tuvieron una
cantidad similar de AA azufrados. La principal diferencia entre las 3 primeras dietas
utilizadas fue el contenido en proteína bruta (16.5%, 17.5% y 18.5%, respectivamente).
La última dieta contenía un nivel de proteína bruta de 18.5% pero incluyó un 3.6% de
grasa añadida en vez de 1.8% de grasa que incluyeron las otras 3. Ajustes en la
composición de ingredientes en la dieta fue realizado para mantener constante el valor
nutritivo de todas las dietas. Como consecuencia del diseño experimental, las dietas con
un contenido mayor de proteína bruta contenían mayor cantidad de AA, pero en cualquier
caso cubrieron las necesidades recomendadas por el NRC (1994) y por la Fundacion
Española Desarrollo Nutricion Animal (2008) para gallinas rubias. Todas las dietas
fueron molidas con un molino de martillo utilizando un tamaño de criba de 7.5 mm.
1.2. Análisis de Laboratorio
Muestras representativas de cereales y piensos fueron molidas en el laboratorio con un
molino de martillos (Model Z-I, Retsch Stuttgart, Germany) provisto de un tamiz de 1-
mm. Posteriormente, se analizó humedad mediante estufa (método 930.01), cenizas
totales mediante mufla (método 942.05), nitrógeno por combustión-Dumas (método
990.03) utilizando un analizador LECO (Modelo FP-528, LECO, St. Joseph, MI), Ca y P
mediante espectrofotometría (métodos 968.08 y 965.17) según describe la AOAC
Internacional (2000). El extracto etéreo fue determinado mediante Soxhlet después de
una hidrólisis ácida según describe el Boletín Oficial del Estado (1995) y la energía bruta
Annex 1: Resumen en Español
184
fue analizada mediante bomba calorimétrica adiabática Modelo 1356, Parr Instrument
Company, Moline, IL). Todos los análisis fueron realizados en muestras por duplicado.
El tamaño medio de partícula de los cereales y las dietas de cada lote fabricado, fue
determinado por triplicado en muestras de 100 g utilizando un tamizador Retsch (Retsch,
Stuttgart, Germany) provisto de 8 tamices con una luz de malla que oscilo entre 5,000 y
40 µm según la metología descrita por ASAE (1995).
1.3. Variables Productivas y Calidad de Huevo
Los huevos fueron recogidos diáriamente y el peso del huevo fue medido en todos los
huevos producidos 2 días antes de cada control de 28 días. El consumo fue medido por
réplica cada 28 días, obteniendo consumos por período y acumulado. La mortalidad fue
recogida según se produjo a lo largo de la prueba. Mediante estos registros, el porcentaje
de puesta, peso de huevo, masa de huevo, consumo medio diario, e IC por kg y por
docena de huevos fue calculado por período y acumulado. Asimismo, todas las gallinas
fueron pesadas individualmente al inicio y al final de la prueba obteniéndose la ganancia
de peso vivo por réplica.
El número de huevos limpios, sucios, rotos, fárfaras y dobles yemas fue recogido
diariamente por réplica. Un huevo fue considerado como sucio cuando cualquier tipo de
material inerte o mancha fue detectado en la cáscara mediante la evalución de 2
observadores independientes. La calidad del huevo fué medida en 10 huevos por réplica,
elegidos al azar, el último día de cada período de 28 días. Cada huevo fue
individualmente pesado, y en cada uno de ellos se analizó la calidad del albumen y de la
cáscara de cáscara mediante un equipo multitest QCM System, Technical Services and
Supplies, Dunnington, York, UK). La densidad de cáscara se calculó como el peso de la
cáscara en seco dividido por la superficie de la misma y el espesor de cáscara fue medido
mediante un micrómetro digital (modelo IT-014UT, Mitotuyo, Kawasaki, Japan)
Annex 1: Resumen en Español
185
utilizando la media de 3 medidas tomadas en la zona medial del huevo. El color de yema
se midió mediante escala Roche según la metodología descrita por Vuilleumier et al.
(1969).
1.4. Análisis Estadístico
El diseño experimental se baso en un modelo completamente al azar con 9 tratamientos
organizados factorialmente. Los efectos principales (tipo de cereal y grasa) y sus
interacciones fueron analizados mediante un análisis de varianza utilizando el
procedimiento GLM de SAS (SAS Institute, 1990). No se observaron interacciones
significativas entre el tipo de cereal y grasa, como consecuencia la interacción fue
eliminada del modelo. La homogeneidad de varianzas de los datos de todas las variables
fue analizada mediante el Test de Levene (Opción Hovtest del procedimiengo GLM).
Todas las variables productivas y de calidad de huevo fueron homogéneas, excepto para
la mortalidad. De este modo, la mortalidad fue analizada después de realizar una
transformación logarítmica (arcoseno). Cuando los efectos del cereal y la grasa fueron
significativos, se utilizó el Test de Tukey como medida de separción y comparación de
medias. Una diferencia fue considerada significativa cuando P< 0.05.
2. Resultados
No fueron dietectadas interaciones entre los tratamientos a lo largo del período
experimental. La mortalidad fue considerada normal (4.9%) y no relacionada con el
tratamiento. Las dietas experimentales no afectaron a ninguna de las variables
productivas estudiadas. Sin embargo, el consumo (120.6 vs 113.9; P< 0.001), el
porcentaje de puesta (92.5 vs. 89.8%; P< 0.01), el peso del huevo (64.9 vs. 62.4; P<
0.001) y la masa de huevo (60.0 vs. 56.1; P< 0.001) fueron mayores en las gallinas
pesadas respecto de las gallinas ligeras. El IC por kg de huevo no fue afectado por el peso
Annex 1: Resumen en Español
186
vivo inicial de las gallinas pero el IC por docena de huevo fue mejor en las gallinas
ligeras respecto de las gallinas pesadas (1.52 vs. 1.57; P< 0.01). La ganancia media diaria
fue mayor en las gallinas ligeras respecto a las pesadas (289 vs. 233 g; P< 0.01). A lo
largo del período experimental las gallinas pesadas tuvieron un mayor consumo y peso
del huevo que las gallinas ligeras (P < 0.001). La incidencia de huevos sucios, rotos,
fárfaras, calidad del albumen, densidad de cáscara y espesor de cáscara no fueron
afectados por el tratamiento experimental o el peso inicial de las gallinas. Sin embargo, el
color de yema fue mayor (P< 0.01) en huevos de gallinas que comieron las dietas que
tenían 1.8% de grasa respecto de las que comieron el pienso que contenía 3.6% de grasa.
3. Discusión
El porcentaje de protein bruta de la dieta no afecto a ninguna de las variables productivas
estudiadas, resultados que son consistentes con las recomendaciones del NRC (1994) las
cuales indican que las necesidades en AA indispensables son cubiertas cuando a gallinas
que consumen 110g se les aporte un pienso con 16.5% de proteina bruta. De hecho, en el
presente estudio la media de proteína ingerida por las gallinas en el pienso que contenía
16.5% de proteína bruta estuvo por encima de las recomendaciones del NRC (1994) (18.6
g/d para las gallinas ligeras y 19.8 g/d para las gallinas pesadas, que corresponden a
consumos de 112.6 y 119.7 g/gallina /día, respectivamente). Los resultados del presente
trabajo están deacuerdo con los datos de Kling et al. (1985). Dichos autores compararon
en ponedoras rubias desde el inicio de puesta hasta la sem 66 de vida, dos niveles de Met
(0.30% vs. 0.40%) y 2 niveles de proteína bruta (17.0% vs. 19.0%) y observaron que un
incremento en el contenido de proteína de la dieta no afectó a ninguna de las variables
productivas estudiadas. De forma similar, Junqueira et al. (2006) observaron que un
incremento del nivel de proteína de la dieta en gallinas rubias mudadas desde un 16% a
un 20% manteniendo constante la EMAn y el nivel de Met no afectó a ninguna de las
Annex 1: Resumen en Español
187
variables productivas estudiadas. Summers y Leeson (1983) obtuvieron parámetros
productivos similares en gallinas blancas alimentadas con niveles de proteína de 17% o
22% y balanceadas en EMAn y Met desde la semana 20 a la 32 de vida. Sin embargo,
Roberts et al. (2007b) observaron en gallinas blancas que un descenso en el contenido de
proteína bruta desde 19.8% a 19.1% en el período 45-58 sem de vida en dietas
isoenergéticas con un perfil de AA similar, redujo la puesta, la masa de huevo y empeoró
el IC. Keshavarz (1995) observarón que un incremento en el nivelde proteína de la dieta
desde 17% hasta 21%, con incrementos en el nivel de Met desde 0.34 hata 0.42% no
afectó a la puesta, peso del huevo, consumo, o ganancia de peso en gallinas blancas en el
período 18-38 semanas de vida. Los resultados del presente experimento apoyan el
razonamiento por el cual la ingesta de AA en vez del nitrógeno “per se” es la responsable
de modular el tamaño del huevo y las variables productivas de las gallinas.
Los efectos de la grasa añadida sobre el consumo, puesta y peso del huevo fueron
objeto de debate. Normalmente, un incremento en la concentración energética del pienso
va acompañada de in incremento en la grasa añadida al pienso y en el contenido en LNL
(Grobas et al., 2001; Frikha et al., 2009). Consecuentemente, los 3 efectos (concentración
energética, nivel de grasa añadida y nivel de LNL) están confundidos y no pueden ser
separados en la mayoría de las situaciones prácticas en cámpo. En el presente trabajo, un
incremento de la grasa añadida al pienso desde 1.8% a 3.6% en dietas isocalóricas, en las
cuales, el nivel de LNL estaba por encima de las necesidades (desde 1.9% a 2.5%) no
afectó a ninguna de las variables productivas estudiadas. Estos resultados están en
concordancia con los observados por Grobas et al. (1999c). Keshavarz (1995) comparó 2
niveles de grasa añadida al pienso (2% y 4%) frente a una dieta sin grasa añadida en
gallinas blancas en el período 18-38 semanas de vida, y observó que las dietas no
afectaron a variables productivas claves como el peso del huevo, la puesta o la ganancia
de peso de los animales. Sin embargo, Keshavarz y Nakajima (1995) observaron que la
Annex 1: Resumen en Español
188
inclusión de un 4% de grasa animal y vegetal en dietas isocalóricas en gallinas blancas,
incremento el peso del huevo y la ganancia media diaria comparado con la dieta control
sin grasa añadida. Bohnsack et al. (2002) observaron en gallinas blancas en el período 26-
38 sem que los animales que comieron piensos que contenían un 4 y un 6% de grasa
añadida tuvieron un mayor peso de huevo que las dietas que no contenían grasa o la que
contenía un 2%, sin embargo el resto de variables productivas no se vieron afectadas. Sin
embargo hay que señalar que en este estudio la concentración de EMAn de las dietas se
incremento con la grasa añadida el pienso, con lo cual, los efectos de la concentración
energética y en nivel de grasa añadida están confundidos. Grobas et al. (1999b)
observaron en gallinas rubias Isa Brown que la suplementación de la dieta con un 4% de
grasa (diferente mezclas de oleína vegetal y grasa animal) manteniendo constante el nivel
de LNL en un 1.15%, incrementaba el peso del huevo en gallinas jóvenes (sem 22-26 de
vida) pero no en gallinas viejas (sem 74-78 de vida). Safaa et al. (2008) observaron que
cuando un incremento en grasa añadida al pienso desde 1.1% a 3.0% manteniendo
constante la concentración energética (2,700 kcal EMA/kg) de la dieta, mejoró el
porcentaje de puesta, el peso del huevo y el IC por kg de huevo en gallinas rubias estirpe
Hy-Line en el período productivo 59-70 sem.
Las pollitas que empezaron el ciclo de puesta con un peso por encima del estándar
racial consumieron mas pienso y produjeron huevos más pesados que las pollitas que
empezaron el ciclo de puesta por debajo del estándar racial. Sin embargo el IC por kg de
huevo no fue afectado, de hecho, el IC por docena de huevo fue mejor para las pollitas
que empezaron el ciclo de puesta con el peso mas bajo. Los autores del presente trabajo
no han encontrado ningún artículo científico reciente sobre los efectos del peso vivo
inicial de las pollitas sobre los parámetros productivos. En el presente experimento, el
consumo se incremento en 2.7 g y el peso del huevo en 0.93 g por cada 100 g de
incremento de peso vivo en las pollitas. Resultados similares fueron observados por
Annex 1: Resumen en Español
189
Harms et al. (1982) en 2 experimentos con gallinas blancas desde la sem 31 a la 47 de
vida. En el primer experimento, estos autores observaron un incremento de 0.88 g en el
peso del huevo por cada 100 g de incremento de peso en gallinas que variaron el peso
desde 1,411 g hasta 1,546 g, sin embargo en el segundo experimento, con un rango de
peso de 1,546 g y 1,684, el incremento fue de 1.6 g. En ambos experimentos la
producción de huevo fue similar y el IC fue peros en gallinas pesadas. Summers y Leeson
(1983) compararon las variables productivas en pollias blancas divididas por peso vivo a
las 18 sem de vida en 4 grupos (1,107 g, 1,205 g, 1,281 g y 1,383 g). Estos autores
observaron que en el período 19-25 sem, las gallinas pesadas obtuvieron mejores
porcentajes de puesta que las gallinas ligeras y que por cada 100 g de peso extra el peso
del huevo se incremento en 0.9 g, sin embargo el IC por kg de huevo no se vió afectado.
De manera similar, Leeson y Summers (1987) distribuyeron pollitas blancas en 3 grupos
de peso (997 g, 1,100 g y 1,226 g) en la sem 15 de vida en el experimento 1 y (1,308 g,
1,411 g, y 1,564 g) en la sem 19 en el experimento 2. Los autores observaron que el
consumo se incrementó 3.2 g y 3.6 g por cada 100 g de incremento de peso en el
experimento 1 y 2 desde el inicio de puesta hasta la sem 67, respectivamente. Keshavarz
(1995) observó porcentajes de puesta similares en gallinas blancas en el período 18-62
sem de vida divididas en 2 grupos de peso, ligeras (1,151g) y pesadas (1,333 g), sin
embargo, el consumo se incrementó en 2 g y el peso del huevo en 1.4 g por cada 100 g de
incremento de peso en los animales. Además, estos autores observaron un incremento en
la ganancia de peso en dicho período de 24.2% mayor en gallinas ligeras respecto de las
gallinas pesadas, acorde con lo observado en el presente experimento (20.8%).
La calidad del huevo, incluyendo porcentaje de huevos sucios, altura de albumen y
calidad de cáscar no fueron afectados por la dieta o el peso inicial de las gallinas. Los
datos del presente experimento están en concordancia con los presentados por Junqueira
et al. (2006) el cual, observó que el incremento del nivel de proteína bruta en la dieta no

Annex 1: Resumen en Español
190
agecto a las unidades haugh o la calidad de cáscara. Otros autores confirman estos
resultados (Wolford and Tanaka., 1970; Fariborz et al., 2007). De hecho, Williams et a.,
(1992) indicó que la genética de la gallina y la edad de la misma eran los factores mas
importantes que afectan a la calidad del abúmen, y que la nutricion no tiene un gran
impacto en esta variable. Sin embargo, Hammershoj y Kjaer (1999) observaron que las
unidades haugh descendieron a medida que el nivel de proteína se incremento de 13.7 a
17.9%. La suplementación de la dieta con un nivel alto en proteína con un 3.6% de grasa
añadido no afectó a ninguna de las variables relacionadas con la calidad del huevo. En el
presente experimento no hubo ningún en la calidad de cáscara relacionado con el
incremento de grasa en el pienso, resultados que están en concordancia con los obtenidos
por Safaa et al. (2008), los cuales, observaron que la calidad de la cáscara en la última
fase de producción en gallinas rubias suplementadas con 1.1% o 3.0% de grasa. En
broilers, Atteh et al. (1983) indicó que la inclusión de grasa saturada a la dieta incrementa
la formación se jabones entre los ácidos grasos y las sales cálcicas, disminuyendo la
retención de calcio. Probablemente, la cantidad de jabones presentes en el intestino
delgado en las gallinas del presente ensayo fueran escasos, ya que la grasa utlizada fue
una grasa insaturada (aceite de soja), potenciándose la disociación de estos jabones con el
pH del tracto gastrointestinal. La pigmentación fue menor en los huevos procedentes de
gallinas alimentadas con la dieta que contenía un 3.6% de grasa en relación con el resto
de dietas que contenía un 1.8%. Esta diferencia era esperada ya que el maíz fue incluido
sólo en las dietas que contenían un 1.8% de grasa añadida.
Annex 1: Resumen en Español
191
4. Conclusiones
× Incrementar el nivel de proteína bruta en el pienso desde 16.5% a 18.5% y de grasa
añadida al pienso de 1.8% a 3.6% no afectó ninguna de las variables productivas
estudiadas o la calidad del huevo en el período productivo 22-50 sem independientemente
del peso de la gallina al inicio del ciclo de puesta.
× Variables productivas importantes en el rendimiento de la explotación como fueron el
porcentaje de puesta, el peso del huevo y el consumo fueron mayores en gallinas pesadas
respecto de las gallinas ligeras. Asimismo, las variables relacionadas con la calidad del
huevo no se vieron afectadas por el peso inicial de las gallinas al comienzo del ciclo de
puesta.
× El IC por kg de huevo no fue afectado por el peso inicial de las gallinas, de hecho el
IC por docena de huevo fue mejor en las gallinas ligeras respecto de las gallinas pesadas.
Ese dato puede indicar que el manejo y gestión de los lotes debe monitorizarse o
modularse dependiendo del objetivo comercial de una empresa. Así, el uso de gallinas
pesadas o ligeras dependerá de si producimos huevos a granel o estuchados, así como el
destino final de la producción, ya que el cliente nacional requiere un tamaño más grande
de huevo, sin embargo, si nuestro objetivo es la importación requeriremos un menor
gramaje de huevo.
× A nivel de campo, la utilización del incremento del nivel de proteína bruta por encima
de las recomendaciones del NRC (1994) con el objetivo de maximizar el peso del huevo
no está justificada in ninguno de los 2 grupos de gallinas.
× En general, las gallinas que inicial el ciclo de puesta con un peso superior al estándar
racial poseen unos mejores resultados productivos, pero la ventaja de estos animales
depende de la diferencia en el peso del huevo respecto de animales con menor peso, así
como del coste relativo de las materias primas.
Efectos de la concentración energetic
sobre los párametros productivos y la calidad de
huevo en gallinas ponedoras rubias con distintos
ACEPTADO PARA PUBLICAR
POULTRY SCIENCE doi:10.3382/ps.201
Annex 1: Resumen en Español
Efectos de la concentración energetica de la dieta
sobre los párametros productivos y la calidad de
vo en gallinas ponedoras rubias con distintos
pesos vivos
(Experimento 3)
ACEPTADO PARA PUBLICAR EN:
POULTRY SCIENCE TBC: 1-11 doi:10.3382/ps.2012-02526
Annex 1: Resumen en Español
192
de la dieta
sobre los párametros productivos y la calidad del
vo en gallinas ponedoras rubias con distintos
Annex 1: Resumen en Español
193
La hipótesis del presente trabajo fué que un incremento en la concentración energetica de
la dieta podría incrementar la ingesta caloric de las gallinas mejorando los parámetros
productivos. Dicho efecto podría ser más pronunciado en gallinas ligeras que inician el
ciclo de puesta con un peso por debajo del estándar racial respecto de gallinas más
pesadas. El objetivo del presente estudio fue estudiar los efectos de la concentración
energetica de la dieta sobre los parámetros productivos y la calidad del huevo en gallinas
ponedoras rubias que tenían 2 pesos distintos al inicio del ciclo de puesta, a lo largo del
período productivo entre la semana 24 y 59 de vida.
1. Material y Métodos
1.1. Crianza, Dietas y Diseño Experimental
Todos los procedimientos experimentales realizados fueron aprobados por el comite de
ética de la Universidad Politécnica de Madrid y estuvo acorde con la Guía Española para
el cuidado y el uso de animales en experimentación (Boletín Oficial del Estado, 2007).
En total 520 gallinas rubias de la estirpe Hy-Line fueron obtenidas de un lote
comercial (Camar Agroalimentaria S.L, Toledo, Spain) y fueron pesadas en la sem 21 de
vida individualmente y clasificadas como ligeras (1,606 ± 39 g) o pesadas (1,733 ± 48g)
respecto de un peso vivo esperado según la guía de manejo de 1,685 ± 35g (Hy-Line
International, 2011). Dentro de cada grupo de peso, las gallinas fueron distribuidas al
azar dentro de 16 réplicas. Cada réplica estuvo compuesta por 13 gallinas alojadas en
jaulas enriquecidas provistas de un comedero y 2 bebederos de cazoleta (635 x 1,200
mm; Facco S.A., Padova, Italia). Las 2 semanas anteriores al comienzo del ensayo (20-22
sem) las gallinas fueron alimentadas con un pienso común basado en maíz y harina de
soja. La temperatura de la instalación fue recogida diariamente a lo largo del experimento
con una mínima temperatura recogida en enerro (19 ± 3ºC , comienzo del experimento) y
Annex 1: Resumen en Español
194
una máxima temperatura recogida en Julio (28 ± 3ºC). El programa de luz consistió en 16
horas de luz y 8 de escuridad a lo largo de todo el período experimental.
Todas las dietas fueron isoenergéticas (2,750 kcal EMAn/kg) y tuvieron una
cantidad similar de AA azufrados. La principal diferencia entre las 3 primeras dietas
utilizadas fue el contenido en proteína bruta (16.5%, 17.5% y 18.5%, respectivamente).
La última dieta contenía un nivel de proteína bruta de 18.5% pero incluyó un 3.6% de
grasa añadida en vez de 1.8% de grasa que incluyeron las otras 3. Ajustes en la
composición de ingredientes en la dieta fue realizado para mantener constante el valor
nutritivo de todas las dietas. Como consecuencia del diseño experimental, las dietas con
un contenido mayor de proteína bruta contenían mayor cantidad de AA, pero en cualquier
caso cubrieron las necesidades recomendadas por el NRC (1994) y por la Fundacion
Española Desarrollo Nutricion Animal (2008) para gallinas rubias. Todas las dietas
fueron molidas con un molino de martillo utilizando un tamaño de criba de 7.5 mm.
Desde la sem 21 hasta la 24 de vida todas las gallinas consumieron un pienso
común basado en maíz y harina de soja (2,750 kcal EMAn, 17.5% de proteína bruta y
0.39% de Metionina). Desde la sem 24 de vida (comienzo del experimento) hasta la sem
59 de vida las gallinas fueron alimentadas con 4 dietas que variaron en el contenido
energético desde 2,650 hasta 2,950 kcal/kg pero todas tuvieron una cantidad equivalente
de nutrientes por unidad energética. Para la fabricación de las 4 dietas experimentales, se
formularon las 2 dietas extremas (2,650 y 2,950 kcal/kg), con lo cual, las dietas
intermedias fueron obtenidas mezclando cantidades adecuadas de las 2 anteriores. Todas
las dietas cubrieron las necesidades nutricionales recomendadas por la Fundacion
Española Desarrollo Nutricion Animal (2008). Se utilizó un complejo enzimático
commercial, el cual, incluía β-glucanasas y xylanasas (Endofeed, GNC Bioferm Inc.,
Saskatoon, SK, Canada), y fue utilizado en la dosis recomendada por el fabricante.
Asimismo, se utilizó un pigmentante sintético basado en canthaxantina y ésteres de
Annex 1: Resumen en Español
195
carotenoides (β-apo-8-carotenoide) que fueron incluidos en cantidades fijas en todas las
dietas.
El diseño experimental fue completamente al azar con 8 tratamientos ordenados
factorialmente con 4 niveles de energia (2,650, 2,750, 2,850, y 2950 kcal EMA/kg) y 2
pesos de gallinas (1,733 vs. 1,606 g). Cada tratamiento fue replicado 5 veces y la unidad
experimental fue una jaula con 13 gallinas.
1.2. Análisis de Laboratorio
Muestras representativas de cereales y piensos fueron molidas en el laboratorio con un
molino de martillos (Model Z-I, Retsch Stuttgart, Germany) provisto de un tamiz de 1-
mm. Posteriormente, se analizó humedad mediante estufa (método 930.01), cenizas
totales mediante mufla (método 942.05), nitrógeno por combustión-Dumas (método
990.03) utilizando un analizador LECO (Modelo FP-528, LECO, St. Joseph, MI), Ca y P
mediante espectrofotometría (métodos 968.08 y 965.17) según describe la AOAC
Internacional (2000). El extracto etéreo fue determinado mediante Soxhlet después de
una hidrólisis ácida según describe el Boletín Oficial del Estado (1995) y la energía bruta
fue analizada mediante bomba calorimétrica adiabática Modelo 1356, Parr Instrument
Company, Moline, IL). Todos los análisis fueron realizados en muestras por duplicado.
El tamaño medio de partícula de los cereales y las dietas de cada lote fabricado, fue
determinado por triplicado en muestras de 100 g utilizando un tamizador Retsch (Retsch,
Stuttgart, Germany) provisto de 8 tamices con una luz de malla que oscilo entre 5,000 y
40 µm según la metología descrita por ASAE (1995).
1.3. Productive Performance and Egg Quality
Los huevos fueron recogidos diáriamente y el peso del huevo fue medido en todos los
huevos producidos 2 días antes de cada control de 28 días. El consumo fue medido por

Annex 1: Resumen en Español
196
réplica cada 28 días, obteniéndose consumos por período y acumulado. La mortalidad fue
recogida según se produjo a lo largo de la prueba. Mediante estos registros, el porcentaje
de puesta, peso de huevo, masa de huevo, consumo medio diario, IC por kg y por docena
de huevos, y eficiencia energética expresado como las calorías de EMAn por g de huevo
fue calculado por período y acumulado. Asimismo, todas las gallinas fueron pesadas
individualmente al inicio y al final de la prueba obteniéndose la ganancia de peso vivo
por réplica.
El número de huevos limpios, sucios, rotos, fárfaras y dobles yemas fue recogido
diariamente por réplica. Un huevo fue considerado como sucio cuando cualquier tipo de
material inerte o mancha fue detectado en la cáscara mediante la evalución de 2
observadores independientes. Las Unidades haugh y el color de yema fue medido por
réplica en 10 huevos elegidos al azar el último día de la sem 39, 48, 55 y 59 de vida
mediante equipo multitest (QCM System, Technical Services and Supplies, Dunnington,
York, UK) según metodología descrita por Pérez-Bonilla et al. (2011). La proporción de
cascara, albumen, y yema de los huevos, así como el ratio yema:albumen fue
determinado por réplica en los mismos 10 huevos recogidos para las medidas de calidad
de huevo. La yema y la cáscara fueron separados del albumen utilizando un papel
secante, eliminando cualquier tipo de material adherido según metología descrita por
Saraa et al. (2008). El peso del albumen fue calculado por diferencia entre el peso del
huevo y los pesos de la yema y la cáscara.
1.4. Statistical Analysis
El diseño experimental se baso en un modelo completamente al azar con 8 tratamientos
organizados factorialmente. Los efectos principales (nivel de energía y peso inicial) y sus
interacciones fueron analizados mediante un análisis de varianza utilizando el
procedimiento GLM de SAS (SAS Institute, 1990). Se testó mediante el procedimiento
Annex 1: Resumen en Español
197
UNIVARIATE y Test de Levene la distribución normal de los residuos y la
homogeneidad de varianzas. La mortalidad fue analizada mediante el procedimiento
GENMOD de SAS (SAS Institute, 1990), utilizando una distribución binomial. La
función link utilizada para el análisis fue la función logit (ln(µ/1-µ)) siendo µ la media
del tratamiento.Cuando los efectos del cereal y la grasa fueron significativos, se utilizó el
Test de Tukey como medida de separción y comparación de medias. Además, contrastes
polinomiales fueron diseñados utilizando el procedimiento REG de SAS (SAS Institute,
1990) para estudiar el efecto linal (L) y cuadrático (Q) de la concentración energética de
la dieta. Una diferencia fue considerada significativa cuando P< 0.05.
2. Resultados
2.1. Variables Productivas
No se observaron interacciones entre el contenido energético de la dieta y el peso inicial
de las gallinas para ninguna de las variables estudiadas a lo largo del período
experimental. Para el período global considerado, el porcentaje de puesta (88.8, 91.2,
92.7 y 90.5%; L, P< 0.01; Q, P< 0.01), la masa de huevo (56.1, 58.1, 58.8 y 58.1 g/d; L,
P< 0.01; Q, P< 0.01), energía ingerida (304, 313, 316 y 324 kcal/gallina y día; L, P<
0.001), eficiencia energética (5.42, 5.39, 5.38 y 5.58 kcal AMEn/g egg; L, P< 0.001; Q,
P< 0.001), y ganancia media diaria (255, 300, 325 y 359 g; L, P< 0.001) se incrementaron
a medida que el contenido energético de la dieta se incremento desde 2,650 hasta 2,950
kcal/kg. Sin embargo, el consumo (114.8, 114.0, 111.0 y 110.0 g; L, P< 0.001), IC por kg
de huevo (2.05, 1.96, 1.89 y 1.89 kg/kg; L, P< 0.001; Q, P< 0.01) y por docena de huevo
(1.54, 1.48, 1.42 y 1.44 kg/docena; L, P< 0.01; Q, P< 0.01) disminuyo a medida que el
contenido energético de la dieta se incrementó. El peso del huevo y la mortalidad no
fueron afectados por la dieta.

Annex 1: Resumen en Español
198
El peso inicial de las gallinas afectó a varias variables productivas, incluyendo
peso del huevo, masa del huevo, consumo e IC por docena de huevo. Para el periodo
experimal global, las gallinas pesadas consumieron más pienso (113.9 vs. 111.0 g; P<
0.001) ingirieron más energía (321 vs. 311 kcal/gallina por día; P < 0.001), tuvieron
mayor masa de huevo (58.5 vs. 57.0 g; P <0.01) y mayor peso de huevo (64.2 vs. 63.0 g;
P< 0.01) que las gallinas ligeras. Sin embargo, el porcentaje de puesta, el IC por kg de
huevo, la eficiencia energética, la ganancia de peso y la mortalidad no fueron afectadas
por el peso inicial de las gallinas.
2.2. Calidad de Huevo
La dieta no afectó al porcentaje de huevos sucios, rotos, fárfaras o la proporción de yema
y albumen en el huevo. Sin embargo, las unidades haugh (L, P< 0.001) y la cáscara de
huevo (L, P< 0.001) disminuyó y la pigmentación de la yema aumentó (L, P< 0.001) a
medida que la concentración energética se incrementó. El peso inicial de las gallinas no
afecto al porcentaje de huevos sucios, rotos o fárfaras. La proporción de yema fue mayor
(P< 0.001) y la de albumen fue menor (P< 0.01) en las gallinas pesadas respecto de las
ligeras. Consecuentemente, el ratio yema:albumen fue mayor (P< 0.001) para las gallinas
pesadas.
3. Discusión
3.1. Variables Productivas
Las gallinas comen para satisfacer sus necesidades energéticas, de tal manera que un
incremento en el nivel energético de la dieta disminuye proporcionalmente el consumo
(Hill et al., 1956). Sin embargo, en el presente experimento, un incremento de un 11% en
la energía de la dieta (desde 2,650 hasta 2,950 kcal EMAn/kg) disminuyó el consumo,
pero solamente un 4%, obteniéndose un incremento en la energía ingerida de un 7%.
Annex 1: Resumen en Español
199
Estos resultados coinciden con los obtenidos por Bouvarel et al. (2010), la cual, observó
en una serie de experimentos llevados a cabo en los últimos 20 años, que como media, un
incremento de un 10% en la EMAn redujo el consumo pero sólo un 5.5%. Keshavarz
(1998) en gallinas blancas observaron en el período 18-66 sem de vida que un incremento
de un 8% en la EMAn de la dieta desde 2,815 hasta 3,035 kcal/kg incrementó la energía
ingerida en un 9%. Los datos indican que las gallinas ponedoras tienden a consumir
energía extra cuando la EMAn de la dieta es incrementada. Probablemente, la inclusión
de cantidades extra de grasa pueda mejorar la palatabilidad del pienso produciéndose un
mayor consumo.
El porcentaje de puesta se incrementó a medida que la concentración energética
de la dieta se incrementó desde 2,650 hasta 2,850 kcal/kg, pero nuevos incrementos
energéticos hasta 2,950 kcal/kg no resultaron en nuevas mejoras. Mathlouthi et al.
(2002) observaron en gallinas blancas que la producción se incrementó a medida que el
nivel energético de la dieta se incrementó desde 2,650 hasta 2,750 kcal/kg. Sin embargo,
Grobas et al. (1999c) en gallinas rubias alimentadas con dietas que variaron desde 2,680
hasta 2,810 kcal/kg, Harms et al. (2000) en gallinas blancas y rubias alimentadas con
dietas que variaron desde 2,500 hasta 3,100 kcal/kg, y Jalal et al. (2006, 2007) en
gallinas blancas alimentadas con dietas que variaron desde 2,800 hasta 2,900 kcal/kg, no
detectaron ninguna diferencia significativa en producción de huevo con cambios en el
contenido energético de la dieta. El peso del huevo no fue afectado por el incremento en
la concentración energética deacuerdo con los datos observados de Grobas et al.
(1999b), Çiftci et al. (2003), y Valkonen et al. (2008). Sin embargo, Harms et al.
(2000) y Wu et al. (2005, 2007b) observaron que el peso del huevo aumentó de forma
lineal con el incremento en el nivel energético de la dieta. Las razones de estas
discrepancias entre autores no son aparentes pero quizá estén relacionadas con el nivel de
LNL y contenido de grasa de la dieta control. Cuando la concentración energética de la

Annex 1: Resumen en Español
200
dieta se incrementa, hay un incremento tanto en el nivel de LNL como en el contenido de
grasa. En el presente experimento, el contenido de LNL de la dieta control fue 1.35%,
probablemente suficiente para maximizar el peso del huevo (Jensen et al., 1958; Shutze
et al., 1962; Irandoust et al., 2012). Además, el nivel de grasa añadida utilizada para
incrementar el nivel energético se incrementó desde 0.92 hasta 6.02%. Grobas et al.
(1999c) observó que un incremento en la grasa añadida de la dieta incrementó el peso del
huevo. En el presente experimento la masa de huevo se incrementó a medida que la
concentración energética de la dieta aumentó desde 2,650 hasta 2,750 kcal/kg, sin
embargo nuevos incrementos hasta 2,850 o 2,950 kcal/kg no originaron nuevas mejoras.
Estos resultados siguen la tendencia de los observados por Keshavarz (1998), el cual,
obtuvo una masa de huevo similar en gallinas ponedoras blancas alimentadas con dietas
que variaron en su concentración energética desde 2,820 hasta 3,040 kcal EMAn/kg. Sin
embargo, Joly y Bougon (1997) observaron un incremento en la masa de huevo de 4.5%
a medida que la concentración energética del pienso se incrementó desde 2,200 hasta
2,700 kcal/kg en gallinas rubias en el período productivo 19-68 sem de vida.
Probablemente, el incremento en la concentración energética del pienso sea mas efectiva
mejorando la masa del huevo cuando las dietas utilizadas en los ensayos posean un nivel
energético mas bajo. El IC por kg de pienso mejoró a medida que el nivel enegético de la
dieta se incrementó, en consonancia con los datos publicados por diversos autores
(Grobas et al., 1999a,b; Wu et al., 2005). Sin embargo, Keshavarz (1998) no obtuvo
diferencias in gallinas blancas en el período 18-66 sem de vida alimentadas con dietas
que variaron desde 2,820 hasta 3,040 kcal EMAn/kg. En el presente trabajo, las gallinas
alimentadas con la dieta alta en energía (2,950 kcal EMAn/kg) tuvieron un menor
consumo pero una mayor ingesta energética que las gallinas que comieron el resto de
dietas, sin embargo, el exceso de energía fue derivado a incrementar el peso vivo en vez
de mejorar la producción. Consecuentemente, la eficiencia de convertir la energía del
Annex 1: Resumen en Español
201
alimento en masa de huevo fue mejorada cuando se utilizó la dieta alta en energía (2,950
kcal EMAn/kg). Sin embargo, las gallinas que consumieron la dieta baja en energía
(2,650 kcal EMAn/kg) consumieron menos energía que las del resto de dietas.
Probablemente la cantidad de energía consumida por las gallinas de la dieta baja en
energía fue menor que el necesario para optimizar la producción, obteniéndose una menor
masa de huevo. Es posible que las gallinas alimentadas con la dieta baja en energía no
pudieran incrementar su consumo para cubrir sus necesidades energéticas debido a
limitaciones en la capacidad del tracto gastrointestinal. La ganancia media diaria se
incrementó 0.11 g/gallina y dia por cada 100 kcal de aumentó en la concentración
energética, un valor que es menor que los 0.20 g observados por Grobas et al. (1999c) en
gallinas rubias en el período 22-65 sem de vida con dietas que contenían 2,680 y 2,810
kcal/kg; y los 0.45 g observados por Harms et al. (2000) en gallinas leghorn blancas en el
período 36-44 sem de vida con dietas que contenían 2,520 o 3,080 kcal/kg. Sin embargo,
Keshavarz (1998) obstuvo un incremento en el peso vivo en gallinas blancas de 0.014
utilizando dietas con 2,820 o 2,040 kcal/kg en el período 20-66 sem de vida. Las actuales
gallinas ponedoras quizá respondan a incrementos en la concentración energética de la
dieta con incrementos moderados en el peso vivo, o con grandes incrementos cuando se
utilizan dietas con una alta concentración energética.
Los resultados del presente trabajo sugieren que las gallinas ponedoras modernas quizá
no regulen de una forma precisa su consumo con el objetivo de cubrir sus necesidades
energéticas cuando dietas con una concentración energética extrema (alta o baja) son
utilizadas. Las gallinas que consumieron la dieta alta en energía (2,950 kcal/kg) tendieron
a sobreconsumir energía con un efecto positivo sobre la ganancia de peso de los animales,
pero no se observaron mejoras en la masa del huevo, mientras que las gallinas que
consumieron la dieta baja en energía (2,650 kcal/kg) tendieron a reducir su consumo
energético con un impacto negativo sobre la masa de huevo.
Annex 1: Resumen en Español
202
La información disponible sobre los efectos del peso vivo inicial de las gallinas sobre
las variables productivas son muy limitados. Las gallinas pesadas al inicio del ciclo de
puesta consumieron más y produjeron huevos mas grandes a lo largo de todo el ciclo de
puesta respecto de las gallinas ligeras (Summers y Leeson, 1983; El Zubeir y
Mohammed, 1993). Bish et al. (1985) observó que gallinas blancas pesadas (1,377 g)
producían huevos más pesados que gallinas medianas (1,256 g) y ligeras (1,131 g),
resultados que son consistentes con los obtenidos en el presente experimento. Además las
gallinas pesadas produjeron más huevos pero el IC por kg de huevo fue similar que el de
las gallinas ligeras, confirmando los resultados de Keshavarz (1995). El peso del huevo
se incrementó significativamente con incrementos en el peso vivo inicial de las gallinas.
Keshavarz (1995) observó una diferencia de 1.4 g entre gallinas ligeras con un peso de
1,151 g y gallinas pesadas con un peso de 1,333 g en el período 18-62 sem de vida.
3.2. Calidad de Huevo
La concentración energética de la dieta no afectó al porcentaje de huevos sucios, rotos o
fárfaras a lo largo del período de puesta, consistentes con los datos obtenidos por Grobas
et al. (1999a). Sin embargo, la calidad del albumen disminuyó con el incremento en la
concentración energética de la dieta. Wu et al. (2005) obseraron una disminución en las
unidades haugh cuando la dieta se incremento de 2,720 a 2,960 kcal/kg. Las raones de las
discrepancias entre autores respecto de la variación en las unidades haugh con incremento
en la concentración energética de la dieta no son claros. En el experimento de Wu et al.
(2005) las dietas no eran isonutritivas, así los autores sugieren que el descenso en las
unidades haugh podrían originiarse debido a la menor ingesta de AA por parte d las
gallinas que comieron la dieta alta en energía. Sin embargo, en el presente estudio el
descenso en las unidades haugh ocurrió siendo todas las dietas isonutritivas por unidad
energética. En este sentido, puede ser que las diferencias residieran en las materias primas
Annex 1: Resumen en Español
203
utilizadas. La principal diferencia en la composición de las dietas fue que la dieta alta en
energía tenía más trigo y menos cebada que las dietas con menos energía. Sin embargo,
Lázaro et al. (2003) no observó ningún efecto del tipo de cereal sobre la calidad del
albumen. La pigmentación de la yema se incrementó linalmente con el incremento de la
concentración energética de la dieta a pesar de que todas las dietas tuvieron niveles
similares de maíz y pigmentante sintético. Las Xantofilas, el principal pigmentante
responsable del color de la yema, es soluble en grasa. A medida que incrementamos la
concentración energética de la dieta, el nivel de grasa fue incrementado favoreciendo la
absorción de xantofilas en el tracto gastrointestinal de la gallina. Similares resultados han
sido observados por Lázaro et al. (2003) y Gunawardana et al. (2008). La proporción
de cascara en el huevo disminuyo linalmente con el incremento de la concentración
energética de la dieta in concordancia con los resultados de Junqueira et al. (2006) el cual
observó un descenso lineal en la proporción de cáscara a medida que se incremento el
contenido energético de la dieta desde 2,850 hasta 3,050 kcal/kg en gallinas rubias en el
período 76-84 sem de vida. Sin embargo, Gunawardana et al. (2008) no observó ningún
efecto en la proporción de cáscara al utilizar 4 niveles de grasa añadida al pienso
(aumentando desde 0 hasta 238 kcal EMAn/kg). El nivel de grasa que incrementa la
concentración energética del pienso quizá pueda formar jabones con las sales cálcicas
presentes en el alimento, produciéndose una reducción en la retención de calcio y en el
peso relativo de la cáscara (Atteh and Leeson; 1983b, 1984). Sin embargo, Safaa et al.
(2008) obtuvieron una calidad de cáscara similar en la última fase de producción en
gallinas rubias alimentadas con dietas que incluyeron 1.1 o 3.0% de una mezcla de aceite
de soja y aceite de palma. Probablemente la proporción de ácidos grasos saturados en la
fracción lipídica quizá propició la formación de jabones.
El porcentaje de huevos sucios, rotos y fárfaras, unidades haugh y color de yema
no fueron afectados por el peso inicial de las gallinas. Sin embargo, los huevos de las
Annex 1: Resumen en Español
204
gallinas pesadas tuvieron una mayor proporción de yema y menor de albumen que las
gallinas ligeras. Consecuentemente, el ratio yema:albumen fue mayor para las gallinas
pesadas que para las gallinas ligeras. Los autores no han encontrado ningún artículo
científico publicado sobre los efectos del peso vivo inicial de las gallinas sobre la calidad
del huevo o la proporción de los distintos componentes del huevo. Probablemente, las
gallinas pesadas producen yemas más pesadas que las gallinas ligeras debido a que su
consumo es mayor, obteniéndose huevos con mayor proporción de yema (Leeson and
Summers, 2005).
4. Conclusiones
× Un incremento en el contenido energético de las dieta desde 2,650 hasta 2,950 kcal
EMAn/kg afectó a las variables productivas y la calidad del huevo a lo largo del período
de puesta
× Las gallinas que consumieron la dieta alta en energía (2,950 kcal EMAn/kg) tuvieron
una mayor ingesta de energía que las gallinas que consumieron las dietas con 2,750 y
2,850 kcal EMAn/kg, respectivamente, pero el exceso de energía ingerida fue derivado a
incrementar el peso vivo en vez de mejorar la productividad de las gallinas.
× Las gallinas que consumieron la dieta baja en energía (2,650 kcal EMAn/kg) tuvieron
un consumo energético por debajo de sus necesidades con el objetivo ve maximizar los
resultados productivos.
× Un incremento en la concentrción energética de la dieta disminuyó la calidad del
albumen y la proporción de cáscara en el huevo, pero no afecto al ratio yema:albumen.
× Las gallinas pesadas tuvieron un mayor consumo y mayor masa de huevo que las
gallinas ligeras, pero la eficiencia energética de ambos grupos no fue afectada por la
concentración energética.
Annex 1: Resumen en Español
205
× Un incremento en la concentración energética de la dieta incrementó el peso vivo de las
gallinas, pero la respuesta fue similar para todas las gallinas independientemente de su
peso al inicio del ciclo de puesta.
× Las gallinas pesadas tuvieron un ratio yema:albumen mayor que las gallinas.
× Los datos productivos fueron mejores en gallinas pesadas que en gallinas ligeras pero la
ventaja económica de incrementar el peso vivo de las gallinas al inicio del ciclo de puesta
quizá dependa de los precios de los distintos tamaños de huevo así como del coste
relativo de las materias primas.
Conclusiones generales e Implicaciones de la Tesis
Annex 1: Resumen en Español
Conclusiones generales e Implicaciones de la Tesis
Doctoral
Annex 1: Resumen en Español
206
Conclusiones generales e Implicaciones de la Tesis

Annex 1: Resumen en Español
207
Conclusiones Generales e Implicaciones
× El Maíz, trigo y cebada pueden utilizarse de forma exitosa en dietas para ponedoras en
niveles de un 45% asegurándose una cantidad mínima de ácido linoléico sin afectar a los
parámetros productivos o a la calidad del huevo. El aceite de soja, oleína vegetal o
manteca pueden ser utilizadas como fuente de energía en la dieta sin ningún tipo de
efecto perjudicial sobre los parámetros productivos o a la calidad del huevo.
× Incrementar el nivel de proteína bruta en el pienso desde 16.5% a 18.5% y de grasa
añadida al pienso de 1.8% a 3.6% no afectó a ninguna de las variables productivas
estudiadas o la calidad del huevo.
× Un incremento en el contenido energético de las dieta desde 2,650 hasta 2,950 kcal
EMAn/kg afectó a las variables productivas y la calidad del huevo a lo largo del período
de puesta.
× En general, las gallinas que inician el ciclo de puesta con un peso superior al estándar
racial poseen unos mejores resultados productivos, pero la ventaja de estos animales
depende de la diferencia en el peso del huevo respecto de animales con menor peso, así
como del coste relativo de las materias primas.
× Bajo condiciones prácticas los requerimientos de las gallinas ponedoras con el objetivo
de maximizar el peso del huevo son menores que las recomendaciones de la mayoría de
guías de manejo comerciales. Las actuales prácticas en el manejo de la nutrición de la
gallina ponedora comercial de disponer, al menos, de un nivel de ácido linoléico de 1.8%
o mayor no están justificadas.
× Variables productivas importantes en el rendimiento de la explotación como fueron el
porcentaje de puesta, el peso del huevo y el consumo fueron mayores en gallinas pesadas
que en las gallinas ligeras. Las variables relacionadas con la calidad del huevo no se
vieron afectadas por el peso inicial de las gallinas al comienzo del ciclo de puesta.
Annex 1: Resumen en Español
208
× El IC por kg de huevo no fue afectado por el peso inicial de las gallinas, de hecho el
IC por docena de huevo fue mejor en las gallinas ligeras respecto de las gallinas pesadas.
Ese dato puede indicar que el manejo y gestión de los lotes debe monitorizarse o
modularse dependiendo del objetivo comercial de una empresa. Así, el uso de gallinas
pesadas o ligeras dependerá de si producimos huevos a granel o estuchados, así como el
destino final de la producción, ya que el cliente nacional requiere un tamaño más grande
de huevo, sin embargo, si nuestro objetivo es la importación requeriremos un menor
gramaje de huevo.
× A nivel de campo, la utilización del incremento del nivel de proteína bruta por encima
de las recomendaciones del NRC (1994) con el objetivo de maximizar el peso del huevo
no está justificada in ninguno de los 2 grupos de gallinas.
× Las gallinas que consumieron la dieta alta en energía (2,950 kcal EMAn/kg) tuvieron
una mayor ingesta de energía que las gallinas que consumieron las dietas con 2,750 y
2,850 kcal EMAn/kg, respectivamente, pero el exceso de energía ingerida fue derivado a
incrementar el peso vivo en vez de mejorar la productividad de las gallinas.
× Las gallinas que consumieron la dieta baja en energía (2,650 kcal EMAn/kg) tuvieron
un consumo energético por debajo de sus necesidades con el objetivo ve maximizar los
resultados productivos.
× Un incremento en la concentración energética de la dieta disminuyó la calidad del
albumen y la proporción de cáscara en el huevo, pero no afecto al ratio yema:albumen.
× Las gallinas pesadas tuvieron un mayor consumo y mayor masa de huevo que las
gallinas ligeras, pero la eficiencia energética de ambos grupos no fue afectada por la
concentración energética.
× Un incremento en la concentración energética de la dieta incrementó el peso vivo de las
gallinas, pero la respuesta fue similar para todas las gallinas independientemente de su
peso al inicio del ciclo de puesta.

Annex 1: Resumen en Español
209
× Las gallinas pesadas tuvieron un ratio yema:albumen mayor que las gallinas.

Annex 1: Resumen en Español
210
Referencias
Atteh, J. O., S. Leeson, and R. J. Julian. 1983. Effects of dietary levels and types of fat on
performance and mineral metabolism of broiler chicks. Poult. Sci. 62:2403-2411.
Atteh, J. O., y S. Leeson. 1984. Effects of dietary saturated or unsaturated fatty acids and
calcium levels on performance and mineral metabolism of broiler chicks. Poult.
Sci. 63:2252-2260.
Atteh, J. O., and S. Leeson. 1985. Response of laying hens to dietary saturated and
unsaturated fatty acids in the presence of varying dietary calcium levels. Poult.
Sci. 64:520-528.
Ballam, G. C. 1985. Integrating nutrition and management to affect egg size. Poul.
Tribune. 91:40-44.
Bish, C. L., Beane, W. L., Rugzler, P. L. and Cherry, J. A. 1985. Body weight influence
on egg production. Poult. Sci. 64:2259-2262.
Bohnsack, C. R., R. H. Harms, W. D. Merkel, and G. B. Russell. 2002. Performance of
commercial layers when fed diets with four levels of corn oil or poultry fat. J.
Appl. Poult. Res. 11:68-76.
Bouvarel, I., Y. Nys, M. Panheleux, and P. Lescoat. 2010. Comment l’alimentation des
poules influence la qualité des oeufs. INRA Prod. Anim. 23:167-182.
Çiftci, I., E. Yenice, and H. Eleroglu. 2003. Use of triticale alone and in combination with
wheat or maize: effects of diet type and enzyme supplementation on hen
performance, egg quality, organ weights, intestinal viscosity and digestive system
characteristics. Anim. Feed Sci. Technol. 105:149–161.
Annex 1: Resumen en Español
211
Classen H. L. 1996. Cereal grain starch and exogenous enzymes in poultry diets. Anim.
Feed Sci. Technol. 62:21-27.
Coon, C. N., I. Obi, and M. L. Hamre. 1988. Use of barley in laying hens diets. Poult.
Sci. 67:1306-1313.
Craig, L.W. and T. Goodman. 1993. Utilization of feed enzymes in laying hen rations. J.
Appl. Poult. Res. 2:68-74.
Crouch, A. N., J. L. Grimes, P. R. Ferket, and L. N. Thomas. 1997. Enzyme
supplementation to enhance wheat utilization in starter diets for broilers and
turkeys. J. Appl. Poult. Res. 6:147-154.
Daghir, N. J. 1995. Replacement pullet and layer feeding and management in hot climate.
Poultry Production in Hot Climates. Eds.: Daghir, N.J. CAB International,
Cambridge. UK. pp.: 219-253
De Blas, C. 1991. Necesidades energéticas de las gallinas ponedoras. Nutrición y
alimentación de gallinas ponedoras. Eds.: De Blas, C. y Mateos, G.G. MAPA.
Madrid. AEDOS. Barcelona. Mundi-Prensa. Madrid. pp.:145-159.
De Groote, G. 1972. A marginal income, and cost analysis of the effect of nutrient
density on the performance of white leghorn hens in battery cages. Br. Poult.
Sci.13:503-520.
El Zubeir, E.A., and O.A. Mohammed. 1993. Dietary protein and energy effects on
reproductive characteristics of commercial egg type pullets reared in arid hot
climate. Anim. Feed Sci. Technol. 41:161-165.
Annex 1: Resumen en Español
212
Fariborz, K., M. Faraji, and S. K. Dehkordi. 2007. Effects of reduced-protein diets at
constant total sulfur amino acids: lysine ratio on pullet development and
subsequent laying hen performance. Am. J. Anim. Vet. Sci. 2:89-92.
Frikha, M., H. M. Safaa, M. P. Serrano, X. Arbe, and G. G. Mateos. 2009. Influence of
the main cereal and feed form of the diet on performance and digestive tract of
brown-egg laying pullets. Poult. Sci. 88:994–1002.
Frikha, M., H. M. Safaa, M. P. Serrano, E. Jiménez-Moreno, and G. G. Mateos. 2011.
Influence of the main cereal of the diet and particle size of the cereal on
peroductive performance and digestive traits of brown-egg laying pullets. Anim.
Feed. Sci. Technol. 164:106-115.
Francesch, M., A.M. Pérez-Vendrell, E. Esteve-García, and J. Brufau. (1995). Enzyme
supplementation of a barley and sunflower-based diet on laying hen performance.
J. Appl. Poult. Res. 4:32-40.
Fundación Española Desarrollo Nutrición Animal. 2010. Normas FEDNA para la
Formulación de Piensos Compuestos. C. de Blas, G. G. Mateos, and P. G.
Rebollar, ed. Fund. Esp. Desarro. Nutr. Anim., Madrid, Spain.
García, M., R. Lázaro, M. A. Latorre, M. I. Gracia, and G. G. Mateos 2008. Influence of
enzyme supplementation and heat processing of barley on digestive traits and
productive performance of broilers. Poult. Sci. 87:940-948.
Grobas, S., G. G. Mateos, and J. Mendez. 1999a. Influence of dietary linoleic acid on
productive and egg weight of eggs and egg components in young brown hens. J.
Appl. Poult. Res. 8:177-184.
Annex 1: Resumen en Español
213
Grobas, S., J. Mendez, C. De Blas, and G. G. Mateos. 1999b. Influence of dietary energy,
supplemental fat and linoleic acid concentration on performance of laying hens at
two ages. Br. Poult. Sci. 40:681-687.
Grobas, S., J. Mendez, C. De Blas, and G. G. Mateos. 1999c. Laying hen productivity as
affected by energy, supplemental fat, and linoleic acid concentration of the diet.
Poult. Sci. 78:1542-1551.
Grobas, S., J. Méndez, R. Lázaro, C. de Blas, and G. G. Mateos. 2001. Influence of
source and percentage of fat added to diet on performance on fatty acid
composition of egg yolks of two strains of laying hens. Poult. Sci. 80:1171-1179.
Gunawardana, P., D. A. Roland Sr., and M.M. Bryant. 2008. Effect of energy and protein
on performance, egg components, egg solids, egg quality, and profits in molted
Hy-line W-36 hens. J. Appl. Poult. Res. 17:432-439.
Gutiérrez-Álamo, A., P. Pérez de Ayala, M. W. A. Verstegen, L.A. Den Hartog, and M. J.
Villamide. 2008. Variability in wheat: factors affecting its nutritional value.
World’s Poult. Sci. J. 64:20–39.
H & N International. 2008. Brown Nick Management Guide. H & N International,
Cuxhaven, Germany.
Hammershoj, M. and J. B. Kjaer. 1999. Phase feeding for laying hens: effect of protein
and essential amino acids on egg quality and production. Acta Agric. Scand., Sect.
A, Animal Sci. 49:31-41.
Harms, R. H., P. T. Costa, and R. D. Miles. 1982. Daily feed intake and performance of
laying hens grouped according to their body weight. Poult. Sci. 61: 1021-1024.
Harms, R. H. 1986. Should phase feeding be used for laying hens?. Feedstuffs 58:18.

Annex 1: Resumen en Español
214
Harms, R. H. and Ivey, F. J. 1993. Performance of commercial laying hens fed various
supplemental amino acids in a corn-soybean meal diet. J. Appl. Poult. Res. 2: 273-
282.
Harms, R.H., G. B. Russell, and D. R. Sloan. 2000. Performance of four strains of
commercial layers with major changes in dietary energy. J. Appl. Poult. Res.
9:535-541.
Hawes, R. O. and Kling, L. J. 1993. The efficacy of using prelay and early-lay rations
for brown-egg pullets. Poul. Sci. 72:1641-1649.
Hill, F. W., D. L. Anderson, and L. M. Dansky. 1956. Studies of the energy requirements
of chickens 3. The effect of dietary energy level on the rate and gross efficiency of
egg production. Poult. Sci. 35:54-59.
Hussein, A. S., Cantor, A. H., Pescatore, A. J. and Johnson, T. H. 1996. Effect of dietary
protein and energy levels on pullet development. Poult. Sci. 75:973-978.
Huyghebaert, G., De Groote, G., Butler, E. A. and Morris, T. R. 1991. Optimun
isoleucine requirement of laying hens and the effect of age. Br. Poult. Sci. 32:
471-481.
Isa Brown. 2011. Nutrition Management Guide. Institut de Selection Animale. B.V,
Boxmeer, The Netherlands.
Jalal, M.A., S. E. Scheideler, and D. Marx. 2006. Effect of bird cage space and dietary
matabolizable energy level on production parameters in laying hens. Poult. Sci.
8:5306-5311.
Annex 1: Resumen en Español
215
Jalal, M.A., S. E. Scheideler, and E. M. Pierson. 2007. Strain response of laying hen to
varying dietary energy levels with and without avizyme supplementation. J. Appl.
Poult. Res. 16: 289-295.
Jamroz, D., J. Skokupinska, J. Orda, A. Wiliczkiewicz, and A. M. Klunter. 2001. Use of
wheat, barley or triticale in feed for laying hens supplemented with carbohydrates
derived from Trichoderma longibrachiatum. J. Appl. Anim. Res. 19:255-263.
Jensen, L. S., J. B. Allred, R. E. Fry, and J. McGinnis. 1958. Evidence for an unidentified
factor necessary for maximum egg weight in chickens. J.Nutri. 65:219-223.
Joly, P. (1995) Puesta al día de las necesidades de aminoácidos de las gallinas ponedoras.
XXXII Symposium de avicultura. Sección española de la Asociación Mundial de
Avicultura Científica (WPSA). Barcelona. Spain. pp.: 67-81.
Joly, P., and M. Bougon. 1997. Influence du niveau énergétique sur les performances des
pondeuses à oeufs roux et évolution de l´ingéré en fonction de l`âge. 2ême
Journée de la Recherche Avicole. Vol. 2:115-120.
Junqueira, O.M., A. C. de Laurentiz, R. da Silva Filardi, E. A. Rodrigues, and E. M.
Casartelli. 2006. Effects of energy and protein levels on egg quality and
performance of laying hens at early second production cycle. J. Appl. Poult. Res.
15:110-115.
Keshavarz, K., and S. Nakajima. 1995. The effect of dietary manipulations of energy,
protein, and fat during the growing and laying periods on early egg weight and
egg components. Poult. Sci. 74:50-61.
Keshavarz, K. 1995. Further investigations on the effect of dietary manipulations of
nutrients on early egg weight. Poult. Sci. 74:62-74.

Annex 1: Resumen en Español
216
Kling, L.J. and Hawes, R. O. 1990. Effect of fat, protein, and methionine concentrations
on egg size and production in early matured brown-egg-type pullets. Poult. Sci.
69:1943-1949.
Lázaro, R., M. García, M. J. Araníbar, and G.G. Mateos. 2003. Effect of enzyme
addition to wheat-, barley- and rye-based diets on nutrient digestibility and
performance of laying hens. Br. Poult. Sci. 44:256-265.
Leeson, S., Lewis, D. and Shrimpton, D. H. 1973. Multiple linear regression equations
for the prediction of food intake in the laying fowl. Br. Poult. Sci. 14: 595-608.
Leeson, S., and J. D. Summers. 1987. Effect of immature body weight on laying
performance. Poult. Sci. 66:1924-1928.
Leeson, S., and J. D. Summers. 2005. Comercial Poultry Nutrition, 3rd Edition.
Nottingham University Press. Nottingham, UK.
Liebert, F., J. K. Htoo, and A. Sünder. 2005. Performance and nutrient utilization of
laying hens fed low-phosphorus corn-soybean diets supplemented with microbial
phytase. Poult. Sci. 84:1576-1583.
Lohmann. 2010. Management Guide for Lohmann Brown-Classic. Lohmann Tierzucht.
GMBH. Cuxhaven, Germany.
March, B. E. and Biely, J. 1963. Control of egg size in chickens through dietary amino
acid balance. Nature. 200:702-703.
March, B. E. and McMillan, C. 1990. Linoleic acid as a mediator of egg size. Poult. Sci.
69:634-639.

Annex 1: Resumen en Español
217
Mateos, G. G. and J. L. Sell. 1980b. Influence of graded levels of fat on utilization of
pure carbohydrate by the laying hen. J. Nutr. 110:1894-903.
Mateos, G. G. and. J. L. Sell. 1981. Nature of the extrametabolic effect of supplemental
fat used in semipurified diets for laying hens. Poult. Sci. 60:1925-1930.
Mathlouthi, N., M. Larbier, M. A. Mohamed, and M. Lessire. 2002. Performance of
laying hens fed wheat, wheat-barley or wheat-barley-wheat bran based diets
supplemented with xylanase. Can. J. Anim. Sci. 82:193-199.
Morris, T. R. 1968. The effect of dietary energy level on the voluntary calorie intake of
laying hens. Br. Poul. Sci. 9:285-295.
Morris, T. R. and Gous, R. M. 1988. Partitioning of the response to protein between egg
number and egg weight. Br. Poul. Sci. 29:93-99.
Nathanael, A. S. and Sell, J. L. (1980) Quantitative measurements of the lysine
requirement of the laying hen. Poult. Sci. 59:594-597.
Newcombe, M. and Summers J. D. 1985. Effects on increasing cellulose in diets fed as
crumble or mash on the food intake and weight gains of broilers and Leghorn
chicks. Br. Poult. Sci. 26:35-42.
NRC. 1994. Nutrient Requirements of Poultry. 9th ed. Natl. Acad. Press, Washington,
DC.
Parsons, C. M., Koelkebeck, K. W., Zhang, Y., Wang, X. and Leeper, W. 1993. Effect of
dietary protein and added fat levels on performance of young laying hens. J. Appl.
Anim. Res. 2:214-220.
Annex 1: Resumen en Español
218
Peguri, A., and C. Coon. 1991. Effect of temperature and dietary energy on layer
performance. Poult. Sci. 70:126-138.
Pilbrow, P. W. and Morris, T. R. 1974. Comparison of lysine requirements amongst eight
stocks of laying fowl. Br. Poult. Sci. 15:51-73.
Pirgozliev, V. R., C. L. Birch, S. P. Rose, P. S. Kettlewell, and M. R. Bedford. 2003.
Chemical composition and the nutritive quality of different wheat cultivars for
broiler chickens. Br. Poult. Sci. 44:464–475.
Prochaska, J. F., Carey, J. B. and Shafer, D. J. 1996. The effect of L-lysine intake on egg
component yield and composition in laying hens. Poult. Sci. 75:1268-1277.
Proudfoot, F.G., Hulan, H. W. and McRae, K. B. 1988. Performance comparisons of
phased protein dietary regimens fed to commercial Leghorns during the laying
period. Poult. Sci. 67:1447-1454.
Ribeiro, B.R.C., L.J.C. Lara, N.C. Baiao, C.A.A. Lopez, M.A. Fiuza, S.V. Conçado, and
G.M.M. Silva. 2007. Effect of linoleic acid level in the diet on the weight,
composition and eclodibility of broiler breeders eggs. Arq. Bras. Med. Vet.
Zootec. 59: 789-796.
Ruiz, N., J. E. Marion, R. D. Miles, and R. B. Barnett. 1987. Nutritive value of new
cultivars of triticale and wheat for broiler chick diets. Poult. Sci. 66:90–97.
Roland, D. A., Kao, D. K., Bryant, M. M. and Self, J. (1992) Econometric nutrition:
Maximizing profits in commercial Leghorn by optimizing feeding method, total
sulfur amino acid intake and environmental temperature. Degussa Technical
Symposium. Degussa Corp., Indianapolis, IN. pp.:47-57
Annex 1: Resumen en Español
219
Roland, D. A., Sr. 1988. Research note: eggshell problems: Estimates of incidence and
economic impact. Poult. Sci. 67:1801-1803.
Safaa, H. M., E. Jiménez-Moreno, D. G. Valencia, M. Frikha, M. P. Serrano and G. G.
Mateos 2009. Effect of main cereal of the diet and particle size of the cereal on
productive performance and egg quality of brown egg-laying hens in early phase
of production. Poult. Sci. 88:608-614.
Schutte, J. B., De Jong, J. and Bertram, H. L. 1994. Requirements of the laying hen for
sulfur amino acids. Poult. Sci. 73:274-280.
Scragg, R. H., Loga, N. B. and Geddes, N. 1987. Response of egg weight to the inclusion
of various fats in layer diets. Br. Poul. Sci. 28:15-21.
Sell, J. L. and Hodgson, G. C. 1966. Wheat-soybean meal rations for laying hens. Poult.
Sci. 45:247-253.
Sell, J. L., Angel, C. R. and Escribano, F. 1987. Influence of supplemental fat on weights
of egg and yolks during early egg production. Poult. Sci. 66:1807-1812.
Shannon, D. W. F. and Whitehead, C .C. 1974. Lack of response in egg weight or output
to increasing levels of linoleic acid in practical layers’ diets. J. Sci. Food Agric.
25:553-561.
Sohail, S. S., M. M. Bryant, and D. A. Roland, Sr. 2003. Influence of dietary fat on
economic returns of commercial Leghorns. J. Appl. Poult. Res. 12:356–361.
Summers, J. D. 1986. Feeding light hibrids in lay. Poultry International. 25:22-26.
Summers, J. D., Atkinson, J. L. and Spratt, D. 1991. Supplementation of low protein diet
in an attempt to optimize egg mass output. Can. J. Anim. Sci. 71:211-220
Annex 1: Resumen en Español
220
Summers, J.D. and S. Leeson. 1983. Factors influencing early egg size. Poult. Sci.
62:1155-1159.
Usayran, N., M. T. Farran, H. H. O. Awadallah, I. R. Al-Hawi, R. J. Asmar, and V. M.
Ashkarian. 2001. Effects of added dietary fat and phosphorus on the performance
and egg quality of laying hens subjected to a constant high environmental
temperature. Poult. Sci. 80:1695–1701.
Walker, A. W., Tucker, S. A. and Lynn, N. J. 1991. Effects of nutrient density and fat
content on the performance of laying hens. Br. Poult. Sci. 32:1138-1139.
Wethli, E. and Morris, T. R. 1978. Effects of age on the tryptophan requirements of
laying hens. Br. Poult. Sci. 19:559-565.
Whitehead, C. C. 1981. The response of egg weight to the inclusion of different amounts
of vegetable oil and linoleic acid in the diet of laying hens. Br. Poult. Sci. 22:525-
532.
Whitehead, C. C. 1984. Essential fatty acids in poultry nutrition. Fats in animal nutrition.
Eds.: WISEMAN, J. Butterworths. London. UK. pp.: 153-166
Whitehead, C. C., Bowman, A. S. and Griffin, G. D. 1991. The effects of dietary fat and
bird age on the weights of eggs and egg components in the laying hen. Br. Poult.
Sci. 32:565-574.
Whitehead, C. C., Bowman, A. S. and Griffin, G. D. 1993. Regulation of plasma
oestrogen by dietary fats in the laying hen: relationship with egg weight. Br.
Poult. Sci. 34:999-1010.
Whitehead, C. C. 1995. Plasma oestrogen and the regulation of egg weight in laying hens
by dietary fats. Anim. Feed. Sci. Technol. 53:91-98.
Annex 1: Resumen en Español
221
Wu, G., M. M. Bryant, R. A. Voitle, and D.A. Roland Sr. 2005. Effect of dietary energy
on performance and egg composition of Bovans white and Dekalb white hens
during phase I. Poult. Sci. 84:1610-1615.
Zimmermann, N. G., and D. K. Andrews. 1987. Comparison of several induced molting
methods on subsequent performance of Single Comb White Leghorn hens. Poult.
Sci. 66:408-417.