tesis doctoral de la universidad de alicante. tesi doctoral...
TRANSCRIPT

Three essays on specification testing in econometric models. Alicia Pérez Alonso.
Tesis doctoral de la Universidad de Alicante. Tesi doctoral de la Universitat d´Alacant. 2006.

I l : B m.. ¿^^b j i
Three Essays on Specification Testing in Econometric Models
Alicia Pérez Alonso
.^i^-//-'^' ^- ' '•''^^\ Supervisor: Juan Mora López
Quantitative Economics Doctorate Departamento de Fundamentos del Análisis Económico
Universidad de Alicante
July 2006
Three essays on specification testing in econometric models. Alicia Pérez Alonso.
Tesis doctoral de la Universidad de Alicante. Tesi doctoral de la Universitat d´Alacant. 2006.

Os meus avós, ós meus pais e a miña irmá:
Por darme ás para voar e facerme sentir que sempre terei un fogar ó que voltar.
Three essays on specification testing in econometric models. Alicia Pérez Alonso.
Tesis doctoral de la Universidad de Alicante. Tesi doctoral de la Universitat d´Alacant. 2006.
Agradecimientos
Quiero agradecer a mi director de tesis Juan Mora la disposición, paciencia y apoyo mostrados a lo largo de estos años, en los que ha compartido conmigo sus conocimientos y su tiempo. Para mí serás siempre un referente a seguir tanto en lo profesional como en lo personal. Muchas gracias por todo lo que me has enseñado.
Quiero expresar mi gratitud también a los miembros del Departamento de Fundamentos del Análisis Económico de la Universidad de Alicante, desde mis profesores en los cursos del doctorado hasta aquellos que han participado en el Workshop de Econometria. En concreto me gustaría mencionar a Lola Collado por la lectura de mi trabajo y su ayuda.
Gracias también a mis profesores de Vigo, y en especial a Eduardo Giménez, María Jesús Freiré, Consuelo Pazo, Manuel Besada, Gustavo Bergantiños y José María da Rocha por haberbe animado a emprender esta locura y confiar en mis posibilidades. Me gustaría darle las gracias también a Daniel Miles por su hospitalidad y por abrirme de nuevo las puertas de Vigo.
Agradezco también a los miembros del CAM (Universidad de Copenhague) su hospitalidad durante mi estancia allí. Gracias muy especialmente a Sergio y a Mirtha por vuestra amistad y hacerme sentir como en casa.
Durante estos años en Alicante, son tantos los buenos amigos que he hecho que no sé muy bien por dónde empezar a dar las gracias. Sin duda, pese a todos los sacrificios que conlleva estar lejos de la familia, la morriña por mi tierra y los momentos de desánimo vividos durante los cursos y la tesis, empezar este doctorado es la mejor decisión que he tomado en mi vida. Por este motivo, Alicante siempre será para mi un punto de referencia.
Muchas gracias especialmente a Patricia Castromán y Pilar Castillo por compartir conmigo risas, llantos y charlas interminables durante los cursos. Por toda la confianza que habéis depositado en mí desde el principio, vuestro ánimo y amistad siento que esta tesis también es vuestra.
Para mis niñas, Laura y Marisa, un gracias enorme por todo, que es muchísimo. La verdad es que no me hago a la idea de que no volvamos a compartir despacho. Os voy a echar mucho de menos. Gracias también a mis queridos compañeros de piso Jorge, Gabriel, Leonora y Fiorenzo. También a Patricia Restrepo y Monica Contestabile que vinieron de su mano. No puedo olvidar a todos los compañeros del doctorado con quienes he compartido muchos buenos momentos. Me gustaría mencionar especialmente a Antonio, Chony, Miguel, Rebeca, Dunia, Juandi, Bea, Ricardo Alberola, Lore, Arantxa, Szabi, José María, Paco, Ricardo Martínez, Patri (te has ganado ha pulso el diminutivo), Aida, Jaromir, Nataliya, Aitor, Lari y Frede. Muchas gracias a todos por vuestra amistad.
Gracias muy especialmente a Silvio, porque sin él no habría podido concluir esta tesis. Llegaste en el momento más oportuno. Trabajar contigo ha significado
Three essays on specification testing in econometric models. Alicia Pérez Alonso.
Tesis doctoral de la Universidad de Alicante. Tesi doctoral de la Universitat d´Alacant. 2006.

recobrar de nuevo las ganas de dedicarme a esta profesión. Gracias por todo lo que me has enseñado, admiro tu fuerza y coraje para enfrentarte a las adversidades.
Finalmente me gustaría mencionar a mi familia, mi hermana Romi y mis padres. Sin su cariño, paciencia y apoyo incondicional no podría haber concluido con éxito esta tesis.
Three essays on specification testing in econometric models. Alicia Pérez Alonso.
Tesis doctoral de la Universidad de Alicante. Tesi doctoral de la Universitat d´Alacant. 2006.

Contents
Agradecimientos 2 Introduction and Summary 6 Introducción y Resumen en Español 9
A Bootstrap Approach to Test the Conditional Symmetry in Time Series Models 13 1.1 Introduction 13 1.2 The nonlinear dynamic model 16 1.3 Tests for conditional symmetry 20 1.4 Symmetric bootstrap 21
1.4.1 Asymptotic properties 23 1.5 A Monte Carlo study 26
1.5.1 Experimental design 26 1.5.2 Simulation results: a comparative study of symmetry tests . . 29
1.6 Conclusions 37 Appendix 39 References 42 Tables 45
Unemployment and Hysteresis: A Nonlinear Unobserved Components Approach 56 2.1 Introduction 56 2.2 An extension of Jaeger and Parkinson's model 61 2.3 Experimental design for computing the bootstrap p-value for the lin
earity hypothesis test 65 2.3.1 The state-space model 66 2.3.2 Homoskedastic bootstrap 66 2.3.3 Heteroskedastic bootstrap 69 2.3.4 Monte Carlo evidence 70
2.4 Empirical results 72 2.5 Conclusions 74 References 75
Three essays on specification testing in econometric models. Alicia Pérez Alonso.
Tesis doctoral de la Universidad de Alicante. Tesi doctoral de la Universitat d´Alacant. 2006.

Tables and Figures 78
Specification Tests for the Distribution of Errors in Nonparametric Regression: a Martingale Approach 85 3.1 Introduction 85 3.2 Statistics based on the estimated empirical process 88 3.3 Statistics based on a martingale-transformed process 92 3.4 Simulations 94 3.5 Concluding Remarks 95 Appendix 97 References 107 Tables 109
Three essays on specification testing in econometric models. Alicia Pérez Alonso.
Tesis doctoral de la Universidad de Alicante. Tesi doctoral de la Universitat d´Alacant. 2006.

Introduction and Summary
This thesis is composed of three chapters, in which we focus on three related, but
different, issues regarding specification testing^. In particular, in the first chapter,
we analyze how to test for conditional symmetry in time series data. In the second
chapter, we focus on an empirical application of an example of a nested hypothesis
test; this simply means that the null hypothesis that is tested is a special case of the
alternative model. Finally, in the third chapter, we describe how to test parametric
assumptions about the distribution of a regression error, making no parametric
assumption about the conditional mean or the conditional variance in the regression
model.
More precisely, in Chapter 1, "A bootstrap approach to test the conditional sym
metry in time series models ", we focus on the evaluation of several statistical testing
procedures that can be used to test for conditional symmetry. In particular, we con
sider the nonparametric test for conditional symmetry of Bai and Ng [2001, Journal
of Econometrics 103, 225-258]. The test, which is based on martingale transfor
mations, does not require the data to be stationary or independent and identically
distributed (i.i.d.), and the dimension of the conditional variables can be infinite.
The test is shown to be consistent and asymptotically distribution-free, but its com
putation is rather intensive. The literature on the closely related problem of testing
for (unconditional) symmetry is large. A classical test of symmetry is the test of
skewness. We show that under standard regularity conditions that ensure asymp
totic normality of parameter estimators, the asymptotic null distribution of this test
does not change when replacing the unknown errors by well-behaved residuals. In
addition, commonly used nonparametric tests are the Wilcoxon signed-rank test,
the Runs test and the Triples test, among others. These test are asymptotically
distribution-free for i.i.d. observations. It is not clear whether these tests can be
extended to testing for conditional symmetry, since it has not yet been rigorously
proved that statistics computed by using regression residuals instead of the true
^ Chapter 2 is a joint work with Silvestre Di Sanzo and Chapter 3 is a joint work with Juan Mora.
Three essays on specification testing in econometric models. Alicia Pérez Alonso.
Tesis doctoral de la Universidad de Alicante. Tesi doctoral de la Universitat d´Alacant. 2006.

errors have approximately the same distribution as those based on the errors. It is
by no means obvious that this is so. Another problem encountered when using real
data is that, for finite samples, the distributions of the symmetry tests included in
this study are still unknown. As a consequence, the true size of these tests often
differs to a large extent form its nominal size based on asymptotic critical values.
The main purpose of this chapter is to show if the bootstrap can be used to ob
tain finite-sample critical values. We describe the bootstrap method and establish
a consistency property of the bootstrap for a nonlinear dynamic model. We also
perform, for a wide variety of alternative symmetric and asymmetric distributions,
Monte Carlo simulations to compare the finite-sample size and power of the tests
when critical values are obtained using a bootstrap procedure with that we could
achieve using the asymptotic theory when available. The results of Monte Carlo ex
periments show that for the cases investigated, the bootstrap methodology proposed
performs reasonably well.
In Chapter 2, "Unemployment and hysteresis: a nonlinear unobserved compo
nents approach", we propose a definition of hysteresis taken from Physics which
allows for nonlinearities. To provide an operational statistical framework for our
concept of hysteresis we use the unobserved components approach, which decom
poses unemployment rate into a non-stationary natural component and a stationary
cyclical component, which are both treated as latent variables. We extend the model
of Jaeger and Parkinson [1994, European Economic Review 38, 329-42] by introduc
ing nonlinearities in the specification of the natural rate component. In particular,
we allow past cyclical unemployment to have a difi erent impact on the current nat
ural rate depending on the regime of the economy. The estimation methodology used
can be assimilated into a threshold autoregressive representation in the framework
of a Kalman filter. Under this new framework, the problem of testing for hysteresis
becomes a problem of testing for linearity. When we implement a test for linearity a
problem of unidentified nuisance parameters under the null hypothesis arises. As a
result, conventional statistics do not have an asymptotic standard distribution. To
circumvent this problem and derive an appropriate p-value for a test for hysteresis we
7
Three essays on specification testing in econometric models. Alicia Pérez Alonso.
Tesis doctoral de la Universidad de Alicante. Tesi doctoral de la Universitat d´Alacant. 2006.
propose two alternative bootstrap procedures: the first is vaHd under homoskedastic
errors and the second allows for general heteroskedasticity. We investigate the per
formance of both bootstrap procedures using Monte Carlo simulations. Our study
concerns Italy, France and the United States. For European countries, we reject the
null of linearity. This is related to the presence of hysteresis. On the other hand,
for the United States, we reject the hysteresis hypothesis, but we find evidence in
favour of persistence.
In Chapter 3, "Specification tests for the distribution of errors in nonparametric
regression: a martingale approach", we focus on the so important problem of test
ing whether the distribution of a regression error belongs to a parametric family of
continuous distribution functions, without assuming any specific parametric form
for the conditional mean function or the conditional variance function. If errors
were observable and the parameter were known, the problem we consider is usually
referred to as the one-sample problem. Suitable statistics for testing the hypothesis
of interest in this case are, for example, the Kolmogorov-Smirnov or Cramer-von
Mises type test statistics. In our context, we do not observe the error term, but we
can construct residuals using nonparametric estimators of the conditional mean and
the conditional variance. Additionally, we have to replace the unknown parame
ter by a well-behaved estimator. The consequences of replacing errors by residuals
and unknown parameters by estimators is that, in general, the empirical process
in which test statistics are based converges to a process that depends on unknown
quantities (the underlying true distribution and the true parameters). Therefore,
these test statistics are no longer asymptotically distribution-free; hence, asymptotic
critical values cannot be tabulated. To circumvent this problem, we propose test
statistics based on a martingale transformation of the estimated empirical process;
this martingale-transformed process is asymptotically distribution free and, hence,
asymptotic critical values can be obtained without bootstrap or simulation meth
ods. We also perform a Monte Carlo experiment to check the behaviour of the
asymptotically distribution-free test statistics for small and moderate sample sizes.
Three essays on specification testing in econometric models. Alicia Pérez Alonso.
Tesis doctoral de la Universidad de Alicante. Tesi doctoral de la Universitat d´Alacant. 2006.

Introducción y Resumen en Español
Esta tesis consta de tres capítulos, en los que se abordan diferentes aspectos de los
contrastes de especificación^. Así, en el primero se estudia cómo contrastar simetría
condicional en series temporales. El segundo se centra en una aplicación empírica
de un ejemplo de un contraste de hipótesis anidado; esto quiere decir que la hipóte
sis nula a contrastar es un caso particular del modelo bajo la hipótesis alternativa.
Finalmente, el tercero analiza cómo contrastar supuestos paramétricos sobre la dis
tribución de los errores de regresión sin hacer ningún supuesto paramétrico sobre la
media condicional o la varianza condicional del modelo de regresión.
Más concretamente, en el Capítulo 1, "Un enfoque bootstrap para contrastar
simetría condicional en modelos de series temporales", se evalúan varios proced
imientos estadísticos de contraste que pueden utilizarse para contrastar simetría
condicional. En particular, estudiamos el contraste no paramétrico para simetría
condicional de Bai y Ng [2001, Journal of Econometrics 103, 225-258]. Este con
traste, basado en una transformación de martingala, no exige que los datos sean
estacionarios o independientes e idénticamente distribuidos (i.i.d.), y la dimensión
del conjunto de variables condicionales puede ser infinita. Además, éste es consis
tente y tiene distribución asintótica libre, pero su cálculo es bastante intensivo. La
literatura sobre contrastes para la simetría no condicional es enorme. Un contraste
clásico es el del coeficiente de asimetría. Bajo condiciones de regularidad estándares
que aseguren la normalidad asintótica de los estimadores de los parámetros, la dis
tribución asintótica de este contraste bajo la hipótesis nula no cambia cuando se
sustituyen los errores no conocidos por residuos que se comportan correctamente.
Por otra parte, otros contrastes no paramétricos comúnmente utilizados son el con
traste de rangos-signos de Wilcoxon, el contraste de las rachas y el contraste de
los tripletes, entre otros. Estos contrastes tienen distribución asintótica libre con
observaciones i.i.d. No sabemos si estos contrastes pueden utilizarse para simetría
condicional, ya que no se ha demostrado de forma rigurosa que estos estadísticos cal-
^El Capítulo 2 es un trabajo conjunto con Silvestro Di Sanzo y el Capítulo 3 es un trabajo conjunto con Juan Mora.
9
Three essays on specification testing in econometric models. Alicia Pérez Alonso.
Tesis doctoral de la Universidad de Alicante. Tesi doctoral de la Universitat d´Alacant. 2006.

culados con los residuos tengan aproximadamente la misma distribución que cuándo
se calculan usando los verdaderos errores de regresión. Además, la demostración
no es trivial. Otro problema que aparece cuando usamos datos reales es que, para
muestras finitas, la distribución de los contrastes de simetría incluidos en este es
tudio es todavía desconocida. Por tanto, el tamaño real de los contrastes difiere
con frecuencia de su tamaño nominal, basado en valores críticos asintóticos. El
principal objetivo de este artículo es estudiar si el bootstrap se puede usar para
obtener valores críticos para muestras finitas. Se describe el método bootstrap y se
estable la consistencia del bootstrap para un modelo dinámico no lineal. También se
realizan, para una amplia variedad de distribuciones simétricas y asimétricas, simu
laciones de Monte Cario para comparar el tamaño y la potencia en muestras finitas
de los contrastes cuando los valores críticos se calculan utilizando un procedimiento
bootstrap con los que se obtienen cuando utilizamos la teoría asintótica, en caso
de que ésta exista. Los resultados de los experimentos de Monte Cario muestran
que, para los casos investigados, la metodología bootstrap que se propone funciona
razonablemente bien.
En el Capítulo 2, "Desempleo e histéresis: un enfoque no lineal de componentes
no observables", se propone una definición de histéresis extraída de la Física que
permite no linealidades. Para proporcionarle a este concepto de histéresis un marco
estadístico en el que operar se usa el enfoque de componentes no observables, el
cuál descompone el ratio de desempleo en una componente natural no estacionaria
y en una componente cíclica estacionaria, ambas tratadas como variables latentes.
El modelo de Jaeger y Parkinson [1994, European Economic Review 38, 329-42]
se amplía introduciendo no linealidad en la especificación de la componente ratio
natural. En concreto, se permite que la componente cíclica pasada tenga un impacto
diferente en el ratio natural de desempleo actual dependiendo del régimen de la
economía en el que nos encontremos. La metodología utilizada se puede asimilar a
la de los modelos umbral autoregresivos en el marco de un filtro de Kalman. En este
contexto, el contraste de histéresis se transforma en un contraste sobre la linealidad
del modelo. Al realizar el contraste de linealidad surge el problema de que hay
10
Three essays on specification testing in econometric models. Alicia Pérez Alonso.
Tesis doctoral de la Universidad de Alicante. Tesi doctoral de la Universitat d´Alacant. 2006.

parmámetros que no están identificados bajo la hipótesis nula. Como consecuencia,
los estadísticos convencionales no tienen una distribución asintótica estándar. Para
solucionar este problema y poder obtener p-valores adecuados para un contraste
de histéresis se proponen dos procedimientos bootstrap alternativos: el primero es
válido bajo homocedasticidad de los errores y el segundo permite formas generales de
heterocedasticidad. El funcionamiento de ambos procedimientos boost rap se estudia
mediante simulaciones de Monte Cario. Los países incluidos en el estudio son Italia,
Francia y Estados Unidos. Para los países europeos, se rechaza la hipótesis nula
de linealidad, lo cuál se asocia a la presencia de histéresis. Por el contrario, para
Estados Unidos, se rechaza la hipótesis de histéresis, pero hay evidencia sobre la
existencia de persistencia.
Finalmente, el Capítulo tercero "Contrastes de especificación para la distribución
de los errores en regresiones no paramétricas: un enfoque martingala", se centra en el
problema de cómo contrastar si la distribución de los errores de regresión pertenece a
una familia paramétrica de funciones de distribución continuas, sin suponer ninguna
forma paramétrica específica para las funciones media condicional y varianza condi
cional. Si los errores fuesen observables y los parámetros conocidos, el problema
estudiado se conoce en la literatura como el problema de una muestra. Estadísti
cos adecuados para contrastar la hipótesis relevante son, por ejemplo, estadísticos
del tipo Kolmogorov-Smirnov y Cráter-von Mises. En este contexto, el término de
error no es observable, pero podemos construir residuos utilizando estimadores no
paramétricos de la media condicional y la varianza condicional. Además, es necesario
reemplazar los parámetros desconocidos por estimadores adecuados de los mismos.
Las consecuencias de reemplazar los errores por residuos y los parámetros descono
cidos por estimadores son que, en general, el proceso empírico en el que se basan
estos estadísticos converge a un proceso que depende de variables desconocidas (la
verdadera distribución subyacente y los verdaderos parámetros). Por tanto, estos
estadísticos de contraste dejan de tener una distribución asintótica libre; como con
secuencia, los valores críticos asintóticos no pueden ser tabulados. Para solucionar
este problema, en este capítulo se proponen estadísticos de contraste basados un
11
Three essays on specification testing in econometric models. Alicia Pérez Alonso.
Tesis doctoral de la Universidad de Alicante. Tesi doctoral de la Universitat d´Alacant. 2006.

transformación martingala del proceso empírico estimado. El proceso que resulta de
esta transformación tiene distribución asintótica libre y, por tanto, se pueden obtener
valores críticos sin necesidad de utilizar el bootstrap o métodos de simulación. Un
experimento de Monte Cario estudia el comportamiento de estos estadísticos con
distribución asintótica libre para muestras de tamaño pequeño y tamaño moderado.
12
Three essays on specification testing in econometric models. Alicia Pérez Alonso.
Tesis doctoral de la Universidad de Alicante. Tesi doctoral de la Universitat d´Alacant. 2006.

Chapter 1
A Bootstrap Approach to Test the Conditional Symmetry in Time Series Models
1.1 Introduction
The problem of testing conditional symmetry in time series data is fundamental in
both theoretical and empirical research. In the last few years considerable research
has been devoted to model and forecast the conditional mean and the conditional
variance of financial time series, that is, the return and risk of financial assets, re
spectively. The class of (Generalized) Autoregressive Conditional Heteroskedasticity
((G)ARCH) models, introduced by Engle (1982) and BoUerslev (1986), is the most
widely used among economists and other applied practitioners to model time vary
ing conditional variances. In essence, all empirical studies that assume conditional
heteroskedasticity also use a quasi-maximum likelihood estimator (QMLE). If the
likelihood is assumed to be Gaussian, the QMLE is known to be consistent if the
conditional mean and the conditional variance are correctly specified. However, nor
mality of innovations is frequently not a very realistic assumption for high-frequency
financial time series because the resulting model fails to capture the kurtosis in the
data. Alternative distributions for innovations are considered in the literature. For
example, following BoUerslev (1987), a popular choice is the standardized Student-í
distribution. If the likelihood is assumed to be non-Gaussian, Newey and Steigerwald
13
Three essays on specification testing in econometric models. Alicia Pérez Alonso.
Tesis doctoral de la Universidad de Alicante. Tesi doctoral de la Universitat d´Alacant. 2006.

(1997) show that consistency of a QMLE requires that both the assumed innovation
density and the true innovation density are unimodal and symmetric around zero.
Moreover, if conditional symmetry fails, an additional parameter is needed to ensure
consistency of a non-Gaussian QMLE. The additional parameter accounts for the
location of the innovation density. The reader may refer to the work of Franses and
van Dijk (2000) for an extensive survey of the recent developments of modelling,
estimation and hypothesis testing for time-varying conditional variance models.
Whether or not conditional symmetry holds is also an issue of interest for adap
tive estimation. An adaptive estimator shares the asymptotic optimality properties
of the maximum likelihood estimator, differing from it in that a nonparametric es
timator of the score function of the log likelihood replaces the analytic expression
that would be used if the actual functional form of the disturbance distribution was
known. Bickel (1982) shows that if the density function of the disturbance is sym
metric about the origin, then the parameters of a linear regression model can be
estimated adaptively. Newey (1988) constructs adaptive estimators of linear regres
sion parameters by a generalized method of moments (GMM) when the foregoing
is true. The above results are extended to stationary autoregressive moving average
(ARMA) process by Kreiss (1987) and reduced-rank vector error correction models
by Hodgson (1998). In the case of testing, the efficiency of the methods can be
improved under the additional assumption of a symmetric error distribution, see for
example Azzalini and Bowman (1993) or Kulasekera and Wang (2001). Further,
conditional symmetry is part of the stochastic restrictions on unobservable errors
used in semiparametric modelling (see Powel (1994) and references therein). The
conditional symmetry restriction implies constant conditional mean and median,
which is quite familiar in econometric theory and practice.
The conventional asymptotic theory of the bootstrap relies on Edgeworth ex
pansions in order to prove the existence of asymptotic refinements. In many cases
the efficiency of this method can be improved under the additional assumption of
symmetry. Davidson and Flachaire (2001) study various versions of the wild boot
strap applied to a linear regression model with heteroskedastic errors. They show
14
Three essays on specification testing in econometric models. Alicia Pérez Alonso.
Tesis doctoral de la Universidad de Alicante. Tesi doctoral de la Universitat d´Alacant. 2006.

that when the error terms are symmetrically distributed about the origin, the wild
bootstrap applied to statistics based on heteroskedasticity-conistent standard errors
benefits from better asymptotic refinements than when errors are asymmetrically
distributed. In particular, they found that the error in rejection probability (ERP)
is at most of order T~ / with symmetric errors and at most of order T^^/^ with
asymmetric errors, where T denotes the sample size. Comparable results are ob
tained by Hall (1992) for the case of homoskedastic regression models. He shows
that bootstrap tests on the slope parameters benefit from refinements in the case of
unskewed error terms.
There is also a growing literature addressing the problem of conditional symmetry
of macroeconomic time series related to asymmetries in business cycles. As discussed
in Brunner (1992), the assumption of Gaussian shocks places strong restrictions on
the time series behaviour of economic fluctuations. Since the Gaussian distribution
is symmetric about zero, the conditional density is symmetric about its conditional
mean. Our notion of conditional symmetry is that, in an expansion (contraction),
the probability of further expansion (contraction), relative to the conditional mean,
is equal to the probability of a contraction (expansion). That is, positive shocks
to the conditional mean are as likely as negative shocks. There is a substantial
body of empirical evidence that suggests that business cycles expansions appear
to be more persistent and less volatile than contractions. That is, economic time
series behave asymmetrically over the business cycle; see e.g., DeLong and Summers
(1986), Hussey (1992), Verbrugge (1997) and Belaire-Franch and Contreras (2002).
Thus, symmetry tests are an essential first step in practical model-building exercises
since it is desirable to establish the validity or otherwise of the symmetry assumption
before exploring more complicated business cycle structures.
Tests for symmetry have a long tradition in both Statistics and Econometrics. In
this paper, we focus on the evaluation of several statistical testing procedures that
can be used to test for conditional symmetry. In particular, we consider the non-
parametric test for conditional symmetry of Bai and Ng (2001). The closely related
problem of testing for (unconditional) symmetry was investigated by Wilcoxon (see
15
Three essays on specification testing in econometric models. Alicia Pérez Alonso.
Tesis doctoral de la Universidad de Alicante. Tesi doctoral de la Universitat d´Alacant. 2006.

Gibbons and Chakraborti, 1992), Gupta (1967), McWilliams (1990) and Randies
et al. (1980) among others. It is not clear whether these tests can be extended to
testing for conditional symmetry, since it has not yet been rigorously demonstrated
that statistics computed by using regression residuals instead of the true errors have
approximately the same distribution as those based on the errors. It is by no means
obvious that this is so. However, for the case of tests of symmetry based on sample
moments, we show that under standard regularity conditions that ensure asymptotic
normality of moment estimators, the asymptotic null distributions of the tests do
not change when replacing the unknown errors by well-behaved residuals. Another
problem encountered when using real data is that, for finite samples, the distribution
of the symmetry tests included in this study is still unknown. As a consequence,
the true size of these tests often differs to a large extent from its nominal size when
asymptotic critical values are used. The main purpose of this paper is to investigate
whether the bootstrap can be used to obtain improved finite-sample critical values.
The remainder of the paper is organized as follows. Section 2 details the class
of nonlinear dynamic processes under which we will work. In Section 3, we briefly
review all the tests for conditional symmetry used in this paper. Section 4 describes
the bootstrap method and establishes a consistency property of the bootstrap for
nonlinear regression models. Section 5 performs a wide variety of Monte Carlo
simulations to compare the finite-sample size and power of the tests when critical
values are obtained using a bootstrap procedure with the size and power that we
could achieve using the asymptotic theory. Concluding comments are presented in
Section 6. Technical proofs of all results are deferred to an Appendix.
1.2 The nonlinear dynamic model
Suppose that { (^ , Xt)} is a strictly stationary discrete-time stochastic process with
y e M and Xt G W^, defined on some probability space {il, T, P). Here, Xt is
a vector containing both explanatory variables and lagged values of Yt. That is,
Xt = {Zt, Yt-^i,..., Yt^p)', where Zt G M.'^~P is a vector of some explanatory variables.
16
Three essays on specification testing in econometric models. Alicia Pérez Alonso.
Tesis doctoral de la Universidad de Alicante. Tesi doctoral de la Universitat d´Alacant. 2006.
Let Yt and Xt be both defined based on a stationary process {Vt} by
Yt = M/y(T4,yi_i,y,_2,...),
Xt = {Xn,...,Xuy^^x{VuV,^j,Vt-^2,...),
where ^ y : K°° ^- E and ^ x : K°° -^ M.^ are two Borel measurable functions,
respectively, and {Vt} may be vector-valued. We see that {{Yt,Xt)} depends upon
the infinite history of {Vt} . Let r > 0 be a positive real number. Following Gal
lant and White (1988), we define {{Yt,Xt)} to be Lr-near epoch dependent {Lr-
NED) with respect to a stationary process {Vt}, provided -E | l i f < oo and Vr{m) =
E Yt-Yt (m)
E Xt - x't^ ^ 0 as TO oo, where |-| and ||-|| are the absolute
value and the Euclidean norm of W^, respectively, Yt = '^Y.miyt, Vt-i,..., Vt-m+i),
^(m) ^ (x(™)^...^x,(-)y ^ ^xAyuyi-i.-.Vt-m+i). and ^ y „ and v^xm are R-
and K"^-valued Borel measurable functions with m arguments involved, respectively.
In particular, if Vr{m) = 0(TO"""^'*') for some A > 0 we say {(It, Xt)} is L^—NED of
size —a. The more negative —a is, the more quickly the dependence of {{Yt-,^t)}
on past values of Vt dies out. We will call Vrim) the stability coefficients of order r
of the process {(Yt.,Xt)}. Since NED is only a measure of how {{Yt.Xt)} depends
on {Vt}, we place no conditions here on the dependence properties of {V^}.
We are interested in the conditional distribution of Yt conditional on Xt. Condi
tional symmetry implies that the distribution of Yt, given Xt, has a symmetric form
about its conditional mean. That is to say, ft{y + Ht/^t) = ft{—y + l^'t/^t), where
ft{-/Xt) is the density of Yj conditional on Xt, and fj,^ = E [Yt/Xt] is the conditional
mean. We assume that the dynamic behaviour of Yt is given by the general nonlinear
time series regression model:
Yt = fi{Xt, e) + a{Xt, d)ut, t = l,2,...,T (LI)
where fi{Xt,, 9) and cr^{Xt, 0) are the conditional mean and the conditional variance
of Yt, respectively. The functional forms of /i : M"* x M'' ^ M and cr : E"* x E'' ^
E are known except for ^ E 0 C E^, where G is the parameter space. {ut}t^i
17
Three essays on specification testing in econometric models. Alicia Pérez Alonso.
Tesis doctoral de la Universidad de Alicante. Tesi doctoral de la Universitat d´Alacant. 2006.

are assumed to be independent and identically distributed (i.i.d.) zero-mean unit-
variance unknown errors with Ut being independent of Xt for all t. Fy(-) is the
cumulative distribution function (cdf) of Ut with density function /«(•). Let ^ be a
root-T consistent estimator of the parameter vector 9. The estimated residuals are
computed from the the estimated parameters. Then Ut = {Yt — ii{Xt,9))/a{Xt,6).
Unless otherwise stated, all summations considered here are taken from 1 to T,
where T denotes the number of observations. Note that the general framework (1.1)
encompasses linear regression models as a particular case.
Under model (1.1), conditional symmetry of Yt is equivalent to the symmetry
of Ut about zero, that is, fu{u) = fu{—u) for all u. Therefore, the null hypothesis
under test is that "HQ: Ut is symmetric about 0", versus the general alternative "Hi:
Ut is not symmetric about 0". It is pointed out that conditional symmetry does not,
in general, imply unconditional symmetry^.
An example of a NED process less trivial than a finite moving average process is
a simple AR(1) process (see Gallant and White, 1988, pp. 27-28). ARMA models
of finite order with zeros lying outside the unit circle can be shown to be NED of
arbitrarily large size, provided the parameters are chosen such that the stationarity
as well as the invertibility condition is fulfilled and the innovations satisfy appropri
ate moment conditions. Infinite MA processes can also be shown to be NED under
mild conditions on the moving average weights (see Wooldridge and White, 1988,
example 3.3). As Hansen (1991) has shown, strictly stationary GARCH processes
are NED under mild regularity conditions. This framework also includes the AR
process with ARCH/GARCH errors, discussed in Engle (1982), which is widely ap
plied in financial econometrics. Consider the AR(1)-GARCH(1,1) process, in which
observed data are generated as a realization of a stochastic compound process
Yt^'j + OYt.i + et, 1/2 u _ X , Ru , „,„2 Ct = Utht , ht = \ + (3ht-i + ae i - l ;
^To illustrate this, consider a MA{1) process Yt = Ut ~ Out~i with Ut i.i.d. and 6=1. The unconditional distribution of Yt is always symmetric with independence of whether or not /„(•) is symmetric, since Yj and —Yt have exactly the same distribution. However, the conditional distribution of Yt on Xt (which inlcudes Ut-^i) will be asymmetric in case Ut is asymmetric.
18
Three essays on specification testing in econometric models. Alicia Pérez Alonso.
Tesis doctoral de la Universidad de Alicante. Tesi doctoral de la Universitat d´Alacant. 2006.
with {ut} being i.i.d., so ht is strictly stationary. If |^| < 1, it is well-known that
this model can be expressed as
oo
Yt = 7/(1 -0)+E d^et^r. T = 0
It can be shown that Yt is NED of order r on the stationary process {ct}, if for
some r > 2 , £'|ei|'^ < A < o o , with stable coefficients
Vr{m) = E Yt~Y, (m) = E
oo
E O^e,. T=m
r < \6r E i r E ie,_^^.r < \er A / ( I - I D, T = 0
decaying at a geometric rate. The conditions to ensure that E \etf < oo are E \ut\^ <
oo for some r > 2, and p + a < 1.
We next show that e = Uth^ is NED of order r on the stationary process {ut}. oo k oo fe
By repeated substitution we have /it = A + A E n( /^ + '^^í-¿) = - + ' E H ^Í-ÍJ k=li=l k=li=l
where zt — (3 + aef. Because under f5 + a < 1, sup¿>; E\zt\^ < c < 1 for some r > 2,
it follows that
Elht]'' = X + XE oo fe
En *- <X + XJ2E k=l fc=l 1 = 1
by the Minkowski's inequality for infinite sums
1 = 1
< A(l + c / ( l - c ) ) < oo,
, M m~l k To see that ht is NED on {ut}, let h^"^' = A + A E 0 zt-^• By Minkowski's
fc=l i=l
inequality
v'^{m) E ht- ht (m)
XE oo k
E U^t-k=m i= l
< Ac" -' E E fc=i
11 ^t~{m-l)-i ¿ = 1
< c ™ A / ( l - c ) .
Thus ht is NED of order r on {«t}. By Theorem 4.2 of Gallant and White (1988),
et = iti/it is L^-NED on {^i}. This is also true for ARCH errors (/3 = 0).
19
Three essays on specification testing in econometric models. Alicia Pérez Alonso.
Tesis doctoral de la Universidad de Alicante. Tesi doctoral de la Universitat d´Alacant. 2006.

1.3 Tests for conditional symmetry
We next describe the tests for symmetry considered in our Monte Carlo study.
To test for conditional symmetry, tests are applied to regression residuals. Since
these tests have been discussed extensively in the literature, their description here
is relatively brief.
A classical test of symmetry is the test of skewness (see Gupta, 1967, for a review
of this test). This test is developed for demeaned data, but the statistic has the same
limiting distribution when applied to residuals from a simple linear regression model.
It might be of interest to compare this test with a joint test of the third and fifth
central moments. In principle, a joint test of more moments is possible, but the
higher order-moments are difficult to estimate precisely. The potential advantage is
to be more powerful than a test based on the third moment in isolation. A practical
strategy would be to start with the skewness coefficient and consider joint tests of
higher moments only if we do not reject HQ. Standard asymptotic results will lead
to the derivation of both a joint test of the third and fifth central moments and
the skewness coefficient. The proof is omitted here in order to save space, but is
available upon request. An advantage of these tests is that they are intuitive and
easy to compute. However, they present a number of limitations. First, the limiting
distributions of the estimators are known and have a simple form for the case of
ordinary least squares. Different estimation methods may yield different limiting
distributions. Second, they are moment-based tests, which require the existence of
the sixth and tenth moments, respectively. This is not satisfied by many useful
distributions such as the student-Í5 or GARCH process. Finally, these tests are not
consistent against alternatives which are asymmetric and yet have the third moment
and/or the fifth moment equal to zero.
Bai and Ng (2001) discuss how to test whether the regression residuals from
a nonlinear time series regression model are symmetrically distributed. The test,
which is based on martingale transformations, does not require the data to be sta
tionary or i.i.d., and the dimension of the conditional variables can be infinite. The
20
Three essays on specification testing in econometric models. Alicia Pérez Alonso.
Tesis doctoral de la Universidad de Alicante. Tesi doctoral de la Universitat d´Alacant. 2006.

test is shown to be consistent and asymptotically distribution free, but its compu
tation is rather intensive.
The literature on symmetry is large, an commonly used nonparametric tests are
the Wilcoxon signed-rank test (for further details, see Gibbons and Chakraborti
(1992), the Runs test of McWiUiams (1990), and the Triples test of Randies et al
(1980)). These test are asymptotically distribution-free for i.i.d. observations. In
the present setting, we replace the unobservable errors by well-behaved residuals.
Thus, the asymptotic distribution of these statistics is unknown.
1.4 Symmetric bootstrap
We consider the nonlinear regression model (1.1). Under the null hypothesis, we
know that the population {ui^ ...,UT} is symmetric about zero. The tests under
consideration were computed with estimated regression residuals when testing for
symmetry of regression errors. Let TV = Triui, ...^UT) denote the test statistic of
interest, which is a function of the standardized residuals. By using standardized
residuals, we are guaranteed that all model residuals have, at least, the same two
first moments.
In this section, we consider a bootstrap procedure for approximating the distrib
ution of the test statistic of interest, which is a function of the residuals, for testing
on the symmetry about the mean of the underlying distribution of the errors. When
bootstrapping any test statistic, our aim is to find a bootstrap distribution that
mimics the null distribution of the data, even though the data may be generated
by an alternative distribution. We propose a resampling scheme so that the null
hypothesis is respected in the bootstrap data-generating process. That is, a re
sampling method that ensures the bootstrap distribution to be symmetric. To be
precise, we define the bootstrap sample by T^ = {(y¿*,X¿*) : t = 1,2, . . . .T}, where
y / = /i(X;,?) + a{X;,e)u¡ and X; = {Zt,Y^*^^, ...,Y^*^p)'. Note that the exogenous
explanatory variables are fixed in repeated samples, and 9 is some estimate of the
parameter vector 9. Bootstrap residuals u* = (UJ , . . . ,M^) ' were constructed by a
21
Three essays on specification testing in econometric models. Alicia Pérez Alonso.
Tesis doctoral de la Universidad de Alicante. Tesi doctoral de la Universitat d´Alacant. 2006.
two-stage procedure:
Stage 1: Construct recentred versions of the residuals Ut = Ut — T~^Ylt^t-
Random signs are assigned to the centered residuals u^ according to independent
realizations of a Rademacher random variable St, independent of ut, which takes
values +1 and —1 with probability 1/2 each. By doing that, we obtain a set of
symmetrized residuals {sitfi, ...JSTUT}-
Stage 2: A random number device independently selects integers ij, ...^ir, each of
which equals any value between 1 and T with probability 1/T. We allow a single unit
StUt to appear more than once in the sample, that is to sample with replacement.
Therefore, the bootstrap data set {u^, ...,u^} consists of members of the original
data set {siUi, ...JS^UT}, some appearing zero times, some appearing once, some
appearing twice, etc.
Each bootstrap sample T^ is then used to re-estimate the parameter vector
9. Let 6 denote the bootstrap estimator of 9. The estimated residuals from the
bootstrap sample are
{u¡ - y; - /i(x;,r))/<T(x;,r): t = i,2, ...,T} .
Using bootstrap residuals, we compute the bootstrap test statistic TJ. = TT{UI, ..., u^).
Repeating this procedure B times gives a sample I T^^ : b = 1, ...,B> of TV val
ues. This sample mimics a random sample of draws of Tx under the null hypothesis.
In particular, we consider the problem of estimating the a-level critical value of the
TT test from its empirical distribution. Let c^^ denote the bootstrap estimate of
the a-level critical value. Let T^H\ < " (2) ^ ••• ^ ^T(B) denote the B realizations
of TT arranged in order of increasing size, and suppose we choose B and u such that
iz/B = 1 — a. Since the B values of T^¿ divide the real line into 5-1-1 parts, not B,
then it makes sense to select c^^ = T^i^^i)- For example, in the case of o; = 0.05
and B = 1000, this would involve taking c^^ = T^,QQ\-
It is convenient to choose a single value of B at which to monitor the performance
of all the tests. In this study, this is not possible since there are large differences
22
Three essays on specification testing in econometric models. Alicia Pérez Alonso.
Tesis doctoral de la Universidad de Alicante. Tesi doctoral de la Universitat d´Alacant. 2006.

between the run times of the tests. Different values of B were chosen, so as to make
the run time of each test approximately the same. We set B ~ 1999 for the moment-
based tests, the Wilcoxon signed-rank test and the Runs test, while B = 999 for the
Bai and Ng test. For the Triples test, we carry out i? = 99 bootstrap replications,
which is the smallest value of B that is commonly suggested. The processing time
becomes excessive when greater values are used, especially for T > 100. We will
illustrate the finite sample performance of the bootstrap proposal of the paper by
means of simulation in Section 4.
1.4.1 Asymptotic properties
To study the asymptotic properties of the proposed bootstrap, we need to state the
underlying assumptions.
(B l ) For some small 5 > 0 and some r > 2, the data generating process (DGP)
(1.1) is L2+¿-NED on {Zt, Ut} of size —2(r — l ) / ( r — 2). The constant S is specified
in A2 below.
(B2) E \Ytf+^ < oo for some S > 0.
(B3) The errors ut are i.i.d. random variables with zero mean, unit variance
and E' |iii| < oo. The density of Ut is /„(•) and the cdf Fu{-). Furthermore, Ut is
independent of Xt.
(B4) /i(-, •) and a{-, •) are twice continuously differentiable with respect to the
second argument with bounded derivatives. Additionally, there exists CTQ > 0 such
that (T(-, •) > (To-
(B5) The estimator ? satisfies VT0 -9) = Op(l).
(B6) /i.(-, •) and a(-, •) are Lipschitz continuous with respect to the first argument,
i.e., there exist a constant L^ such that \fj-{u, 9) — ¡i{v, 9)\ < L^ \\u — 7;||, and a[-, •)
satisfies a similar inequality for a certain constant L^.
(B7) '^x.m is continuously difi^erentiable with respect to the m arguments with
bounded derivatives.
(B8) m-^oo with m = o{T).
Assumptions Bl and B2 are related to the nonlinear process itself. Assumption
23
Three essays on specification testing in econometric models. Alicia Pérez Alonso.
Tesis doctoral de la Universidad de Alicante. Tesi doctoral de la Universitat d´Alacant. 2006.

B3 is concerned with the behaviour of the errors. The differentiabihty condition
required in B4 is relatively standard in nonlinear estimations. B5 is a standard
assumption, which ensures that the estimators are root-T consistent. Conditions
B6-B8 are required for purely technical reasons.
We next provide a little theory for the convergence of the empirical distribution
of standardized residuals under the symmetric bootstrap proposed above. The idea
behind the bootstrap is to replace the true distribution function of the error term
Ut by its empirical estimate. Let FT be the empirical distribution function of the
recentred standardized residuals, putting mass 1/T on each Uj, t — 1, ...,T. That is,
the centered residuals are equally likely to appear in the bootstrap sample. Following
Efron and Tibshirani (1993), a bootstrap sample is defined to be a random sample
of size T drawn from FT-, say u* = (Si,..., u^)'- The start notation indicates that u*
is not the actual data set u, but rather a randomized, or resampled, version of it.
We can construct the distribution GT, which places mass 1/T at StUt, t =
1, 2,..., T, where Sj is a Rademacher random variable, independent oiut- We use GT
as the basis for our bootstrap resampling scheme. It is straightforward to prove that
the distribution of the random variable StUt is symmetric about zero under both HQ
and Hi. Let G„ be its distribution function defined by
G„(x) = ^ ( l - F „ ( - 2 ; ) + F„(x))
It is pointed out that Gu{x) = F„(a;) for every given x under the null hypothesis.
Note that the symmetry of the bootstrap errors does not depend on whether the null
hypothesis holds or not, although Ut does. That is, our bootstrap approximation to
the null hypothesis is always valid even the data { ( ^ , - ^ Í ) } Í =X were drawn from a
population under which the null hypothesis does not hold. Therefore, the derived
bootstrap tests automatically follow the first guideline set by Hall and Wilson (1991).
Namely resampling should be done in a way that reflects the null hypothesis, even
when the true hypothesis is distant from the null. As they pointed out, this ensures
the reasonable power of the bootstrap test against the departure from the null
hypothesis.
24
Three essays on specification testing in econometric models. Alicia Pérez Alonso.
Tesis doctoral de la Universidad de Alicante. Tesi doctoral de la Universitat d´Alacant. 2006.

In order to investigate the asymptotic behaviour of the symmetric bootstrap,
we use the Mallows metric? c?2 to show that the bootstrap errors u^ approximate
the true errors Ut under HQ. There is one key result that make this metric a useful
tool in proving asymptotic results for regression models. From Bickel and Preedman
(1981; Lemma 8.3), given distributions F, Fi, F2,..._ the condition (Í2(-PT, F ) —> 0 as
T —> oo implies that the probability measures corresponding to Fx converge weakly
to the measure corresponding to F.
Proposition 1: Suppose that assumptions B1-B5 hold. Then, under HQ,
d2{ut,ul)-^0 as T —> oo.
As next step, we show that T^ replicates the structure of (1.1), given the original
data TT ~ {{Yt,Xt),t = 1,...,T}. For this purpose, we define TT = { (^ , Xt) ,
t = 1,...,T} as
Yt = ^iiXt,9) + a{Xt,e)et, i = l , 2 , . . . , T ,
where Xt = {Zt,l^„i,..., Yi„p} and {£t}t=i ^^^ conditionally i.i.d. random variables
with the following properties. Given T^, (i) £t has conditional distribution F^, (ii)
d2{£t,Uf) = d2{ut,u*), (iii) TT is L2+<5-NED on {Zt,et} for some 5 > 0. Here and
in the following, a star appearing in E denotes expectation with respect to T^
conditional on the data T7-.
Proposition 2: Suppose that assumptions B1-B8 hold. Then, under HQ,
sup E* \<t<T
y I - Y: = Op(l) jor T ^ 00.
The following corollary, which show that
given T7-, follows immediately from Proposition 2.
Yt ~ y: 0 in mean for T ^ 00
^The Mallows metric is defined by dl{X.Y) = dl{G,H) = inf {£;[i|X - Flpj : X''G,Y~H} , where the infimum is over all joint distributions of {X, Y) whose fixed marginal distributions are G and H respectively and where ||.|| denotes the Euchdean norm on R. See Bickel and Freedman (1981; Section 8) for a detailed discussion of this metric.
25
Three essays on specification testing in econometric models. Alicia Pérez Alonso.
Tesis doctoral de la Universidad de Alicante. Tesi doctoral de la Universitat d´Alacant. 2006.

Corollary 2: Suppose that assumptions B1-B8 hold. Then, under HQ,
E*{T-^ T. Yt-Y; }^0 forT ^ oo. t
Note that we do not prove that the conditional distribution of T^ given Ty is
asymptotically equal to the null-hypothesis distribution of TT since the asymptotic
distribution of TV is unknown for some of the statistics under consideration.
1.5 A Monte Carlo study
In this section, we investigate the finite-sample properties of the symmetry tests
of Section 2 by means of Monte Carlo simulation^. The aim of the experiments is
two-fold. First, to investigate whether the bootstrap procedure proposed in Section
3 can be used to obtain improved finite-sample critical values with respect to the
asymptotic theory, whenever this is available. Second, to identify the size and power
properties of the test statistics under various scenarios, including linear, AR, MA
and GARCH models. We first describe the data-generating processes (DGP) and
the experimental design that is used in our simulations. A discussion of the results
obtained in these simulation experiments follows.
1.5.1 Experimental design
The time series considered in our study are generated according to model (1.1),
where functions fJ.{-,-) •iid cr(-, •) are generated according to four basic types of
DGPs:
DGPi: ii{Xt,e) = f3, + J:Zu(3,, {Z^t,Z,u-.ZH)' '•- N{0,h), and a{Xt,e) =
a = l;
DGP2: fiiXt, 9) = c + pYt.j and a{Xt, 9) = a = 1;
DGP3: ^(Xi, #) = /i + (j)Ut-i and a{Xt, 6) = a = 1;
DGP4: ii{Xt,e)=^ and a{Xt, 9) = {ao + aMXt~i,9Y+ a2a{Xt^i,9ful^y/\
^All the procedures for estimating the models described in this section were written in GAUSS programming language. Programs are available from the author upon request.
26
Three essays on specification testing in econometric models. Alicia Pérez Alonso.
Tesis doctoral de la Universidad de Alicante. Tesi doctoral de la Universitat d´Alacant. 2006.

DGPi is a linear regression model with an intercept component and k i.i.d. variables
as regressors. Data are generated setting /3o = ... = / ^ = 1 and k — 1,4. The reason
for increasing the number of regressors is to observe the sensitiveness of the size and
the power of the tests to the additional regressors. For an AR(1) specification,
our simulation experiment is based on DGP2. We set c = 0 and p = 0.5,0.8.
We denote by DGP3 the MA(1) design. We set the constant regressor /i equal
to zero and 0 = 0.5,0.8. Finally, DGP4 corresponds to a GARCH(1,1) model. In
this framework, we set 7 = 1 and {ao,ai,a2) = (2,0.5,0.3). Also, we consider the
model with (tto, «i, 02) = (2, 0.9, 0.05), which is close to being an IGARCH(1,1). All
parameter combinations considered were selected to make the results of our study
comparable with those obtained by Bai and Ng (2001), whenever this is possible.
For each DGP, we draw Ut from symmetric and asymmetric distributions to
derive conditionally symmetric and asymmetric distributions for Y¿. To asses the
size of the tests, we first generate Ut from the standard normal distribution and
the student-i distribution with 5 degrees of freedom. To evaluate the power of
the tests, we draw random variables from the exponential distribution and the chi-
square with two degrees of freedom. We then consider another ten distributions,
four symmetric and six asymmetric, from the generalized lambda family (GLF)
discussed in Ramberg and Schmeiser (1974). The choice of all these distributions is
motivated by the fact they are used in previous studies of testing symmetry and in
consequence provide a benchmark for comparing size and power. In addition, they
cover a wide range of values of third and fourth standardized moments. The GLF
is easily generated since it is defined in terms of the inverse cumulative distribution
function F^^{u) = Ai + [u'^^ + (1 — u)" *] /A2, 0 < tí < 1, with mean and variance
given by:
// = Ai + [(l + A 3 ) " ' - ( l + A4)-V-^2,
a^ = [(l + 2A3)- ' -2/?(l + A3,l + A4) + (l + 2A4)"'
27
Three essays on specification testing in econometric models. Alicia Pérez Alonso.
Tesis doctoral de la Universidad de Alicante. Tesi doctoral de la Universitat d´Alacant. 2006.

where (3{-, •) denotes the beta function. The A parameters defining the ten selected
distributions are taken from Randies et al. (1980) and are listed in Table 1, together
with the associated skewness (773) and kurtosis (774) values. The distributions are
arranged in ascending order of departure from symmetry'*. To be under the assump
tions of the regression model, all error distributions are standardized to have zero
mean and unit variance. Among these distributions, the Student-í distribution with
5 degrees of freedom has finite variance, but does not have finite sixth and tenth
moments. The generalized lambda distributions have finite gth moment if, and only
if, —1/g < min{\z, A4). All other distributions have finite sixth and tenth moments.
This is aimed at checking how moment-based tests behave when data do not possess
proper moments.
The experiments proceed by generating artificial time series of length T from
(1.1) with T G {50,100,200}. We have to estimate k + 2 parameters in DGPi.
The parameters of interest are estimated using ordinary least squares. Next, in
DGP¿ {i = 2,3) and DGP4, we have three and four parameters to be estimated,
respectively. In order to do that, we use maximum likelihood (ML) estimation. In
the context of DGP4, as Fiorentini et al. (1996) proposed, for estimation purposes
we employ the analytic first and second derivatives of the log-likelihood instead
of numerical approximations in order to benefit for computational reductions and
avoid convergence problems. Finally, we compute the relevant test statistic TT =
Tx{ui, ...,UT), which is based on the standardized residuals from estimation of (1.1).
Due to the computational demand required by some of the tests included in
this study is very high, experiments were conducted using 500 replications for the
Triples test, 1000 for the Bai and Ng test, and 2000 for the remaining tests. For each
replication, we reject the null being tested at the nominal a-level, based on both
bootstrap and asymptotic critical values, if the observed test TT is above c^ ^ and
exceeds the (l-a) quantile of the corresponding asymptotic distribution, respectively.
We finally count the proportion of times that the null hypothesis is rejected for
each test statistic using bootstrap- and asymptotic-based critical values. For non-
'^The shapes of the GLF density functions are shown in McWilHams (1990).
28
Three essays on specification testing in econometric models. Alicia Pérez Alonso.
Tesis doctoral de la Universidad de Alicante. Tesi doctoral de la Universitat d´Alacant. 2006.

symmetric alternatives, this proportion yields an estimate of the power of the test.
In all cases power is not size-adjusted. On the other hand, the proportions from
the symmetric distributions imply estimates of the Type I error. Since the results
for tests performed at the 0.01, 0.05, and 0.10 significance levels are qualitatively
similar and lead to the same conclusions about the relative merits of different tests,
we focus on 5%-significance level tests^.
1.5.2 Simulation results: a comparative study of symmetry tests
The reader has to consider that the nonparametric tests included in this study, that
is, the Wilcoxon Signed-Rank test (WSRT), the Runs test {RT) and the Triples test
{TRT), are originally constructed for the problem of testing the unconditional sym
metry of an i.i.d. sample of observations. We investigate the performance of these
tests when testing for conditional symmetry. Under (1.1), conditional symmetry is
equivalent to the symmetry of the error term about zero. Furthermore, at this point
we do not provide an asymptotic distribution theory for these tests when unknown
errors are replaced by well-behaved residuals. This is not the case of Bai and Ng
test (CST) and moment-based tests {S^ and Sj¡ ), whose corresponding asymptotic
distributions are completely known. We implement a bootstrap version of all the
tests. Tables 2 to 9 show the empirical size and empirical power of the various tests
obtained using artificial time series generated according to DGPi, DGP2, DPG3
and DGP4. It should be pointed out that moment-based tests are only computed
when the process is uncorrelated (DGPi). We report empirical rejection rates (%)
under the null and the alternative based on both asymptotic critical values as well
as bootstrap critical values obtained from Monte Carlo trials. To establish heuristic
comparisons, for the set of nonparametric tests we use the tabulated asymptotic
critical values that will correspond to tests statistics computed with "observable"
errors^. This should be borne in mind when assessing the results. Based on the
^Results at the 1% and 10% levels of significance are available upon request. ^All the tests conducted in this simulation study are one-tailed tests at the 0.05 level. The
asymptotic critical values for the tests S^^^ and CST sxe 5.99 and 2.20 respectively. For the
29
Three essays on specification testing in econometric models. Alicia Pérez Alonso.
Tesis doctoral de la Universidad de Alicante. Tesi doctoral de la Universitat d´Alacant. 2006.

selected 5% nominal level (or size) of the tests, the empirical rejection frequencies
should be around 5% under the null, while they should be around 100% under the
alternative.
Table 2 presents the empirical size of the symmetry tests for DGPi. Let us
initially consider the Si^ test. In the six symmetric cases investigated, this test
performs similarly under bootstrap and asymptotic procedures. It is notably un
dersized (around 3%) in distributions S4 to S6, but only slightly undersized for S3.
In contrast, it has the correct size in Si and S2 cases, even when T = 50. For a
sample size of 50 observations, it is also worth noting that increasing the number
of regressors leads to a significant^ reduction in the empirical size for SI and S2
distributions. For larger sample sizes, test performance is not affected by increasing
the number of regressors.
A feature of the size properties of the S^^: statistic with asymptotic critical values
is that it is consistently undersized with actual size about 2% for most of the cases
investigated, but not all. This result is in stark contrast to the size properties of the
test with bootstrap-based critical values. The bootstrap does bring the empirical
size of the test closer to its nominal level, a sample size of T = 50 is large enough
for distributions SI and S2, while it is necessary T = 200 for distributions S3 to
S6, which are far from a mesokurtic distribution. The empirical size of this test is
rather stable to an increase in the number of regressors. The performance of both
moment-based tests under distributions S4 to S6 deserves further analysis, since
sixth and tenth moments of these distributions do not exist. The empirical size
of S^ test in S3, for which sixth and tenth moments exist, is comparable to its
size under distributions S4 to S6. The same applies to S^ when comparing S3 and
S5. Interestingly, when bootstrap critical values are used, the empirical size of the
remaining tests, the asymptotic critical value is 3.84. ^Because the results depicted here present numerous opportunities for comparing empirical sizes
and powers between symmetry tests, and for fixed test, between parameterizations of the DGP, it is difficult to assign a threshold percentage to determine a difference as statistically significant. We use the 1% when comparing sizes and the 10% when comparing powers. Despite being subjective choices, these values provide a good indication of whether differences are larger than can reasonably be explained by random simulations.
30
Three essays on specification testing in econometric models. Alicia Pérez Alonso.
Tesis doctoral de la Universidad de Alicante. Tesi doctoral de la Universitat d´Alacant. 2006.

S^^ test in S4 is comparable to that of CST, which is not a moment-based test,
for any values of T and k. This is not the case for thicker-tailed distributions such
as S5 and S6, where 5^' is clearly more conservative than CST- Comparing the
size of both moment-based statistics across distributions, shows that the Sj^ test
statistic rejects less often than the skewness coefficient under the null when using
asymptotic critical values. The results are the reverse with bootstrap-based critical
values except for distributions with kurtosis equal to 3.
We next consider the Bai and Ng test. Note that for all DGPs considered in
BN, the estimated regression model imposes a^ = 1. Under this circumstance, the
variance is not treated as a parameter to be estimated, as it is assumed in (1.1),
but a constant to be specify, and for this reason it is not possible to establish direct
comparisons between their results and those of this paper^. Fixing fc = 1, the size of
the test based on asymptotic critical values is largely satisfactory for distributions
SI to S4 when T — 50. However, this result should be interpreted with caution,
since when the sample increases to T = 100 empirical sizes fall drastically. This
may suggest that this test presents inflated sizes for small samples under these
distributions. Turning to fat-tailed distributions, we may see that S5 is slightly
oversized for T = 200. The S6 case is more seriously oversized, since at the 5% level
the rate of wrong rejections is 8.5% for T = 50. This distortion increases with T,
being the percentage of over-rejections of the empirical size above 5% of its nominal
size for T = 200. This reflects an efficiency loss in conducting the CST test based
on asymptotic critical values in distributions with high kurtosis, since it tends to
reject a true null too often. It should be pointed out, however, that oversizing is not
so large as to render the test unattractive for applications. These results appear to
be robust to increase the number of regressors to fc = 4. On the other hand, the
results from bootstrap critical values show that, in S5 and S6 cases, the bootstrap
performs well, with sizes close to the nominal level for T > 50. In the remaining
cases, the bootstrap test yields low sizes for values of T up to 100, with sizes mostly
^Models 1, 2, 4, 5 and 6 in Bai and Ng (2001) correspond to distributions SI, S4, A5, A7 and A8 in this paper, respectively.
31
Three essays on specification testing in econometric models. Alicia Pérez Alonso.
Tesis doctoral de la Universidad de Alicante. Tesi doctoral de la Universitat d´Alacant. 2006.
between 2% and 4%. It is also shown that this undersizing is corrected for large T.
Increasing the number of regressors moves bootstrap-based empirical sizes upward
in small samples. Since size distortions may lead to misleading inference, to guard
against possible over-rejection of the symmetry hypothesis, it is advisable to compute
this test statistic with bootstrap-based critical values.
For both values of k considered, the actual sizes of the Runs test based on asymp
totic critical values are close to the 5% nominal level even for T = 50. Increasing
the number of regressors increases the empirical size for Si, while it decreases for
S5. This is mainly a small sample effect, since if we compute the test with large T,
size is not affected by the number of regressors. When A; = 1, the Runs test with
bootstrap-based critical values has poor size. Interestingly, the performance of the
test steadily deteriorates as T increases, its rejection frequencies being around 1%
for T = 200. In unreported simulations, we found that the size distortions of the
bootstrap test do disappear slowly as T increases further. The size properties of RT
for fc = 4, on the other hand, seem largely satisfactory, being the performance of
the bootstrap comparable to asymptotic values.
In the case of the Wilcoxon Signed-Rank test, the striking feature of the results
is the quite severe size distortion of the test when asymptotic critical values are
used for any of the distributions considered. In the S6 case, a 1% size is reached,
while in the remaining cases rejection frequencies are equal or close to zero, which
illustrates the conservative nature of the test. These size distortions do not disappear
as T increases from 50 to 200. These results should be interpreted with caution.
The poor size properties of WSRT statistic might stem from incorrectly assuming
the asymptotic distribution of the test is invariant to the replacement of errors by
residuals. The use of bootstrap-based critical values instead of asymptotic ones
corrects the differences between the empirical and nominal sizes. For fixed k = 1
and sample sizes of T = 50 and above, the size of the WSRT test is fair in cases S3
to S6, with sizes above 4% and below 6%. In contrast, in cases SI and S2, this test
tends to be slightly undersized with actual sizes between 3% and 4% for T = 50.
A sample size of T = 200 observations appears large enough to ensure good size
32
Three essays on specification testing in econometric models. Alicia Pérez Alonso.
Tesis doctoral de la Universidad de Alicante. Tesi doctoral de la Universitat d´Alacant. 2006.

properties of WSRT test for these two distributions, which are between 4% and 5%.
When T = 50, as the number of regressors increases, size significantly decreases in
S2, while increasing in S6. In both cases, this is a small sample phenomenon.
Focusing on TRT, for series of length T = 50 and fc = 1, we may see that the
empirical size of the test with asymptotic critical values tends to be much smaller
than the nominal size, although the size distortions for SI and S2 are considerably
less than they are for distributions with kurtosis higher than normal (S3 to S6). In
particular, the empirical sizes of the test range between 2% and 3%, and between 1%
and 2%, respectively. In all the cases, sample sizes of at least 200 observations are
needed to avoid significant undersizing. When considering leptokurtic distributions
(S3 to S6) and fixing T = 50, size increases substantially with k. A similar result
holds for all the distributions when bootstrap critical values are used. Again, this
is a small sample effect. For fixed T and k, the performance of the test improves
with bootstrap critical values. For /c = 1, the test is slightly undersized, with sizes
between 3% and 4%. But, as T becomes larger, these size distortions disappear. For
k = 4, bootstrap-based empirical sizes are accurate throughout, even when T = 50.
The size properties of the Bai and Ng test together with the nonparametric tests
in DGP2, DGP3 and DGP4 are reported, respectively, in Tables 3 to 5. Overall,
the evidence from our simulations suggests that the relevant test statistics replicate
the same patterns found for DGPi. Fourth points are worth making regarding
the differences with respect to the discussion above. First, with bootstrap critical
values and T = 50, the TRT test is the most accurate for all three DGPs, and
also DGPi when fe = 4. Second, the asymptotic-based empirical size of CST under
S5 is slightly oversized under these three DGPs even when T = 50. Third, when
data come from a GARCH model (DGP4), the bootstrap-based empirical sizes of
WSRT under distributions SI and S2 are slightly oversized for T > 100. Moreover,
the conservative nature of RT when using bootstrap critical values decreases as T
increases, with sizes about 2% for T = 200. Fourth, focusing on DGP3 when the
moving average coefliicient is large, the performance of TRT under S4 is considerably
worse with both bootstrap and asymptotic critical values. Surprisingly, the CST
33
Three essays on specification testing in econometric models. Alicia Pérez Alonso.
Tesis doctoral de la Universidad de Alicante. Tesi doctoral de la Universitat d´Alacant. 2006.

test under S5 turns out to perform correctly with asymptotic critical values, while
becoming undersized with bootstrap ones. For both tests, this power reduction is
a small sample effect that vanishes when T = 100. On the contrary, the results
of CST and the nonparametric tests under DGP2 are quite robust to an increasing
level of autocorrelation. It is the same for DGP4 when the error process is close to
being an IGARCH.
We now briefly review the performance of the tests under the eight alternatives
of asymmetry. The results for each one of the four DGPs considered here are dis
played in Tables 6 to 9, respectively. The Monte Carlo simulations reveal that the
bootstrap performance is better or at worst equal to that of asymptotic critical val
ues for all the tests under any DGP, with the exception of RT- AS intuition would
suggest, this test is more successful with gisymptotic critical values, given the size
of the test based on bootstrap critical values is too small. When T = 50, the more
asymmetric are the distributions (A4, A5, A7 and A8), the greater are the difl er-
ences between asymptotic and bootstrap critical values (around 20%) for all the
DGPs. Conversely, when T = 200, power differences are meaningful for the most
asymmetric distributions, whereas reaching about 20% for A2 and A3. One might
have anticipated this result in view of the conservative nature of the bootstrap RT
test for distribution under the null hypothesis. Since CST does not hold its 5% level
very well with asymptotic critical values, it is difficult to include it in any asymp
totic power comparisons, since it high power might easily arise out of these inflated
levels. Note also that WSRT has disappointing power properties with asymptotic
critical values. The reason for such poor performance, when compared to bootstrap
critical values, is that the asymptotic-based empirical size of this test is extremely
conservative (bearing in mind that the under-size in the WSRT test computed with
residuals is attributable to the use of critical values for the corresponding WSRT
test computed with errors). The distributions for which this test is effective appear
ing to be rather small. When T = 200, it has enough power to reject A4, A5, A7
and A8 distributions. The range is reduced to A7 and A8 for T = 100. Therefore,
unless stated otherwise, all power comparisons between tests reported hereafter are
34
Three essays on specification testing in econometric models. Alicia Pérez Alonso.
Tesis doctoral de la Universidad de Alicante. Tesi doctoral de la Universitat d´Alacant. 2006.
based on bootstrap critical values, which are more reliable.
Turning attention to comparisons between DGPs, results seem not to be affected
by the DGP where the data come from. There are two exceptions to this rule in
the case of DGP4, for which the bootstrap-based empirical power of WSRT and
iiy.tests undergoes a signiñcant reduction for most of the distributions, no matter
the sample size considered. It should be pointed out that this power distortion does
not affect comparisons between tests described below. For a fixed DGP, the results
of all the tests are quite robust across parameterizations for AR, MA and GARCH
models. On the contrary, under DGPj with A; = 4, for the sample size 50, there is
a reduction in the power of CST and RT tests with asymptotic critical values for
distributions A4, A5, A7 and A8. For CST, when the number of observations is 100,
the increase in the number of regressors does not alter the power of this test. At
least 200 observations are needed to avoid this reduction in the case of RT- We do
not observe power reductions when the number of regressors is large with bootstrap
critical values.
Non-symmetry is detected with reasonable frequencies in nearly all cases. For
a fixed distribution, power increases with T with both bootstrap and asymptotic
critical values. For a fixed T, Bai and Ng test and the nonparametric tests exhibit
monotonic power with the power of the tests increasing for increasing levels of asym
metry, except for A6, which is analyzed in depth below. For the moment-based tests,
this monotonic behaviour is interrupted in A7 and A8, being their powers lower than
in A5. This may reflect the sensitivity of these tests to the high kurtosis displayed
by these distributions. The alternative of non-symmetry is detected with the lowest
probability in the case Al, as we would expected given this distribution is rather
close to symmetry. When T = 50, the WSRT test is the only one with power above
the nominal level under Al. This scenario improves for T = 200, with only RT and
TRT having power around 5%. Distribution A6 is introduced to show the sensitivity
analysis of the power to the kurtosis of the underlying distribution by comparing
the behaviour of each particular test under A6 against alternative A5, which has the
35
Three essays on specification testing in econometric models. Alicia Pérez Alonso.
Tesis doctoral de la Universidad de Alicante. Tesi doctoral de la Universitat d´Alacant. 2006.
same asymmetry as A6 but a lower level of kurtosis^. From the empirical results,
we can assert that RT test is the most affected by the kurtosis of the underlying
distribution. For example, non-symmetry under A5 is more than 8 times as likely
to detect as under A6 by RT test, when T = 50 and we consider DGPi with 1 re-
gressor. The number of times increases to 15 for T = 200. For the remaining tests,
the differences in power between these two distributions decrease as T increases. In
particular, when T = 50, the power of CST under A5 is approximately 5.5 times
the power of A6, while this number reduces to 1.5 for T = 200. Moment-based tests
have a similar behaviour to Bai and Ng test. Although also sensitive, WSRT and
TRT show lower differences than CST- It is noteworthy that A6 only outperforms,
in terms of power, Al.
Overall, the WSRT test clearly dominates the others on power for all the DGPs,
being the differences in performance more remarkable when T < 100. It is followed
by the CST test for DGPa to DGP4. Under DGPi, CST and S^^ statistics are the
best performing competitors. Furthermore, these tests have complementary power,
since Sj! performs better than CST for distributions A2 and A3, while CST appears
to be more preferable for A7 and A8, which are thick-tailed distributions. For the
remaining distributions, the power of both tests is comparable. The TRT test on the
other hand, which has good size properties for all the DGPs, has disappointingly
low power, i.e, less than 50% even for AS with T = 200. It's worth noting that
the bootstrap power of RT is not affected by the same erratic behaviour of the size.
Its power increases substantially with T, although it remains low even for T = 200
when data come from Al, A2, A3 or A6. In fact, under these distributions RT is
slightly dominated by the TRT test. Turning to the properties of moment-based
tests in DGPi, we may see that S^: is more competitive in power than ST in all
cases, especially when the sample size is moderate to large (T = 100,200), which
corresponds with our intuition.
To summarize, the following conclusions emerge when size and power perfor-
^To establisli comparisons with A6, it would be also possible to use distribution A4, which has the same levels of asymmetry and kurtosis as A5.
36
Three essays on specification testing in econometric models. Alicia Pérez Alonso.
Tesis doctoral de la Universidad de Alicante. Tesi doctoral de la Universitat d´Alacant. 2006.

manee are jointly considered. First, the simulations provide a strong case for the
use of bootstrap critical values, especially in sample sizes as small as 50. The Runs
test is the only one for which asymptotic-based critical values outperform bootstrap
ones. For this test, the use of bootstrap critical values provides additional protection
of the 5% level, but at a nontrivial cost in terms of power. Second, S' dominates
S^, since both moment-based tests have similar size properties, but a joint test of
the third and fifth moments is more competitive in power. The obvious simplicity
of this test and its robustness to the number of regressors in the model make it use
attractive despite of its sensitivity to thick-tailed distributions. Third, considering
the Monte Carlo results and the fact that WSRT is easy to calculate, we recommend
it over any of the competitors included in this study, being aware of the fact that its
asymptotic distribution when replacing regression errors by residuals is unknown.
The level of protection of the nominal level is higher with CST, but at a no minor
reduction in power, especially for distributions with low skewness. Finally, note that
the size and power advantages held by WSRT using bootstrap critical values are
limited to the specific class of null and alternative distributions considered in this
study.
1.6 Conclusions
This paper investigates the finite sample properties of the Bai and Ng test commonly
employed to detect conditional symmetry. We also explore the possibility of evalu
ating conditional symmetry by using some widely used tests for the unconditional
symmetry of observations when the tests are applied to regression residuals. The
tests investigated included the coefficient of skewness, a joint tests of the third and
fifth moments, the Runs test, the Wilcoxon signed-rank tests and the Triples test.
The limiting distribution of the conditional tests is only provided for moment-based
tests. For this reason, the performance of a symmetric bootstrap to compute critical
values for all the tests is discussed. The proposed symmetric bootstrap is easy to
implement and is flexible enough to be adapted to a variety of nonlinear regression
37
Three essays on specification testing in econometric models. Alicia Pérez Alonso.
Tesis doctoral de la Universidad de Alicante. Tesi doctoral de la Universitat d´Alacant. 2006.

models. The potential of the methodology is illustrated using Monte Carlo simula
tion. The following general conclusions can be drawn from the results. First, the
ability of the bootstrap to overcome the problem of oversizing observed for the Bai
and Ng test when asymptotic critical values are used. Second, the size and power
properties of the tests do not appear to be affected by the data-generating process
for time series of relatively large length. Finally, the evidence from our simulations
suggests that the Wilcoxon signed-rank test dominates the others in terms os size
accuracy and power to detect non-symmetry.
38
Three essays on specification testing in econometric models. Alicia Pérez Alonso.
Tesis doctoral de la Universidad de Alicante. Tesi doctoral de la Universitat d´Alacant. 2006.
APPENDIX
Proof of Proposi t ion 1: To proceed, corresponding to FT and GT, let FT and GT
denote the empirical distributions of {«iji^i and {stUt}^^^, respectively. By
the triangular inequality,
4{ut,u¡) = dl{F^,GT) < dl{Fu,GT) + dl{GT,GT).
Under HQ, the first term converges to 0 by Lemma 8.4 in Bickel and Freedman
(1981). In order to obtain an upper bound for the second term, we consider
particular random variables UT and VT, where UT = {SÍ^Í} and VT = {stUt} ,
t = 1 T. Hence,
dliGT.GT) < E*{UT--VTf = T~^Y.i^t-ut-T~'Y.Ut? t t
Í Í Í
2 _, if,{X„e)-i,{Xj) ^ ^^^a{X,,e)~a{xJ)
t \ a{Xj) * a[Xj)
{^i{Xue) - ^x{X^,'6)f
i a{Xt,eY
t a{Xt,9y t
For the first term on the right hand side (r.h.s.), we make use of the lower
bound for o'{-,-) and a Taylor expansion for the numerator. By adding and
subtracting terms, it is bounded by
2
4(70'T-1E {di^{Xt, e)/de)\e -e) + o,(i)
Op{T-^) + Op(l) = Op(l) as r -> oo,
39
Three essays on specification testing in econometric models. Alicia Pérez Alonso.
Tesis doctoral de la Universidad de Alicante. Tesi doctoral de la Universitat d´Alacant. 2006.

which is obtained applying assumptions B4-B5.
Exactly along the same line, for the second term on the r.h.s,
Í a{Xt,6y t
X (T-^/^E y,^{a{X^,9)-a{X„9)f
t a{Xt,ey
Under assumption B3, by the Central Limit Theorem,
T-'/'Zu't=0,{l).
The remainder is treated as follows,
^_i/2 ^ {a{X^,9) a{Xt,0)f^ ^^,^_, ^ ^^^^^^^ e)/d9yVf0 -9) + 0^(1) i a{Xt,9y t
which is of order Op(l).
By the law of large numbers
{T-'Eutf = o,{l),
which completes the proof of Proposition 1.
Proof of Proposition 2: By the definition of TT and T ^
E* Y, - Y; E*\fi{Xt,9)-fx{X:,9)
+ {a{X,, 9) - a{X:,0))u: + a{Xt, 9){u^ - u¡]
< E
+E
l,{Xt,9)--li{X:,9) + E* i,{x:,9)-f,{x;,9)
a{Xt,9)-a{X:,9) \u¡\ + E* a{X:,9)~a{X:,9) u.
+E*a{Xt,9)\{et~u:)\.
Following the same reasoning as in the proof of Proposition 1, the second and
the fourth term converge to zero in probability. For the first term, we have
from B6
E* fi{X,,9)-ii{X:,9) <L,E* Xt ~ x;
40
Three essays on specification testing in econometric models. Alicia Pérez Alonso.
Tesis doctoral de la Universidad de Alicante. Tesi doctoral de la Universitat d´Alacant. 2006.

Exactly along the same lines we obtain
E* a{Xue)-a{X:,e) \u;\<E*\ul\L„E* Xt-X¡
Finally, by Proposition 1,
E*a{Xt, 9) \Í6t - u¡)\ = E*a{Xt, 9)E* \{e, - w*)| = Op(l).
Thus,
E* Yt - Y: <{L^ + E*\ul\L,)E* Xt-X; +Op(l).
Under Bl, we use the following approximation to the NED process Xt by the
stationary process Xi''. That is,
;(m; (m)N Xt=xr + {Xt - xr) = xr+VT,. n* r^('^)\2 (m)
(1.2)
M-.2 where E*{r]flY = £{77^/1X7}^ = 0{v2{m)) asm ^00. Note that E*{rj'-^¡}
will never increase as m —> 00. Thus, by (B8)
Letting £i = 0 for í < 0, we have from (1.2) that for a given t
(1.3)
E* Xt- ~x: < E*
< {E*
Xt-
Xt
-xP -xP
+ E* 2 ,
Nl/2
X, (T)
x:
+E* | |*xr(£i , et-i, -,£1) - ^ x , r « , «i-i, •••> «í
< 0 ( v ' ^ ; ¡ M ) + E* mxAx)/dx\\ \\et - u*t\\ = Op(l),
where the second inequality follows by the Liapounov's inequality, and the last
inequality follows from (1.3), (B7) and Proposition 1. •
41
Three essays on specification testing in econometric models. Alicia Pérez Alonso.
Tesis doctoral de la Universidad de Alicante. Tesi doctoral de la Universitat d´Alacant. 2006.

REFERENCES
Azzalini, A. and Bowman, A., 1993. On the use of nonparametric regression for
checking linear relationships. Journal of the Royal Statistical Society, Series B 55
549-559.
Bai, J. and Ng, S., 2001. A consistent test for conditional symmetry in time series
models. Journal of Econometrics, 103(1-2) 225-258.
Belaire-Franch, J. and Confieras, D., 2002. A Pearson's test for symmetry with an
application to the Spanish business cycle. Spanish Economic Review, 4(3) 221-238.
Bickel, P.J. and Freedman, D.A., 1981. Some Asymptotic theory for the Bootstrap.
The Annals of Statistics, 9(6) 1196-1217.
Bickel, P.J., 1982. The 1980 Wald Memorial Lecures: On Adaptive Estimation. The
Annals of Statistics, 10(3) 647-671.
Bollerslev, T., 1986. Generalized Autoregressive Conditional Heteroskedasticity.
Journal of Econometrics, 31(3) 307-327.
Bollerslev, T. 1987. A Conditionally Heteroskedastic Time Series Model for Specu
lative Prices and Rates of Return. The Review of Economics and Statistics, 69(3)
542-547.
Brunner, A.D., 1992. Conditional Asymmetries in Real GNP: A Seminonparametric
Approach. Journal of Business & Economic Statistics, 10(1) 65-72.
Davidson, R. and Flachaire, E., 2001. The Wild Bootstrap, Tamed at last. Queen's
Institute for Economic Research Working Paper No. 1000.
DeLong; J.B and Summers, L.H., 1986. Are Business Cycles Symmetrical? In
Robert Gordon (ed.), American Business Cycles: Continuity and Change. National
Bureau of Economic Research and University of Chicago Press, Chicago, 166-179.
Efron, B. and Tibshirani, R.J., 1993. An Introduction to the Bootstrap. Chapman
and Hall, London.
42
Three essays on specification testing in econometric models. Alicia Pérez Alonso.
Tesis doctoral de la Universidad de Alicante. Tesi doctoral de la Universitat d´Alacant. 2006.

Engle, R., 1982. Autoregressive Conditional Heteroscedasticity with Estimates of
the Variance of United Kingdom Inflation. Econometrica, 50(4) 987-1007.
Fiorentini, G., Calzolari, G. and Panattoni, L., 1996. Analytic Derivatives and the
Computation of Garch Estimates. Journal of Applied Econometrics, 11(4) 399-417.
Franses, P.H. and Van Dijk, D., 2000. Non-Linear Time Series Models in Empirical
Finance. Cambridge University Press, Cambridge.
Gallant, A.R. and White, H., 1988. A unified theory of estimation and inference for
nonlinear dynamic models. Basil Blackwell. New York.
Gibbons, J.D. and Chakraborti, S., 1992. Nonparametric Statistical inference. Mer-
cel Dekker, Inc., 3rd edition.
Gupta, M. K-, 1967. An Asymptotically Nonparametric Test of Symmetry. Annals
of Mathematical Statistics, 38(3) 849-66.
Hall, P., 1992. The Bootstrap and Edgeworth Expansion. Springer Series in Statis
tics. New York: Springer Verlag.
Hall, P. and Wilson, S.R., 1991. Two Guidelines for Bootstrap Hypothesis Testing.
Biometrics, 47(2), 757-762.
Hansen, B.E., 1991. GARCH(1,1) processes are near epoch dependent. Economics
Letters, 36(2), 181-186.
Hodgson, D.J., 1998. Adaptive Estimation of Error Correction Models. Econometric
Theory, 14(1) 44-69.
Hussey, R., 1992. Nonparametric evidence on asymmetry in business cycles using
aggregate employment time series. Journal of Econometrics, 51(2) 217-231.
Kreiss, J.P., 1987. On Adaptive Estimation in Stationary Arma Processes. The
Annals of Statistics, 15(1) 112-133.
Kulasekera, K.B. and Wang, J., 2001. A test of equality of regression functions using
Gateaux scores. Australian and New Zealand Journal of Statistics, 43(1) 89-100.
43
Three essays on specification testing in econometric models. Alicia Pérez Alonso.
Tesis doctoral de la Universidad de Alicante. Tesi doctoral de la Universitat d´Alacant. 2006.

McWilliams, T.P., 1990. A Distribution-free test for Symmetry based on a Runs
Statistic. Journal of the American Statistical Association, 85(12) 1130-1133.
Newey, W.K., 1988. Adaptive Estimation of Regression Models via Moment Re
strictions. Journal of Econometrics, 38(3) 301-339.
Newey, W.K. and Steigerwald, D.G., 1997. Asymptotic Bias for Quasi-Maximum-
Likelihood Estimators in Conditional Heteroskedasticity Models. Econometrica,
65(3) 587-599.
Powel, J.L., 1994. Estimation of semiparametric models. In R.F. Engle and D.L.
MacFadden (eds), Handbook of Econometrics IV. Elseviere Science, Amsterdam,
2443-2521.
Ramberg, J.S. and Schmeiser, B.W., 1974. An Approximate Method for Generating
Asymmetric Random Variables. Communications of the ACM 17(2).
Randies, R.H., Flinger, M.A., Policello, G.E. and Wolfe, D.A., 1980. An Asymp
totically Distribution-Free Test for Symmetry versus Asymmetry. Journal of The
American Statistical Association, 75(3) 168-172.
Verbrugge, R.J., 1997. Investigating Cyclical Asymmetries. Studies in Nonlinear
Dynamics and Econometrics, 2(1) 15-22.
Wooldridge, J.M. and White, H., 1988. Some invariance principles and central limit
theorems for dependent heterogeneous processes. Econometric Theory, 4(2), 210-
230.
44
Three essays on specification testing in econometric models. Alicia Pérez Alonso.
Tesis doctoral de la Universidad de Alicante. Tesi doctoral de la Universitat d´Alacant. 2006.

TABLES
Table 1: Distributions used in the Monte Carlo study
Distribution Al A2 A3 A4 V3 V4 Symmetric distributions
SI S2 S3 S4 S5 S6
0 0
0 0
N{0,1) 0.197454 0.134915
-1 -0.080000 h
-0.397912 -0.160000 -1 -0.240000
0.134915 -0.080000
-0.160000 -0.240000
0 0 0 0 0 0
3.0 3.0 6.0 9.0 11.6 126.0
Asymmetric distributions Al A2 A3 A4 A5 A6 A7 A8
-0.116734 3.586508
0
-0.351663 -0.130000 0.043060 0.025213
-1 -0.007500
-0.160000 0.094029 -0.030000
exponential: —ln{e), e ~ U{0,1)
0 0 0
xi -1 -0.100000 -1 -0.001000 -1 -0.000100
-0.180000 -0.130000 -0.170000
0.8 0.9 1.5 2.0 2.0 2.0 3.16 3.88
11.4 4.2 7.5 9.0 9.0 21.2 23.8 40.7
45
Three essays on specification testing in econometric models. Alicia Pérez Alonso.
Tesis doctoral de la Universidad de Alicante. Tesi doctoral de la Universitat d´Alacant. 2006.

Ü Q
CO
CO
1 CD
CD tsl
o • i-H
M • I—I
a
b +
+ o
OCX.
II
t-H
PH Ü Q ~S£
i~i
0:1 CO
Co
O
CO f-l
;co
!CO
o
CO
o
cs
in
CO
o o o
LO
T—1
lO CO -vh
o lO CM
o CO ^
o CO
lO I>-
c
lO
LO
o CO ^
o lO
o
LO
o o ^
LO
CO
o o o
o CO I—1
LO
'
o CO OO
o OÍ CO
o I—1
LO CO (M
LO CO • *
LO
o ^
o 1—1
I—1
CO
LO
o LO
o
^
o
^
o o o
LO I—1
I—1
o
^
o T—t
^
o
CO
LO 1—1
o
CO
o CN LO
LO CD -*
o
o 00 CO
o CO OQ
o
CO
o o o
LO
CQ
o 03 '
o CM CO
o o ^
o
CO
CM
o 00 '
o o '
o LO
o
CO
o
CM
LO
CO
o o o
LO 1 ^ ^H
LO 00
^
o o CM
o
CM
o CO LO
o 1—1
CO
LO 05
"*
o LO '
o o 1—1
CM CO
o 05 00
o 00 CM
o CD ^
o o o
o
0
o CO
o
^
o
-xt<
in CD
lO
CO
ISO
o 1—1 lO
o o CM
o
CO
o
1—1
o
^
o o o
o CM CM
lO 00 xt*
o
CO
o 00 -
o
CO
LO 00 1—1
LO CO CO
o LO CO
o LO
o 00 CO
o CM 1—1
o o LO
o o o
o
1—1
LO CM
-
o 00 CM
o LO CO
o o
LO CM CM
o 1~-
CO
o OO
o o r-t
CO CO
o CM ^
o CM CM
LO CM LO
o o o
o o rH
o LO -=*
o 00 -*
o CD LO
1—1
o CO CM
ISO
CO
LO LO 00
o o CM
o CM CO
o CM 1—1
o 1—1
^
o o o
o CM CM
o CD ^
o CO CO
o
LO
LO CM CO
o 05 1 — i
LO LO CM
o CO CM
o LO
o CM CD
o CM 00
o
CO
o o o
o 00 1—1
o CO "xt*
o LO xi<
o CM LO
LO CO CO
LO
o CM
iSO 00 CM
O
CM
O
o
CO
o ISO
LO
o 1—1
^
o LO '
o o o
o CM 1—1
o CO LO
o
oo
o
'
o 03 CO
o 1—1
CM
LO 1—1
OO
LO CD CM
O o CM
o CM CO
o
1—1
lO 1—1
LO
LO 1—1
o
o 1—1
CO
lO 00 LO
o o ^
o o CD
o 1—1
CO
o OO I—1
o CM CO
O CD CO
O LO
o 00 OO
o CM ^H
LO
Xh
LO O o
o
I—1
o CO •
o OO CO
o 1—1
LO
o CO 00
o 03 1—1
cz> 03 CM
o CM OO
o o 1—1
LO CO
o LO "
o 1—(
CM
LO 1 — i
LO
O CM O
LO 00 o
LO LO • ^
o
"
o
t-
lO
o -*
o 1—1 CM
o o OO
LO CD CM
O o CM
o CM CO
o
T-l
o 00 LO
o 00 o
LO CO CM
ISO CO
LO
o 00 ^
o LO 00
CM
O OO 1 — i
LO CO CM
LO OO CO
o LO
o LO CD O CO ^
O ÍSO CM 1-1 1—1 CM
LO LO CO CO LO LO
o o o 00 1—( 1—1
LO o 00 CM 1—1 I—1
LO LO
o o LO ÍC)
o o o CM LO LO
°9 d 05 1—i
o o OO 00 CO 00
o LO t- CD 1 — < 1—1
LO o ^ LO CM CM
O o o ^ CO CM
o o o o 1—1 CM
CO CO
O)
03
a o
X) 03 (/3
Ctí 03
Si
1 O
03
o o
XI a o
(D in 03
<o N
46
Three essays on specification testing in econometric models. Alicia Pérez Alonso.
Tesis doctoral de la Universidad de Alicante. Tesi doctoral de la Universitat d´Alacant. 2006.

X5
o ü
Ü Q
a CO
CO
1 <X>
^-^
no
O CD ISJ
in
IN
b
•+-Í
+ o
Ü Q
^ 1
^ 1
(Co
^
-s¿
o o l O 0 0 ^ 0 3
- ^ l O ^
o o o ^O C^ ':o
o o o O i l > - CO
o í CO ^
o o o o o o o o o
o in o t- t~- o X h CO ^
o o o l O T-H - * LO -xfl ' ^
o o o I—I CO >—I CO CO ^
o o o 0 3 o CO
CÓ CO 0 0
l O o x f o
^ Xt< LO
o o o 0 3 0 3 i-H
o o o 1—I T—t 0 0 • ^ " ^ " ^
LO o CO ^
CO CO - ^
o o o o o LO 1—I C<l
CO
o o o • ^ 0 3 O )
- ^ ' ^ l Ó
o o o o LO CD
CO CO - ^
LO LO LO CO 0 0 -xt;
OQ c ó ^
o o o o o o o o o
o o o 0 0 CQ 0 5 co ^ - *
LO LO o CD LO 0 0
• ^ " ^ " ^
o o o CO " ^ LO CO CO ^
o o o I—I I—I LO •r)i c6 c6
LO LO LO ' ^ cT) . - ;
CO LO LO
LO LO o t ^ CO b -
^ C ^ CO
o LO LO o CO o 'vl^ ^ ' LO
o LO o O ) I—I o
C<1 - * LO
o o o o o LO >—I (M
CO
o o LO ^ CO CO
'^ ^ '^
o o o Xh CSj ^
CN o i CO
o LO o l O CO o o
'x í LO - ^
o o o o o o CD o o
o o o cQ -ÑT t ^
^ - * CO
o o LO 0 3 t ^ o
^ '^ '^
o o o I—I CO 1 ^ LO - * " *
o 0 0
o o 1-H CO
LO Xt* LO
l O o LO 0 0 OQ LO
CÓ -x)< - ^
o o LO o Oa r-H ofl c a CO
o o o T—I 0 0 CO
-^ oó -*
ío in o CO t - o
CO CO ^
o o o o o LO ^H t M
CO
CO
o o o CM 0 0 ^
LO LO LO
o o o ^ CO cq oí oá có
o o o o
o b-' ^ l O ^
o LO LO o o cr> o o o
LO LO LO 0:1 LO i—l
CO ^ ^
o LO o LO •—I t - -- ^ LO ' í l
0 0 0 CO CJ3 1 0 CO CO ^
0 0 0
0 3 i q o ^ CO 1 0
o 1 0 o c q 0 0 CD
CO c ó - ^
1 0 o LO LO 1—I ^ ~
rM oa oq
1 0 LO o I—I 0 3 ^
CO oí có
o LO 1 0 0 0 0 0 o
CM O í CO
o o 0 0 0 LO I—I (M
C/D
0 0 0
CO 0 > i-H
^ ^ LO
0 0 0 ^ CM C3i
o4 oí o4
10 o o CO CD t -L 6 10 ^
0 0 0
I—I >—I o
o o CD
10 10 o ^ o t-CO - ^ - *
o 1 0 LO T—I CO CM
^ - * LO
0 0 0 CO 0 3 LO LO CO LO
0 0 0
CO 0 0 0 0
CO ^ CD
LO o
CO -Ñt< ' ^
o 1 0 LO 0 3 C^ b -
CM
0 0 0 ^ T—I L O
CÓ c ó CO
1 0 LO 1 0 r—I LO 0 0
CO CO CM
o o 0 0 0 LO T—( CM
1 0 CO
o LO o 0 0 LO C33
• ^ " ^ " ^
o 10 o -^ -*_ o CM o í c ó
0 0 0
LO I—I C35
1 ^ CD - ^
1 0 1 0 o - ^ i>- 0 0 o CD CD
o LO LO o 0 0 :—I
- ^ CO -xP
1 0 o 1 0 CD CD 0 3
xt* ^ " ^
0 0 0 1—1 0 0 >—I
CD ^ 1 0
0 0 0 CD 0 0 - ^
(X) CD 0 3
0 0 0 ^ CO 0 3
c6 ñ c6
o o 10 0 3 0 3 CM
o o LO !-H 0 3 0 3
có oí oí
LO LO LO
o b~ co C O CM CM
o o 0 0 0 L O •—I CM
CD CO
cu .Tí
a
<D
a 3 a O)
^ ^
-n (i> c/} m
X^ (1) N Cfi
1 ,
crt
^ O,
a <\>
> + J id (\¡
^ 03 0)
a (1)
^ f i '-! a -*-^ u
cd C1)
j:l H
(!) + J 0 Z
P
> rrt 0
• i ^
M (1
ífl M
+ J
0 0
J-¡
a u
T3 cu crt
X^ OJ N
ce 1—1
0
í-i
"-^ >-ii
0}
47
Three essays on specification testing in econometric models. Alicia Pérez Alonso.
Tesis doctoral de la Universidad de Alicante. Tesi doctoral de la Universitat d´Alacant. 2006.

PH Ü Q (-1
1
o <n N
• I — I
CO
a
CO
oo o
II C5.
l O
<2.
+ I
O Q
h Qi h
0
O
f-1
O
o
^
o
t — 1
(;0
CSl
o o o
CO
oo '
o
CM
O 1> CO
o
^
o (M (M
O
<M
O O
o
LO
CQ
lO
'
o 00 CM
o C73
CO
O
LO
LO es ^
o o es
o '
o o o
o
i-H
O 00
^
o 05 es
o 00 CM
O to -
o
CM
O
CO
O
o o
LO en 1—1
LO CO lO
o
CM
O
CM
O
o I — 1
1 — 1
CO
o CM LO
LO CM CM
O
LO
o o o
lO
o
LO
CO
o
CO
o -* CO
LO
o LO
o CO es
LO I — 1
\ri
o o o
LO 00 o
o LO ^
o CO CO
o o CO
o o es
o CM -
o o CM
o o CO
o CD o
o es CM
o CO ^
o 1—1
-xt<
o o CD
o
^
o o CM
o I — 1
CO
o o o
LO
o es
o o -xt<
o LO CO
o I — 1
LO
o LO
o LO ^
o o es
CO
o o o
LO
t — 1
o lO '
o I — 1
• ^
o 03 CO
o CO ^
o 03 ^H
o LO CO
o o o
o CO I—(
o es ^
o Oi CO
o CO xf
o o T — 1
CM CO
LO es \n
o CO CM
^
o o o
o T-H
1—1
o
in
o
-
o 1^ CO
o es LO
o OÍ es
o
^
o o o
LO CM r-l
o LO -
o OÍ CO
o CO CO
o o CM
o CO ^
o 00 i-H
LO CM • *
LO
o o
o
CM
LO LO lO
o 00 CO
o o CO
o es LO
o CO 1—1
LO CO ^
LO
o o
CM
o CO -xt<
o 1—1
-Ñf
C5
LO
o LO
o CO ^
o o CM
LO I — 1
-*
o o o
LO
1—1
o 00 '
o o ^
o oo • ^
o 00 ^
T — 1
LO CM
'
o o o
o CO 1 — í
LO CO -*
o LO -*
o LO LO
o o 1—1
CO CO
o o LO
o 1 — <
CM
o
^
o o o
LO
1—1
LO 00
'
o o "*
o LO ^
o 1 — i
lO
1 — t
es
o
^
o o o
o o i—H
LO LO
^
o OÍ CO
o
^
CO
o CO CO
o o es
o 00 CO
o o
o CM CM
LO LO
'
o
co
o
LO
o -* -*
o 00 es
LO
CO
LO
o o
LO
1—1
o CO CO
o CO CO
o CO \n
LO
o CM '
o
es
\r:s CM -*
o o o
LO 00 1—1
LO
-=*
o
co
o CO -*
o 1—1
"
o CO CM
LO
o ^
o o o
o o CM
LO 1—1
LO
o 1—1
CO
o 1—1
^
o o 1—1
CO
o LO ^
o o CO
LO LO ^
LO
o o
o 00 o
o b-
'
o CM "*
o
'
o 00 ^
o CM CO
o
^
LO
o o
o o 1—1
LO
o LO
o o ^
o LO • ^
o o CM
o CM ^
o o es
o o LO
o CO o
o CM es
LO 05 -*
o o -
o
CO
o o LO
o CO 1—1
LO CJl
^
CM
o
LO CM CO
o 00 • ^
o es -*
o
t^
o LO
o 00 ^
o LO 1—1
o LO ^
LO CO
o
LO 00 1—1
lO
LO
o
^
o 1—1
CO
es XJH
o CM 1—1
o CO • ^
o CM o
o o es
o CO ^
o CM LO
o LO 1 -
o o I — 1
LO CO
o CO ^
o o es
o oo -
o CO o
LO
1—1
o CO ^
o
-
o o> LO
LO
''í
03 OÍ 1—H
o oo ^
o CM o
o CM 1—1
o C33 • ^
o CO ^
o
CO
o o CM
o CO '
o o CM
o 1 — 4
CO
LO 03 o
o CO 1—1
o es
-*
o I---
•
o 00 05
o 00 ^
o
1—1
o
lO
LO
o 1 — I
LO CM CM
LO 1—1
LO
o CO LO
LO
o 1—1
o LO
o o
^ ^
o o oo o rH CM
LO LO C73 CO
^ ^
o LO LO ^ 1—1 1—1
LO o o CM CO 1—1
LO o CO 00
' ^
o o CO "^ ' ^
CM 00
o c> 1—1 i-H
CM CD CO LO •^ xl<
LO t-CO OJ 1—1 1—1
LO o 00 CO
- -*
LO 00 I — i 1 — 1
o o CM o 1—1 1—1
LO o CM CO LO "*
o o 05 OÍ ^ '
00 CO 1—5 c¿ 1—í 1 — 1
o o o o 1—1 CM
CO CO
p.
a cu
a 03
S
a
1
tl) o
Ü c3 01
a ^ (U
X¡
a 3 s +^
ctí
H Cl) +J
u
cp 0
CO
> 'cé Ü + J
CJ
p. rrt f-(
m O O XJ
o X!
^ N
Three essays on specification testing in econometric models. Alicia Pérez Alonso.
Tesis doctoral de la Universidad de Alicante. Tesi doctoral de la Universitat d´Alacant. 2006.

Pi o Q
in
1
CD N
.1—i
o •I—I
• I—I
f-1
Co oo O
II
Co
o
Co
o
• ^
b
+
CO
Ü Q
Co O
" o oi o ^ l O
0 0 o L O I>-
<M Cfl
b - C O
r-l e g
^ O CM I—1
O o
CM Ofl
0 > CM
^ ^
1 ^ CM o o C O
CM C O
I—1 CM CM CM
l O C O
CM O ^ CM
io m
^ o I;D 0 0
CM CM
•X) o t—1 C O
C O C O
o o o o o o
•^ o C O CM
CM CM
CM O i O o o
xl< ^
o o
CO CM
O O CM C O
^ C M
CD O O L O .—1
T—1
in
l O
'^
o CM
C O
l O C O
^
o o o
l O C O
I—1
l O C O
'^
o
C O
o o C O
o C 5
-*
o
C O
o oo
-*
o o o
o C M
T-H
0 0
"^
o L O
C O
o I—1
C O
o o C M
0 0 CM
-xt*
o o C O
L O 0 0
!—1
1 ^ C O
o
C O
CM
C O
oo xt*
CM
C O
C O L O
^
I—i CM
^
CM
1-H
C M
o o o
CM O
C O
0 0 C M
L O
O CM
C O
1—1
^
o L O
o
^
o
CM
CM O Í
CM
O
O
T—1 0 5
I—1
C O 0 5
C O
L O L O
C O
L O C O
C O
C O L O
^
o
CM
o 0 0
C O
o o o
L O
I—1
ir:: o ^
o o -*
o
• ^
o o 1—1
CM
ce
o
^
o o C O
L O CM
^
o o o
o C O
1-H
o
L O
T-H C O
C O
T-H
o C O
o C O
xl<
o CM
C O
o 1—1
^
o o o
o CM T-H
L O
oo 'xt*
o o> C O
o 0 0
C O
o o CM
-*
C O T-H
CM
C O ir:>
CM
C O CM
o
i-H
o C O
C O
L O
C O
CM
1 ^ L O
^
T-H CM
^
o CM
CM
C O 0 5
C O
L O
o o
o
T-H
C O C O
C O
I-H C O
C O
T-H
-*
o L O
o T 1
^
o C O
CM
C O
o o o
T-H L O
CM
CM 0 0
^
CM
o '
CM
^
o o '
L O
CM
l O T-H
^
o o o
L O
o CM
L O C O
'^
o o ^
T-H L O
^
o C D T-H
C O
L O
^
C O
CM
L O
o ^
o o o
o 0 0
T-H
o ir:i L O
T-H
-
T-H
o C O
o
^
L O O Í
CM
L O
m ^
o o o
o T-H
^ H
o T-H
xt<
o L O
'^
o 0 2
^
o, o C M
C O
C O
0 0
o T-H
C O
CM
C O L O
o
^ ^ CM
C O
-
1-H
o -
C O
T-H 0 0
L O
T-H C O
CM
T-H ti
co
L O
o o
T-H 0 0
CM
T-H C O
L O
CM
oo C O
C O
L O
L O
o CM
^
o T-H
CM
C O 0 0
C O
o CM
o
1 ^ CM
CM
C O T-H
^
C O L O
•
L O
o
L O
o I-H
C O
o CM
^
o T-H
o
o I-H
CM
C D L O
-
o
C O
o L O
'
o o I-H
o o L O
o
CM
o
^
o o o
L O CM
1-H
o
L O
o
C O
o
-*
o
L O
o o C O
o o L O
L O
o o
o CJ5
o
ir:> C O
'^
o
-^
o CM
ifi
o o C M
o •vt<
o
T-H
C O
CM
CM L O
o
L O
CM
C O L O
^
T-H
oo I—t
C O C O
^
T-H
^
o Q O
I—1
T-H
^
L O 1—1
o
T-H
o CM
I-H
XJ*
CM
oo C O
C O
C O
CD L O
L O C O
^
o o CM
0 0 li~
C O
o C O
o
i-H i-H
CM
0 0 O Í
• ^
C O C O
-*
0 0
C D
o C O
^
o CT¡ ^H
ir:>
•Ñt*
o CM
o
o
T-H
o CM
-*
o T-H
^
o
C O
o o T-H
L O C O
o
xt<
o o CM
L O T-H
L O
L O CM
o
L O T-H
i-H
o C O
^
o
L O
o 0 0
C O
o L O
^
o CM
CM
o C O
^
o CM
o
L O 0 0
T-H
o
^
o T-H
m
o 1 ^
C D
o o C M
0 0 C O
C O
oo
T-H
0 0 0 0
'
0 0
T-H
o T-H
C O
o C O
C O
C O CT)
C O
C O
0 0
o
^
o 0 0
T-H
CM 0 3
^
T-H
I-H
C O
CM
^H
L O
I-H L O
'
1—1
I—1
o L O
o o o 05 "* '
o o
T-H CM
0 0 C O L O t -
co ^
C O o C O T-H
o T-l
C O o L O C O
T-H i-H
0 5 T-H i-H T-H
- ^ L O
C O t-H C D 0 0
^ ^
i o 0 0 I-; 0 5 T-H
o o CM 1 ^
-* -
o o o O Í
CM T-H
C O o 0> Oi C O ^
o L O t - O Í
^ o
ir:i LO C O o
1—[ 1—1
^ H L O C72 O Í
C O ^
T-H o CM CM
^ L O
CM i-H
R T4 C71 T-H
o o o o T-H CNJ
C O C O
>>
a OJ
ce
, (1)
u
(ij
a í-í (p
,_o « a
cíU
H m + j
CJ
3
crt
> CO
o +J
CJ
p. ni ÍH 4J CO
o o XI
O
Xí
ce CO
,i-!
N
Three essays on specification testing in econometric models. Alicia Pérez Alonso.
Tesis doctoral de la Universidad de Alicante. Tesi doctoral de la Universitat d´Alacant. 2006.

^ PH
Ü Q n
^ A
r/l + J [ / I
E 'o) > y j
i_J
i ^ ^ !-l-t O OJ N
( y j
Co CJ
• 1—I
Ü w kfl
0)
^ S
<M
I—I
1 (N-w
Q ^
^
& b
+ Q ^
>< b
Q
+ O
(i
II Q i
H-i
>< b
+J
Í 5
Q i
•+-Í
>< ^ ' b
+ C--
II >;'
•4' O i
o p
io" o o 0 3
o c í
<M
c o"
o
a
l-H
Q^ b-H
FH
Ü ; CO
^
Di
h i
Co Q
'co rS l O
cJ CQ
II (^3
a ^
c o
F-, Di b
Di CO
^
F-H
Di
F-, ^ C
o o o - ^ c^ o ^ l O LO
o o o cq 00 o oí c4 co
o o
O O O
o o o o o o
o o l O LO r - 0 0
Cí <M co
LO o i n LO c o
LO - ^ LO
o o o oq co c^ co <4 có
o o o LO OO
LO 0 5 OQ
O O O 0 0 T—I 0 5
^ LO - *
o o o OO ' D o (N o i co
O o o 1 ^ ^ co 00
o o o o o o o o o
LO LO LO 0 0 LO 0 3
o o LO co LO ca " ^ ' ^ LO
o o o o 0 3 C í
co csi có
o o o O Í 'xh >-)
-^ co có
o o o o o L O ^ H C a
co
o o o o 0 0 r-H
LO Xl< LO
o o o o c^ <a có có co
LO LO t o CD t ^ ^
LO 0 0 t—I
o o o o o o a d d
LO o o T-H ^ t - -
es c<i co
o o o o I—I LO
' ^ - ^ LO
o o o o - ^ 00 • ^ • ^ " ^
o o o l > - ^ CD LO ^ - ^
o o o o 0 5 CNi
LO ^ LO
o o o " ^ . - ( "xt*
co co có
o LO LO Oi ^ co Xf b - 0 0
o o o o o o d d d
o LO o 0 0 CD ' ^
CVl
LO o o 1>^ 0 3 t ^ ^ co - *
o o o o
co co ' í i
o o o ^ oq t ~ íó có có
o o o o o L O ^ H ( M
CM CO
o o o oq -^ o ' ^ LO LO
o LO o o - * co c<i csj c4
CD o LO 0 0 CD c o
c o l O CD
o o o C O O i ^ ^
o o o
LO LO o c o 0 3 >—I
( M CN| CM
LO o LO CD >—I xj<
• ^ L O ' ^
o o o C7> t ^ c o co c6 ^
o o o C<¡ Oí o l > ^ LO CD
o L O L O OO 1—I 1>-
Xl< L O - = *
o o o CM c o LO
CM CM C<i
o o o 0 5 t - 0 0 c o LO LO
LO o o T—I LO 1—1 C¿ CD CD
LO o o ^ LO O Í
LO o LO OO CM 1>
co - ^ - *
o o o o LO o -xt" có -^
o o o c o -* CD LO LO
o o o o o L O >—I CM
CO
an
o o LO ^ CM 0 3
LO LO ^
o o o CM o CM CM CM' có
LO o o ^ oq cq • ^ LO c o
o LO o c o LO 0 0
o o o
o o LO CM o co CM co CM
o o LO t ^ - x f -xh
^ L O - ^
o o o CM -xl^ c o có có có
o o o CD 0 3 0 0 CO LO LO
o o o CM - ^ CJ> LO LO -=#
o o LO o CM >-; CM CM c ó
LO LO LO CM co CM
CO L O CD
L O o o LO CM x t ;
CD CD CD
o o o - ^ 00 co
L O LO o T-H I ^ c o
LO ^ - ^
o o o 0 3 0 3 1—I
CM có - ^
o o o 00 o 1~~ LO LO LO
!.g o o o o
L O 1—1 CM
CO
o o o >* oq 05 • ^ ^ " ^
0 0 0 00 C73 cq 1-4 T-J CM
o 1 0 L O 1>- t - - . CM
có ^ " LO
o o LO r-H 0 3 1—1
o LO LO co LO o
LO 1 0 o tr- o !>; -x|H L O ^
0 0 0 0 3 0 3 0 0
c6 có c6
0 0 0 O í CD 0 3
oó oó oó
0 0 0 co 00 o ' ^ ' ^ LO
o o LO 0 0 o " *
0 0 0 t ^ CM 0 3
CO L O ^
L O L O 1 0 c o 1—1 r-H
LO LO o 1 0 o C73
o LO 1 0 o ^ - CM 1 0 CO 'S*
0 0 0 i - i CM CM
• ^ ^ ^
0 0 0 o q -Ñt; LO
oó l>^ có
o o 0 0 0 L O 1—1 CM
1 0 CO
0 0 0
CM o CO
Xt< L O ^
0 0 0 00 o o 1-i CM CM
o LO o CJ; ^ cq có ^ '^
0 0 0 !>- -^ cq CM -vl< co
LO o 1 0 ^ co 00
o LO LO C73 o CD
- ^ 1 0 L O
0 0 0 LO LO CM
có -=* -^
!>. t-- cq CD 1-i - ^
0 0 0 co r - LO
'^ ^ ^
0 0 0 0 0 0 3 o
0 0 0 1—I 0 0 C73
• ^ " ^ " ^
L O L O o -xfi CM c o
i-í có "xt
LO o o 1—1 0 0 o
^ o CM
o LO o ^ <^ ijr:i
^ ^ LO
0 0 0
CM 0 0 CD
'^ "^ ^
CM L O c o
o o 0 0 0 L O ^ H CM
CO CO
s 1)
a
a a CD
p.
, <1) CJ
XÍ CJ 03 <l)
g M
<v 4 J
a 0 tí
cfi CD
r t í H
Q5 + j
u ^
(1) 0 crt >
"3 0
-( CJ
D. rrl
^ 0 0
^ tí 0 ^
rO
N m
Three essays on specification testing in econometric models. Alicia Pérez Alonso.
Tesis doctoral de la Universidad de Alicante. Tesi doctoral de la Universitat d´Alacant. 2006.

Ü Q
CO
CO
1
% o
o
Cu
B
b
Q3_
+ o
II
T-H
Ü Q -s¿
CO
o
lO
r^
(^
o CO
o
O
CX)
O CM
O
o oí
o 00
o 00
o 1>
o I—1
lO
ií5 t—
-*
o
o LTD
O ai CO
CD CO
c4
CO
I—i
in
O
T—i
in
o ai
C5 I—i I—1
LO
oó
lO LO
o
c¿
o CO
CO
o o I—1
1—4
O 1—1
o
00 1—(
o CO
o
cq 1—i
o CO
lO
o
CO
LO
00
r—1
I—1
o CD
oó
LO
I—1
r—)
LO
oi
o o CM
o CM CO
o o
CO CO
o o o
o LO CO
o
00
LO r—1
LO
oí 1—1
CM CO
CM
LO
c^
CO
CO
CO
00 CO
o LO
o
o
(31
oó 1~-
o CD
CD
O
CO
CM
CM 1—1
oo
CD
CÓ
lO
CD
CO
CO
00 CO
o o 1—(
CM
<
o o OÍ
o CM LO
ai
o CO
o
o CM
oó
oo o CM
00
1—i 00
o c C7>
CM
00
CM
OO
en
CO
LO C75
O O
o 00
o CD
cq LO LO
LO CM
LO LO CO
LO
1—í 1—1
1—1
t—l
CO
o CO
o»
CO
CO
CM CO
o
Ol
co
o LO
o 1—1
o CD L O
1—i
o CO
1—í
1—1
CM 1—1
CD
CO CM
CD
LO
CD
CD 00
^
1—4
CO
lO
CO
o o 1—1
CO
iq
CM 1—1
O CM
CO
o o 1—1
CD
CD CM
iq
LO
1—1
CM
0Ó
CO
00
C3Í 05
O
O ) OÍ
lí~
CM ai
o CO 00
o o CM
cq có 1—1
o CO
oi
0 0
1—i
oo
o LO
CM
CM
cq CO
CD
CO
LO
CM
cq <3Í CO
LO
CO
CM
O CD
LO
LO LO
o LO
O
CD CM
1—1
CM
OÍ 05
oó 1—1
OÍ
LO CO
CM 00
CM
oó ai
cq oó OÍ
OÍ
CD
LO OÍ
1—1
CM 00
00
1^
o o 1—1
<
LO
ai CM
00
oi 1—4
o" o 1—1
iq
CD
OÍ
ai ai
o o 1—4
O o 1—4
o o 1—1
C31
O l CJl
CO
LO CJl
oo O l 00
o o CM
oq LO 1—4
CM 1—4
00
có 00
o Ol 1—5
Ol
00 CM
CM
LO
CD
00 1 -
ai CD
-*
CO
1—4
1—4
CO
'
lO
o LO
Ol
CM
LO
CM
1—4
ai Ol
00
1—4
a>
CD
1—4
CM"
oo
LO
oo Ol
00
oó (31
CO
CJl
CM
LO C71
CM
00
LO
CD
O CZ) 1—4
LO
<
LO
- CO
o o 1—4
CM
Ol
CM
oi Ol
o o 1 — 4
o o T—4
o o 1—4
00
CJl O l
Ol
LO Ol
Ol
o Ol
o o CN
o o LO
o CD
CÓ
co CM
LO CD 1—H
LO
có
LO
cq CO
CM r—4
O l
1—4
cq CM 1 — 4
ífí
oó
00
CO 1—4
Ol
00
o LO
o cq íÓ
o 1—4
CM
oi
LO CD
có
o
LO Ol
oó
oo
1—4
CM
1—4
1—4
CO
oo CO CM
CO
CD CM
1—4
CM
o o
1—4
CO
<
o CD
CD
o C31
CD CM 00
CD
1—4
LO 1—4
CO
LO
1—4
CO
O
o
00
CO CD
CO
lO
Ol
o LO
00
CO
o o CM
CD
CO 1—4
CM
c6 1—4
OO 00
cq CD r—4
CO
CD CO
CO
1—4
CD
oo
LO
LO
oo
Ol
CO LO
CO
LO
-xt<
oo
o 1>-
o LO
CM
oó CM
o có CM
1—4
oó Ol
CM
oi 00
oi Ol
00
cri Ol
T—4
<3Í 00
O
CO 00
t-
CD CO
O
OO LO
o o
r-4
<
CD
CO CO
oi CM
O O
00
CO Ol
00
Ol
oq C7Í O l
o 1—4
o o 1—4
CO oó Ol
C71
LO C31
-* CM 00
^
CD O CM
CQ
1—4
00
CO 1—4
C4
00
Ol
lO 1—4
00
oi CO
t—4
1—4
CO
<J3
c4 00
0Ó 00
iq
CO LO
LO
1—1
LO
o LO
o • ^
o LO
00 OJ
C3Í I^ CM CO
^ O
^ CD CM CO
b- O C31 1—4
r-4 CO
oi 00 LO Ol
cq CD b- (31 t- C71
oq Ol 1—4 ai <y> Ol
C31 O Ol 1—4
=^ O Ol o Ol 1—4
CO 1^
• " CD 00 Ol
1—4 Ol
00 CO b~ Ol
lO CO
CO b-
O ^
CO 1^ LO CO
o o o o 1—4 CM
oo
<
51
Three essays on specification testing in econometric models. Alicia Pérez Alonso.
Tesis doctoral de la Universidad de Alicante. Tesi doctoral de la Universitat d´Alacant. 2006.
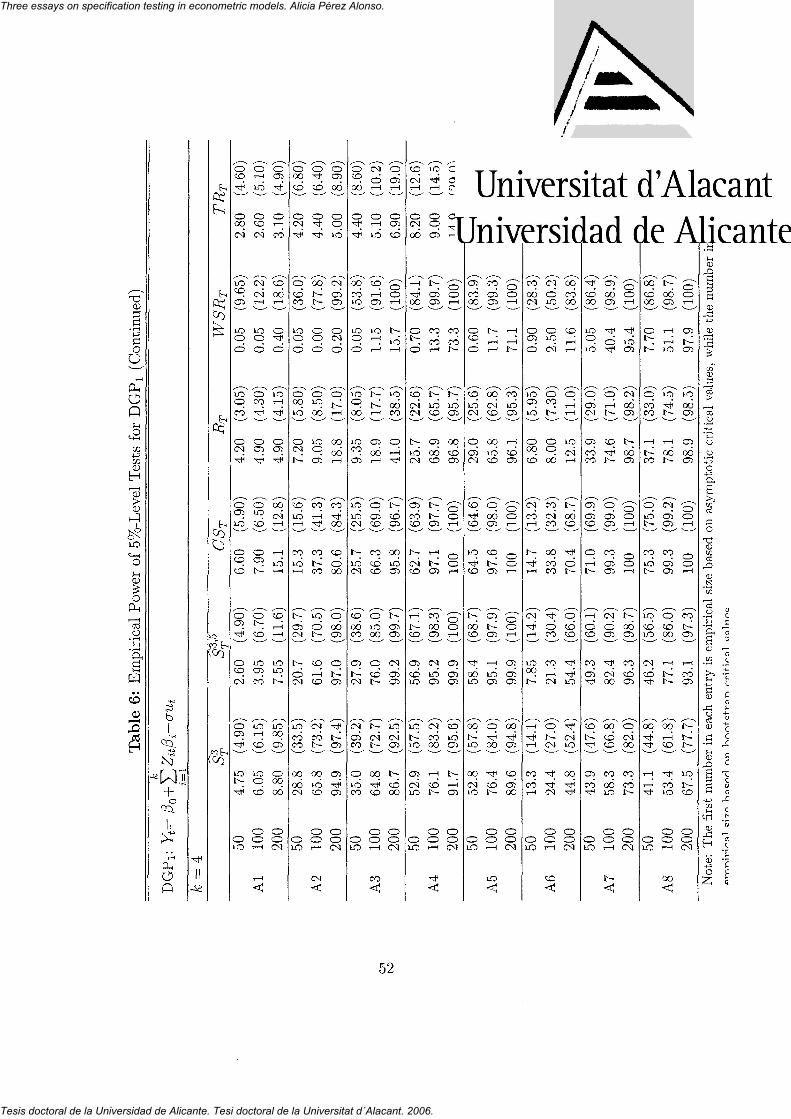
tí o ü
Pi o Q
!-l O
^ 1
O pL,
a H CO
b
+ o
II
Ü Q
^
~S£
lO
(Co
(Co
O CO
O oq c4
CO
LO o ó
id o CO
o
o
LO
o CO CO
o
o CO
o
in
O
o I — 1
LO
o CO eg
CM
1—1
lO o o
o CO
o ai
o LO CO
o OÍ
o
co
LO CT5
CO
LO
CO
LO
o CO
o o I — 1
1 — 1
<
o os
o I — 1
CO
CO oó r-H
o
o
LO 1—1
o en
00
1—1
1—1
LO 1—1
C O
1—i
LO LO
LO 00 OJ
o 00 oó
o o
o 00 CO
o
o CO CO
LO o o
o 00 LO
o
CD LO 1—1
CO LO 1—1
ai
t--o
LO
CO CO
oo 00
o LO
o
CO
o
00
o o o
o LO 00
LO o ai
CO r—i
CO
CO
LO
o
CO
1 — t
CO
(M
CO 1>-
oo
CO
o o V — 1
<
o
00
o o LO
ai 03
o CN)
o
o
1—(
oq 00 1—1
CO
00
CO
ó 00
CD oó OJ
o b-CJ3
^
a>
C35
OÍ
o o CM
o CO oo
o
00 CÓ
LO o o
o oó
LO CO ai
LO LO
LO
CO oó CO
ai
(M OJ CO
o LO CO
o LO
cri 1—1
o 1—H
LO
CO 1—1
ai
LO 1—1
1—1
1—1
ai oó 1—1
o ai CO
CO CO CO
o LO 00
o CO
I--
b-
00
CO
o o 1—1
CO
<
o ai 1—1
o OÍ CO
o o 1—1
L6 1—1
LO 00 CO
CD i-í
CD ai
oq LO OÍ
oi ai
(M C71
ai
LO
CM ai
1--
CO 00
o o CM
CD
1—1
O
oó
1—1
- 00
o
d
CO CM CM
LO CM
OÍ CO CD
CM CO
1—1
CO
C71
CO LO
LO
1 -LO
CJl
CM LO
O LO
LO
r-H
O O ai
ai ai
CO CO 1—1
b-LO CD
ai oó CD
1^
ai
rH
CJl
fO oó OÍ
CM
LO ai
CM
CO 00
1-H
CO
o o t — f
<
CD ai CM
ai
1—1
o o i-H
CO CÓ b-
LO ai
00 CD ai
o o I — 1
o o 1—1
o o 1—i
ai
a> ai
CO
LO C71
Ir-1—1
ai
o o CM
o CM C3Í
o CO CD
OÍ CO 00
O CO CD
CO LO CM
CD oi CM
CO
CO
LO
CD
0Ó CO
^ 00 lO
00
b-LO
00
LO
o LO
CO LO
CO
d
CO oi O l
1 ^
r-H 1—1
00 CM CO
00 LO CO
CD 0Ó Ol
CO
Ol
ai
ai
1—1
LO ai
o
oo
' CO
O o 1—1
LO
<
CD CD CM
Ol oi 1—1
o o 1—1
1—1
1—1
1^
CO ID Ol
1—(
CO Ol
o o 1—1
o o 1—1
o o 1—1
Ol
ai Ol
00
Ol
CD
Ol 00
O O CM
O CD
iri
O CD CO
CO oó CM
O Ol
o
LO Ol LO
o oq CO
CM CÓ 1—1
b-
1-H
CM
- r—1
LO 00
1^
1—1
1—1
CO
00
O LO
O CO
CD LO
CM O
o
oi
o CO
o o oó
CM CO
00 CÓ CO
o 00
n 1—1
CM
O
b-CM
-*
CM
O o 1—1
CO
<
o o oó
o
CD
00 CÓ 00
cq 1—1
1—1
CD 1—1
1—1
LO CM 1—4
oó CD
CJ
o CÓ CO
'
LO
• ^
CM
00
o o CM
00 CM 1—1
O CM oi
co' 00
LO CD LO
O ai CM
C31
CO CO
Ol ai CO
CD 1—! b-
1—1
CD CD
CO
Ol
CO
b-
Ol CO
o LO
O CM
CO LO 1—1
Ol 0Ó Ol
CD
O 1—i
CO
o oi Ol
CO oi Ol
CM
o Ol
- CM 00
00
CD CO
CO
00 LO
o o 1—1
<
CO CO
1—1
CD CM
O O 1—1
LO Ol
CM 00 en
00 CJl
o o
o o 1—1
oó ai
CO
CO C71
o CM 00
CO
CO
o o CM
00 CM I—1
O CD oi
00 CD 00
O
CD CO CO
1—(
CO
o LO b-
co lO
LO CO LO
CM
CD
OO
^ ^
1—1
1 — i
O LO
CM
CM
1—1
0Ó Ol
1—1
1—i
LO
LO
1^
1—1
00 b-
CM oi Ol
CO oi Ol
o CO oo
1—1
00 1—1
CD
• CO LO
o o T — 1
QO
LO
CO
CM i-H
CM
O 1—1
Ol
ai
LO OO Ol
Ol 00 Ol
CD 1—1
O o 1—1
CO b- Ol
1—1
CO Ol
~
lO
b-CO
o o CM
52
Three essays on specification testing in econometric models. Alicia Pérez Alonso.
Tesis doctoral de la Universidad de Alicante. Tesi doctoral de la Universitat d´Alacant. 2006.

OH
O O
m 03
1
O í-l
CD
% • ^
a
Oí
^1
ce; Co 00
o
^1
Co
Di Co
LO
b
i
+
O-, O Q
Oí
Co
o
o o OO 1—1
o o
c6 ci
o ID
lO o CO ^
o o
o o LO 00 oí 1-i
LO lO
o o n OÍ
o LO
CO 1-H
O o
LO LO
o o C<¡ CO .—1 I—1
o CO
o LO CO CO
o d
LO o
ci 1-5
o lO
o oq LO ^
o o 00 CO CO o6
o LO
1^ ,-1
o o o LO I—1
I—i
<
o CO
o r—1 CO
CO oó I—1
LO CO c¿
o
o
lO
có
I—i .—1
cq
T 1
o 1—1
LO
o 00 1—1
oó I—1
o
o
o
1—1
lO
L6
C35
CC¡
l O 1—1
o o CO
o o 00
o
LO CO CO
o o o
lO 00
o en CO
có 1—1
1^
oó r-H
o CO
o
CO
oó CO
o
o
o
o
CO
LO I—1
o oó 1—1
o LO
o os
o CO lÓ
I—H
00
o o CD
lO lO LO
1—1
1—1
CO CO
o CO
o o oó
o
OO
o
d
o 1—1
C O
1—í 1—1
00
CO CO
o o 1—1
CM
<
1—1
1—i r-H
o o CO
LO o o
lO 00 oi
1—1
CO
00
CD oí 00
t—1
o r-H
o o LO
lO en en
o 1—1
cr>
LO en oó
CO
OQ
có 00
CT5
1—i
OO
o o 03
o d 1—1
o 00 CO
CO có LO
LO CO
o
lO en có
lO 1—1 I—1
05
ai O]
00 1—i CO
o CO oó
o 00 có
LO
LO
o
o
1>:
I—1 1—1
CO cñ oq
oi CO
o L O
1—i I—(
o r-H
CO CO 03
LO
1—1
OO CO I—1
en oá oq
OO
LO
oq CD 1—1
o oq
oq CO en
LO oq 1—1
oq có 1—1
-* có O l
en
LO
1^
C3 O 1—1
CO
<
O
CÓ
o o r—i
oó 1—1
oq
CO có
en
CO
en
CO o4 1—1
o CO QÓ
O O 1—1
oq QÓ
oq
Oí
I—1
có
kO
en
1—1
en
o '
o
1—1
o<)
T—1
O có 00
LO en 1—1
o 1—i
00
CO
oq oó CO
CO có
LÓ 1—1
o o4 1—1
LO oq 00
LO co oq
I—1
r-H
CO
1--00
LO CD
CD có
LO
CO cñ 1—)
00
r-H
CD
en
lO <ó
en
co
CO
00
cq oó en
oq oó en
O; có r-H
CD uó 1—1
O
en
CO
1—1
iq LO CO
cq có 00
co oó
oq oó C33
O O 1—1
<<
lO
oq
cq r-H CM
O o 1—1
CD LO
00
ai
CM cñ en
o o I—1
o o 1—1
CD CM
O O CM
O o 1—1
en lO 1^
en
1—1
cñ en
o o r-H
O O 1—1
o o CM
oó
00 LO 1—1
b-CM 00
o
CM
CM
O lÓ
en CJ5
co
en lO b-
o
r-H
có 1—1
1^ 1—1
00
LO
CM
CM CM' CO
CO oó
oq en CD
LO oó b-
O LO
cq r-H CM
lO
CM
CO eñ en
1—1
I—1
LO LO CO
b--CM 00
b-00 en
^H cñ en
iq C5 CM
CO r-H
rH en en
CTl
CO r-t
o LO CD
oq CM 00
oq oó <3i
o cñ en
o o 1—1
lO
<
oq o co
oó CM
O o ^H
cq có
en
LO cñ en
o o I—1
o o 1—1
cq oó oq
LO oq
o o 1—1
kO có
co -^ OÍ
r-H
cñ en
o o t-H
o o 1—1
o o CM
O 00 LO
O CM CÓ
LO o<i
o CM 1—5
o
có
LO OO
iq có 1—1
r-l
cñ r-H
O CO CD
O CM có
os
CM
O
1—1
o en có
o co
en CM 1—1
O oó 1—t
o LO
o
LO
o o 1 *
oq 1—5 LO
O iq có
o CM
LO cq oó
LO oó co
có
o o t--5
O - có
°9 1—1
LO
LO oq oó
o -^ có
UO CD oó
00
co
có
o o 1—1
co
<
o CD có
O co
CM CÓ 00
o -* 1—1
LO 00
CTl
CO 1—í
LO
d
LO
1^
O 1—)
1>5
O 1—1
CÓ
CO 00
CM
1—1
O iq LO
00
1—1
CM 1—1
LO
O o CM
O CM
O
1—1
oi 00
b-
o 1—1
co
en
LO
o l>5
b -
co
00
CD 1—1
O oó ^H
en i-H
OO
oq 1—1
r-H
en có co
cq oó LO
CM
CM có 00
o LO
en lO oq
I--có oq
en
en
lO OO
en
b-
LO
O en
co d en
00 cñ en
en CM CM
00
1—1
00
en
en oó
oq
co có en
en cñ en
o o 1—1
O o 1—1
b-
<
có co
1-5 OO
o o I—1
LO CD en
CM
en
00 en en
o o I—1
o o I—1
00 en CM
O cñ CM
O O rH
iq có en
en
oq cñ en
o o rH
O O ^H
O O CM
CO có CM
CO
rH
CM OO
co LO 1—1
O
lO 1—1
CD
oq d
en
00
i-H
CD - 1—1
Lq t-H
00
1—1
có I—1
d
rH
CD
CO
d
CM cñ 00
O LO
CO
d OO
oq cñ CM
CO t-5 en
LO en LO
CM cñ b~
co en
00 eñ en
o o 1—1
en CM
CM có CM
CO i>5 e n
•<* CD CO
có b-
có en
oq eñ es
o o t-H
O o 1—1
00
<
en co
cq oq co
en eñ CJS
CM
OO en
en
en
o o 1—1
o 1-H
o o 1—1
i-H
00
b~ eñ CM
en cñ en
oó en
oq oó en
o o rH
o rH
O O t-H
O o CM
Three essays on specification testing in econometric models. Alicia Pérez Alonso.
Tesis doctoral de la Universidad de Alicante. Tesi doctoral de la Universitat d´Alacant. 2006.

Ü Q
M
r — 4
> 0)
<1>
O OH
00
oo o II
l O
-O-
b
CO
Ü Q
h QÍ
Co
o
E-i
^
CO
o
05 OS
CM
T—Í
O O
CO in o
I—(
lO CO
lO
00
o CM 00
r-4
o 00
I—1
!>• CO
o CM CD
I—1
lO CM
CO 1—1
L6
>—1
C O
1—(
00 lÓ
o LO
o 1—1
in
o OÍ r—1
CO O 1—1
LO 1—1
O
o CO CM
O 1—1
LO
o
lO
oó
o
o
CM
o 1—i T—1
o CO CD
o CM CM
CO
o CO
CD 1—1
1—1
O 1—1
1—1
<
O
lO
lO I—i
CM
1—H
CM
O CM CJ
O
1—1
o en
CO
I—i
CO lO 1—1
o
LO
o 1—(
CM
C71
1—1
l O
r-H
CD
lO 1—Í
00
1—1
o o CM
CM oq CO
00 CO
CO
r-H
CM
O
CD CO LO
CD 00
CO LO 1—1
CO 00 1—1
CSI
CD C75
1—1 CO lÓ
LO 1—1
CO
o CD O
CD CD
CD
OO
1—1
CO CD CM
O LO
o CD
O LO
lO
o o o o I—1
CO
CM I—1
1—1
lO CO
CO CM
LO CD I—1
O
o CO
CM 00
o CD CD
O
LO
00
o 1—1
o
1—1
CO
o o 1—1
CM
<
CD 1—Í
O
LO 0Ó
O
o CD
CO CTJ
O CM
CO CO 00
CO 1—i
00
CO
t—1 1—1
o CM CD
CO
cn
o CD
o
lO CO
1-5 CM
lO CO 00
CM OO
O o CO
00 CD 1>
O CM CO
CM
ai CM
CM CO 1—H
00
05 CO 1—1
LO CD CO
1—1
CO CO
ir:) CD OO
CO 00
lO CM CD
CM
CO
1—f
I—i 1—1
1—1 CO
o
CO
O LO
lO CM 1—1
O CO LO
CO CM
o o CM
CO 1—1
CO
CM
lO
o
CD r-H
CD 1—1
O LO
CD
1—J OS
o Ol
LO
1—1
00 CO CM
LO CO
lO CO
o o 1—1
CO
<
CO
I—1
LO b-CO
o o 1—1
OJ 1—1
CM
LO
05
CO
05
CM CO I—1
o 1—1
05
CO o6 1—1
Oí lO CM
OS CO
05
05
CO
05
CM
CD 1—1
O CM 1—1
00 05
05 00
CO CO
CM
05 lO CO
1—i
c6
CO CO I—1
o
I—1
CO CO
1—1
CO CM
CO CM CO
LO 00
CO 05 CO
o oó
LO
O
CM
b-lO 1—1
CO oó 05
05
I—1
1—1
CO
CM
00
b-
05
OO 05
LO oó 1—1
CO
oó 05
cq oó I—1
CO
LO
c6 OO
05 oó 05
CM 05 C75
O O r-H
<
CO LO CM
05 00 1—1
CD O I—1
LO có 1>-
LO LO 05
o O I—1
O o I—1
o o 1—1
I—1
CO CM
LO 05
O O 1—1
LO
LO 05
ai
o o 1—1
o o 1—1
o o CM
1—1
LO r-H
CO i-H
1—1
C75
b-!>• CO
00 1-H CO
CM CO
oó CD
CO b-
05
r-l
i-H
CM I—1
b--
O CO
CM
CT5
r-l CO
CO CO
b-
CO
r-H
LO
O LO
b-LO CM
O 00 1-H
05 05
LO 00 1—Í
O LO CD
OO
00 03
1--; 00 05
CO CD CM
LO 00 1-H
0Ó 05
CM 0Ó 1—1
LO LO CD
1—1
CO 00
05 oó CK
o
05
o o
1-H
LO
<
05 C5 CM
T—1
CM CM
O O I—í
05
b-
LO C75
05 05
O O 1—1
O o 1-H
05 có CM
•Ñt<
CO CM
O c ^H
LO có
CM
05
1-H
05 05
O O ^H
O O 1-H
O O Cl
CM LO LO
CM 00 có
00 CM ^H
OO CO 1—1
1-H LO
CM
05 có 1-H
CM 05 1—1
CO
LO
CM 00 CM
oq CM CM
O CO r-H
CD 00 CO
05 CO
CM
1—1
05 05 ^H
O LO
O
lO
o i-H
CM CD LO
00 05 CM
O 05 00
LO
05
CD CO 00
CM'
o LO
o o oó
03 05
CO 05 CO
I-H
05 có
b--=* oó
CO
00
1—1
00 -Ñt<
0 0
1—1
CO
<
0 1-H
có
00 LO
CD LO 00
CM r-H
0 1-H
CM LO r-H
05 CO
1>-có b-
0 0; 10
0
CO
05 có 00
CM X|H r-H
LO C^ 10
CO 10 r—1
05 CD
0 LO b-
0 0 CM
CO
1-H
1—t
LO
05
LO
CO 1—f
1—I
CO
LO
LO
CD LO
CD CÓ 00
CD oó 1—1
CO CÓ r—1
CM CÓ b-
LO r-i
00 LO CO
CD LO
LO
b-
10 00
0 10
C75
00 CM
CO LO CM
05 oó 05
CM 1-H LO
LO
00 CM 05
1-H
05 05
05 C35
<ji CM
CD
CM
05
C35
CM
05
05 có b-
00 r-t 05
05 05
cq 05
0 0 r-H
b-
<
00
1—1
có 00
0 0 rH
CO
00 05
0 0 1-H
0
1-H
0
1-H
LO
CO
cq I—i CO
00 05 05
10
05
CO
05
05 05 05
0
r—1
0
r-H
0
CM
0 CO 1—1
cq 1-H r-H
00 10 LO
C7> rH
05 en
r-H
CD
cq oó
00
00
0
1-H
CD có 1-H
CD
0 CD r-H
05 CO
00 CM CD
rH cñ b-
CO oó 00
0 LO
LO CM CO
00
CM
CD 05
05 00 LO
CO CD
CO
<75
CD 05 05
00 05 05
cq oó cq
00 cq
00
05
1-H
05 10
CD
00 CÓ 05
05 en
0 0 1—1
0 0
1-H
00
00 CM
CO LO 00
0 " 0 1-H
00 b-05
0^ 0 1-H
0
r-l
r-H
0
r-H
05
CO
CD CO CO
0 r-l
LO 0Ó 05
00 05 05
0 0 r-H
05
ai 05
0
I-H
0
CM
Three essays on specification testing in econometric models. Alicia Pérez Alonso.
Tesis doctoral de la Universidad de Alicante. Tesi doctoral de la Universitat d´Alacant. 2006.

• ^
PH
o Q ^H
^ r/1
4-= t i l C\>
H ^ 0)
^-l i ^ l O
O
is u P-, c« C )
f~l
ex
.. Ü5
X! rt H
r^^
1 ( M + j
OS
,_! >< K C<1
+ (M
^ 1
X, I—*
+ o
II ^ ^
^ b
*•« - Í
Q i
• ^
>< b
+ c^
II >i
4' PH Ü Q
"ir o o 0 5
o o f
II es 0 r ^
$5 ^ O
[-, ü:; hn
!-. ÜÍ Co
^
t-. ^
F-H Co
o
^—, 00
uo"
cJ CO
II ,,.—
1—<
0 o
f~(
Co
^
K tei
f-. CO C^
o o o o CO N; lO lÓ uó
o o o o 00 OÍ
lO «o OÍ
" ^ oi
o o o ^ 'xt; o t-H c4 có
o
c4
in> o 1—i LO (M (M
kO LO o o CO
^ LO LO
o 1^
o ^ 00 ^
o 00
LO
o CM
o o LO LO -*
o o c4
o o OJ CM
LO
o o 00
LO 00
LO CO o o
-* LO o t-l i-H
o CD
LO LO
LO I — 1
LO LO 05 CO
o o LO CO CO •
o CO o r-i CD
o o o o o LO r-1 CM
<
o CO -* CM ,^ ^
o o o CO T—I -xh ^' t- 00
oq CM cq OÓ OÓ LO ^ '^ t-
CD o t^ CM
o o CM
LO LO CO r-H
'^ b- i-H
o 00 CO
'^. d oi l>- i-H r—I
LO CO CO
i> -xt CM" •-H "* 00
T—I 00 LO
CO LO CM CM ^ 00
o o
CO
CM
o o o CO LO OÍ
^ LO -Ñt<
T—I C71 CD CM LO 00
o o LO T-l ^ o
o LO CO
°o ^ oí CO LO I—I
LO en CM lO • •
LO ^_ o
t^ lO OÓ t—I ^ 00
o CO 1—I CM -^ 00
o o o o o LO ^H CM
CM
<
CM CO 00
o LO ai I—1 CM CM
o ^ t
CM CO 05
OÓ o6 OÓ CM m i~~
o LO 03 CO 00 ^ T-i ^ CM
o t^ 00 =^ LO r-¡ LO >—I 00
LO LO CO
CD "^ r^ ^ CM ^
LO LO '^ CM CD C5
^ CD ^
^ CM CD CO t^ 03
" ^ c CD OÓ LO
o o o cq 00 CD ló t^ ai
T—I 03 00
OÓ o ai CO b- 00
o o o t- l^ ^
o OO CM
• ^ ^ LO r-l CM
^ as " r4 CO I—I ^ CM "*
en 00 I—(
1> oÓ CO CM CD 03
CD CO LO CO CM CO 00 b- Ol
o o C LO r-l CM
00
CM CO 00
CO lió oi 1—1 CM CM
-=* -^ t^
CÓ CM CO
!>• o 00
oi o ' •^ N- 00
. 00 CO ^ .—I CD
CD 1^ ^
lO 00 T—I CM lO 05
cq CO -^
LO CD oÓ -Ñt* 00 on
CO t^ CM
I—< CM oi CD 03 03
CO 00 o I-- 03 I—I
^ i-H iq
•^ CM 03 >—I CM CM
CO CD CM
I—I 03 LO I—I T—l CM
CO "^ LO
t- CM oÓ LO 00 03
I^ CM
LO CO T—l CO
CO "* 00
' ^ 1 — 1 I — I
CM LO 00
t- OO LO
I^ CM 0Ó ^ ^ 0 0 03
rH 00 b-
^ lÓ oi CO 03 Ol
03 00 Q
LO t^ O I^ 03 t—(
i,¿ O o C 3 O
LO >—I CM
CM CO CM
^ ai ci .—I CM CO
CM 03 cq
1—i LO Lió 1—1 I—I CM
t o o i>- o
LO -* CO
'^ 00 CÍ ^ ^ CO
-xt< CD r-H CM LO 03
1— LO LO
'^ oó 0Ó -* t- 03
CM I^ iq
o oÓ <J3 CO C73 C33
"• -i ^ O "* OO o t-~ 03 T—I
O CO CO
LO i> oi 1—1 CM CM
-* CO Oí
CM o CD ^ CM CM
C73 xh CM
LO CM CO LO OO 03
O CD CM
CO LO CD 1—1 CD
t- CM CO
CM O CO CM LO 00
CD O 00 -* 00 03
1—I O CJ3
CO CD 03 CD 03 03
<== ^ O t- OO O t- 03 1—I
o o o o o LO r—I CM
LO
o o o CM ^ ^
I> t^ 00
o o o "^ ^ CD
CO '^ LO
CD CM CO LO
O LO CD
f^ ' ^ t ^ CM CO 1—1
LO LO lO
CM -^ t^
LO O CM 1-1 CO ^
LO
03 CM LO
CM CO LO
03 1— i-H 1—I -^ b-
O CO 1^
^ C<i OÓ 00 1—1 1—1
o o o CD 1-; CD
OÓ '^ ^
CO 03 1—I
"^ CO có 1—1 00 CD
LO o
m CD
LO LO o cq 00 '^ CM CM lO
LO LO b-
. °9 ^
00 03 03
CD o 03 1—1 00 LO
00 CM 00 03 1—I r-l ^H -^ t^
o o o o T—l CM
CO
"* CD 03
oÓ O LO 1—1 CO CO
o C^ OO -^ l> t^ 1—I r-H CM
o LO 00
OÓ t-- CD '^ CO 00
' CD
CM CM LO 1—I -^ 00
CO -if ^
LO OO o CM LO CJ3
CO 1^ ^ 1—1 LO 03 LO 00 03
CO CM CO CO C73 03
"^ . O O 03 O 00 03 r-(
CD cq xt; CD o o CM OO ^
CM - cq LO CO CD t-l CM CO
CO o CM
i> o o LO 00 03
LO CM lO
o CM OÓ 1—I ^ 00
cq CM CM
iró CM L Ó
CM LO 00
^ CO ^
CD 1-- 03 LO 00 03
00 CO OO CD 03 03
<^ «^ O CM 03 O OO CJ3 ^H
O O O O O LO 1—I CM
1^
O C73 LO
03 CD CM i-< 00 "*
cq 03 CD
OÓ LO CD r-l CM 00
LO OO CM
OJ CD 03 '^ CD t-
CD CM ^
CO 1-5 03 r-l LO 00
OO O LO
00 o o CM CD 03
iq !>; "^ OÓ 03 03 LO 00 03
LO 1—1 CD CO 03 03
^ ^ i.'^ f—,
^ 03 O 00 CJ3 1—I
cq CD CM 1—I 03 lió CM 00 -*
CO 05 CM
lO 00 ^ I—I CM CO
O I>; CD
0Ó 03 oi LO b- 00
cq '^ CO ^ CM i-i 1—I lO 03
O i-< LO
1^ "^ xti CM lO 00
CD t^ !>;
t-i CD C73 CD 03 CJ3
CM CM C73
1-Í lO t- t~ C73 C73
00 OO Q
CD 03 O 00 03 1—I
O O O O O LO T-l Cd
00
Three essays on specification testing in econometric models. Alicia Pérez Alonso.
Tesis doctoral de la Universidad de Alicante. Tesi doctoral de la Universitat d´Alacant. 2006.
Chapter 2
Unemployment and Hysteresis: A Nonlinear Unobserved Components Approach
2.1 Introduction
The business press make continual references to the high unemployment that char
acterizes European countries. For example, in France and Italy unemployment since
the mid 1970s has steadily increased without any significant decrease or evident ten
dency to revert to a stable underlying unemployment rate. It remains very high at
around 10% (see Figure 2.1). Many theories have emerged to provide an economic
explanation which could account for this observed unemployment persistence. Most
of the work in the relevant literature assumes that it can be attributed to changes in
the natural rate of unemployment and/or changes in the cyclical rate of unemploy
ment. Based on this framework, two main approaches are the natural rate theory
and the unemployment hysteresis theory.
The first approach supposes that output fluctuations generate cyclical move
ments in the unemployment rate, which in the long run, will tend to revert to its
equilibrium. The crux of the natural rate hypothesis is that cyclical unemployment
and natural unemployment evolve independently. Hence, the tendency of the nat
ural rate to remain at a high level is the result of permanent shocks on the structure
of the labour market such as increased unemployment benefits, strong trade unions,
56
Three essays on specification testing in econometric models. Alicia Pérez Alonso.
Tesis doctoral de la Universidad de Alicante. Tesi doctoral de la Universitat d´Alacant. 2006.

legislative restrictions on dismissal and minimum wage laws (see Friedman, 1968).
The second approach supposes that cyclical unemployment rate and natural rate
do not evolve independently. The basic idea of the hysteresis hypothesis is that a
change in the cyclical component of the unemployment rate may be permanently
propagated to the natural rate. Based on this idea, an increase in the cyclical
unemployment rate may lead to an increase, over time, in the level of the natural rate
(see Phelps, 1972). A direct corollary of hysteresis is that short-run adjustment of
the economy can take place over a very long period. Then, aggregate demand policy,
traditionally considered as ineffective in changing the natural rate of unemployment,
can have a permanent effect on it.
In this paper, we focus on this second approach. The word hysteresis derives
from the Greek varepeuj, which means to come later. The physicist James Alfred
Ewing was the first to introduce this term into the scientific literature to explain the
behaviour of electromagnetic fields in ferric metals. As pointed out in Amable et
al. (1995), a mathematical modelling of hysteresis requires us to consider a system
subject to an external action, that is an input-output system. Hysteresis is defined
as a particular type of response of the system when one modifies the value of the
input: the system is said to exhibit som,e rem,anence when there is a permanent effect
on output after the value of the input has been modified and brought back to its initial
position. This formal definition implies that a hysteretic process is characterized by
the following properties:
1. It is necessary to know the history of the system in order to assess its position.
Hence, the history of the system matters. This implies the presence of a unit root
in the process.
2. There is a remanence effect. If one transitory shock is followed by a second of
the same intensity in the opposite direction the system does not revert to its former
equilibrium. Hence, a transitory shock has a permanent efi ect on the system's
equilibrium, since the system retains traces of past shocks on it even after those
influences have ceased to apply. It must be noted that this property is only present
in nonlinear systems.
57
Three essays on specification testing in econometric models. Alicia Pérez Alonso.
Tesis doctoral de la Universidad de Alicante. Tesi doctoral de la Universitat d´Alacant. 2006.

To sum up, hysteresis occurs in nonlinear systems that exhibit multipHcity of
equihbria and the remanence property.
Many mechanisms are hsted in economic hterature as giving rise to hysteresis (see
R0ed, 1997, for an extensive survey). For instance, after a negative shock, firms may
reduce capital stock along with employment. The latter will cause unemployment
to persist because the firm may not re-open its plant once the shock is removed.
Second, long periods of unemployment may cause workers to lose skill, which could
lead to long-term unemployed workers losing the possibility of returning to the
labour market. Moreover, long term unemployment may have a demoralising eflFect
on search behaviour, contributing to a less efficient matching process. Third, after a
negative shock, the insider (currently employed worker), has the power to push up
wages due to the cost to the firm of labour turnover and this increase in wages may
permanently raise the unemployment rate (insider-outsider theory, see Blanchard
and Summers, 1987). Therefore, a cyclical shock that reduces the number of insiders
leads to a permanent change in the natural rate.
The first attempt to introduce a measure of hysteresis into unemployment theory
was made by Blanchard and Summers (1986). They argue that unemployment
exhibits hysteresis when current unemployment depends on past values with the
sum of their coefficients equal to or very close to unity. That is, hysteresis in
unemployment arises when unemployment series has a unit root. The presence
of a unit root in the process means it is path dependent. That is, any shock is
entirely incorporated into the series level. Therefore, hysteresis is assimilated into
the concept of "full persistence". Based on this framework, a great number of
studies have investigated whether unemployment series, which is modelled as an
ARMA process, exhibits a unit root (see, for example, Brunello, 1990, León-Ledesma
and McAdams, 2004, Mitchell, 1993, Papell et al, 2000, and Song and Wu, 1997).
Therefore, the dominant approach in the empirical literature to determine whether
hysteresis exists focuses on testing for the existence of a unit root in a linear process.
Two problems arise with this kind of model. The first is that natural and cyclical
shocks are summarized in the innovation with no distinction. As pointed out above.
58
Three essays on specification testing in econometric models. Alicia Pérez Alonso.
Tesis doctoral de la Universidad de Alicante. Tesi doctoral de la Universitat d´Alacant. 2006.

hysteresis in unemployment arises when a change in cycHcal unemployment induces
a permanent change in the natural rate. Having said that, the presence of a unit
root in the unemployment rate is a necessary condition for the existence of hysteresis
but not a sufficient one since the unit root could be generated by accumulation of
natural shocks and be completely independent of whether there is hysteresis. Hence,
separating the respective effects of transitory and permanent shocks on the natural
rate of unemployment is the only way to assess if changes in it are due to cyclical
(this is the case of hysteresis) or natural shocks or both. The second problem refers
to the practice of checking for the presence of hysteresis using a linear model. A
linear model lacks the property of remanence. Under linearity, a shock on the system
followed by a second one of the same intensity in the opposite direction will bring
the system back to its initial position. In this context, it is incorrect to use the term
hysteresis, and we should refer rather to persistence. There is a major difference
between persistence and hysteresis. In a system exhibiting persistence the response
to impulses is a linear function, which is not the case for a system with hysteresis.
A number of papers have studied methods for checking for the presence of hys
teresis in a nonlinear framework. They employ a battery of unit root tests that
control for the possible existence of nonlinear behaviour in unemployment series.
Papell et al. (2000) test for unit roots in autoregressive models with structural
changes and León-Ledesma (2002) implements a unit root test in a threshold au
toregressive model. Though these models incorporate nonlinearites to model the
behaviour of unemployment rate series they have the same weak point as the linear
models described above: it is not possible to tell whether a change in the natural
rate is due to transitory or permanent shocks.
So, if our goal is to check for the presence of a hysteresis effect on the unem
ployment rate we need a nonlinear econometric model that discriminates between
natural and cyclical sources of influence on the unemployment rate.
Jaeger and Parkinson (1994, henceforth JP) put this idea into perspective and
adopt an unobserved components (UC) modeP to test the validity of the hysteresis
^See Harvey, 1989, for a detailed description of the Unobserved Component models.
59
Three essays on specification testing in econometric models. Alicia Pérez Alonso.
Tesis doctoral de la Universidad de Alicante. Tesi doctoral de la Universitat d´Alacant. 2006.

hypothesis. They generate a pure statistical decomposition of the actual unemploy
ment rate into a natural rate component and a cyclical component, which are both
treated as latent variables. They also assume a particular structure to describe the
variation over time of these latent variables. The hysteresis effect is introduced by
allowing cyclical unemployment to have a lagged effect on the natural rate, which is
assumed to contain a unit root. They only consider symmetric responses of the nat
ural rate as regards cyclical unemployment fluctuations. In this way, they implicitly
assume hysteresis is a linear phenomenon. This approach is insufficient to correctly
identify hysteresis. Though it allows the difí"erent sources of shocks (i.e., cyclical or
permanent) to be identified, it does not take into account the existence of nonlin
ear dynamics in unemployment series: this is necessary to capture the remanence
property of a hysteretic process. Under JP's model it is only possible to establish
whether delayed cyclical unemployment has a significant impact on the natural rate.
This describes persistence but it does not correspond to hysteresis.
In order to take into account this nonlinear feature of a hysteretic process, we
propose an extended version of JP's model. In particular, we allow past cyclical
unemployment to have a different effect on the natural rate, which depends on
the regime of the economy. It is thus possible to capture the stylized fact that
natural rate does not decrease in cyclical expansion periods as much as it increases
in cyclical recession periods. This provides a plausible explanation for the tendency
of the natural rate to remain at a high level. The parameters of the model are
estimated by maximum likelihood using a modified Kalman filter that incorporates
the methodology implemented for the estimation of the threshold autoregressive
(TAR) models (see Tong, 1990) in order to split the sample into two groups, which
we may call regimes.
Under this new framework, the problem of testing for hysteresis becomes a prob
lem of testing for linearity. The relevant null hypothesis is a one-regime model
(i.e. the non presence of hysteresis) against the alternative of two regimes (i.e. the
presence of hysteresis). The absence of a body of finite sample theory for nonlin
ear models means that empirical research must rely either on asymptotic theory
60
Three essays on specification testing in econometric models. Alicia Pérez Alonso.
Tesis doctoral de la Universidad de Alicante. Tesi doctoral de la Universitat d´Alacant. 2006.

or bootstrapping for inference. Testing for the econometric hypothesis of interest
in the context of nonhnear models raises a particular problem known in statistics
literature as hypothesis testing when a nuisance parameter is not identified under
the null hypothesis (see, among others, Andrews and Ploberger, 1994, Chan, 1990,
and Hansen, 1996). In particular, the threshold parameter and the delay lag of the
threshold variable are not identified under the null of linearity. If the model is not
identified, the asymptotic distributions of standard tests are unknown, which means
that tabulation of critical values is not possible. There is no shortcut solution for this
problem. Hansen (1996), derives an asymptotic distribution free of nuisance para
meters that is useful for testing and inference in TAR models. He shows that critical
values are easily approximated via Monte-Carlo simulation. As far as we know, no
distributional theory is available to implement a linearity test in the framework of a
UC model with nonlinear dynamics described by the TAR methodology. With this
in mind, we extend the bootstrap proposed by Stofi er and Wall (1991) for assessing
the precision of Gaussian likelihood estimates of the parameters of linear state-space
models to the context of performing a test of linearity for a nonlinear state-space
model. Then we use this method to check for the presence of hysteresis in Italy,
Prance and the United States.
The paper proceeds as follows. Section 2 brieñy describes JP's model and intro
duces an extended version that accounts for nonlinearity. Section 3 proposes two
alternative bootstrap procedures to compute the p-value for a linearity test under
the framework of interest. It also discusses the design of the Monte Carlo experi
ments that are used to investigate the small sample performance of the bootstrap
version of the test and presents the results of the experiments. Empirical results for
Italy, France and the United States are presented in Section 4. Section 5 concludes.
2.2 An extension of Jaeger and Parkinson's model
JP propose a pure statistical decomposition of the unemployment rate to evaluate
the data for evidence of hysteresis effects. They assume the actual unemployment
61
Three essays on specification testing in econometric models. Alicia Pérez Alonso.
Tesis doctoral de la Universidad de Alicante. Tesi doctoral de la Universitat d´Alacant. 2006.

rate to be the sum of two unobservable components: a non-stationary natural rate
component, U^, and a stationary cyclical component, t/*",
u, = ur+i/f. (2.1)
In order to contemplate the necessary condition for hysteresis, i.e. the presence
of a unit root in the process, they first test for the presence of a unit root in the
unemployment series and then impose it in the model. Having said that, the natural
rate component is defined as a random walk plus a term capturing possible hysteresis
eñ"ects,
[/f = [/, , + «í/f^,+ef. (2.2)
Coefficient a measures, in percentage points, how much the natural rate increases
if the economy experiences a cyclical unemployment rate of 1.0 percent. The size of
this coefficient is their measure of hysteresis.
The cyclical^ component of the unemployment rate is defined as a stationary
second-order autoregressive process,
Ul" = cj>,U^.^ + AUÍL2 + ^?. (2.3)
The system is completed by augmenting the model with a version of Okun's law,
which relates cyclical unemployment and output growth,
A = /3iA~i+<5f/f+ ef, (2.4)
where Dt stands for the output growth rate at date t. Equation (2.4) defines the
output growth rate as an autoregressive process of order one plus a term capturing
the influence of the cyclical rate of unemployment^. Since the cyclical component is
^As in JP. we find that AR(2) processes for the cychcal component fit the data well for all the countries under study.
•^Jaeger and Parkinson (1994) introduce this equation to identify the model. However. Proietti (2004) points out that these authors fail to recognize that the model is just identify. Nevertheless, we also use this additional series to estimate the model in a more efScent way.
62
Three essays on specification testing in econometric models. Alicia Pérez Alonso.
Tesis doctoral de la Universidad de Alicante. Tesi doctoral de la Universitat d´Alacant. 2006.

assumed to be stationary, we consider Uf instead of AUf as in JP's model in order
to avoid a problem of over-differentiation.
The disturbances e^, ef and ef* are assumed to be mutually uncorrelated shocks
which are normally distributed with variances a'j^, a^ and cr|,, respectively.
In order to test the hysteresis hypothesis, i.e. past cyclical movements on unem
ployment have a permanent impact on the natural rate, JP perform a significance
test on parameter a,
Ho:a = 0.
If parameter a is significantly different from zero, they argue there exists a
hysteresis effect on the unemployment rate. It is important to note that JP's model
is linear, since it implies that past cyclical unemployment changes have the same
impact, in absolute terms, on the natural unemployment rate. For example, a
variation in the cyclical component of (1%) or (—1%) causes a variation in the
natural rate of («%) or {—a%) respectively. Again, we remark that this linear
context lacks the property of remanence, so it is not possible to observe hysteresis.
We would do better to refer to persistence rather than hysteresis.
At this point, we want to relax the assumption of linearity and we introduce
nonlinearities into JP's model. This extension allows us to detect whether hysteresis
is present in unemployment series. Nonlinearites are introduced by allowing past
cyclical unemployment to have a different impact on the natural rate, which depends
on the regime of the economy. To that end, equation (2.2) becomes
where qt is the threshold variable and 7 stands for the threshold parameter. Equa
tions (2.1), (2.3) and (2.4) remain the same together with assumptions about shocks.
This kind of model is estimated via maximum likelihood in the framework of
the Kalman filter'^. We employ a modified Kalman filter in order to incorporate a
'See Hamilton (1994, Chapter 13) and Harvey (1989, Chapter 3) for a more detailed description
63
Three essays on specification testing in econometric models. Alicia Pérez Alonso.
Tesis doctoral de la Universidad de Alicante. Tesi doctoral de la Universitat d´Alacant. 2006.

deterministic cut-off of the sample that corresponds to a raw indicator for favor
able and unfavorable periods, which is based on the methodology implemented for
the estimation of TAR models^. We choose the long difference Ut^i — Ut^d, with
d G {2,3}, as our threshold variable. This variable is an indicator of the state of
the economy to identify the regimes. The integer d is called the threshold delay
lag. Whether this variable is lower or higher than the threshold parameter 7 de
termines whether an observation belongs to one regime or the other. We consider
an economy with two regimes, one related to high long differences (regime 1), i.e.
an unfavorable regime, and the other with low long differences (regime 2), i.e. a
favorable regime. Parameters d and 7 are unknown so they must be estimated along
with the other parameters. The maximization is best solved through a grid search
over two-dimensional space (7, c¿). To execute a grid search we need to fix a region
over which to search. It is important to restrict the set of threshold candidates a
priori so that each regime contains a minimal number of observations. We restrict
the search to values of 7 lying on a grid between r th and (1 — r)th quantiles of gt_i
for each value of d. In our applications we choose r = 0.30. Then we estimate the
model for each pair (7, d) belonging to this grid and retain the one that provides
the highest log-likelihood value.
As mentioned in the previous section, in this context a test for hysteresis becomes
a test for linearity, i.e. a test for a single regime against the alternative of two
regimes. The null hypothesis we are interested in is
Ho : ai = «2.
At this point, a remark is needed. If the unemployment rate displays a nonlinear
behaviour, JP's model is misspecified and any inference based on the parameters
of this model may lead us to wrong conclusions. This reflection suggests that the
following testing strategy should be implemented.
The starting point is the extended JP model, where we test the null hypothesis
«1 = «2- If we reject it, we are accepting the presence of hysteresis in unemployment
of the Kalman filter. ^See Harvey (1989, Section 3.7) for a more detailed description of the Threshold Kalman filter.
64
Three essays on specification testing in econometric models. Alicia Pérez Alonso.
Tesis doctoral de la Universidad de Alicante. Tesi doctoral de la Universitat d´Alacant. 2006.

series. If it is not rejected, hysteresis is not present in the unemployment rate but
there is still a place for the presence of persistence. Once this point is reached, the
next step is to estimate the linear model proposed by JP and test for persistence
following the strategy they propose.
As pointed out in the previous section, when we perform the test of linearity a
problem of unidentified nuisance parameters under the null hypothesis arises. That
is, there exists a set of parameters that are not restricted under the null hypothesis.
In particular, the null hypothesis aj = «2 does not restrict the threshold parameter
7 and the delay d. As a result, conventional statistics do not have an asymptotic
standard distribution. In order to circumvent this problem, we employ a bootstrap
technique to compute the p-value associated with the test of interest.
2.3 Experimental design for computing the bootstrap p-value for the linearity hypothesis test
Our aim in this section is to approximate the distribution of the test statistic of
interest by a consistent bootstrap procedure. In particular, we implement a Wald
test statistic. The difficulty is that there is no well-accepted bootstrap method that
is appropriate in the present framework. Stoffer and Wall (1991) propose a bootstrap
method to asses the precision of the Gaussian maximum likelihood estimates of the
parameters of linear state-space models. They also prove the asymptotic validity
of this bootstrap under appropriate conditions. These conditions have been not
verified for nonlinear state-space models, and may in fact not hold. However, the
result they obtain is sufficient to justify using the bootstrap for the statistic supW.
Following their resampling mechanism, we propose two bootstrap procedures: the
first is valid if the errors in our model are homoskedastic and the second allows for
the presence of general heteroskedasticity. We check that both bootstrap procedures
work well in our framework by means of Monte Carlo simulations, of course, we have
no guarantee that they work in general.
65
Three essays on specification testing in econometric models. Alicia Pérez Alonso.
Tesis doctoral de la Universidad de Alicante. Tesi doctoral de la Universitat d´Alacant. 2006.

2.3.1 The state-space model
The state-space model is defined by the equations
Si = F{qt-i)st^i+wt
Vt = Hst + Dyt-i + vt
(2.5)
(2.6)
where St = {U^.UfM^i)' i^ ^ vector of unobserved state variables and y =
{Ut^DtY is a vector of observed variables. Equation (2.5) is known as the tran
sition equation and equation (2.6) is known as the measurement equation. The
coefficients of the model are stored in the constant matrices
F(gt_i) = Fi/(5i_i > 7) + F2l{qt-^i < 7) , Qt^i = Ut-i - Ut-d,
H 1 1 0 0 (5 0 F
1 0 0
« i
01 1
0 02 0
, ¿ = 1,2; D = 0 0 0 p.
where I{B) = 1 when B holds. The vectors Wt = (e¿ , e f , 0 ) ' and Vt = (0, e D\
represent white noise processes with E{'Wtw'^ = Q, E{vtv[)
where
R and E['Wtv[) = 0,
Q = a N 0 0
0 0 0 cr\ c
0 0
and R = 0 0 0 al
Note that under the null hypothesis of linearity F{qt-.i) = F. To simplify the
notation, let ^0 = {(^N-, CC , c p , a, 0^, 02i <) /^i)' be the vector with the model
coefficients and the correlation structure under the null hypothesis, and 0i = (CTJV,
o"c cz), «1, «2; 01, 02) <) /^i)' be the vector of parameters under the alternative of
nonlinearity.
2.3.2 Homoskedastic bootstrap
We propose the following algorithm for the homoskedastic bootstrap:
66
Three essays on specification testing in econometric models. Alicia Pérez Alonso.
Tesis doctoral de la Universidad de Alicante. Tesi doctoral de la Universitat d´Alacant. 2006.

STEP 1: We estimate the supW test. To compute this test we need only to
estimate the model under the alternative hypothesis of nonlinearity. The parame
ters of interest are {9i, 7, d}. For each given value of (7,6?) belonging to the grid
A described in the previous section, we obtain the maximum likelihood estimates
(MLE) 9i{-y,d) and compute the pointwise Wald test statistic,
W{j,d) = RA{l,d){RV^r0,{j,d))R')-\ROih.d)y,
where R = (0 0 0 1 — 1 0 0 0 0 0) and Var{9i) is a heteroskedasticity-robust
maximum likelihood estimator of the variance-covariance matrix. Then, arguing
from the union-intersection principle, Davies (1987) propose the statistic
supW = sup VF(7, (i). (7,rf)eA
STEP 2: Using the Kalman filter we obtain linear forecasts of the state vector
at time t based on all the available information up to time í — 1, S Í | Í - I , and the
mean square error matrix associated with each of these forecasts, Pt\t-i- We also
obtain from the Kalman filter the innovations, the innovations covariance matrix,
the Kalman gain matrix and the updating of the state variable,
€t = yt- Hst\t~-i- Dyt^i,
E, = HPt\t-,H' + R,
Kt = Pt\,_^H'T.-\
st\t = st\t-i + Kttt.
Following Anderson and Moore (1979), we derive the innovations form represen
tation of the observations,
st\t^i = Fst_,\t_i + FKtet, (2.7)
yt = Hst\t_^ + Dyt-i + et. (2.8)
67
Three essays on specification testing in econometric models. Alicia Pérez Alonso.
Tesis doctoral de la Universidad de Alicante. Tesi doctoral de la Universitat d´Alacant. 2006.

Let 9Q denote the maximum likelihood estimated parameters under the null.
Evaluating ej, Ej, Kt and St\t at OQ, we obtain'ej, T,t, Kt and 'st\t. We next construct
the standardized residuals by setting
STEP 3: To construct the bootstrap data set, we use equations (2.7) and (2.8).
Let F , H and D be the matrices of coefficients evaluated at 6*0. Ki is the Kalman gain
matrix obtained in step 2, and the bootstrap errors {e¿,í = 1, ...,T} are indepen
dent values obtained by resampling, with replacement, from the set of standardized
residuals {etA = 1, . . . ,T}. so|o = 0 contains the first 3 values of the state variables
(thus, these are prespecified and set equal to the initial conditions for the Kalman
filter). The remaining elements of the vector St\t-^i are constructed by computing a
first-order autoregressive given by (2.7):
The vector yt is constructed by computing a first-order autoregressive process, with
initial conditions fixed at the observed values, and then by adding the results to the
corresponding elements of St\t-i- That is, the row ith of y is given by (2.8):
y; = Hsl^,_,+DyU+t]"el
All initial conditions are kept fixed throughout the bootstrap replications.
STEP 4: The bootstrap sample {yl,t — 1, ...,T} is then used to re-estimate the
parameters under Hi. The algorithm employed to estimate the bootstrap threshold
parameter 7* and the delay lag d* proceeds as in Step 1, where the threshold variable
is given by U^^-^ — U^_¿*. Let 6j{'y*,d*) denote the estimator of 61 when using the
bootstrap sample. We then compute the pointwise Wald test statistic associated
with the bootstrap sample as
68
Three essays on specification testing in econometric models. Alicia Pérez Alonso.
Tesis doctoral de la Universidad de Alicante. Tesi doctoral de la Universitat d´Alacant. 2006.

* — ^ - ^ * . T -—v+
W*{^*,d*) = Re,{Y,d*){RVar{e,{Y,d*))R')-\Rej{-f*,d*)y,
and the supW* test as
supW* = sup W*{Y,d* (7»,d*)eA*
STEP 5: Repeating steps 3 and 4 for 6 = 1,..., 5 , gives a sample {supW* : 6 =
1,..., B} of s«pVF values. This sample mimics a random sample of draws of supW
under the null hypothesis. We compute the bootstrap p-value as PB =card(s«pVF* >
supW)/B, that is the fraction of supW* values that are greater than the observed
value supW.
We carry out B = 1000 bootstrap replications.
2.3.3 Heteroskedastic bootstrap
Our aim here is to calculate a bootstrap distribution of the Wald test allowing
for the possibility of general heteroskedasticity. The algorithm is similar to the
one described above, but replacing the resampling scheme in step 3. In particular,
the resampling we propose is based on the idea of the wild bootstrap, which was
studied for the first time by Wu (1986) in the context of variance estimation in
heteroskedastic linear models. In our context, it looks like this:
Step 3': We propose the following algorithm to generate the bootstrap sample
{y¡,t = l,...,T}:
I. Generate r]^ independent and identically distributed variables from a fixed
distribution®, such that E{r]f) = 0 and E[{r]^y] = E[{r]^)^] = 1. Define e¿ = €¿77 ,
where et is the tth residual calculated in step 2. The bootstrap errors e¿ satisfy
E*{e^) = 0 and E*[{e'¡y] = (et^, where E* denotes the expectation under bootstrap
distribution.
^In particular, the variable rj^ was sample from Mammen's (1993. p.257) two-point distribution attaching masses (5 + \/5)/10 and (5 - \/5)/10 at the points ~(VE - l ) /2 and (v^S -|- l ) /2 , respectively.
69
Three essays on specification testing in econometric models. Alicia Pérez Alonso.
Tesis doctoral de la Universidad de Alicante. Tesi doctoral de la Universitat d´Alacant. 2006.

II. We set the initial condition so|o = 0 and, for t = 2,...,T, set sl_^ui =
St_i|i„i, that is, unobserved bootstrap components are generated with conditionally
set design on the estimated unobserved components in step 2,
s*t\t-i ^Fst-i\t-i + FKtel
III. To define the bootstrap observations, we use a conditional resampling on
{y~i,yo,yi,---,yT^i),
y¡ = Hst\t-i + Dyt^i + e*.
2.3.4 Monte Carlo evidence
In this section we report on a Monte Carlo simulation study designed to evaluate
the small sample performance of both homoskedastic and heteroskedastic bootstrap
procedures in the problem of testing for linearity. We start with a brief description
of the design of the experiment, then proceed with the discussion of the results.
Design of the experiment
The time series considered in our analysis are generated according to the state-
space model given by equations (2.5) and (2.6), under the null and the alternative
hypotheses. Let MQ and Mi denote the class of linear and nonlinear state-space
models, respectively. In our experiments, we use MQ and Mi with (e^,ef,ef) '
iidA^(0,O), where
n al 0 0 0 al 0 0 0 (7¿
as the data-generating process (DGP). We test the null hypothesis of linearity. As
discussed at the end of Section 2, the null hypothesis is true if and only if aj = «2.
Hence, MQ is nested in Mi. We use the statistic supW based on an estimated
Ml setting d = 2, and compute the p-value using both the homoskedastic and the
heteroskedastic bootstrap procedures. The size of the test is investigated when the
70
Three essays on specification testing in econometric models. Alicia Pérez Alonso.
Tesis doctoral de la Universidad de Alicante. Tesi doctoral de la Universitat d´Alacant. 2006.

data are generated according to MQ, while turning to the power properties of the
test under Mi.
To ensure the relevance of the simulations, the parameter values are chosen to
correspond to models that have been fitted successfully to real-world time series.
More specifically, the selected parameters are chosen according to the corresponding
estimated model for U.S. under the null, and for France under the alternative:
DGPo : 00 = (0.049, 0.246,0.842,1.472, 0.285, 0.162, -1.498,0.506)'.
DGPi : 01 = (0.436,0.157,0.5,4.1,1.106,0.117,0.337,-0.460,0.688)'; 7 = 0.16.
To study the effect of the size of the difference «i — «2 on the performance of
the test, we vary «i between (1.306,1.506,1.706,2.106), while a2 remains constant
at its fixed value. Each of these values gives rise to DGP2~DGP^, respectively.
The experiments proceed by generating artificial series of length T+50 according
to Mo or Ml with T = 150, and initial values set to zero. We then discard the
first 50 pseudo-data points in order to attenuate the effect of initial conditions and
the remaining T points are used to compute the test statistic. We simulate the
proportion of rejections of the test at the 5%, 10% and 20% significance levels.
The estimation of the rejection probabilities is calculated from B = 99 bootstrap
replications and R = 500 simulation runs. The processing time becomes excessive
when greater values of B or R are used.
Simulation results
In Table 1 we present simulation evidence concerning the empirical size and power
of the test. We observe a reasonable approximation of the nominal level at all signif
icance levels considered. Deviations from the null hypothesis are detected with high
probability across the various parameterizations. We observe that in all cases under
consideration the test based on the homoskedastic bootstrap approach yields slightly
lower rejection probabilities than the heteroskedastic bootstrap test. It should be
emphasized that this happens even though the model generated is homoskedastic.
71
Three essays on specification testing in econometric models. Alicia Pérez Alonso.
Tesis doctoral de la Universidad de Alicante. Tesi doctoral de la Universitat d´Alacant. 2006.

As expected, the performance of both bootstrap procedures improves as the differ
ence between the values of parameters in the two regimes increases.
2.4 Empirical results
Our study concerns Italy, France and the United States. The economic series em
ployed are the quarterly unemployment rate (U) and real gross domestic product
(GDP). Data for Italy (running from 1970:1 through 2002:1), France (1978:1-2002:1)
and U.S. (1965:1-2002:1) come from OECD Main Economic Indicators. All data are
obtained as seasonally adjusted and all the variables except the unemployment rate
are in natural logs.
We have decomposed the unemployment rate assuming that the natural rate
contains a unit root. This assumption must be tested. To do this, we employ the
Phillips-Perron test for unit roots. We obtain that unemployment rates display non-
stationary behaviour for all countries. We also perform the unit root test for the
GDP series, which also displays non-stationary behaviour for all countries. Results
are presented in Table 2.
Tests for hysteresis are reported in Table 3. The p-values presented in Table 3
are calculated following the bootstrap technique described in Section 3. For compar
ison reasons, we also report the ;?-values obtained with the linear model. Diagnosis
checking of the residuals of the linear modeF leads us to implement a heteroskedastic
bootstrap for the U.S. and a homoskedastic bootstrap for France and Italy. Accord
ing to bootstrap p-values, the hysteresis effect is significant at the 5% level for
Italy and France. As argued in Section 2, under the presence of nonlinearity, JP's
model may lead to obtain spuriously good inference results. In fact, note that JP's
methodology fails to detect hysteresis for the case of France. This result stresses the
importance of testing linearity before fitting any statistical model.
'^The assumptions underlying the errors of the linear model are tested via appropriate autocorrelation, heteroskedaticity and normality test statistcs, which are available from the authors upon request. We find evidence in favour of non-autocorrelation in all countries. Evidence against homoskedasticity is only found in the U.S..
72
Three essays on specification testing in econometric models. Alicia Pérez Alonso.
Tesis doctoral de la Universidad de Alicante. Tesi doctoral de la Universitat d´Alacant. 2006.

Results concerning the estimated models for Italy and Prance are available in Ta
bles 4 and 5. For the case of Italy, the maximum likelihood estimate of the threshold
parameter is 7 = 0.1, with a 90% bootstrap confidence interval [0.015,0.266]. Our
estimate of the delay parameter is d = 2. Hence, the threshold model splits the
regression into two regimes depending on whether or not the threshold variable is
higher than this threshold parameter. That is, we consider we are in regime 1 when
Ut-i — f/i-2 ^ 0.1 and in regime 2 when Ut^i — Ut-2 < 0.1 (see Figure 2.2). For
Italy, there are less observations in regime 1 (41%) than in regime 2 (59%), which
means that this country spent more periods of time in the favorable regime. This is
also the case for France. Analyzing the estimated hysteresis parameter, we observe
a point of great interest. Both parameters are positive and the one associated with
Regime 1 is greater than that of Regime 2. This points to asymmetric responses
of the natural rate as regards cyclical unemployment movements in the following
direction: the natural rate does not decrease in favorable cyclical periods as much
as it increases in unfavorable cyclical periods. The size of the coeflacients suggests
that this mechanism is more pronounced in France than in Italy. In fact, for Italy,
the natural rate decreases (2.76%) in unfavorable periods, while a cyclical shocks
have an impact of (1.85%) in favorable periods. For France, these values are (4.1%)
and (1.11%), respectively.
It is worth analyzing the U.S. separately. The information concerning the model
estimated is provided in Table 6. According to the hysteresis test, we can not reject
the null of linearity. However, as we mentioned in Sections 1 and 2, there is still a
place for persistence. In fact, we find evidence in favour of it, given that parameter
a is significant at 5%. Hence, though there is no hysteresis, cyclical shocks have a
significant impact on the natural rate. In particular, if the economy experiences a
cyclical unemployment rate of 1% the natural rate increases by a 1.472%.
73
Three essays on specification testing in econometric models. Alicia Pérez Alonso.
Tesis doctoral de la Universidad de Alicante. Tesi doctoral de la Universitat d´Alacant. 2006.
2.5 Conclusions
The aim of this paper is twofold. First, to take into account the nonhnear feature
of a hysteretic process we propose a definition of hysteresis taken from Physics. To
provide an operational statistical framework for our concept of hysteresis we use
the unobserved components approach, which decomposes unemployment rate into a
non-stationary natural component and a stationary cyclical component. We extend
the model of Jaeger and Parkinson (1994) by introducing nonlinearities into the
specification of the natural rate component. We do this by allowing past cyclical
unemployment to have a different eñ'ect on the current natural rate depending on
the regime of the economy. To estimate the model we use a modified Kalman filter
that incorporates a sample partition that corresponds to two difi^erent regimes. The
procedure for identifying these regimes is related to the TAR methodology. Under
this framework, a test for hysteresis becomes a test for linearity. Second, when we
implement a test for linearity a problem of unidentified nuisance parameters arises
since the threshold parameter and the delay lag of the threshold variable are only
identified under the alternative hypothesis of hysteresis. As a result, the standard
asymptotic distributions of the classical tests are unknown under the null. Our
objective is to implement a correct test for the relevant null hypothesis of a one-
regime model. We rely on bootstrapping techniques to calculate an appropriate
p-value for the decision rule. We propose two bootstrap procedures: the first is
valid if the errors in our model are homoskedastic and the second allows for general
forms of heteroskedasticity. In a Monte Carlo simulation study, both bootstrap
approximations of the linearity test are investigated in greater detail, and we find
that they work quite well. Our study concerns Italy, France and the United States.
For European countries, we reject the null of linearity. This is related to the presence
of hysteresis. On the other hand, for the United States we reject the hysteresis
hypothesis. We find symmetric responses of the natural rate as regards to cyclical
fluctuations in unemployment.
74
Three essays on specification testing in econometric models. Alicia Pérez Alonso.
Tesis doctoral de la Universidad de Alicante. Tesi doctoral de la Universitat d´Alacant. 2006.

REFERENCES
Amable, B., Henry, J., Lordon, F., Topol, R., 1995. Hysteresis revisited: a Method
ological Approach. In Cross, R. (ed): The natural rate of Unemployment. Cam
bridge University Press.
Anderson, B.D.O., Moore, J.B., 1979. Optimal Filtering. Prentice-Hall.
Andrews, D.W.K., Ploberger, W., 1994. Optimal tests when a nuisance parameter
is present only under the alternative. Econometrica 62, 1383-1414.
Blanchard, O.J., Summers, L.H., 1986. Hysteresis and the European Unemployment
Problem. NBER Macroeconomics Annual, Vol. I, MIT Press, Cambridge MA, pp.
15-78.
Blanchard, O.J., Summers, L.H., 1987. Hysteresis in Unemployment. European
Economic Review 31, 288-295.
Brunello, G., 1990. Hysteresis and "the Japanese unemployment problem": a pre
liminary investigation. Oxford Economic Papers 42, 483-500.
Chan, K.S., 1990. Testing for Threshold Autoregression. The Annals of Statistics
18, 1886-1894.
Davies, R.B., 1987. Hypothesis testing when a nuisance parameter is present only
under the alternative. Biometrika 74, 33-43.
Friedman, M., 1968. The Role of Monetary Policy. The American Economic Review,
1-17.
Hall, P., 1992. The Bootstrap and Edgeworth expansion. Springer Series in Statis
tics.
Hamilton, J.D., 1994. Time Series Analysis. Princeton.
Hansen, B.E., 1996. Inference when a nuisance parameter is not identified under
the null hypothesis. Econometrica 64, 413-30.
Harvey, A.C., 1989. Forecasting, structural time series models and the Kalman
filter. Cambridge University Press.
75
Three essays on specification testing in econometric models. Alicia Pérez Alonso.
Tesis doctoral de la Universidad de Alicante. Tesi doctoral de la Universitat d´Alacant. 2006.

Jaeger, A., Parkinson, M., 1994. Some evidence on Hysteresis in Unemployment
Rates. European Economic Review 38, 329-42.
León-Ledesma, M., 2002. Nonlinearities and unit roots in OECD unemployment.
Revista Brasileira de Economía de Empresa (Brazilian Review of Economics and
Business) 2, 23-30.
León-Ledesma, M., McAdam, P., 2004. Unemployment, Hysteresis and Transition.
Scottish Journal of Political Economy 51, 277-401.
Mammen, E., 1993. Bootstrap and Wild Bootstrap for High-Dimensional Linear
Models. The Annals of Statistics 21, 255-85.
Mitchell, W.F., 1993. Testing for unit roots and persistence in OECD unemployment
rates. Applied Economics 25, 1489-1501.
Papell, D.H., Murray, C.J., Ghiblawi, H., 2000. The structure of unemployment.
The Review of Economics and Statistics 82, 309-315.
Phelps, E.S., 1972. Inflation Policy and Unemployment theory: The Cost-Benefict
Approach to Monetary Planning. W.W. Norton, New-York.
Proietti T., 2004. Unobserved Components Models with Correlated Disturbances.
Statistical Methods and Applications 12, 277-292.
R0ed, K., 1997. Hysteresis in Unemployment. Journal of Economic Surveys 11,
389-418.
Song, F.M., Wu, Y., 1997. Hysteresis in unemployment: evidence from 48 U.S.
states. Economic Inquiry 35, 235-244.
Stoffer, D.S., Wall, K.D., 1991. Bootstrapping state-space models: Gaussian maxi
mum likelihood estimation and the Kalman filter. Journal of the American Statis
tical Association 86, 1024-1033.
Tong, H., 1990. Nonlinear Time Series: a Dynamical System Approach. Oxford
University Press.
76
Three essays on specification testing in econometric models. Alicia Pérez Alonso.
Tesis doctoral de la Universidad de Alicante. Tesi doctoral de la Universitat d´Alacant. 2006.

Wu, C.F.J., 1986. Jackknife, Bootstrap and Other Resampling Methods in Regres
sion Analysis. The Annals of Statistics 14, 1261-95.
77
Three essays on specification testing in econometric models. Alicia Pérez Alonso.
Tesis doctoral de la Universidad de Alicante. Tesi doctoral de la Universitat d´Alacant. 2006.

TABLES AND FIGURES
Table 1: Monte Carlo Results Nominal size Simulated size DGPo Homoskedastic bootstrap Heteroskedastic bootstrap
Simulated power DGPi : «1 — Q;2 = 3 Homoskedastic bootstrap Heteroskedastic bootstrap
DGP2 : «1 - «2 = 0.2 Homoskedastic bootstrap Heteroskedastic bootstrap
DGP3 : cti - «2 = 0.4 Homoskedastic bootstrap Heteroskedastic bootstrap
DGPi : «1 - «2 = 0.6 Homoskedastic bootstrap Heteroskedastic bootstrap
DGF5 : «x - «2 = 1 Homoskedastic bootstrap Heteroskedastic bootstrap
5%
0.042 0.045
0.739 0.757
0.089 0.126
0.155 0.164
0.279 0.216
0.495 0.499
10%
0.092 0.091
0.800 0.856
0.111 0.121
0.158 0.177
0.292 0.316
0.498 0.543
20%
0.203 0.195
0.826 0.879
0.136 0.150
0.169 0.183
0.333 0.351
0.505 0.587
78
Three essays on specification testing in econometric models. Alicia Pérez Alonso.
Tesis doctoral de la Universidad de Alicante. Tesi doctoral de la Universitat d´Alacant. 2006.

Table 2: Unit Root Tests
Phillips-Perron test on GDP series Italy -2.743 ~ Prance 0.888 U.S. -0.365
Phillips-Perron test on Unemployment series
Italy -1.716 Prance -2.593 U.S. -2.089
Note 1: For the Phillips-Perron test, we use Mackinnon critical values for rejecting the hy
pothesis of a unit root. We do not reject the null hypothesis of a unit root at 1%, 5% or 10%.
Table
Italy France U.S.
3 : Tests for the Hysteresis Assumption Nonlinear Model HQ : ai = Q!2
Bootstrap j9-value=0.0375* Bootstrap p-value=0.033* Bootstrap p-value=0.890
Linear Model iio : a = 0
p-value=0.015* j9-value=0.204 j9-value=0.000*
"Significant at 5%
79
Three essays on specification testing in econometric models. Alicia Pérez Alonso.
Tesis doctoral de la Universidad de Alicante. Tesi doctoral de la Universitat d´Alacant. 2006.
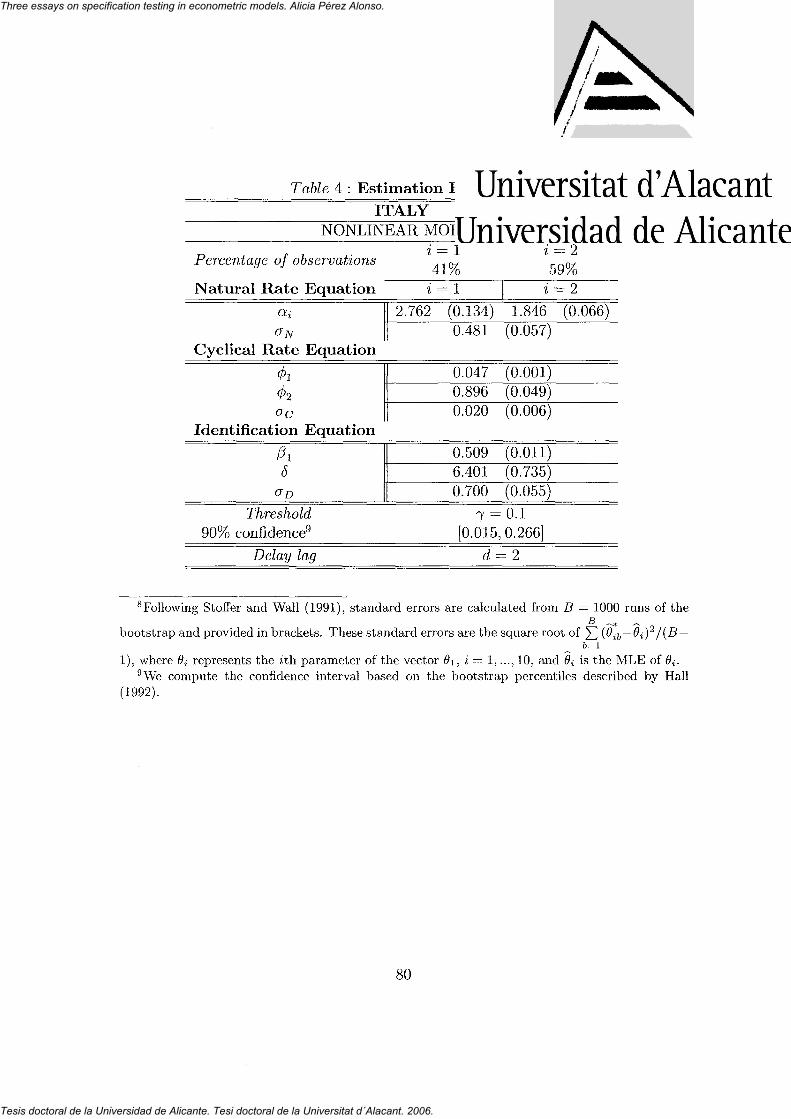
Table 4 : Estimation Results^ ITALY
NONLINEAR MODEL
Percentage of observations
Natural Rate Equation ai
Cyclical Rate Equation </>!
02
Identification Equation
/5i 5
O-D
Threshold 90% confidence^
Delay lag
1=1 1=2
41% 59% i
2.762 = 1 i = 2
(0.134) 1.846 (0.066) 0.481 (0.057)
0.047 (0.001) 0.896 (0.049) 0.020 (0.006)
0.509 (0.011) 6.401 (0.735) 0.700 (0.055)
7 = 0.1 [0.015,0.266]
d = 2
* Following StofFer and Wall (1991), standard errors are calculated from B = 1000 runs of the
bootstrap and provided in brackets. These standard errors are the square root of ^ {O^j^ — Oi) /{B —
1), where 9i represents the ith parameter of the vector 0i, i = 1,..., 10, and 9i is the MLE of 0¿. "We compute the confidence interval based on the bootstrap percentiles described by Hall
(1992).
80
Three essays on specification testing in econometric models. Alicia Pérez Alonso.
Tesis doctoral de la Universidad de Alicante. Tesi doctoral de la Universitat d´Alacant. 2006.

Table 5 : Estimation Results^" FRANCE
NONLINEAR MODEL
Percentage of observations
Natural Rate Equation Oii
Cyclical Rate Equation
01 02 0-c
Identification Equation
Pi 5
0"D
Threshold 90% confidence"
Delay lag
i=l i=2 44% 56%
i = 4.100
= 1 z = 2 (0.213) 1.106 (0.022) 0.436 (0.035)
0.117 (0.041) 0.337 (0.056) 0.157 (0.074)
0.688 (0.069) -0.460 (0.052) 0.500 (0.033)
7 = 0.16 [0.123,0.532]
d = 3
^''Following Stoifer and Wall (1994). standard errors are calculated from B = 1000 runs of the
bootstrap and provided in brackets. These standard errors are the square root of "^ {(^ib~()i) /{B —
1), where 9i represents the ¿th parameter of the vector 9i, i = 1...., 10, and 9i is the MLE of 9i. ^HVe compute the confidence interval based on the bootstrap percentiles described by Hall
(1992).
81
Three essays on specification testing in econometric models. Alicia Pérez Alonso.
Tesis doctoral de la Universidad de Alicante. Tesi doctoral de la Universitat d´Alacant. 2006.

Table 6 : Estimation Results^^ U.S.
LINEAR MODEL Natural Rate Equation
«(«)
Cyclical Rate Equation
01 02
Identification Equation
Pi 5
C^D
1.472 0.049
0.285 0.162 0.246
0.506 -1.498 0.842
(0.297) (0.165)
(0.200) (0.130) (0.061)
(0.059) (0.660)
(0.077)
(a) The Wald test statistic for the null hypothesis ( a = 0) is distributed chi-square with 1
degree of freedom under the null. It is significant at 5%.
^ Standard errors are calculated from a consistent MLE of the variance-covariance matrix and provided in brackets.
82
Three essays on specification testing in econometric models. Alicia Pérez Alonso.
Tesis doctoral de la Universidad de Alicante. Tesi doctoral de la Universitat d´Alacant. 2006.

Figure 2.1: Unemployment Rate
83
Three essays on specification testing in econometric models. Alicia Pérez Alonso.
Tesis doctoral de la Universidad de Alicante. Tesi doctoral de la Universitat d´Alacant. 2006.

Figure 2.2: Threshold variable: Ut^i — Í7._T and 7.
84
Three essays on specification testing in econometric models. Alicia Pérez Alonso.
Tesis doctoral de la Universidad de Alicante. Tesi doctoral de la Universitat d´Alacant. 2006.

Chapter 3
Specification Tests for the Distribution of Errors in Nonparametric Regression: a Martingale Approach
3.1 Introduction
Specification tests for the distribution of an observable random variable has a long
tradition in Statistics. However, there are many situations in which the random vari
able of interest for the researcher is a non-observable regression error. For example,
in Economics, the productivity of a firm is defined as the error term of a regression
model whose dependent variable is firm profits; and, in Finance, the return of an
asset in a period is usually defined as the error term of a dynamic regression model.
In contexts such as these, knowing whether the distribution of the error term belongs
to a specified parametric family or not may be crucial to achieve efficient estima
tion, to determine certain characteristics of interest (such as percentiles or number
of modes) of the error term, or to design an efficient boostrap procedure. This is
the problem that we study in this paper.
Let us describe the specific framework that we consider. Let {X,Y) be a bivariate
continuous random vector such that E{Y'^) is finite, and denote m{x) = E{Y\X =
x) and a'^{x) =Var(y|X = x). We can consider then the error term e = {¥ —
85
Three essays on specification testing in econometric models. Alicia Pérez Alonso.
Tesis doctoral de la Universidad de Alicante. Tesi doctoral de la Universitat d´Alacant. 2006.

Chapter 3 Specification Tests for the Distribution of Errors in Nonparametric Regression
m{X)}/a{X), which is, by definition, a zero-mean unit-variance random variable.
The objective of this paper is to describe how to test a parametric specification about
the cumulative distribution function (c.d.f.) of e, making no parametric assumptions
about the conditional mean function m(-) or the conditional variance function a^{-).
Specifically, if F(-) denotes the c.d.f. of £ and JP" = {F{-, 9), 9 e Q C M™} denotes
a parametric family of zero-mean unit-variance continuous c.d.f.'s, each of them
known except for the parameter vector 9, we propose a testing procedure to face the
hypotheses Ho : 3 ^0 e e such that F(-) - F{-. 9o)
vs. Hi : F(-) ^ T,
assuming that independent and identically distributed observations {(Xi,l¿)}^^j,
with the same distribution as {X,Y), are available. The testing procedure that we
propose here could also be used, with appropriate changes, if the family JF reduces
to one known c.d.f. (i.e. when there is no unknown parameter 9), or if the error
term that is to be analyzed is defined by removing only the conditional mean (i.e.
when we consider the error term Y — m{X)). The specific test statistics that should
be used in these more simple contexts are discussed below.
The testing problem that we study in this paper can also be considered as an
extension of the classical goodness-of-fit problem. Suppose that a parametric speci
fication for the c.d.f. of an observable continuous variable Y is rejected using a tradi
tional nonparametric goodness-of-fit statistic, such as the Kolmogorov-Smirnov one;
one of the drawbacks of these statistics is that the rejection of the null hypothesis
gives no intuition about the cause of the rejection. In this situation, it would be of
interest to examine if the only reason why the null hypothesis has been rejected is
because the parametric family fails to capture appropriately the behaviour in mean
of y ; if we want to check whether this is the case, then we would have to analyze
if the parametric specification is appropriate for Y — m{X). li the null hypothesis
were rejected again, we might be interested in going one step further and testing
whether the parametric family fails to capture appropriately the behaviour in mean
and variance of Y; thus, we would have to analyze if the parametric specification is
appropriate for {Y — m{X)}/a{X), and this is precisely the testing problem that
86
Three essays on specification testing in econometric models. Alicia Pérez Alonso.
Tesis doctoral de la Universidad de Alicante. Tesi doctoral de la Universitat d´Alacant. 2006.
Chapter 3 Specification Tests for the Distribution of Errors in Nonparametric Regression
we consider here.
The test statistics that we propose in this paper can be motivated by studying
the relationship between our problem and the classical goodness-of-fit problem. If
the error term e were observable and parameter 9Q were known, our test would be
the classical goodness-of-fit test. In our context, the unobservable errors must be re
placed by residuals, which must be derived using nonparametric estimations of m(-)
and (j'^{-) since no parametric form for these functions is assumed, and parameter
6Q must be replaced by an appropriate estimator, say 0. Thus, we could think of
using as a statistic for our test any of the traditional nonparametric goodness-of-fit
statistics, but computing it with nonparametric residuals and the estimator 6. How
ever, it is well-known in the literature that the consequence of replacing errors by
parametric residuals and parameters by estimators in goodness-of-fit tests is that the
resulting statistics are no longer asymptotically distribution-free (see e.g. Durbin,
1973 or Loynes, 1980); furthermore, the asymptotic null distributions usually depend
on unknown quantities and, hence, asymptotic critical values cannot be tabulated.
In this paper we prove that this is also the case when nonparametric residuals are
used, and we discuss how this problem can be circumvented in our testing problem.
Specifically, using the results derived in Akritas and Van Keilegom (2001), we derive
the asymptotic behaviour of goodness-of-fit statistics based on nonparametric resid
uals and estimators; and then, following the methodology introduced in Khmaladze
(1993), we derive the martingale-transformed test statistics that are appropriate in
our context.
The rest of the paper is organized as follows. In Section 2 we introduce the em
pirical process on which our statistics are based and derive its asymptotic properties.
In Section 3 we describe the martingale transformation that leads to asymptotically
distribution-free test statistics. In Section 4 we report the results of a set of Monte
Carlo experiments that illustrate the performance of the statistics with moderate
sample sizes. Some concluding remarks are provided in Section 5. All proofs are
relegated to an Appendix.
87
Three essays on specification testing in econometric models. Alicia Pérez Alonso.
Tesis doctoral de la Universidad de Alicante. Tesi doctoral de la Universitat d´Alacant. 2006.

Chapter 3 Specification Tests for the Distribution of Errors in Nonparametric Regression
3.2 Statistics based on the estimated empirical process
If we had observations of the error term {£¿}f ^ and parameter o were known, we
could use as a statistic for our test the asymptotic Kolmogorov-Smirnov statistic
Kn or the Cramer-von Mises statistic Cm which are defined by
K^ = n i /2sup |F„(2)-F(^ ,^o) | , zeM
n Cn = 5]{i;(£,)-F(£,,^0)f,
¿=1
where -F„(-) denotes the empirical c.d.f. based on {ei}^^^. Both Kn and C„, are
functionals of the so-called empirical process V„(-), defined for 2; G M by
n
V„(^) = n-1/2 5^{/(£, <z)- F{z, Oo)},
where /(•) is the indicator function. Hence, the asymptotic properties of K^ and Cn
can be derived by studying the weak convergence of the empirical process V„(-). In
our context, the test statistics must be constructed replacing errors by residuals and
the unknown parameter by an estimator. Since no parametric assumption about the
conditional mean m(-) or the conditional variance cP'i^ is made, the residuals {EÍYÍ=\
must be constructed using nonparametric estimates of these functions. Specifically,
we consider Nadaraya-Watson estimators, i.e.
n
¿=1
1=1
where Wi{x, hn) = K{{x — Xi)/hn}/ Yll=i -^{(^ ~ ^j)/hn}, K{-) is a known kernel
function and {hn} is a sequence of positive smoothing values. With these estimates
we construct the nonparametric residuals £j = {Yi — m{Xi)}/a{Xi). On the other
hand, the unknown parameter must be replaced by an appropriate estimator 0; we
discuss below the asymptotic properties that 0 must satisfy. Using this estimator
Three essays on specification testing in econometric models. Alicia Pérez Alonso.
Tesis doctoral de la Universidad de Alicante. Tesi doctoral de la Universitat d´Alacant. 2006.

Chapter 3 Specification Tests for the Distribution of Errors in Nonparametric Regression
and the nonparametric residuals, we can define now the statistics
zeiR I n
where -F„(-) denotes the empirical c.d.f. based on {ej}"^^. Both Kn and Cn are
functionals of the process V„(-), defined for 2; G M by
n
This process will be referred to as the "estimated empirical process". First of all
we discuss the asymptotic relationship between the empirical process V„(-) and the
estimated empirical process V„(-), since this relationship will be crucial to establish
the asymptotic behaviour of íí„ and Cn- The following assumptions will be required:
Assumption 1: The support oí X, hereafter denoted Sx, is bounded, convex and
has non-empty interior.
Assumption 2: The c.d.f. of X, denoted Fx{-)i admits a density function fx{-)
that is twice continuously differentiable and strictly positive in Sx-
Assumption 3: The conditional c.f.d. oiY\X = x, hereafter denoted F(-|x),
admits a density function f{-\x). Additionally, both F{y\x) and f{y\x) are
continuous in [x, y), the partial derivatives ^f{y\x), •^F{y\x), ^F{y\x) exist d and are continuous in {x, y), and sup . , \yf{y\^)\ < 00, sup^, ^ \y-^F{y\x)\ < 00,
sup^.y \y^-§^f{y\^)\ < oo> s^Px,y \y^£2F{y\x)\ < oo.
Assumption 4: The functions m{-) and o" (-) are twice continuously differentiable.
Additionally, there exists C > 0 such that infa;gs^ a^{x) > C.
Assumption 5: The kernel function K{-) is a symmetric and twice continuously
differentiable probability density function with compact support and J uK(u)áu
0.
89
Three essays on specification testing in econometric models. Alicia Pérez Alonso.
Tesis doctoral de la Universidad de Alicante. Tesi doctoral de la Universitat d´Alacant. 2006.

Chapter 3 Specification Tests for the Distribution of Errors in Nonparametric Regression
Assumption 6: The smoothing value hn satisfies that n/i^ = o(l), nh^^/log h~^ =
0(1) and log h-y{nhl+^^) = o(l) for some 5 > 0.
Assumption 7: The c.d.f F{-, 9) admits a density function /(•, 9) which is positive
and uniformly continuous in M. Additionally, /(•,•) is twice differentiable with
respect to both arguments, F{-,-) has bounded derivative with respect to the
second argument and sup^gu \zf{z,9)\ < oo for every 9 E Q.
Assumption 8: If HQ holds, then there exists a function •0(-, •, •) such that •n}l'^{9 —
Oo) = n-^/^J2'^^,i^{X,,£„9o) + Op{l). Additionally, E{i;{X,e,9o)} = 0, O =
E{ip{X, e, 9o)tp{X, e, 9Q)'} is finite, IIJ{-, •, •) is twice continuously differentiable
with respect to the second argument.and sup^gjj \-^'ip{x, z,9)\ < co.
Assumption 9: If Hi holds, then there exists 9^ G M" such that 'n}^^{9 ~ 9^) =
0,(1).
Assumptions 1-6, which are similar to those introduced in Akritas and Van Kei-
legom (2001), guarantee that the nonparametric estimators of the conditional mean
and variance behave properly. Assumption 7 allows us to use mean-value arguments
to analyze the effect of introducing the parametric estimator 9. Assumptions 8-9
ensure that the parametric estimator behaves properly both under HQ and Hi.
Our first proposition states an "oscillation-like" result between the empirical
process and the estimated empirical process in our context.
Proposition 1: If HQ holds and assumptions 1-8 are satisfied then
sup zeR
V „ ( z ) - { V n ( z ) + A i „ ( z ) + A2n{z) - A 3 „ ( z ) } = 0 , ( 1 )
where AU^) = f[zMn-'^'T.U{ivÁX^^y^)+^ln},
A2n{z) = zf{z, 9o)n-'/' i:tiW2{X..Y^ + P^J, Asn{z)~Feiz,9oyn'/\d-9o),
and Fe{z, 9) = §^F{z, 9), ip^{x, y) = -a{x)-^ ¡{I{y < v)-'F{v\x)}dv, ip^ix, y)
—a{x)~~^f{v — m{x)}{I{y < v) — F{v\x)}dv, and, for j = 1,2, (3j^ =
lhl{Ju^K{u)du}E{cpj^^{X,Y)}, iPj^^{x,y) = ¿ipj{x,y).
90
Three essays on specification testing in econometric models. Alicia Pérez Alonso.
Tesis doctoral de la Universidad de Alicante. Tesi doctoral de la Universitat d´Alacant. 2006.

Chapter 3 Specification Tests for the Distribution of Errors in Nonparametric Regression
Note that processes Ain(-) and A2n(-) arise as a consequence of the nonpara
metric estimation of the conditional mean and variance, respectively, whereas A3„(-)
reflects the effect of estimating ^o- The following theorem states the asymptotic be
haviour of Kn and Cn-
Theorem 1: Suppose that assumptions 1-1 hold. Then:
a) If Ho holds and assumption 8 is satisfied then:
K„^sup|D(i)| and C^ ^ í{D{t)Ydt, Í6K J
where D{-) is a zero-mean Gaussian process on M with covariance structure
Cov{D{s), D{t)} = F(min(s, i), ^o) - F{s, eo)F{t Bo) + H{s, t, 9o),
and
H{s, t, Oo) = f{s, 9o)[E{I{e < t)e} + f £;{J(e < t){e^ - 1)}] +f{t,9o)[E{I{6 < s)e} + \E{I{e < s){e'' - 1)}] + / (5 , ^o)/(i, ^o)[l + '-^E{e^) -h ^i{E{é) - 1}] -Fe{s,9oyE{I{e <t)iP{X,e,eQ)} -Fe{t,9o)'E{I{s < s)i;{X,s,9o)} -f{s, 9o)Fe{t, 9oy[E{i;{X, e, 9o)e} + fi?{^(X, e, 9o){e^ - 1)}] -fit,9o)Fe{s,9oy[E{,k{X,e, 0o)e} + ¡E{^ÁX,e,9o){e^ - 1)}] +Fe{s,9o)'^Fe{t,9o).
b) If Hi holds and assumption 9 is satisfied then, 'i c EM.,
P{kn > c) ^ 1 and P{dn > c) ^ 1.
Since the covariance structure of the limiting process depends on the underly
ing distribution of the errors and the true parameter, it is not possible to obtain
asymptotic critical values valid for any situation. To overcome this problem, in the
next section we propose to consider test statistics that are based on a martingale
transform of the estimated empirical process, in the spirit of Khmaladze (1993), Bai
(2003) and Khmaladze and Koul (2004).
91
Three essays on specification testing in econometric models. Alicia Pérez Alonso.
Tesis doctoral de la Universidad de Alicante. Tesi doctoral de la Universitat d´Alacant. 2006.

Chapter 3 Specification Tests for the Distribution of Errors in Nonparametric Regression
3.3 Statistics based on a martingale-transformed process
As Proposition 1 states, three new processes appear in the relationship between the
estimated empirical process V„(-) and the true empirical process V„(-). These three
additional processes stem from the estimation of the conditional mean, the condi
tional variance and the unknown parameter. If we follow the methodology described
in Bai (2003), this relationship leads us to consider the martingale-transformed
process
Wn{z) = n^'^{Fn{z)~ f q{u)'C{uY^dn{u)f{u,eo)áu), J —oo
where
q{u) = (1, Uu, eo)/fiu, 9o),l + ufuiu, 9o)/f{u, Oo), fe{u, OoY/fiu, Oo))', C{u)^J^°°q{r)q{ryf{r,9o)dr,
4(«) ^ /;°° q{r)dF^{r) = n^' Y.U ( ^ > ^W^)-^
and fu{u,6) = •§^f{u,9), fe{u,9) = -§^f{u,9). Since process W„(-) depends on
the unknown parameter 9Q, we cannot use it to construct test statistics; obviously,
the natural solution is to replace again 6*0 by 9. Thus, we consider the estimated
martingale-transformed process W„(-), defined in the same way as W„(-), but re
placing ^0 by 9. With this estimated process we can construct the Kolmogorov-
Smirnov and Cramér-von-Mises martingale-transformed statistics
Kn = sup W„(2)
n
£i}^.
i=l
The asymptotic behavior of these statistics can be derived studying the weak con
vergence of W„(-). The following additional assumptions, which ensure that the
martingale transformation can be performed and behaves properly, are required.
Assumption 10: C(M) is a non-singular matrix for every u G [—oo, -|-oo).
+00
Assumption 11: If HQ holds, then J \\q0{u)\\'^f{u,9o)du = Op{l), where qg{-) ~oo
denotes the derivative oí q{-) with respect to 9.
92
Three essays on specification testing in econometric models. Alicia Pérez Alonso.
Tesis doctoral de la Universidad de Alicante. Tesi doctoral de la Universitat d´Alacant. 2006.
Chapter 3 Specification Tests for the Distribution of Errors in Nonpararaetric Regression
+ 0 0
A s s u m p t i o n 12: If Hi holds, then J \\qe{u)\\'^f{u,6^:)du = Op{l). —00
T h e o r e m 2: Suppose that assumptions 1-7 and 10 hold. Then:
a) If Ho holds and assumptions 8 and 11 are satisfied then:
Kn^ sup lW(i ) | and Cn^ Í {W(í)}2dt, te[o,il J[o,i]
where W(- ) is a Brownian motion.
b) If Hi holds and assumptions 9 and 12 are satisfied then, V c G M;
P{Kn> c) ^ l and P (Ü„ > c) -^ 1.
It follows from this theorem that a consistent asymptotically valid testing pro
cedure with significance level a is to reject HQ if Kn > k^, or to reject HQ if
Cn > Ca, where ka and c^ denote appropriate critical values derived from the c.d.f.'s
of supjgjoij | W ( i ) | and L j ,{W(í)}^dí . Specifically, the critical values for Kn with
the most usual significance levels are /ÍQ.IO = 1-96, fco.os = 2.24, fco.oi = 2.81 (see e.g.
Shorack and Wellner, 1986, p.34), and the critical values for C„ with the most usual
significance levels are CQ.IO = 1.196, CQ.OS = 1.656, CQ.OI = 2.787 (see e.g. Rothman
and Woodroofe, 1972).
The statistics Kn and Cn are designed to test if the c.d.f. of the error term
£ = {Y — m{X)}/a{X) belongs to a parametrically specified family of zero-mean
unit-variance continuous c.d.f.'s. If we were interested in testing if the c.d.f. of the
the error term Y — m{X) belongs to a parametrically specified family of zero-mean
continuous c.d.f.'s, then the statistics that we would use are defined in the same way
as Kn and C^, but considering q{u) = (1, /„(n, 6 'O) / / (M, 6*0), fe{u,0o)'/ f{u,0(¡))'. If
we were interested in testing if the c.d.f. of the error term e = {Y — m{X)}/a{X)
is a known zero-mean unit-variance c.d.f. FQ{-), then the statistics that we would
use are sup_jgjj |W„(2) | and ^ " ^ 1 W„(ej)^, where W„(-) is defined as above but now
considering q{u) = (1, fo.u{u)/fo{u), 1 + ufo^^iu)/fo{u)y, where /o(-) and /o,u(-)
denote the first and second derivative of Fo(-). Finally, if we were interested in
93
Three essays on specification testing in econometric models. Alicia Pérez Alonso.
Tesis doctoral de la Universidad de Alicante. Tesi doctoral de la Universitat d´Alacant. 2006.

Chapter 3 Specification Tests for the Distribution of Errors in Nonparametric Regression
testing if the c.d.f. of the error term Y — m{X) is a known zero-mean c.d.f. Fo{-),
then the statistics that we would use are again sup^g^ |W„(^)| and Yl^=i W„(ei)^,
but now W„(-) is defined as above but considering q{u) = (1, /O,«('W)//O(M))'-
3.4 Simulations
In order to check the behaviour of the statistics, we perform a set of Monte Carlo ex
periments. In each experiment, independent and identically distributed {(X¿, ^)}"=i
are generated as follows: Xi has uniform distribution on [0,1] and Y^ = 1 + Xi + EÍ,
where Xi and e are independent, and e has a standardized Student's t distribu
tion with 1/6 degrees of freedom. The value of 5 varies from one experiment to
another; specifically, we consider ¡5 = 0, 1/12, 1/9, 1/7, 1/5 and 1/3 (when 5 = 0,
the distribution of Si is generated from a standard normal distribution). Using the
generated data set {( -^Í ,^Í )}¿LI cis observations, we test the null hypothesis that
the distribution of the error term {Y — m{X)}/a{X) is standard normal. Observe
that, according to the data generation mechanism, the null hypothesis is true if and
only if 5 = 0; thus the experiment with 5 = 0 allows us to examine the empirical
size of the test, and the experiments with 5 > 0 allow us to examine the ability of
the testing procedure to detect deviations from the null hypothesis caused by thick
tails.
The test is performed using the statistics described at the end of the previous
section, i.e. the Kolmogorov-Smirnov type statistic sup^g^ |W„(2;)| and the Cramér-
von Mises type statistic XliLi Wn(ei)^, where Wn(-) is defined as above. Note that
in the specific test that we are considering in this set of experiments, the function
q{-) that appears in the definition of W„(-) proves to be q{u) = (1, ~u, 1 — u^)'. The
computation of the statistics requires the use of Nadaraya-Watson estimates of the
conditional mean and variance functions. We have used the standard normal density
function as a kernel function K{-), and various smoothing values to analyze how
the selection of the smoothing value influences the results; specifically, we consider
/iü) = C^^'^axn^^^^, for j = 1, ...,4, where ax is the sample standard deviation of
94
Three essays on specification testing in econometric models. Alicia Pérez Alonso.
Tesis doctoral de la Universidad de Alicante. Tesi doctoral de la Universitat d´Alacant. 2006.

Chapter 3 Specification Tests for the Distribution of Errors in Nonparametric Regression
{Xi}2^j and C^^^ = j/2. The integrals within the martingale-transformed process
have been approximated numerically. We only discuss the results for the Cramér-
von Mises type statistic, since the results that are obtained with the Kolmogorov-
Smirnov type statistic are quite similar. In Table 1, we report the proportion of
rejections of the null hypothesis for n = 100 and n = 500 with various significance
levels; these results are based on 1000 replications. The results that we obtain show
that the statistic works reasonably well for these sample sizes, and its performance
is not very sensitive to the choice of the smoothing value.
3.5 Concluding Remarks
In this paper we discuss how to test if the distribution of errors from a nonparametric
regression model belongs to a parametric family of continuous distribution functions.
We propose using test statistics that are based on a martingale transform of the
estimated empirical process. These test statistics are asymptotically distribution-
free, and our Monte Carlo results suggest that they work reasonably well in practice.
The present research could be extended in several directions. First of all, it seems
interesting to extend our results to the case of symmetry tests. Under a nonlinear
regression model, conditional symmetry is equivalent to the symmetry of the error
term about zero. This is the null hypothesis we are interested in. Symmetry and
conditional symmetry play an important role in many situations. The following ex
amples may illustrate the relevance of constructing consistent tests of symmetry and
conditional symmetry. Conditional symmetry is part of the stochastic restrictions
on unobservable errors used in semiparametric modelling (Powell, 1994). Adaptive
estimation relies on the assumption of conditional symmetry (Bickel, 1982; Newey,
1988). In macroeconomics, the symmetry of innovations also plays an important role
(Campbell and Henstchel, 1992). In Finance, knowing whether returns or risks ex
hibit symmetry may help in the choice of an adequate risk measure for portfolio risk
management (Gouriérox, Laurent and Scaillet, 2000). Knowledge of the properties
of the error term in a regression model has efficiency implications for bootstrapping
95
Three essays on specification testing in econometric models. Alicia Pérez Alonso.
Tesis doctoral de la Universidad de Alicante. Tesi doctoral de la Universitat d´Alacant. 2006.
Chapter 3 Specification Tests for the Distribution of Errors in Nonparametric Regression
(Davidson and Flachaire, 2001).
In addition to this, it is also interesting to extend the results we have already
obtained to dynamic models. The main point here is to extend Theorem 1 of Akritas
and Van Keilegom (2001), which proposed a consistent estimator of the distribution
of the error term based on nonparametric regression residuals for iid observations, to
a context with dependent observations. This would allow us to apply a martingale
transform to the nonparametric-oscillation like results derived.
96
Three essays on specification testing in econometric models. Alicia Pérez Alonso.
Tesis doctoral de la Universidad de Alicante. Tesi doctoral de la Universitat d´Alacant. 2006.

Chapter 3 Specification Tests for the Distribution of Errors in Nonparametric Regression
APPENDIX
Proof of Proposition 1: Assume that Ho holds and let 9 be an appropriate esti
mator of 6o. If we add and substract F{z, 9o) to V„(-), we obtain
n
Vn{z) = n-'/'J2^I{e,<z)-F{z,eo)]^n'/'[F{z,e)-F{z,9o)]{3.1)
By Taylor expansion, the second term admits the approximation
(//) = Fe{z,9oyn'/^d-9o) + Fee{z,9)'n^'-'0 - 9^?/2, (3.2)
where Fee denotes the second partial derivative of F(-, •) with respect to the
second argument and 9 denotes a mean value between 9 and ^o- Apply As
sumption 8 to show that the last term is Op{n~^/'^).
From Theorem 1 in Akritas and Van Keilegom (2001), we obtain the following
expansion of the empirical c.d.f. based on the estimated residuals e¿:
n
F„{z) = n~^J]/(£, <z) i=l
n n
Y. I[e, <z)+ n-' Y^ ifiXi, y„ z) + P^{z) + Rn{z), (3.3) = n ¿=i ¿=i
where ^{x,y,z) = ~f{z,eo)a~\x) ¡[I{y < v) - F{v\x,9om + z^-^)dv,
^n(^) = I^IU u^K{u)du}E{ip^^{X,Y, z)}, ip^^{x,y,z) = ^^{x,y,z) and
sup gjK \Rn{z)\ = Oj,{rr^/'^) + Op{hD = Op(n^^/^). Note that
(p{x,y,z) = f{z,9o)(p^^{x,y) + zf{z,9o)ip2n{x,y),
(3^{z) = f{z,9o)(3,^ + zf{z,9o)(3,^
where ip-^^{-,-), <P2n{'i')-- f^in ^^d l^2n ^^6 as defined above. The proposition
follows immediately by appeling to (3.2) and (3.3) in (3.1). •
97
Three essays on specification testing in econometric models. Alicia Pérez Alonso.
Tesis doctoral de la Universidad de Alicante. Tesi doctoral de la Universitat d´Alacant. 2006.

Chapter 3 Specification Tests for the Distribution of Errors in Nonparametr ic Regression
Proof of Theorem 1: First we prove the theorem for Kn- Note that, under Hi 0,
Kn = sup zei . where we define Dn(2)
n
D„(^) = n-'/'J2{I{ei <z)- F{z,d) - P^{z)}, (3.4)
and /3„(-) is defined above. To derive the asymptotic distribution of Kn, it
suffices to prove that D„(-) converges weakly to D(-), and then apply the
continuous mapping theorem. Prom Proposition 1 and (3.4), it follows that
D„(-) has the same asymptotic behaviour as D„(z) = n~^^^ Yl^=i[H^i ^ ^) ~
F{z,9o) + (p{Xi,Yi,z)] ~ Fe{z,0oyn^/'^(9-9o), where the function ip{-,-, •) is
defined above.
To analyze the process D„(-), we follow a similar approach to that used in the
proof of Theorem 3.1 in Dette and Neumeyer (2003), though now an additional
term turns up due to the estimation of parameter ^o- We can rewrite ¡f{-,\ •)
as follows: oo y
^{x,y,z) = -f^{l-^-^){J{l-Fiv\x))dv- J F{v\x)dv} y - o o
oo y zf(z,9o)
y - c »
{J v{l — F{v\x))dv — J vF{v\x)dv}
= - ^ ( 1 - T f )( ( ) -y)- f f f ( ( ) + 'i^) - y'y
For y = m(x) + a{x)e, we have
ip{x, y, z) = ip{x, m{x) + a{x)e, z) = f{z, 0o){e + -(e^ - 1)). (3.5)
We also have for the bias part
/5n(^) = -hl{Jk{uydu}x{f{z,eo)j~-r[{m'afx){x)
+2{m'af'^){x) - 2{a'm'fx)ix)]dx + zf{z,eo) J ~-r[2{a'af'x)ix)
+ {a"afx){x) - {m'{x)ffx{x) - 3{a'{x)ffx{x)]dx}/2,
98
Three essays on specification testing in econometric models. Alicia Pérez Alonso.
Tesis doctoral de la Universidad de Alicante. Tesi doctoral de la Universitat d´Alacant. 2006.
Chapter 3 Specification Tests for the Distribution of Errors in Nonparametric Regression
where we use the prime and the double prime to denote the first and second
order derivatives of the corresponding function, respectively. Observe that the
bias can be omitted if n/i^ = o(l).
By Assumption 8 and replacing (3.5) in D„(2;), we obtain
n
D„(z) = n-'/'Y.[I{ei<z)-F{z,eo) + f{z,9o){ei + ^{e¡-l))
= ñn{z)+Op{l),
where the last line defines the process D„(-). Obviously, under our assump
tions, E[Ún{z)] = 0. For s,i G M, straightforward calculation of the covari-
ances yields that Cov{D„(s),D„(i)} = F(min(s,i), ^o) - F{s,eo)F{t,eo) +
H{s,t,9o), where H{-,-,-) is defined in Theorem 1. Hence, the covariance
function of D„(-) converges to that of D(-).
To prove weak convergence of process D„(-), it suffices to prove weak conver
gence of D„(-). Let £°°{Q) denote the space of all bounded functions from a
set ^ to R equipped with the supremum norm \\v\\g = sup^gg N(p)l) and define
^ = {5^(-), 2:eM}as the collection of functions of the form
¿.(e) = I{e <z) + f{z, eo){e + ^{e'- 1)) - Fe{z, ^o)V(X e, Oo). (3.6)
With this notation, observe that
n
DM = n-'/'J2^6{e,)-E[5{e,)]) i=\
is an ^-indexed empirical process in £°°(^). Proving weak convergence of D„(-)
in £°°(^) entails that the class Q is Donsker. Following Theorem 2.6.8 of van
der Vaart and Wellner (1996, p. 142), we have to check that Q is pointwise
separable, is a Vapnik-Cervonenkis class of sets, or simply VC-class and has
99
Three essays on specification testing in econometric models. Alicia Pérez Alonso.
Tesis doctoral de la Universidad de Alicante. Tesi doctoral de la Universitat d´Alacant. 2006.
Chapter 3 Specification Tests for the Distribution of Errors in Nonparametric Regression
an envelope function A(-) with weak second moment^. Using the remark in the
proof of the aforementioned theorem, the latter condition on the envelope can
be promoted to the stronger condition that the envelope has a finite second
moment.
Pointwise separability of G follows from p. 116 in van der Vaart and Well-
ner (1996). More precisely, define the class Qi = {Sz{-), z G Q}, which is a
countable dense subset of Q (dense in terms of pointwise convergence). For
every sequence z^ G Q with Zm \ z as m —> oo, which means that z^
decreasingly approaches z as m —> oo, and 6z{-) G G, we consider the se
quence Szmi') ^ Oi- First, for each e G M, the sequence 5^^(-) fulfils that
^zmi^) —^ ^zi^) pointwise as m —> oo, since S^i-) is right continuos for every
e G M. Second, ¿z^(-) —> ¿z(-) in L2(P)-norm, where P is the probability
measure corresponding to the distribution of e,
\\5.Js) - 5z{e)\\%, EE J \5zje) - 5Ae)\'f{v,eo)dv
< 3[F{zrn, eo) ~ F{z, Oo) + {f{z^, 9o) - f{z, eo)yE{s^)
H^mf{zm,eo) - zf{z,eo)fE{e^ ~ if/A]
+{Fe{^m,Oo) - F0{z,9o))'n{Fe{zm,eQ) - Fg{z,9o))
-2{Fe{zm, Oo) - Fe{z, 9o)yE{{I{e < z^) - I{e < z))i;{X, e, ^o)}
- 2 ( / ( 2 ^ , ^o) - f{z, 9o)){Fe{z^, 9o) - Fe{z, 9o))'E{Íj{X, e, 9o)e}
-2{z^f{zm,9o) - zf{z,9o)){Fg{z,n, 9o) - Fe{z,9o)yE{i:{X,e, 9o){e' - 1)}
—> 0 as 771 —> oo.
For 2; G M, we may rewrite (3.6) as Sz{e) = gi{e)+g{e), where gi{e) = I{e < z)
and f{z, 9o){e + |(e^ — 1)) — Fg{z, 9o)'ip{X, e, 9o). Let us now define the class
^Consider an arbitrary collection Xn = {xj, ..-.Xn} of n points in a set X and a collection C of subsets of X. We say that C picks out a certain subset A of Xn if ^ = C Pi X„ for some C € C. Additionally, we say that C shatters Xn if all of the 2" subsets of X„ are picked out by the sets in C. The VC-index V{C) of the class C is the smallest n for which no set Xn C A" is shattered by C. We say that C is a VC-class if V{C) is finite. Finally, a collection 5 is a VC-class of functions if the collection of all subgraphs {{x,t), g{x) < t}, where g ranges over Q, forms a VC-class of sets in A' X M. See van der Vaart and Wellner (1996, chapter 2.6) for further details.
100
Three essays on specification testing in econometric models. Alicia Pérez Alonso.
Tesis doctoral de la Universidad de Alicante. Tesi doctoral de la Universitat d´Alacant. 2006.

Chapter 3 Specification Tests for the Distribution of Errors in Nonparametric Regression
of all indicator functions of the form C^ = {e i—^ I{e < d), d EW} such that
gi{-) G Ci. Consider any two point sets {ei, £2} C R and assume, without
loss of generality, that £1 < £2- It is easy to verify that Ci can pick out
the null set and the sets {ei} and {£1, £2} but can't pick out {£2}- Thus,
the VC-index V{Ci) of the class Cj is equal to 2; and hence Ci is a VC-
class. Note that •)/;(•,•,•) = ('i/'i(-, •, •); •••; V^mi';'; •))• We define the class of
functions C2 = {£ 1—> as + 6(£^ - 1) + Ci'ip'¡^{X,e,9o) + ... + Cmtp^{X,e,9o)\
a, b, Ci, ...,Cm G R} such that g2{-) G €2- By Lemma 2.6.15 of van der Vaart
and Wellner (1996) and Assumption 8, for fixed X G E and 60 E Q, the class
of functions C2 is a VC-class with ¥{62) < dim{C2) + 2. Finally, by Lemma
2.6.18 of van der Vaart and Wellner (1996), the sum of VC-classes builds out
a new VC-class. This yields the VC property of Q.
Recall that an envelope function of a class Q is any function a; 1—> A{x) such
that [¿^(a;)! < A{x) for every x and Sz{-). Using that f{-,0) is bounded away
from zero, sup^gjj |£/(£, ^)| < 00 and that F{-,-) has bounded derivative with
respect to the second argument, it follows that Q has an envelope function of
the form
A(£) = 1 + «!£ + Q;2(£^ - 1) - «S^ i^ , ^, 0),
where a = (1, «i, a2, «3)' is a (3 + m) x 1 vector of constants. Finally, note
that our assumption 8 readily implies that this envelope has a finite second
moment.
Additionally, under our assumptions it is readily checked that Q is pointwise
separable and is a VC-class, which completes the proof of part a. On the
other hand, under our assumptions sup^gjj \Fn{z) — FE{Z)\ = Op(l). Also, by
applying the mean-value theorem, F{z,9) = F{z,9) -f- F0{z,6**){6 — 9) for
some ^ 6 0 and 9** a mean value between 9 and 9. Clearly, under Ho,
9 = ^0) ciiid the last term is Op{n~^/'^) from assumption 8. Analogously,
under Hi, ^ = 6' , and the last term is Op(n~^/^) from assumption 9. Thus,
irrespective of whether HQ hold true or not, sup^gjj \F{z, 9) — F{z, 9)\ = Op(l).
101
Three essays on specification testing in econometric models. Alicia Pérez Alonso.
Tesis doctoral de la Universidad de Alicante. Tesi doctoral de la Universitat d´Alacant. 2006.

Chapter 3 Specification Tests for the Distribution of Errors in Nonparametric Regression
Therefore sup^^^\Fn{z) - F{z,9)\ -^ sup^^^\Fe{z) - F{z,9)\. Under Hi,
sup^gjj \Fe{z) — F{z, ^*)| > 0 and this concludes the proof of part b.
For the second test statistic observe that C„ = J{Fn{v) — F{v,0)}'^dFn{v).
As before, the asymptotic distribution of this statistic can be obtained from
Proposition 1 and the uniform convergence of F„(-). •
Let us define q{-) in the same way as q{-) but replacing 6*0 by 9. The following
two propositions are required in the proof of Theorem 2.
Proposition A l : Suppose that assumptions 1-7 hold. Then:
a) If Ho holds and assumptions 8 and 11 are satisfied then:
\\q{u)-q{u)\\''f{u,9o)áu^o,{l).
b) If Hi holds and assumption 9 and 12 are satisfied then: +00
\\q{u)-q{u)\\^f{u,9Mu = 0p{l).
Proof of Proposition A l : Under assumption 7, g(-) is continuously difí'erentiable
with respect to 9. Thus, by a Taylor expansion we obtain
q{-) = q{-) + qe{-,9*)0-9^)/2,
where qe{-,9*) denotes the derivative of g(-) with respect to 9, evaluated at 9*,
and 9* lies between 9 and ^o- Observe that +00
\q{u) -q{u)\\'^f{u,9o)du
+ 00
1 " ^ " '12 / \\„ / n*\\\2 < ^ l l ^ - ^ o i r / \\qe{;9*)\\'f{u^9o)du
102
Three essays on specification testing in econometric models. Alicia Pérez Alonso.
Tesis doctoral de la Universidad de Alicante. Tesi doctoral de la Universitat d´Alacant. 2006.

Chapter 3 Specification Tests for the Distribution of Errors in Nonparametric Regression
where the first inequality follows using \\q{-)-q{-W < lke(^ ^*)lñl^-^o| |V4,
and the last equality follows using assumptions 8 and 11. More precisely, under
assumption 8, it is straightforward to show that {9 — OQ) = Op{n~^^'^). Then,
11 — ^o|P = Op{n~'^). This completes the proof of part a. The result of part
b is obtained along the same line of argument using assumptions 9 and 12. •
Proposition A2: Suppose that assumptions 1-7 hold. Then:
a) If Ho holds and assumption 8 is satisfied then:
n
sup|ln-^/^5^[I(e. > z){q{e,) ~ q{e,)} z6lR " ^
1=1
~ j{q{u)-q{u)}f{u,eo)du]\\ = 0,(1).
2
b) If Hi holds and assumption 9 is satisfied then:
n
snY>\\n'^'^y\I{e, > z){q{e,) ~ q{e,)}
+ 00
~ j{q{u)-q{u)}f{u,9^)du]\\ = 0^(1).
Proof of Proposition A2: As above, under assumption 7, q{-) is continuously
differentiable with respect to 6. Thus, by a Taylor expansion we obtain q{-) =
q{') + qe{',9*){6 — 6Q)/2, where qe{-,9*) denotes the derivative of g(-) with
respect to 9, evaluated at 9*, and 9* lies between 9 and ^o- Thus, under HQ,
observe that
+ 00
n-"' T.tlV{^^ > ^mX^i) - g(£.)} - / {Q{U) - q{u)}f{u, 9o)du] z
= n-'l^ Er=i[^(£. > A{n{e.) - g(£0} - m{e > z){q{e) ~ q{e)})]
103
Three essays on specification testing in econometric models. Alicia Pérez Alonso.
Tesis doctoral de la Universidad de Alicante. Tesi doctoral de la Universitat d´Alacant. 2006.
Chapter 3 Specification Tests for the Distribution of Errors in Nonparametric Regression
n ' Er=i[^(^^ > ^^)Qo{ei,9*) - E{I{e > z)qe{e,e*)]n^l''0- eo)/2.
Under assumption 8, it is straightforward to show that v}/'^[6 — OQ) = Op{l).
On the other hand, the first term on the right hand side is Op(l) using some
uniform strong law of large numbers. This completes the proof of part a. The
result of part b is obtained along the same line using assumptions 9. •
Proof of Theorem 2: In the following reasoning we assume that the null hypoth
esis holds. Interchanging the variables, setting t = F{z,9o), we shall first
show that W„(-) = W„(-P^-'^(-,^o)) converges weakly to a standard Brown-
ian motion. Let D[0, b] {b > 0) denote the space of cadlag functions on [0, b]
endowed with the Skorohod metric^. Furthermore, define the linear mapping
r : £)[0,1] ^ ^[0,1] as follows
Í 1
T{ai-)){t)^ jq{F-\s,eo))'C{F-\s,eo))-'[lq{F-\r,9o))da{r)]ds.
0 s
Let
Q{t) = {Qi{t),Q2{t),Q,{t),Q4{t)y
= (Í, f{F'Hu 0o)), f{F-\t, 0o))F-'{t, 9o), Fe{F-\t, ^o))')',
so that q{F~^{-, OQ)) is the derivative of Q{-). It is easy to check that
nQii-)) = Qi{-), for / = 1,2,3,4. (3.7)
Prom C{F-'^{s,eo)y^C{F-\sJo)) = I4 we have C(F~i(s, ^0))^^ x
{}Q{r)dQ,{r)} = (1,0,0,0)'. Thus T{Q,{-)){t) = /Q(s) ' ( l ,0 ,0,0) 'ds = s 0
Qi{t). A parallel analysis establishes similar results for the remaining compo
nents of Q{-). ^See Section 14 of Billingsley (1968).
104
Three essays on specification testing in econometric models. Alicia Pérez Alonso.
Tesis doctoral de la Universidad de Alicante. Tesi doctoral de la Universitat d´Alacant. 2006.

Chapter 3 Specification Tests for the Distribution of Errors in Nonparametric Regression
Let t = F{F-'{t),d). Thus V„(i) =. nV2[F„(i) - i] + ^V^fi _ ¿j. Note that
V„(-) can be rewritten as follows
V„(-) = n'^'[Fn{F~'{;9o))~Q^{-)]+ny'[Qi{-)~F{F~-\Q,{.),0,),9)]. (3.8)
Using the linearity of r(-), (3.4) and (3.5), routine calculations yield that
w„(-) = v„(-)-r(v„(-)).
Using Proposition 1, the linearity of r(-) and (3.4), it follows that
r(V„(z)) = r(V„(^)) + n-V2 n^^ [/(^^ 9,){^,^{X,,Y^ + Í3,J
Notice that the bias term /?„(•) = f{z, 9o)P-in + ^fi^^ ^o)P2n can be omitted if
nh^ = o(l). Using Proposition 1 again, we have
w„(-) = v„(-) - r(v„(0) + op(i) + 0(1).
Thus, as V„(-) converges weakly to a standard Brownian bridge B{-) on [0,1],
Wn(-) converges weakly to B{-) — T{B{-)), which is a standard Brownian
motion on [0,1] (see Khamaladze, 1981 or Bai, 2003, p. 543).
Let us now define W„(-) = W„(F"^(-,^o))- Under assumptions 7 and 8,
/(•, 9) = f{-,9o) + Op(l) (this follows applying a Taylor expansion). Addition
ally, propositions Al and A2 imply that Assumption Dl of Bai (2003) holds.
Hence, to prove that W„(-) = Wn(-) + Op(l), we follow exactly the lines of the
proof of Theorem 4 of Bai (2003), what completes the proof of a.
On the other hand, under Hi, the assertation can be deduced from the prob
ability limit of n~^/^W„(2;), which is
H(z) = F{z) ~ I q{u)C{ur'dn{u)f{u, 9,)du},
105
Three essays on specification testing in econometric models. Alicia Pérez Alonso.
Tesis doctoral de la Universidad de Alicante. Tesi doctoral de la Universitat d´Alacant. 2006.

Chapter 3 Specification Tests for the Distribution of Errors in Nonparametric Regression
where
q{u) = (1, Uu, 9,)/f{u, e,), 1 + ufuiu, 9,)/f{u, 9,), fe{u, 9,y/f{u, 6,))',
C(«)EEXrg( r )g ( r )7 ( r , ^ . )d r , dn{u) = ¡^°°q{T)f{T)dT,
It can be easily checked that S{z) ^ 0 under Hi. The result of part b follows
from here. •
106
Three essays on specification testing in econometric models. Alicia Pérez Alonso.
Tesis doctoral de la Universidad de Alicante. Tesi doctoral de la Universitat d´Alacant. 2006.

Chapter 3 Specification Tests for the Distribution of Errors in Nonparametric Regression
REFERENCES
Akritas, M. and Van Keilegom, I., 2001. Non-parametric estimation of the residual
distribution. Scandinavian Journal of Statistics 28, 549-567.
Bai, J., 2003. Testing parametric conditional distributions of dynamic models. The
Review of Economics and Statistics 85, 531-549.
Bickel, P.J., 1982. The 1980 Wald Memorial Lecures: On Adaptive Estimation. The
Annals of Statistics 10, 647-671.
Billingsley, P., 1968. Convergence of Probability Measures. John Wiley, New York.
Campbell, J.Y. and Hentschel, L., 1992. No news is good news. Journal of Financial
Economics 31, 281-318.
Davidson, R. and Flachaire, E., 2001. The Wild Bootstrap, Tamed at last. Queen's
Institute for Economic Research Working Paper No. 1000.
Dette, H. and Neumeyer, N., 2003. Testing for symmetric error distribution in
nonparametric regression models. Mimeo, Ruhr-universitt Bochum.
Durbin, J., 1973. Weak Convergence of the Sample Distribution Function when
Parameters are Estimated. The Annals of Statistics 1, 279-290.
Gouriérox, C , Laurent, J.P. and Scaillet, O., 2000. Sensitivity analysis of value at
risk. Journal of Empirical Finance 7, 225-245.
Khmaladze, E.V., 1981. Martingale apporach in the theory of goodness-of-fit tests.
Theory of Probability and its Applications 26, 240-257.
Khmaladze, E.V., 1993. Goodness of fit problem and scanning innovations martin
gales. Annals of Statistics 21, 798-829.
Khmaladze, E.V., and Koul, H.L., 2004. Martingale transforms of goodness-of-fit
tests in regression models. Annals of Statistics 32, 995-1034.
Loynes, R.M., 1980. The Empirical Distribution Function of Residuals from Gener
alised Regression. The Annals of Statistics 8, 285-298.
107
Three essays on specification testing in econometric models. Alicia Pérez Alonso.
Tesis doctoral de la Universidad de Alicante. Tesi doctoral de la Universitat d´Alacant. 2006.

Chapter 3 Specification Tests for the Distribution of Errors in Nonparametric Regression
Newey, W.K., 1988. Adaptive Estimation of Regression Models via Moment Re
strictions. Journal of Econometrics 38, 301-339.
Powel, J.L., 1994. Estimation of semiparametric models. Handbook of Econometrics
IV, Elsevier, Amsterdam, chapter 41, 2443-2521.
Rothman, E.D. and Woodroofe, M., 1972. A Cramér-von Mises type statistic for
testing symmetry. Annals of Mathematical Statistics 43, 2035-2038.
Shorack, G. and Wellner, J.A., 1986. Empirical Processes with Applications to
Statistics. New York: Wiley.
Van der Vaart, A.W. and Wellner, J.A., 2000. Weak Convergence and Empirical
Processes. Springer, New York.
108
Three essays on specification testing in econometric models. Alicia Pérez Alonso.
Tesis doctoral de la Universidad de Alicante. Tesi doctoral de la Universitat d´Alacant. 2006.

Chapter 3 Specification Tests for the Distribution of Errors in Nonparametric Regression
TABLES
TABLE 1; Propor t ion of Rejections of H, 0
5
0 1/12
1/9 1/7 1/5 1/3
0 1/12
1/9 1/7 1/5 1/3
0 1/12
1/9 1/7 1/5 1/3
/i(i)
0.005 0.015 0.049 0.072 0.144 0.369
0.015 0.044 0.079 0.126 0.216 0.484
0.041 0.074 0.110 0.174 0.269 0.569
/i(2)
n =
0.004 0.032 0.037 0.069 0.132 0.376
0.018 0.060 0.090 0.127 0.202 0.494
0.053 0.086 0.122 0.165 0.266 0.578
/i(3)
100
0.003 0.016 0.027 0.064 0.130 0.371
0.013 0.049 0.074 0.111 0.201 0.493
0.041 0.075 0.109 0.161 0.250 0.568
h^^^
a = 0.003 0.026 0.034 0.064 0.151 0.376
a = 0.015 0.059 0.075 0.105 0.238 0.481
a = 0.044 0.081 0.114 0.150 0.288 0.554
/i^i)
0.01 0.007 0.095 0.254 0.419 0.712 0.988
0.05 0.045 0.177 0.378 0.555 0.821 0.996
:0.10 0.083 0.237 0.460 0.629 0.873 0.998
/i(2)
n =
0.006 0.126 0.307 0.491 0.769 0.994
0.037 0.232 0.455 0.618 0.865 0.998
0.076 0.308 0.527 0.690 0.902 1.000
/i(3)
500
0.008 0.149 0.339 0.521 0.792 0.995
0.038 0.258 0.486 0.650 0.884 0.998
0.077 0.344 0.556 0.719 0.909 1.000
h^'^
0.006 0.162 0.357 0.535 0.803 0.996
0.040 0.280 0.499 0.663 0.892 0.998
0.079 0.359 0.570 0.736 0.917 1.000
109
Three essays on specification testing in econometric models. Alicia Pérez Alonso.
Tesis doctoral de la Universidad de Alicante. Tesi doctoral de la Universitat d´Alacant. 2006.