tennessee basic education program...fy 2019 -4- bep handbook introduction the tennessee basic...
TRANSCRIPT
FY 2019 -1- BEP Handbook
TENNESSEE
BASIC EDUCATION PROGRAM
HANDBOOK FOR COMPUTATION
Revised September 2018
TENNESSEE DEPARTMENT OF EDUCATION OFFICE OF LOCAL FINANCE
710 JAMES ROBERTSON PARKWAY NASHVILLE, TENNESSEE 37243-0381
FY 2019 -2- BEP Handbook
TABLE OF CONTENTS INTRODUCTION ................................................................................................. 4 INSTRUCTIONAL SALARIES COMPONENTS REGULAR K-12 TEACHERS ................................................................................. 5 VOCATIONAL EDUCATION TEACHERS ................................................................ 6 SPECIAL EDUCATION TEACHERS ....................................................................... 7 ENGLISH LANGUAGE LEARNER TEACHERS ......................................................... 8 ENGLISH LANGUAGE LEARNER TRANSLATORS ................................................... 9 PHYSICAL EDUCATION TEACHERS .................................................................... 10 ELEMENTARY ART TEACHERS ........................................................................... 11 ELEMENTARY MUSIC TEACHERS ....................................................................... 12 ELEMENTARY GUIDANCE COUNSELORS ............................................................ 13 SECONDARY GUIDANCE COUNSELORS .............................................................. 14 ELEMENTARY LIBRARIANS ............................................................................... 15 SECONDARY LIBRARIANS ................................................................................. 16 PRINCIPALS ..................................................................................................... 17 RTI POSITIONS ............................................................................................... 18 ELEMENTARY ASSISTANT PRINCIPALS .............................................................. 19 SECONDARY ASSISTANT PRINCIPALS ............................................................... 20 REGULAR SUPERVISORS .................................................................................. 21 SPECIAL EDUCATION SUPERVISORS ................................................................. 22 VOCATIONAL EDUCATION SUPERVISORS .......................................................... 23 PSYCHOLOGIST ............................................................................................... 24 SOCIAL WORKERS ........................................................................................... 25 SPECIAL EDUCATION ASSESSMENT PERSONNEL ............................................... 26 INSTRUCTIONAL BENEFITS COMPONENTS RETIREMENT and SOCIAL SECURITY ................................................................ 27 INSURANCE ..................................................................................................... 28 CLASSROOM COMPONENTS SCHOOL NURSES………………………………………………….………………………………………29 REGULAR INSTRUCTIONAL ASSISTANTS ........................................................... 30 SPECIAL EDUCATION ASSISTANTS ................................................................... 31 ELEMENTARY LIBRARY ASSISTANTS ................................................................. 32 RETIREMENT and SOCIAL SECURITY ................................................................ 33 INSURANCE ..................................................................................................... 34 AT-RISK CLASS SIZE REDUCTION ..................................................................... 35 SUBSTITUTE TEACHERS ................................................................................... 36 ALTERNATIVE SCHOOLS .................................................................................. 37 DUTY FREE LUNCH .......................................................................................... 38 TEXTBOOKS .................................................................................................... 39 MATERIALS AND SUPPLIES ............................................................................... 40 INSTRUCTIONAL EQUIPMENT ........................................................................... 41 TRAVEL ........................................................................................................... 42 EXIT EXAMS .................................................................................................... 43 TECHNOLOGY .................................................................................................. 44
FY 2019 -3- BEP Handbook
VOCATIONAL CENTER TRANSPORTATION ......................................................... 45 NON-CLASSROOM COMPONENTS SUPERINTENDENT ........................................................................................... 46 TECHNOLOGY COORDINATORS ........................................................................ 47 SYSTEM SECRETARIAL SUPPORT PERSONNEL ................................................... 48 SCHOOL SECRETARIAL SUPPORT PERSONNEL ................................................... 49 CUSTODIANS ................................................................................................... 50 RETIREMENT and SOCIAL SECURITY ................................................................ 51 INSURANCE ..................................................................................................... 52 NON-INSTRUCTIONAL EQUIPMENT ................................................................... 53 PUPIL TRANSPORTATION ................................................................................. 54 MAINTENANCE AND OPERATIONS .................................................................... 55 MAINTENANCE AND OPERATIONS STAFF BENEFITS .......................................... 56 CAPITAL OUTLAY ............................................................................................. 57 COST DIFFERENTIAL FACTOR ........................................................................ 58 FISCAL CAPACITY ......................................................................................... 59 STABILITY, BASELINE and MANDATORY INCREASE .................................... 60 APPENDIX A COST DIFFERENTIAL FACTOR (CDF) FOR FY19 .................................................. 61 B TACIR INDEX FOR FY19 .................................................................................. 62 C FOX / CBER INDEX FOR FY19 ........................................................................... 63 D TACIR / FOX MIX (50/50) FOR FY19 .................................................................. 64 E SYSTEM TRANSPORTATION ALLOCATIONS FOR FY19 ........................................ 65 F SPECIAL EDUCATION OPTIONS ........................................................................ 66 G CBER DEFLATOR SCHEDULE ............................................................................. 68 H DETAILED INSTRUCTIONS FOR CALCULATION OF BEP FORMULA ......................... 70 I FISCAL CAPACITY MODEL COMPARISON ............................................................. 92
FY 2019 -4- BEP Handbook
INTRODUCTION The Tennessee Basic Education Program (BEP) formula is a cornerstone of the Education Improvement Act of 1992 (EIA). The formula consists of 45 components that have been deemed necessary for a school district to provide a basic level of education. In addition, it calculates the cost of providing this basic education to the students within the state and local education agencies. The formula represents a continuing effort to determine the most appropriate levels of funding and the proper components for the BEP. A variety of sources, including local, regional and national data on expenditures and staffing levels, provide information for specific funding levels. This handbook provides documentation for the calculation of the costs associated with each of the formula’s components, which are divided into four categories: instructional salaries, instructional benefits, classroom, and non-classroom components. The instructional salaries components include areas of pupil contact and primarily represent teacher salaries. The instructional benefits components includes benefits associated with instructional salaries. The classroom components include areas of classroom support. The non-classroom components include such categories as system support, transportation, maintenance/operations and capital outlay. On a statewide basis, the state funds 70 percent of the instructional category, 75 percent of the classroom category and 50 percent of the non-classroom category. However, each school district has different actual percentages of funding based on the district’s ability to pay or fiscal capacity, an outcome of the Tennessee Supreme Court decision in a case often referred to as Small Schools, which required the state to revamp its education funding formula to provide substantially equal opportunities to all students in Tennessee. The BEP Handbook is intended to provide a description of each component in the formula, as well as an explanation and example of how to calculate each component. School systems wishing to calculate the amount of funds generated by the formula for their districts will need to know specific information about student membership by grade and program, such as special education, students and miles transported and school enrollment. Information about salary, equalization, and cost differential factors for the current year is found in the appendix section. It’s important to note that the BEP is neither a spending plan nor a budget document. It is strictly a funding formula. Each school system has the flexibility in determining the most appropriate use of state funds to best meet the needs of the local system and applicable requirements of state laws and regulations. The only earmark within the formula is on instructional and classroom funds. Funds generated by the instructional components of the formula must be spent on instruction. Funds generated by the classroom components must be spent in either instruction or other classroom areas. Appendix H contains the step by step instructions for the calculation used by the Tennessee Department of Education in determining the BEP funding for each school system.
FY 2019 -5- BEP Handbook
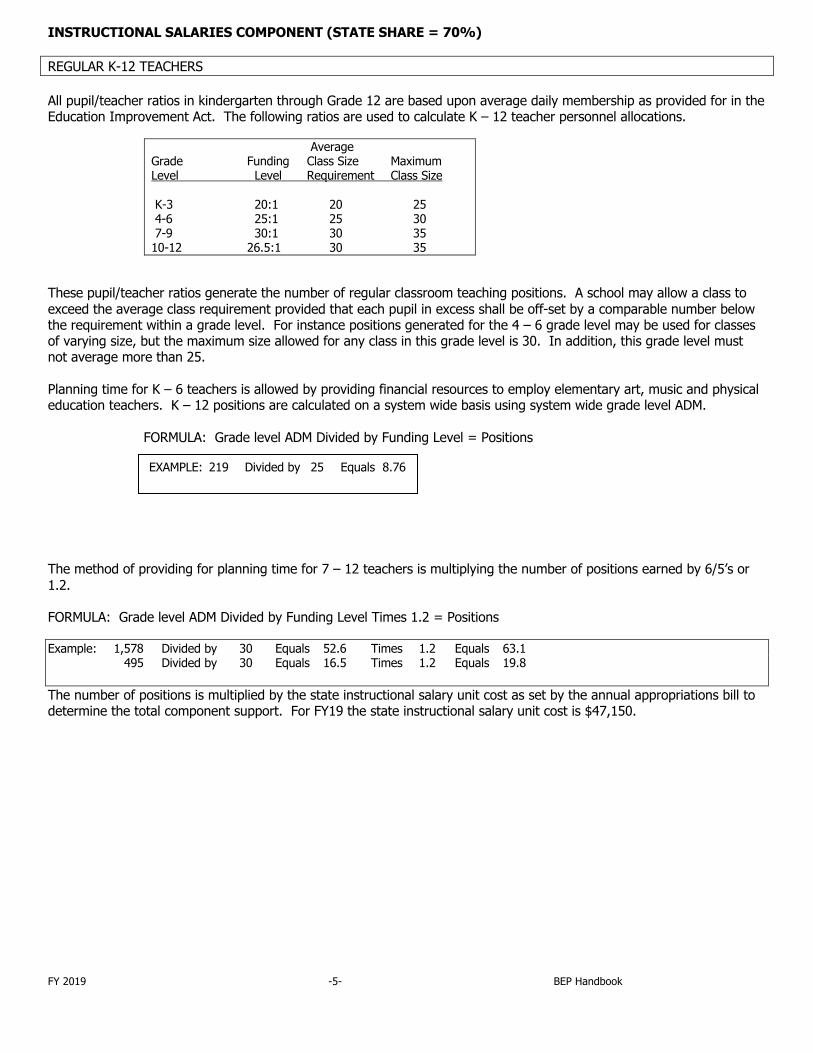
INSTRUCTIONAL SALARIES COMPONENT (STATE SHARE = 70%) REGULAR K-12 TEACHERS All pupil/teacher ratios in kindergarten through Grade 12 are based upon average daily membership as provided for in the Education Improvement Act. The following ratios are used to calculate K – 12 teacher personnel allocations.
Average Grade Funding Class Size Maximum Level Level Requirement Class Size K-3 20:1 20 25 4-6 25:1 25 30 7-9 30:1 30 35 10-12 26.5:1 30 35
These pupil/teacher ratios generate the number of regular classroom teaching positions. A school may allow a class to exceed the average class requirement provided that each pupil in excess shall be off-set by a comparable number below the requirement within a grade level. For instance positions generated for the 4 – 6 grade level may be used for classes of varying size, but the maximum size allowed for any class in this grade level is 30. In addition, this grade level must not average more than 25. Planning time for K – 6 teachers is allowed by providing financial resources to employ elementary art, music and physical education teachers. K – 12 positions are calculated on a system wide basis using system wide grade level ADM. FORMULA: Grade level ADM Divided by Funding Level = Positions The method of providing for planning time for 7 – 12 teachers is multiplying the number of positions earned by 6/5’s or 1.2. FORMULA: Grade level ADM Divided by Funding Level Times 1.2 = Positions Example: 1,578 Divided by 30 Equals 52.6 Times 1.2 Equals 63.1 495 Divided by 30 Equals 16.5 Times 1.2 Equals 19.8 The number of positions is multiplied by the state instructional salary unit cost as set by the annual appropriations bill to determine the total component support. For FY19 the state instructional salary unit cost is $47,150.
EXAMPLE: 219 Divided by 25 Equals 8.76 215 Divided by 25 Equals 8.60
FY 2019 -6- BEP Handbook
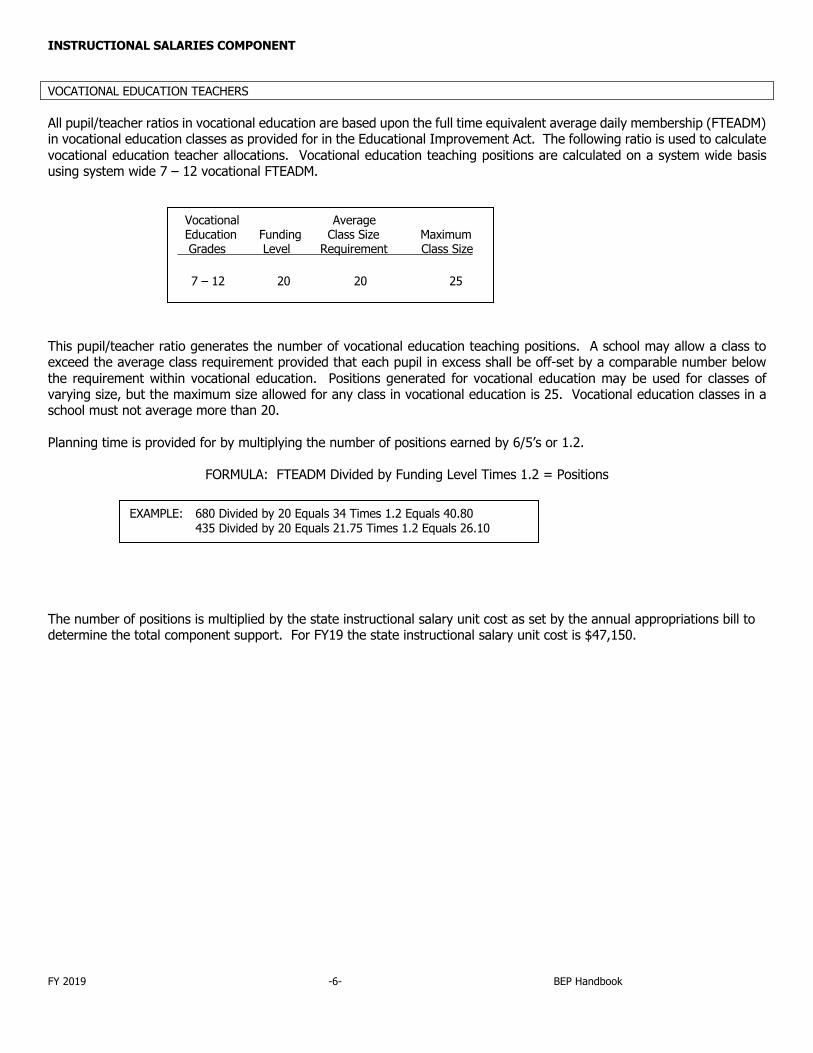
INSTRUCTIONAL SALARIES COMPONENT VOCATIONAL EDUCATION TEACHERS All pupil/teacher ratios in vocational education are based upon the full time equivalent average daily membership (FTEADM) in vocational education classes as provided for in the Educational Improvement Act. The following ratio is used to calculate vocational education teacher allocations. Vocational education teaching positions are calculated on a system wide basis using system wide 7 – 12 vocational FTEADM. This pupil/teacher ratio generates the number of vocational education teaching positions. A school may allow a class to exceed the average class requirement provided that each pupil in excess shall be off-set by a comparable number below the requirement within vocational education. Positions generated for vocational education may be used for classes of varying size, but the maximum size allowed for any class in vocational education is 25. Vocational education classes in a school must not average more than 20. Planning time is provided for by multiplying the number of positions earned by 6/5’s or 1.2.
FORMULA: FTEADM Divided by Funding Level Times 1.2 = Positions The number of positions is multiplied by the state instructional salary unit cost as set by the annual appropriations bill to determine the total component support. For FY19 the state instructional salary unit cost is $47,150.
Vocational Average Education Funding Class Size Maximum Grades Level Requirement Class Size 7 – 12 20 20 25
EXAMPLE: 680 Divided by 20 Equals 34 Times 1.2 Equals 40.80 435 Divided by 20 Equals 21.75 Times 1.2 Equals 26.10
FY 2019 -7- BEP Handbook
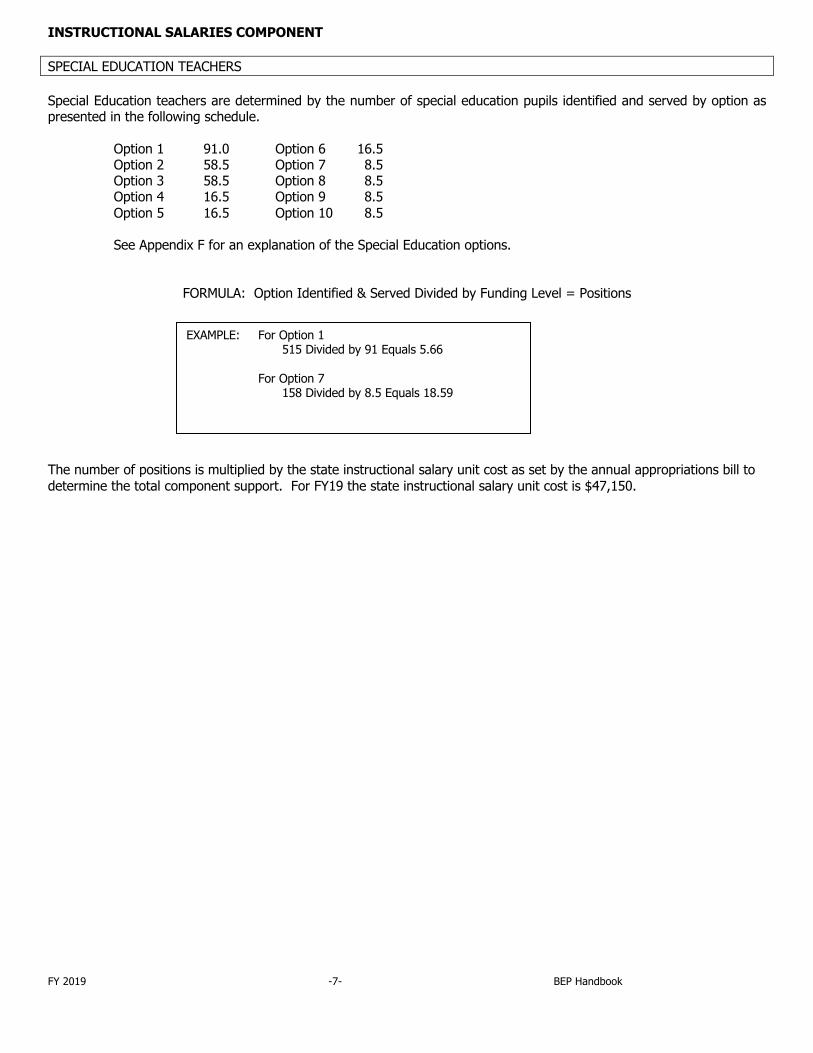
INSTRUCTIONAL SALARIES COMPONENT SPECIAL EDUCATION TEACHERS Special Education teachers are determined by the number of special education pupils identified and served by option as presented in the following schedule. Option 1 91.0 Option 6 16.5 Option 2 58.5 Option 7 8.5 Option 3 58.5 Option 8 8.5 Option 4 16.5 Option 9 8.5 Option 5 16.5 Option 10 8.5 See Appendix F for an explanation of the Special Education options.
FORMULA: Option Identified & Served Divided by Funding Level = Positions The number of positions is multiplied by the state instructional salary unit cost as set by the annual appropriations bill to determine the total component support. For FY19 the state instructional salary unit cost is $47,150.
EXAMPLE: For Option 1 515 Divided by 91 Equals 5.66 For Option 7 158 Divided by 8.5 Equals 18.59
FY 2019 -8- BEP Handbook
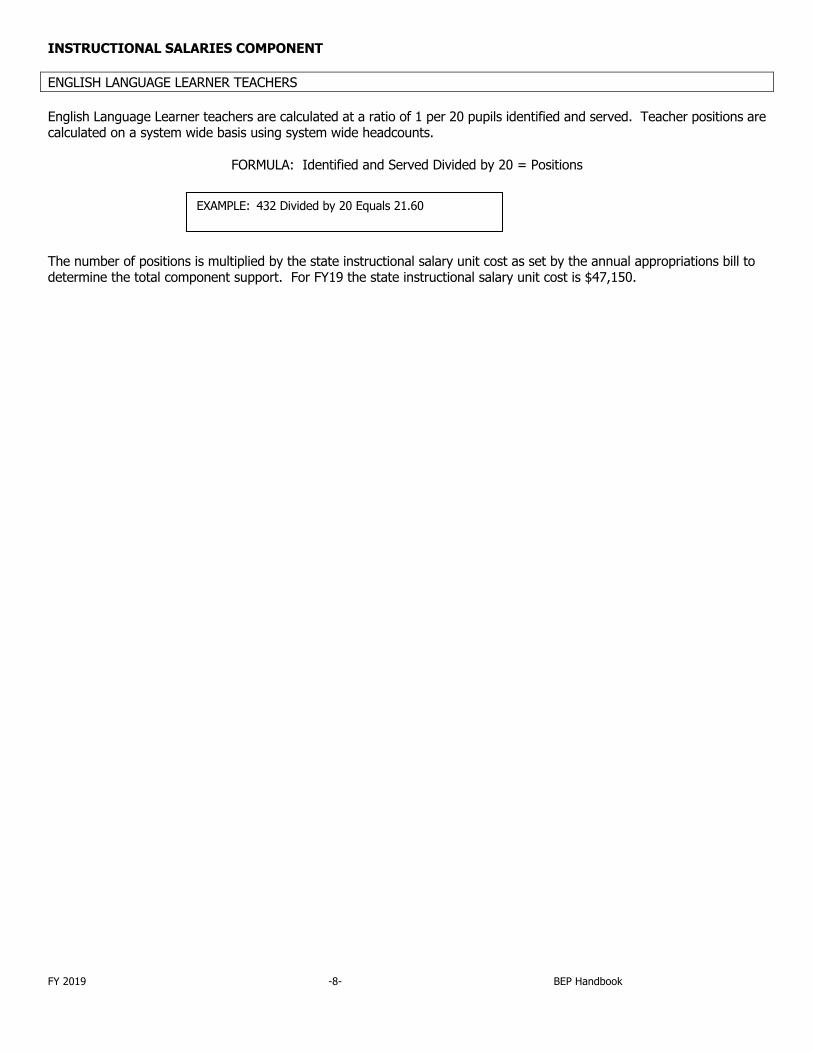
INSTRUCTIONAL SALARIES COMPONENT ENGLISH LANGUAGE LEARNER TEACHERS English Language Learner teachers are calculated at a ratio of 1 per 20 pupils identified and served. Teacher positions are calculated on a system wide basis using system wide headcounts.
FORMULA: Identified and Served Divided by 20 = Positions The number of positions is multiplied by the state instructional salary unit cost as set by the annual appropriations bill to determine the total component support. For FY19 the state instructional salary unit cost is $47,150.
EXAMPLE: 432 Divided by 20 Equals 21.60
FY 2019 -9- BEP Handbook
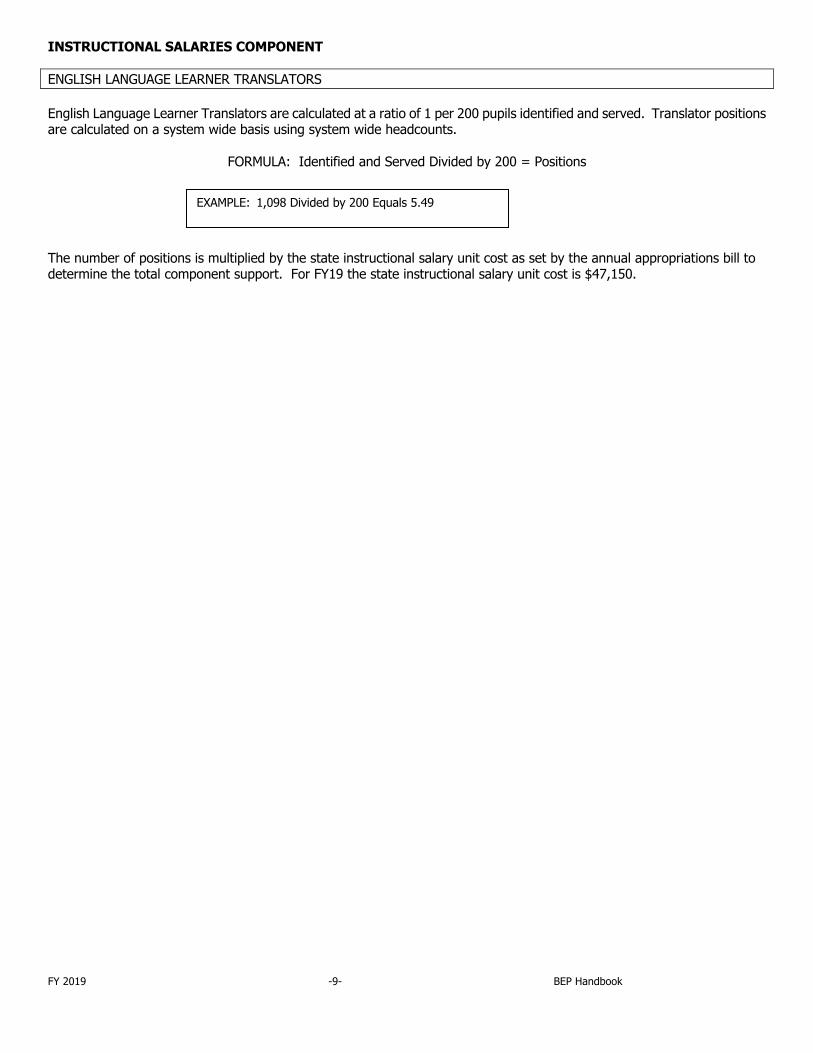
INSTRUCTIONAL SALARIES COMPONENT ENGLISH LANGUAGE LEARNER TRANSLATORS English Language Learner Translators are calculated at a ratio of 1 per 200 pupils identified and served. Translator positions are calculated on a system wide basis using system wide headcounts.
FORMULA: Identified and Served Divided by 200 = Positions The number of positions is multiplied by the state instructional salary unit cost as set by the annual appropriations bill to determine the total component support. For FY19 the state instructional salary unit cost is $47,150.
EXAMPLE: 1,098 Divided by 200 Equals 5.49
FY 2019 -10- BEP Handbook
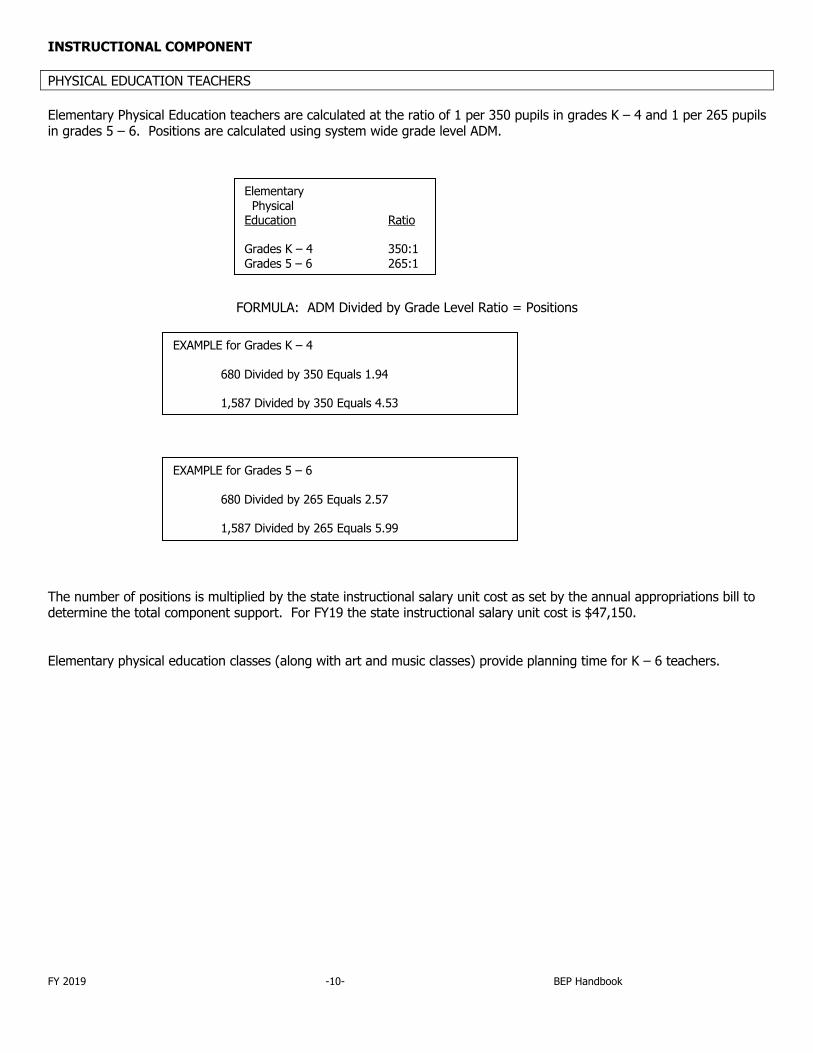
INSTRUCTIONAL COMPONENT PHYSICAL EDUCATION TEACHERS Elementary Physical Education teachers are calculated at the ratio of 1 per 350 pupils in grades K – 4 and 1 per 265 pupils in grades 5 – 6. Positions are calculated using system wide grade level ADM.
FORMULA: ADM Divided by Grade Level Ratio = Positions The number of positions is multiplied by the state instructional salary unit cost as set by the annual appropriations bill to determine the total component support. For FY19 the state instructional salary unit cost is $47,150. Elementary physical education classes (along with art and music classes) provide planning time for K – 6 teachers.
Elementary Physical Education Ratio Grades K – 4 350:1 Grades 5 – 6 265:1
EXAMPLE for Grades K – 4 680 Divided by 350 Equals 1.94 1,587 Divided by 350 Equals 4.53
EXAMPLE for Grades 5 – 6 680 Divided by 265 Equals 2.57 1,587 Divided by 265 Equals 5.99
FY 2019 -11- BEP Handbook
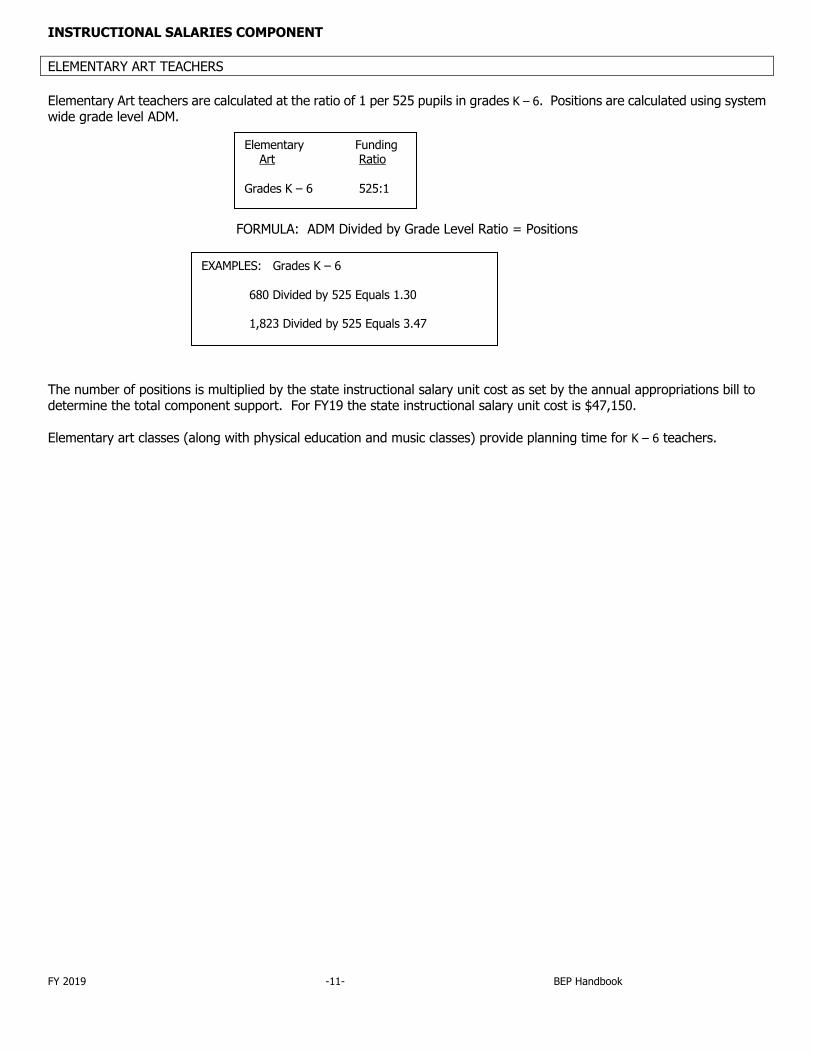
INSTRUCTIONAL SALARIES COMPONENT ELEMENTARY ART TEACHERS Elementary Art teachers are calculated at the ratio of 1 per 525 pupils in grades K – 6. Positions are calculated using system wide grade level ADM.
FORMULA: ADM Divided by Grade Level Ratio = Positions The number of positions is multiplied by the state instructional salary unit cost as set by the annual appropriations bill to determine the total component support. For FY19 the state instructional salary unit cost is $47,150. Elementary art classes (along with physical education and music classes) provide planning time for K – 6 teachers.
Elementary Funding Art Ratio Grades K – 6 525:1
EXAMPLES: Grades K – 6 680 Divided by 525 Equals 1.30 1,823 Divided by 525 Equals 3.47
FY 2019 -12- BEP Handbook
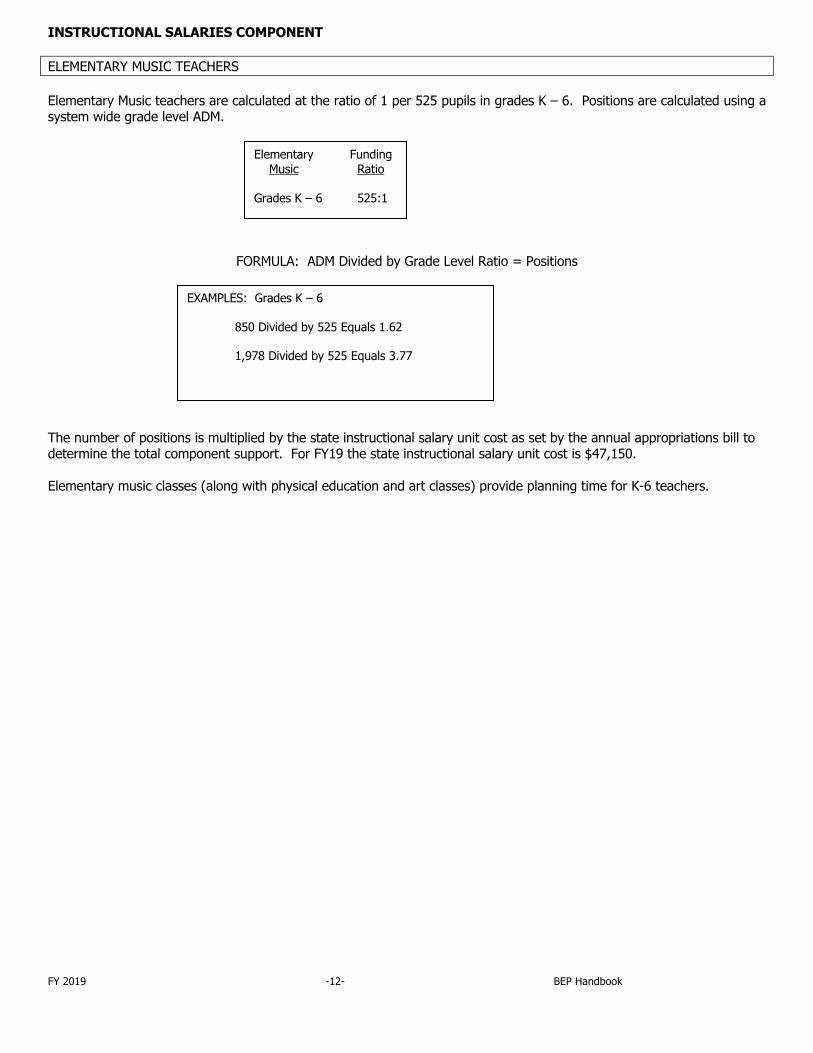
INSTRUCTIONAL SALARIES COMPONENT ELEMENTARY MUSIC TEACHERS Elementary Music teachers are calculated at the ratio of 1 per 525 pupils in grades K – 6. Positions are calculated using a system wide grade level ADM.
FORMULA: ADM Divided by Grade Level Ratio = Positions The number of positions is multiplied by the state instructional salary unit cost as set by the annual appropriations bill to determine the total component support. For FY19 the state instructional salary unit cost is $47,150. Elementary music classes (along with physical education and art classes) provide planning time for K-6 teachers.
Elementary Funding Music Ratio Grades K – 6 525:1
EXAMPLES: Grades K – 6 850 Divided by 525 Equals 1.62 1,978 Divided by 525 Equals 3.77
FY 2019 -13- BEP Handbook
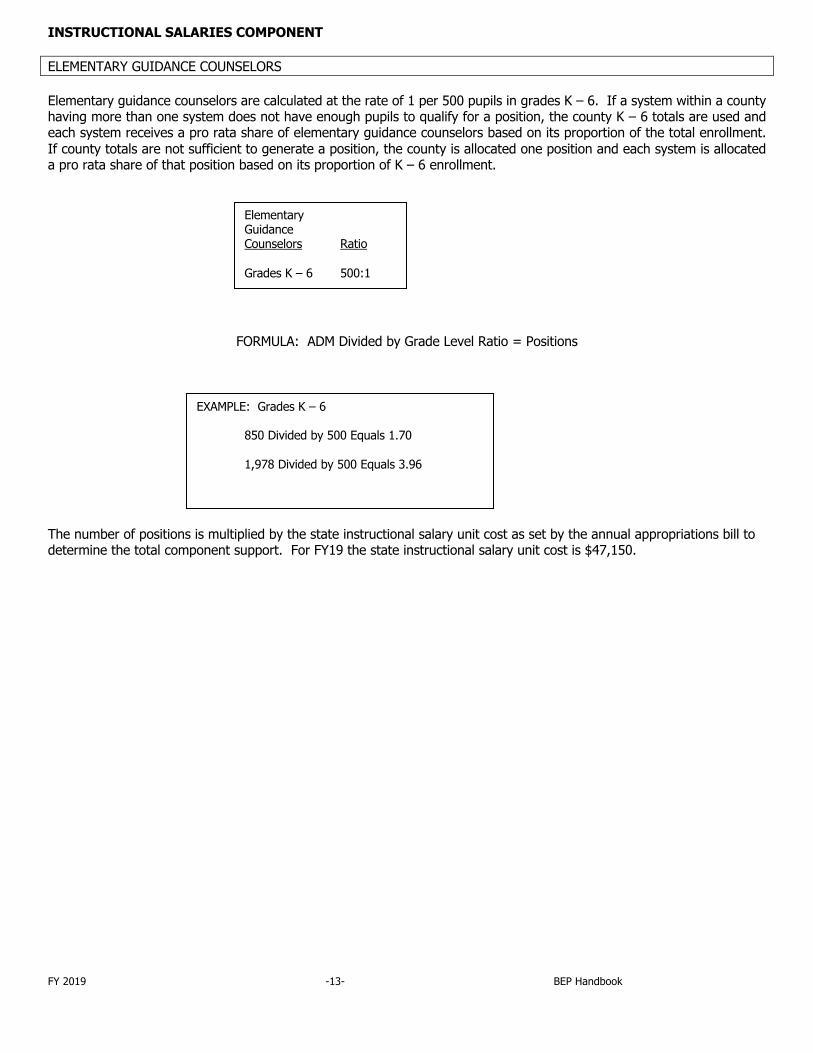
INSTRUCTIONAL SALARIES COMPONENT ELEMENTARY GUIDANCE COUNSELORS Elementary guidance counselors are calculated at the rate of 1 per 500 pupils in grades K – 6. If a system within a county having more than one system does not have enough pupils to qualify for a position, the county K – 6 totals are used and each system receives a pro rata share of elementary guidance counselors based on its proportion of the total enrollment. If county totals are not sufficient to generate a position, the county is allocated one position and each system is allocated a pro rata share of that position based on its proportion of K – 6 enrollment.
FORMULA: ADM Divided by Grade Level Ratio = Positions The number of positions is multiplied by the state instructional salary unit cost as set by the annual appropriations bill to determine the total component support. For FY19 the state instructional salary unit cost is $47,150.
Elementary Guidance Counselors Ratio Grades K – 6 500:1
EXAMPLE: Grades K – 6 850 Divided by 500 Equals 1.70 1,978 Divided by 500 Equals 3.96
FY 2019 -14- BEP Handbook
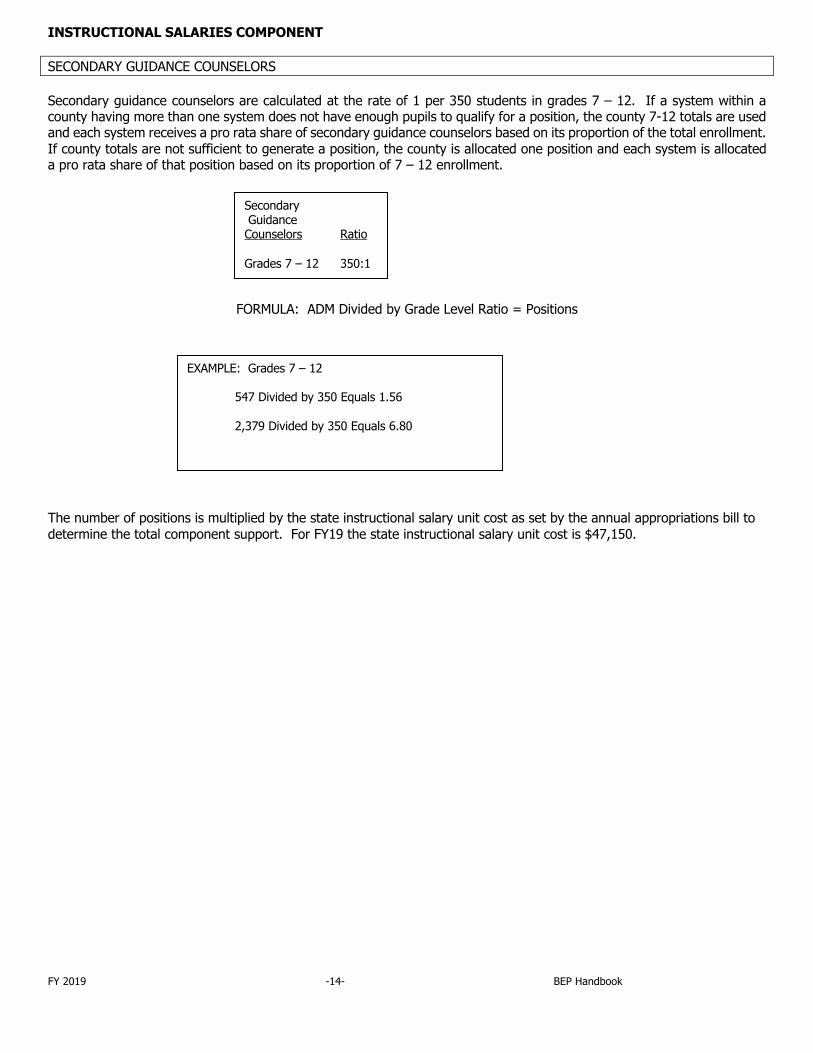
INSTRUCTIONAL SALARIES COMPONENT SECONDARY GUIDANCE COUNSELORS Secondary guidance counselors are calculated at the rate of 1 per 350 students in grades 7 – 12. If a system within a county having more than one system does not have enough pupils to qualify for a position, the county 7-12 totals are used and each system receives a pro rata share of secondary guidance counselors based on its proportion of the total enrollment. If county totals are not sufficient to generate a position, the county is allocated one position and each system is allocated a pro rata share of that position based on its proportion of 7 – 12 enrollment.
FORMULA: ADM Divided by Grade Level Ratio = Positions The number of positions is multiplied by the state instructional salary unit cost as set by the annual appropriations bill to determine the total component support. For FY19 the state instructional salary unit cost is $47,150.
Secondary Guidance Counselors Ratio Grades 7 – 12 350:1
EXAMPLE: Grades 7 – 12 547 Divided by 350 Equals 1.56 2,379 Divided by 350 Equals 6.80
FY 2019 -15- BEP Handbook
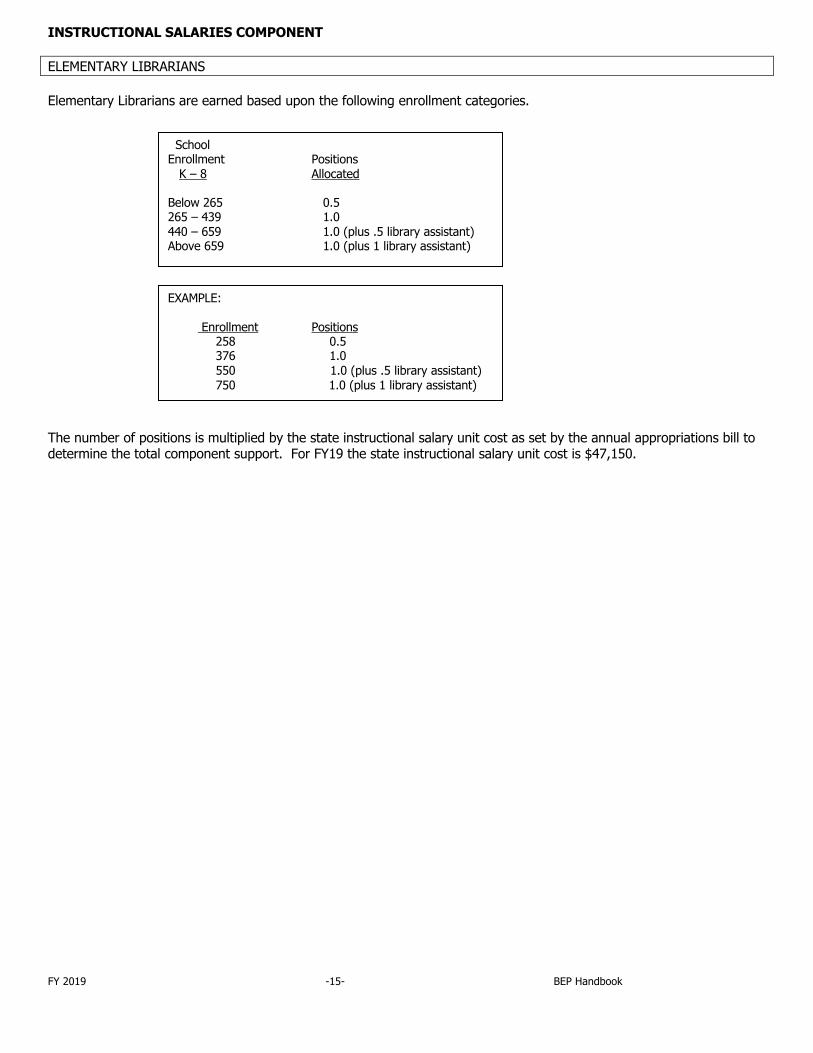
INSTRUCTIONAL SALARIES COMPONENT ELEMENTARY LIBRARIANS Elementary Librarians are earned based upon the following enrollment categories. The number of positions is multiplied by the state instructional salary unit cost as set by the annual appropriations bill to determine the total component support. For FY19 the state instructional salary unit cost is $47,150.
School Enrollment Positions K – 8 Allocated Below 265 0.5 265 – 439 1.0
440-659 440 – 659 1.0 (plus .5 library assistant) Above 659 1.0 (plus 1 library assistant)
EXAMPLE: Enrollment Positions
258 0.5 376 1.0 550 1.0 (plus .5 library assistant)
750 1.0 (plus 1 library assistant)
FY 2019 -16- BEP Handbook
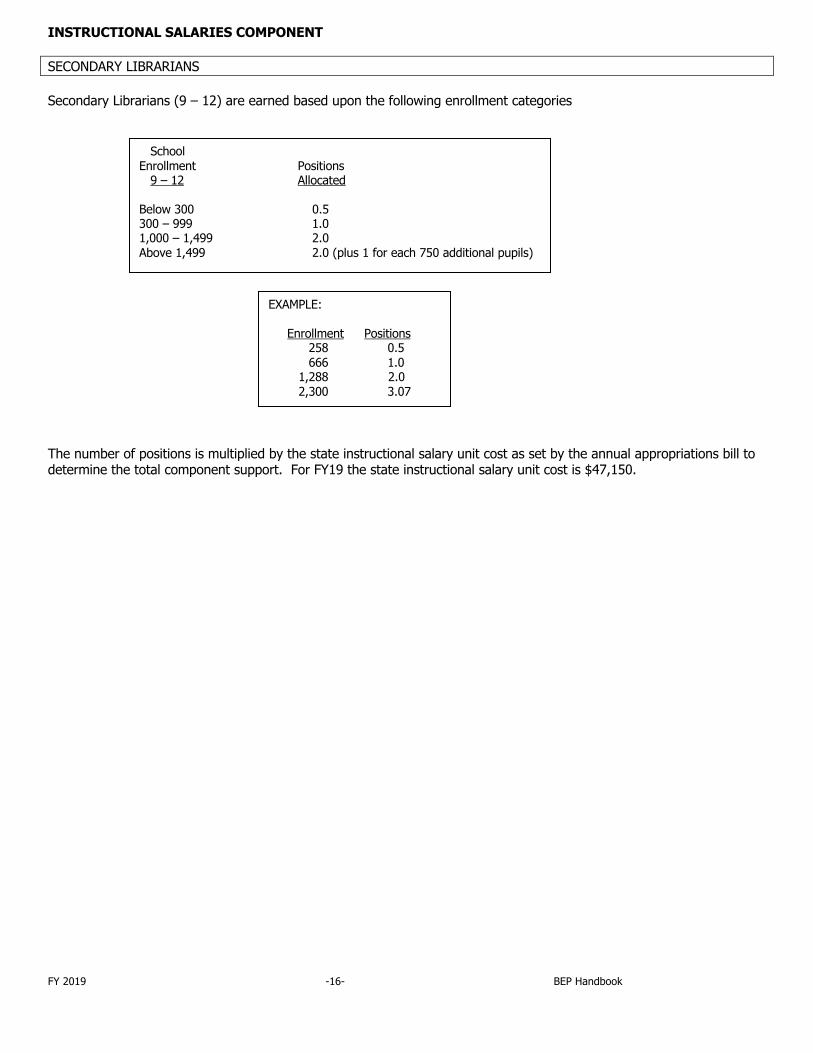
INSTRUCTIONAL SALARIES COMPONENT SECONDARY LIBRARIANS Secondary Librarians (9 – 12) are earned based upon the following enrollment categories The number of positions is multiplied by the state instructional salary unit cost as set by the annual appropriations bill to determine the total component support. For FY19 the state instructional salary unit cost is $47,150.
School Enrollment Positions 9 – 12 Allocated Below 300 0.5 300 – 999 1.0 1,000 – 1,499 2.0 Above 1,499 2.0 (plus 1 for each 750 additional pupils)
EXAMPLE: Enrollment Positions 258 0.5
666 1.0 1,288 2.0
2,300 3.07
FY 2019 -17- BEP Handbook
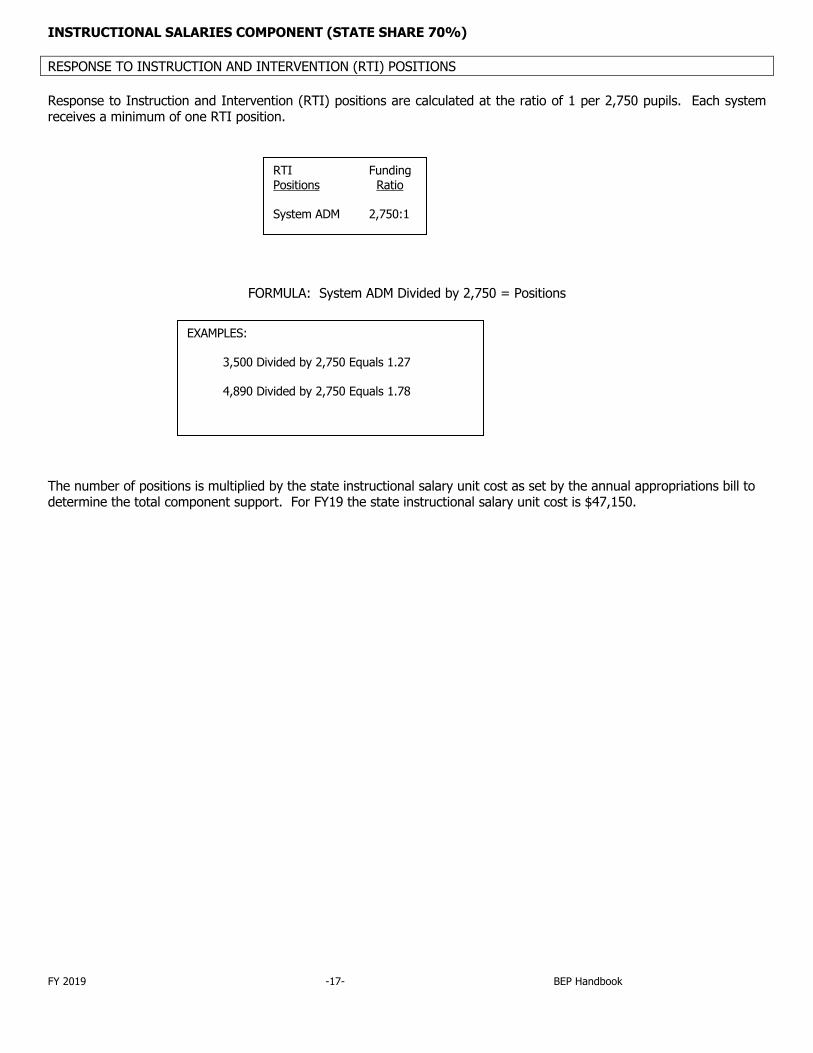
INSTRUCTIONAL SALARIES COMPONENT (STATE SHARE 70%) RESPONSE TO INSTRUCTION AND INTERVENTION (RTI) POSITIONS Response to Instruction and Intervention (RTI) positions are calculated at the ratio of 1 per 2,750 pupils. Each system receives a minimum of one RTI position.
FORMULA: System ADM Divided by 2,750 = Positions The number of positions is multiplied by the state instructional salary unit cost as set by the annual appropriations bill to determine the total component support. For FY19 the state instructional salary unit cost is $47,150.
RTI Funding Positions Ratio System ADM 2,750:1
EXAMPLES: 3,500 Divided by 2,750 Equals 1.27 4,890 Divided by 2,750 Equals 1.78
FY 2019 -18- BEP Handbook
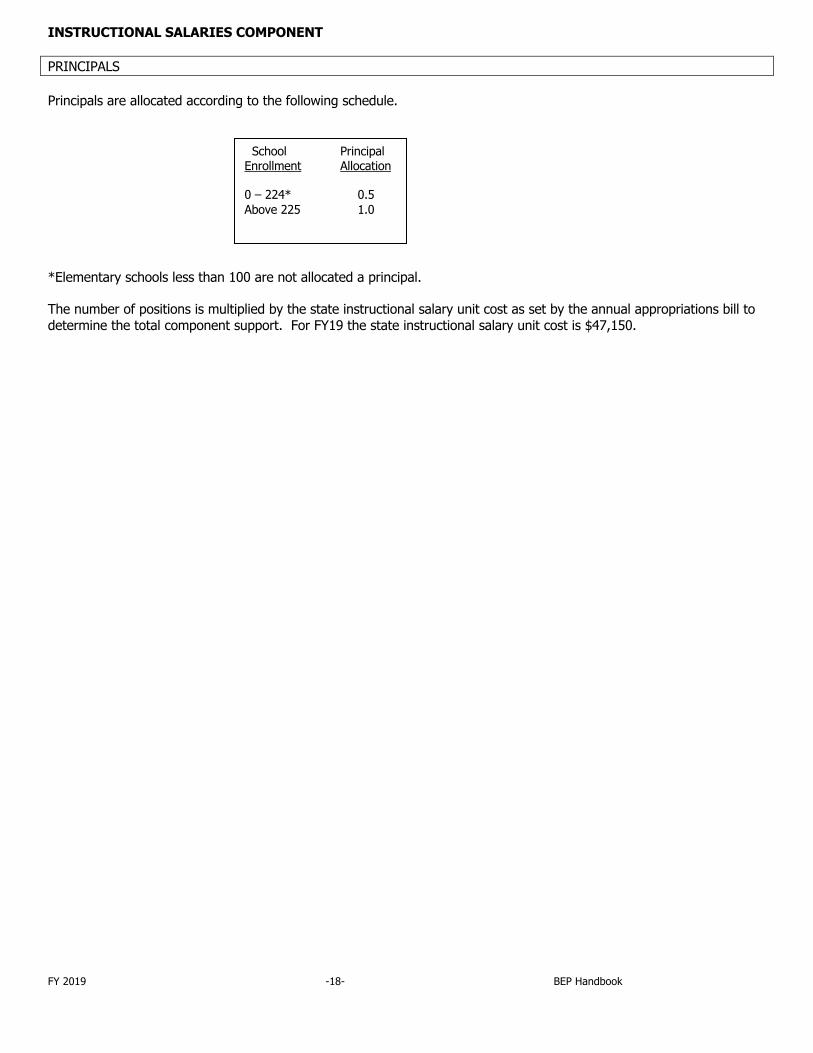
INSTRUCTIONAL SALARIES COMPONENT PRINCIPALS Principals are allocated according to the following schedule. *Elementary schools less than 100 are not allocated a principal. The number of positions is multiplied by the state instructional salary unit cost as set by the annual appropriations bill to determine the total component support. For FY19 the state instructional salary unit cost is $47,150.
School Principal Enrollment Allocation 0 – 224* 0.5 Above 225 1.0
FY 2019 -19- BEP Handbook
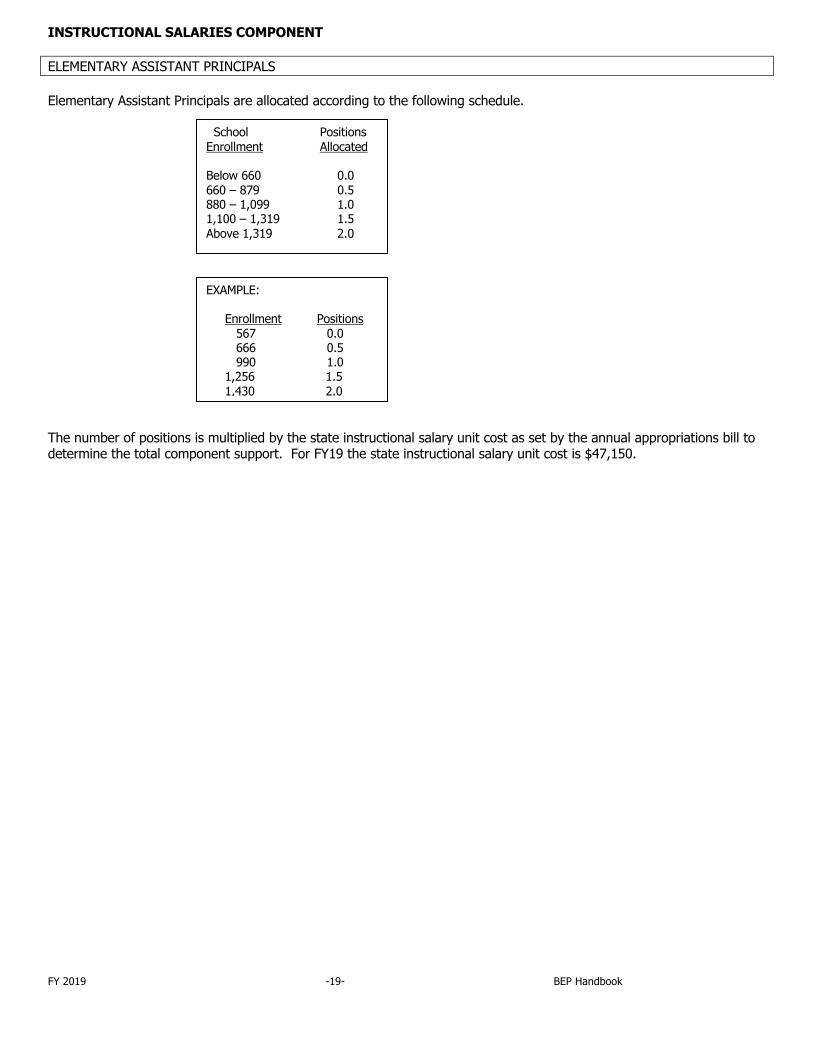
INSTRUCTIONAL SALARIES COMPONENT ELEMENTARY ASSISTANT PRINCIPALS Elementary Assistant Principals are allocated according to the following schedule. The number of positions is multiplied by the state instructional salary unit cost as set by the annual appropriations bill to determine the total component support. For FY19 the state instructional salary unit cost is $47,150.
School Positions Enrollment Allocated Below 660 0.0 660 – 879 0.5 880 – 1,099 1.0 1,100 – 1,319 1.5 Above 1,319 2.0
EXAMPLE: Enrollment Positions 567 0.0 666 0.5 990 1.0 1,256 1.5 1,430 2.0
FY 2019 -20- BEP Handbook
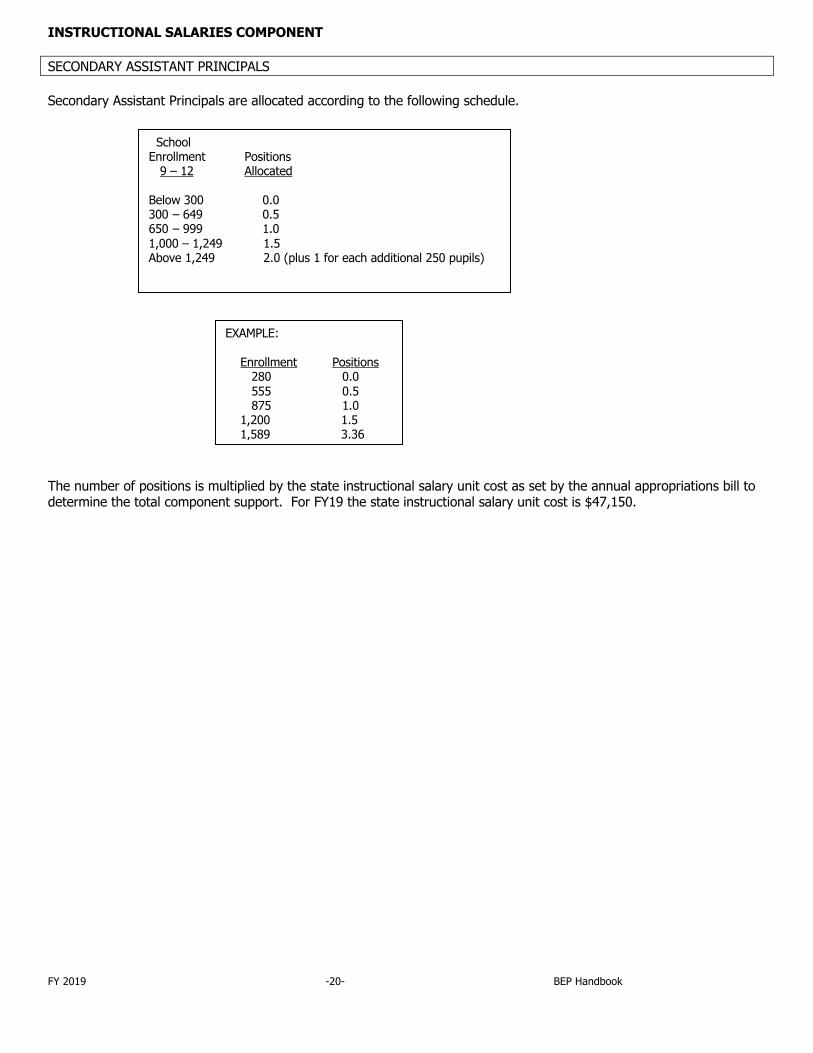
INSTRUCTIONAL SALARIES COMPONENT SECONDARY ASSISTANT PRINCIPALS Secondary Assistant Principals are allocated according to the following schedule. The number of positions is multiplied by the state instructional salary unit cost as set by the annual appropriations bill to determine the total component support. For FY19 the state instructional salary unit cost is $47,150.
School Enrollment Positions 9 – 12 Allocated Below 300 0.0 300 – 649 0.5 650 – 999 1.0 1,000 – 1,249 1.5 Above 1,249 2.0 (plus 1 for each additional 250 pupils)
EXAMPLE: Enrollment Positions 280 0.0 555 0.5 875 1.0 1,200 1.5 1,589 3.36
FY 2019 -21- BEP Handbook
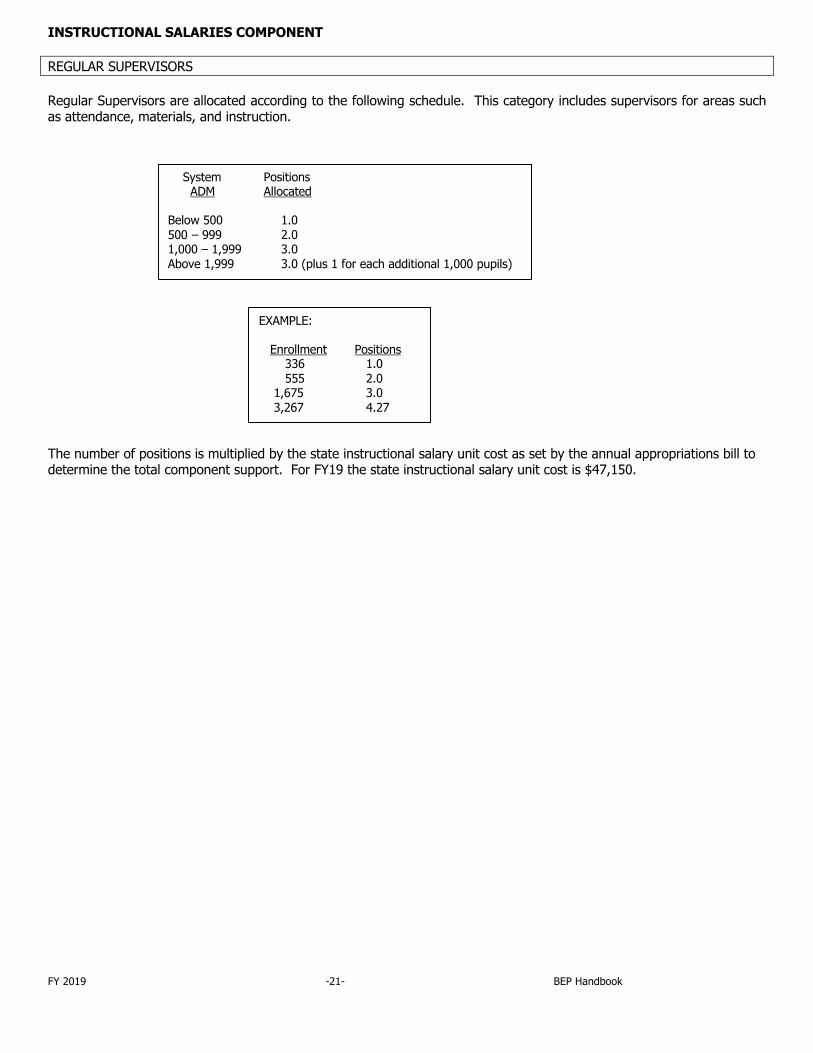
INSTRUCTIONAL SALARIES COMPONENT REGULAR SUPERVISORS Regular Supervisors are allocated according to the following schedule. This category includes supervisors for areas such as attendance, materials, and instruction. The number of positions is multiplied by the state instructional salary unit cost as set by the annual appropriations bill to determine the total component support. For FY19 the state instructional salary unit cost is $47,150.
System Positions ADM Allocated Below 500 1.0 500 – 999 2.0 1,000 – 1,999 3.0 Above 1,999 3.0 (plus 1 for each additional 1,000 pupils)
EXAMPLE: Enrollment Positions 336 1.0 555 2.0 1,675 3.0 3,267 4.27

FY 2019 -22- BEP Handbook
INSTRUCTIONAL SALARIES COMPONENT SPECIAL EDUCATION SUPERVISORS Special Education Supervisors are calculated at the ratio of 1 per 750 identified and served students.
FORMULA: Identified & Served Divided by 750 = Positions The number of positions is multiplied by the state instructional salary unit cost as set by the annual appropriations bill to determine the total component support. For FY19 the state instructional salary unit cost is $47,150.
Special Education Funding Supervisors Ratio Identified & Served 750:1
EXAMPLES: 850 Divided by 750 Equals 1.13 1,978 Divided by 750 Equals 2.64
FY 2019 -23- BEP Handbook
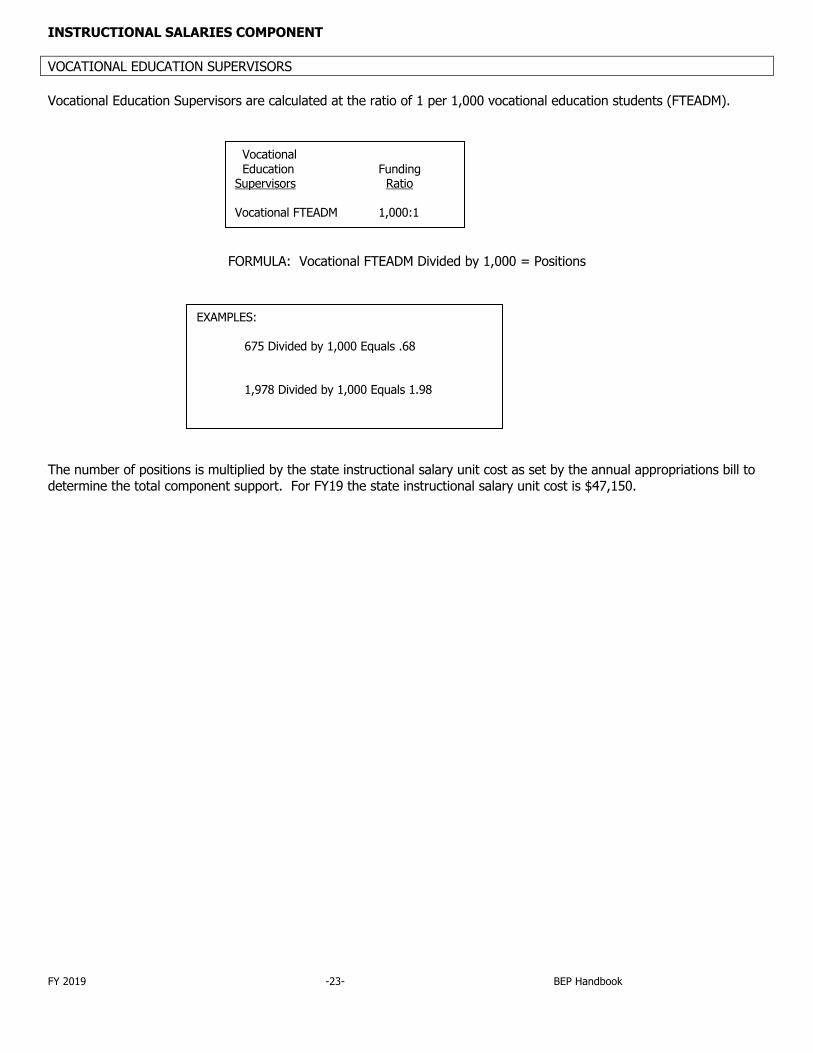
INSTRUCTIONAL SALARIES COMPONENT VOCATIONAL EDUCATION SUPERVISORS Vocational Education Supervisors are calculated at the ratio of 1 per 1,000 vocational education students (FTEADM).
FORMULA: Vocational FTEADM Divided by 1,000 = Positions The number of positions is multiplied by the state instructional salary unit cost as set by the annual appropriations bill to determine the total component support. For FY19 the state instructional salary unit cost is $47,150.
Vocational Education Funding Supervisors Ratio Vocational FTEADM 1,000:1
EXAMPLES: 675 Divided by 1,000 Equals .68 1,978 Divided by 1,000 Equals 1.98
FY 2019 -24- BEP Handbook
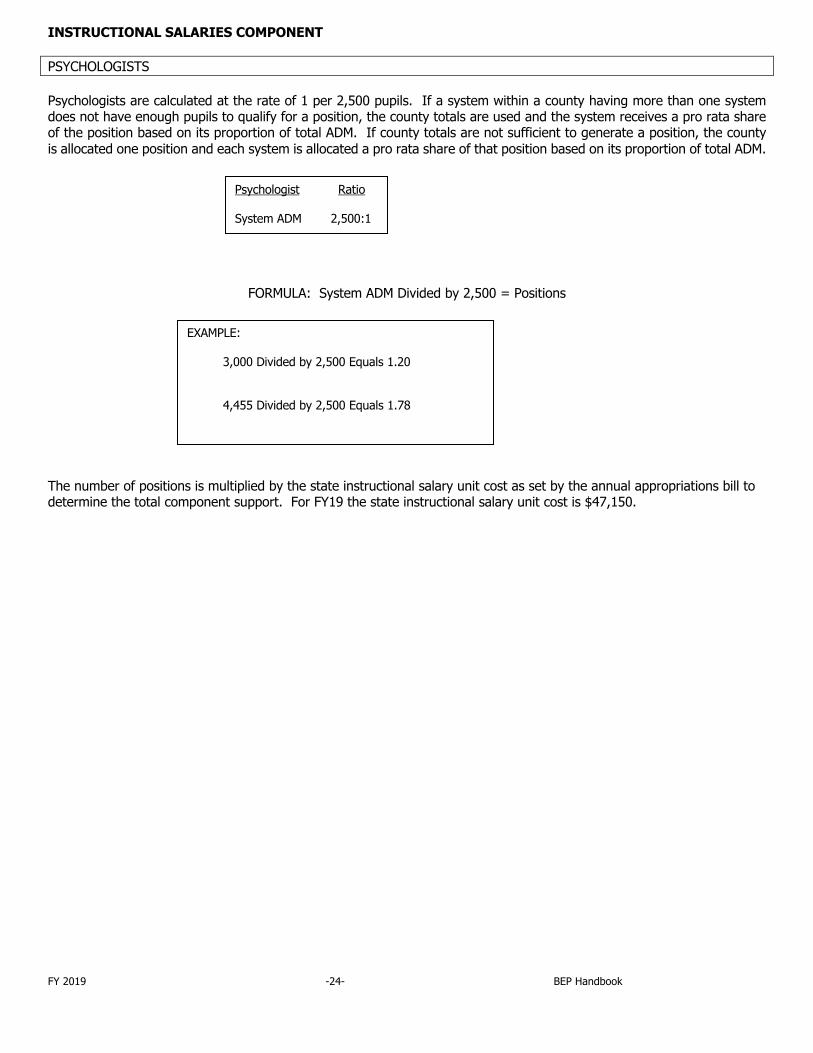
INSTRUCTIONAL SALARIES COMPONENT PSYCHOLOGISTS Psychologists are calculated at the rate of 1 per 2,500 pupils. If a system within a county having more than one system does not have enough pupils to qualify for a position, the county totals are used and the system receives a pro rata share of the position based on its proportion of total ADM. If county totals are not sufficient to generate a position, the county is allocated one position and each system is allocated a pro rata share of that position based on its proportion of total ADM.
FORMULA: System ADM Divided by 2,500 = Positions The number of positions is multiplied by the state instructional salary unit cost as set by the annual appropriations bill to determine the total component support. For FY19 the state instructional salary unit cost is $47,150.
Psychologist Ratio System ADM 2,500:1
EXAMPLE: 3,000 Divided by 2,500 Equals 1.20 4,455 Divided by 2,500 Equals 1.78
FY 2019 -25- BEP Handbook
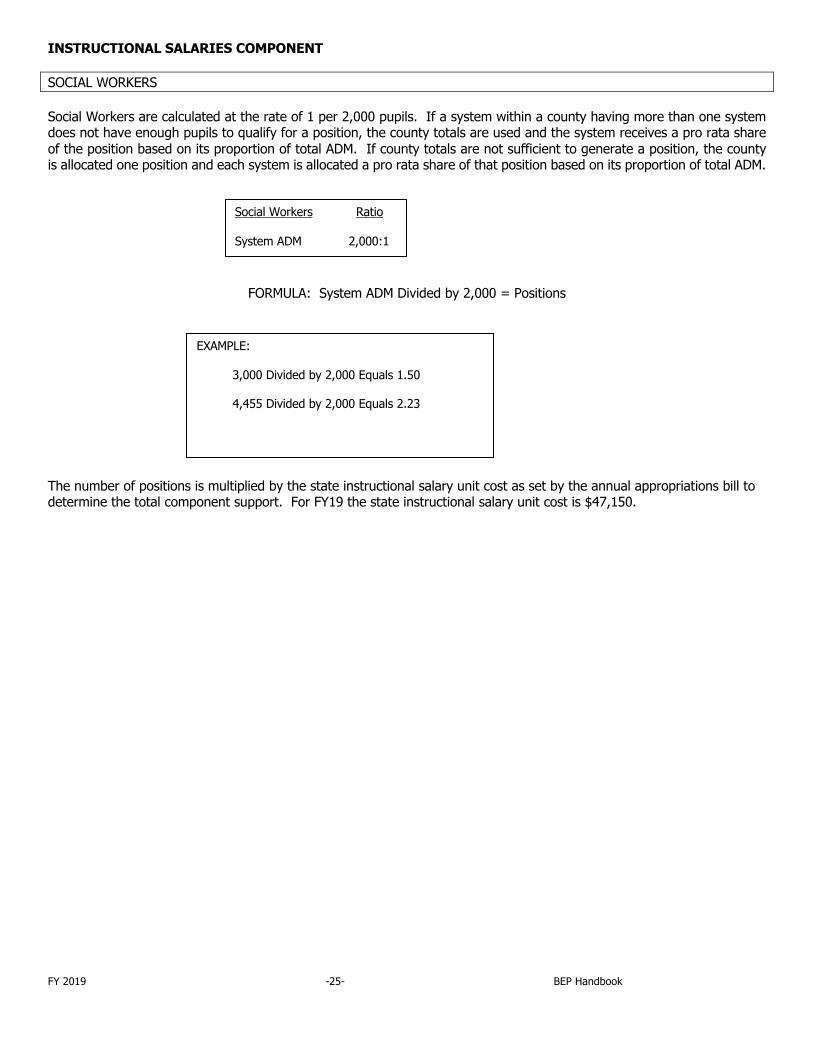
INSTRUCTIONAL SALARIES COMPONENT SOCIAL WORKERS Social Workers are calculated at the rate of 1 per 2,000 pupils. If a system within a county having more than one system does not have enough pupils to qualify for a position, the county totals are used and the system receives a pro rata share of the position based on its proportion of total ADM. If county totals are not sufficient to generate a position, the county is allocated one position and each system is allocated a pro rata share of that position based on its proportion of total ADM.
FORMULA: System ADM Divided by 2,000 = Positions The number of positions is multiplied by the state instructional salary unit cost as set by the annual appropriations bill to determine the total component support. For FY19 the state instructional salary unit cost is $47,150.
Social Workers Ratio System ADM 2,000:1
EXAMPLE: 3,000 Divided by 2,000 Equals 1.50 4,455 Divided by 2,000 Equals 2.23
FY 2019 -26- BEP Handbook
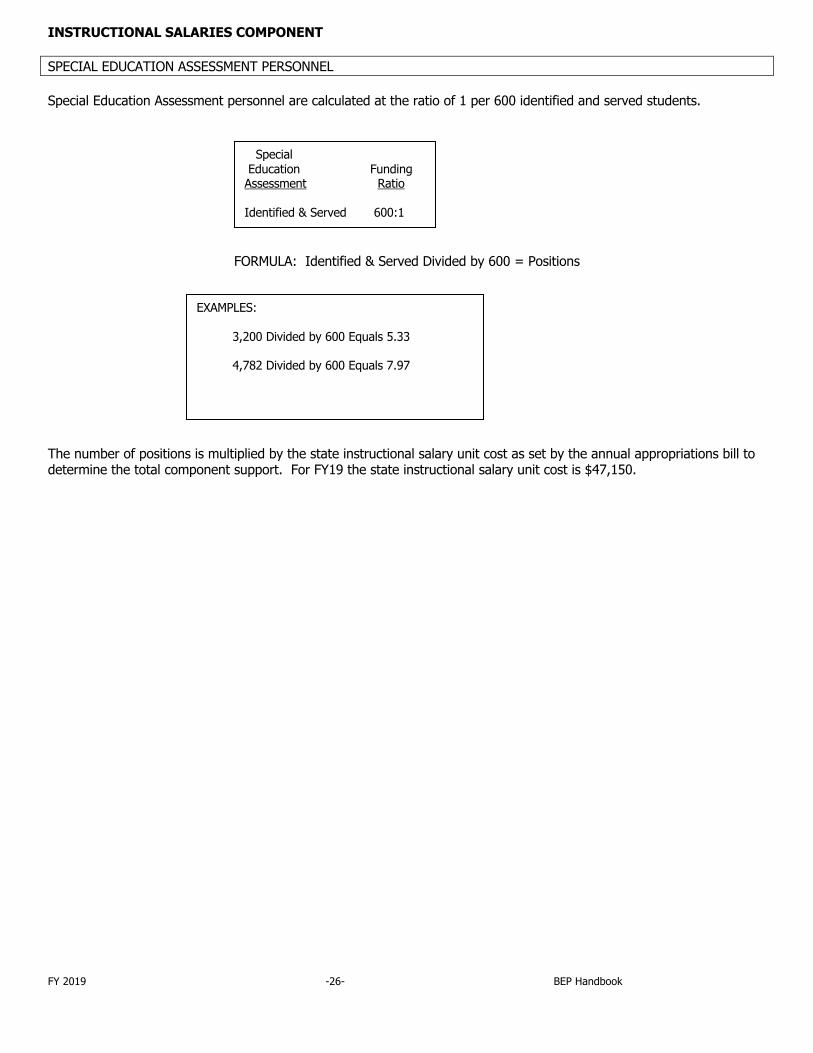
INSTRUCTIONAL SALARIES COMPONENT SPECIAL EDUCATION ASSESSMENT PERSONNEL Special Education Assessment personnel are calculated at the ratio of 1 per 600 identified and served students.
FORMULA: Identified & Served Divided by 600 = Positions
The number of positions is multiplied by the state instructional salary unit cost as set by the annual appropriations bill to determine the total component support. For FY19 the state instructional salary unit cost is $47,150.
Special Education Funding Assessment Ratio Identified & Served 600:1
EXAMPLES: 3,200 Divided by 600 Equals 5.33 4,782 Divided by 600 Equals 7.97
FY 2019 -27- BEP Handbook
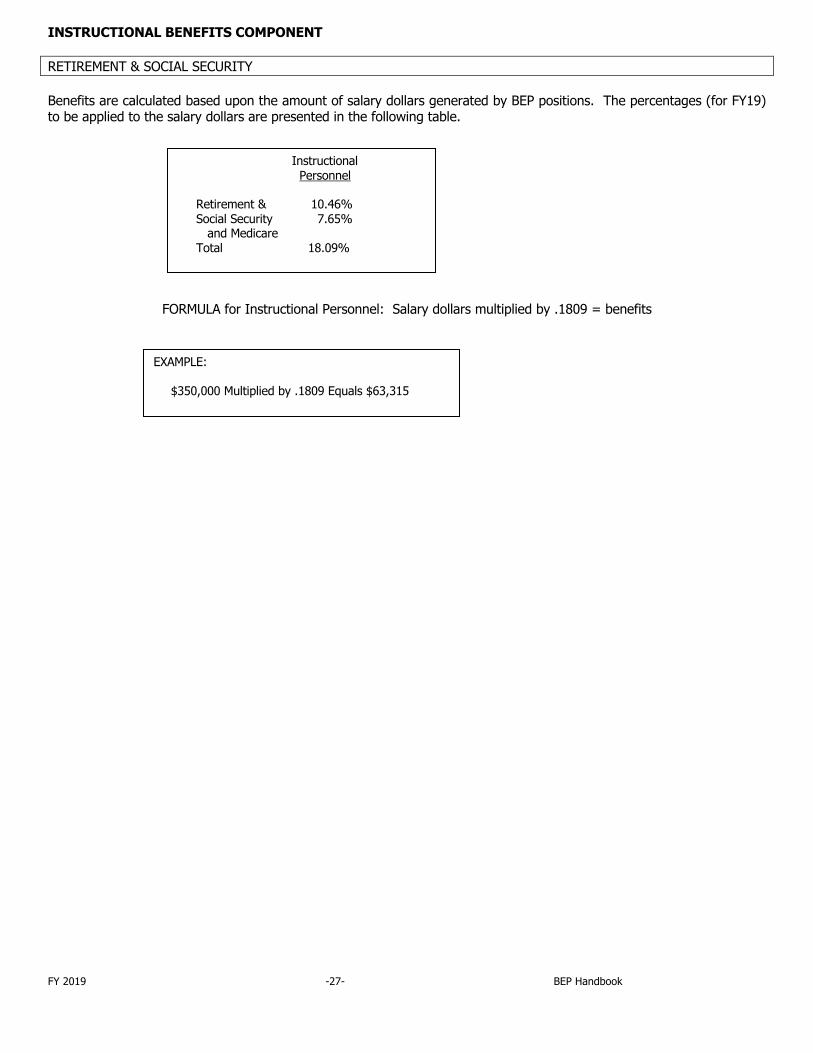
INSTRUCTIONAL BENEFITS COMPONENT RETIREMENT & SOCIAL SECURITY Benefits are calculated based upon the amount of salary dollars generated by BEP positions. The percentages (for FY19) to be applied to the salary dollars are presented in the following table.
FORMULA for Instructional Personnel: Salary dollars multiplied by .1809 = benefits
Instructional Personnel Retirement & 10.46% Social Security 7.65% and Medicare Total 18.09%
EXAMPLE: $350,000 Multiplied by .1809 Equals $63,315
FY 2019 -28- BEP Handbook
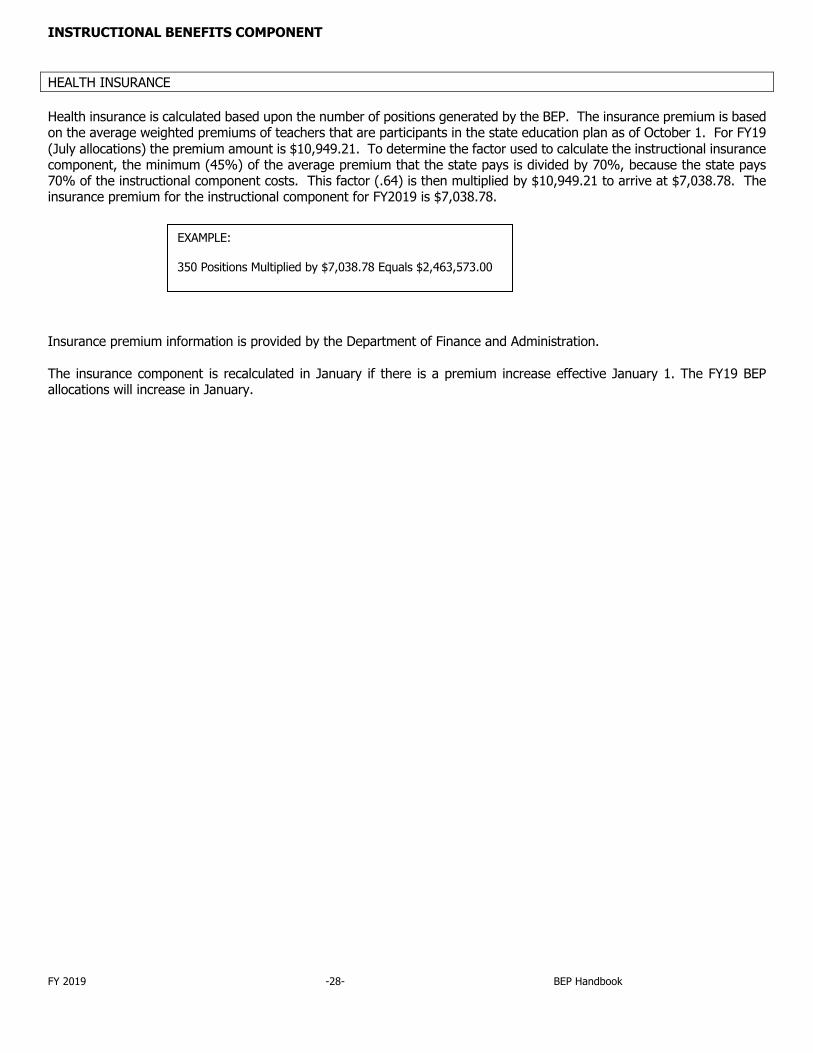
INSTRUCTIONAL BENEFITS COMPONENT HEALTH INSURANCE Health insurance is calculated based upon the number of positions generated by the BEP. The insurance premium is based on the average weighted premiums of teachers that are participants in the state education plan as of October 1. For FY19 (July allocations) the premium amount is $10,949.21. To determine the factor used to calculate the instructional insurance component, the minimum (45%) of the average premium that the state pays is divided by 70%, because the state pays 70% of the instructional component costs. This factor (.64) is then multiplied by $10,949.21 to arrive at $7,038.78. The insurance premium for the instructional component for FY2019 is $7,038.78. Insurance premium information is provided by the Department of Finance and Administration. The insurance component is recalculated in January if there is a premium increase effective January 1. The FY19 BEP allocations will increase in January.
EXAMPLE: 350 Positions Multiplied by $7,038.78 Equals $2,463,573.00
FY 2019 -29- BEP Handbook
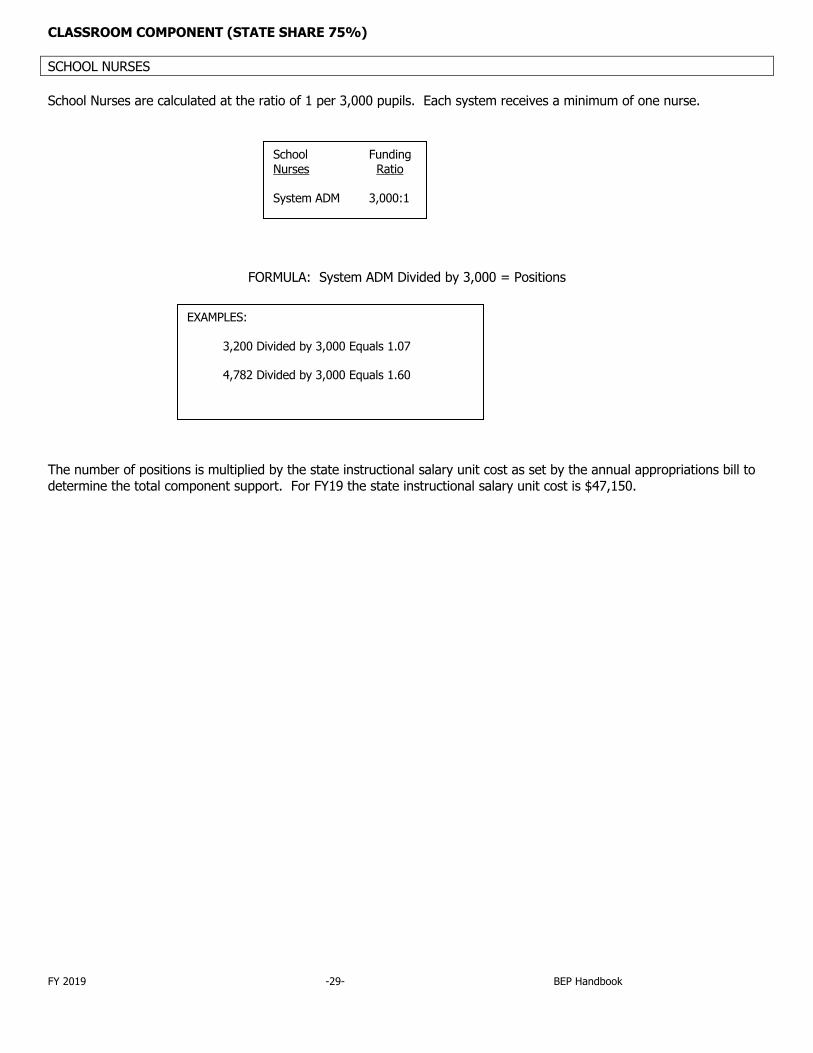
CLASSROOM COMPONENT (STATE SHARE 75%) SCHOOL NURSES School Nurses are calculated at the ratio of 1 per 3,000 pupils. Each system receives a minimum of one nurse.
FORMULA: System ADM Divided by 3,000 = Positions The number of positions is multiplied by the state instructional salary unit cost as set by the annual appropriations bill to determine the total component support. For FY19 the state instructional salary unit cost is $47,150.
School Funding Nurses Ratio System ADM 3,000:1
EXAMPLES: 3,200 Divided by 3,000 Equals 1.07 4,782 Divided by 3,000 Equals 1.60
FY 2019 -30- BEP Handbook
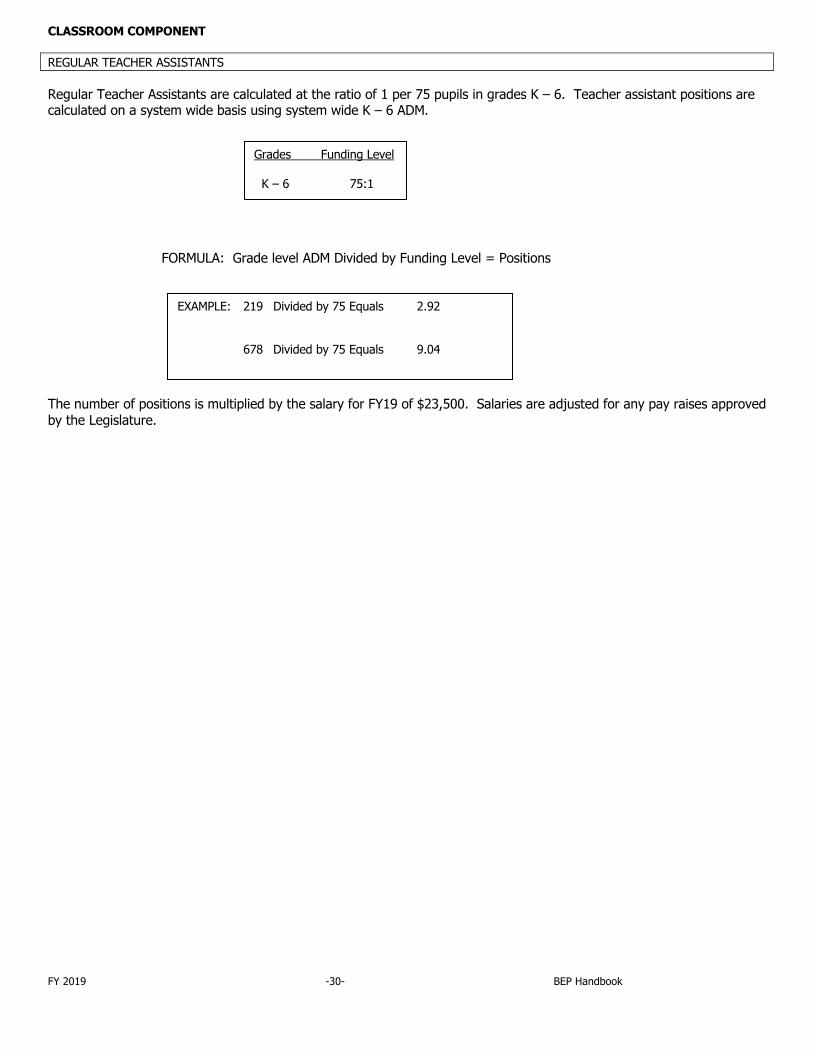
CLASSROOM COMPONENT REGULAR TEACHER ASSISTANTS Regular Teacher Assistants are calculated at the ratio of 1 per 75 pupils in grades K – 6. Teacher assistant positions are calculated on a system wide basis using system wide K – 6 ADM. FORMULA: Grade level ADM Divided by Funding Level = Positions The number of positions is multiplied by the salary for FY19 of $23,500. Salaries are adjusted for any pay raises approved by the Legislature.
Grades Funding Level K – 6 75:1
EXAMPLE: 219 Divided by 75 Equals 2.92 678 Divided by 75 Equals 9.04
FY 2019 -31- BEP Handbook
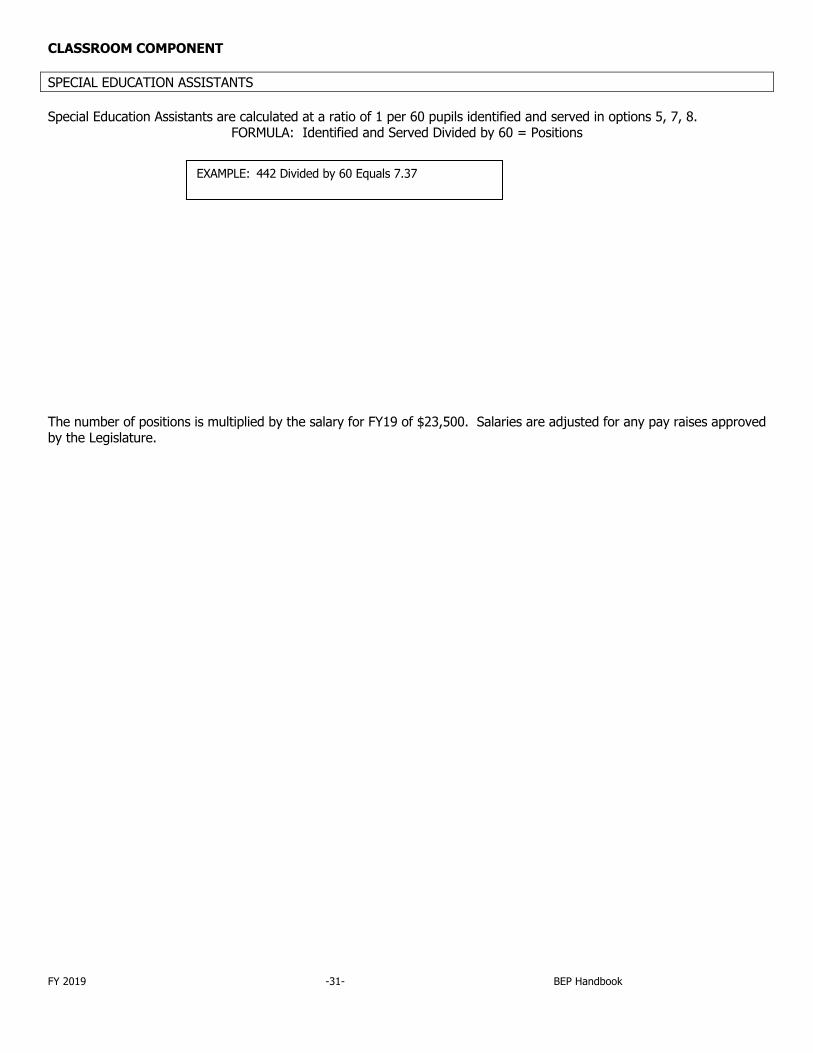
CLASSROOM COMPONENT SPECIAL EDUCATION ASSISTANTS Special Education Assistants are calculated at a ratio of 1 per 60 pupils identified and served in options 5, 7, 8.
FORMULA: Identified and Served Divided by 60 = Positions The number of positions is multiplied by the salary for FY19 of $23,500. Salaries are adjusted for any pay raises approved by the Legislature.
EXAMPLE: 442 Divided by 60 Equals 7.37
FY 2019 -32- BEP Handbook
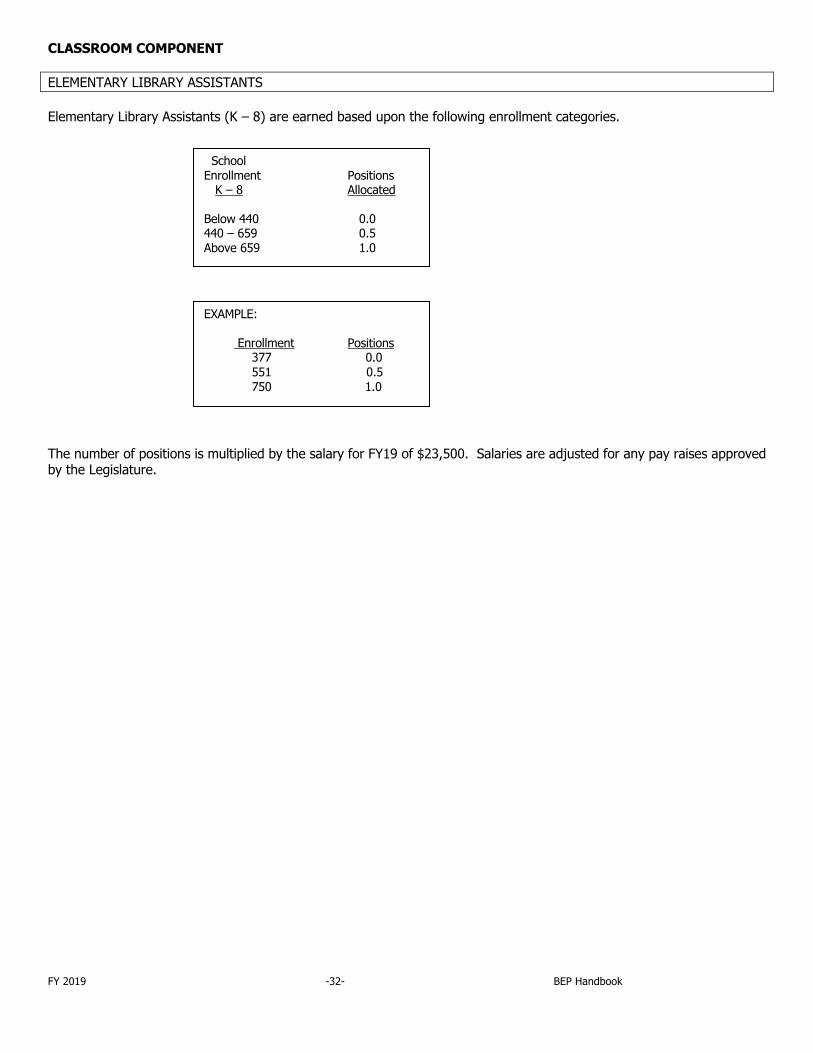
CLASSROOM COMPONENT ELEMENTARY LIBRARY ASSISTANTS Elementary Library Assistants (K – 8) are earned based upon the following enrollment categories. The number of positions is multiplied by the salary for FY19 of $23,500. Salaries are adjusted for any pay raises approved by the Legislature.
School Enrollment Positions K – 8 Allocated Below 440 0.0
440-660 440 – 659 0.5 440-661 Above 659 1.0
EXAMPLE: Enrollment Positions
377 0.0 551 0.5
750 1.0
FY 2019 -33- BEP Handbook
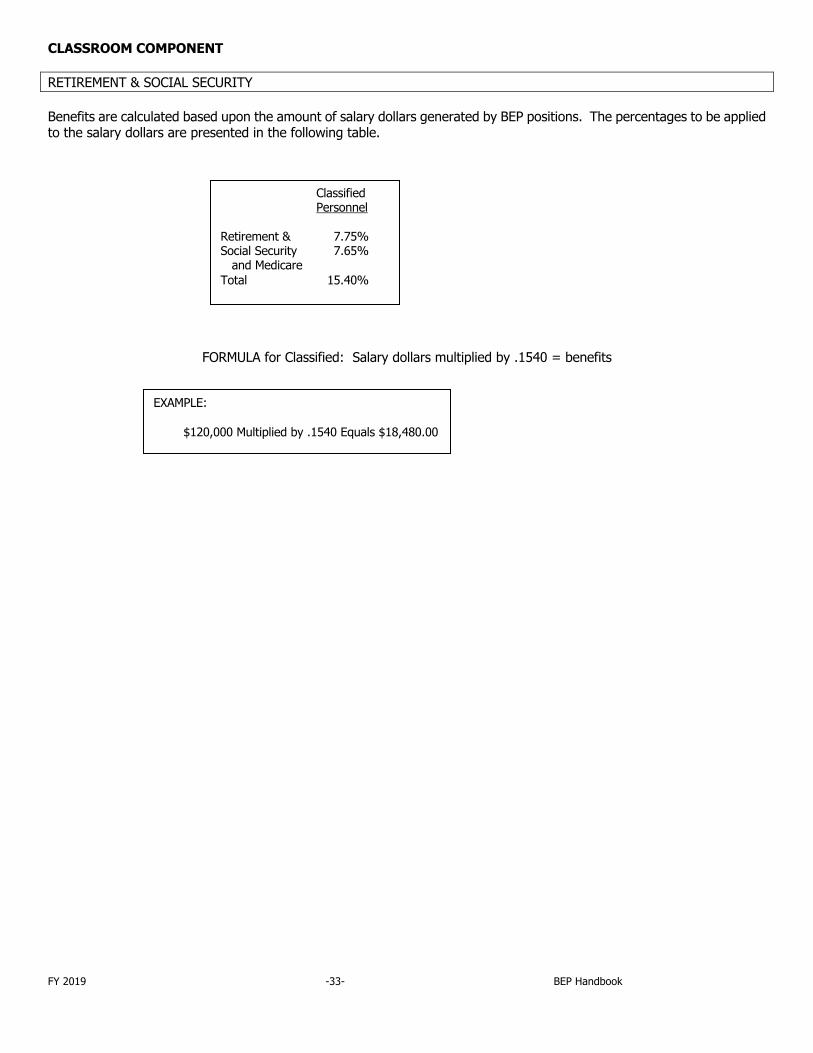
CLASSROOM COMPONENT RETIREMENT & SOCIAL SECURITY Benefits are calculated based upon the amount of salary dollars generated by BEP positions. The percentages to be applied to the salary dollars are presented in the following table.
FORMULA for Classified: Salary dollars multiplied by .1540 = benefits
Classified Personnel Retirement & 7.75% Social Security 7.65% and Medicare Total 15.40%
EXAMPLE: $120,000 Multiplied by .1540 Equals $18,480.00
FY 2019 -34- BEP Handbook
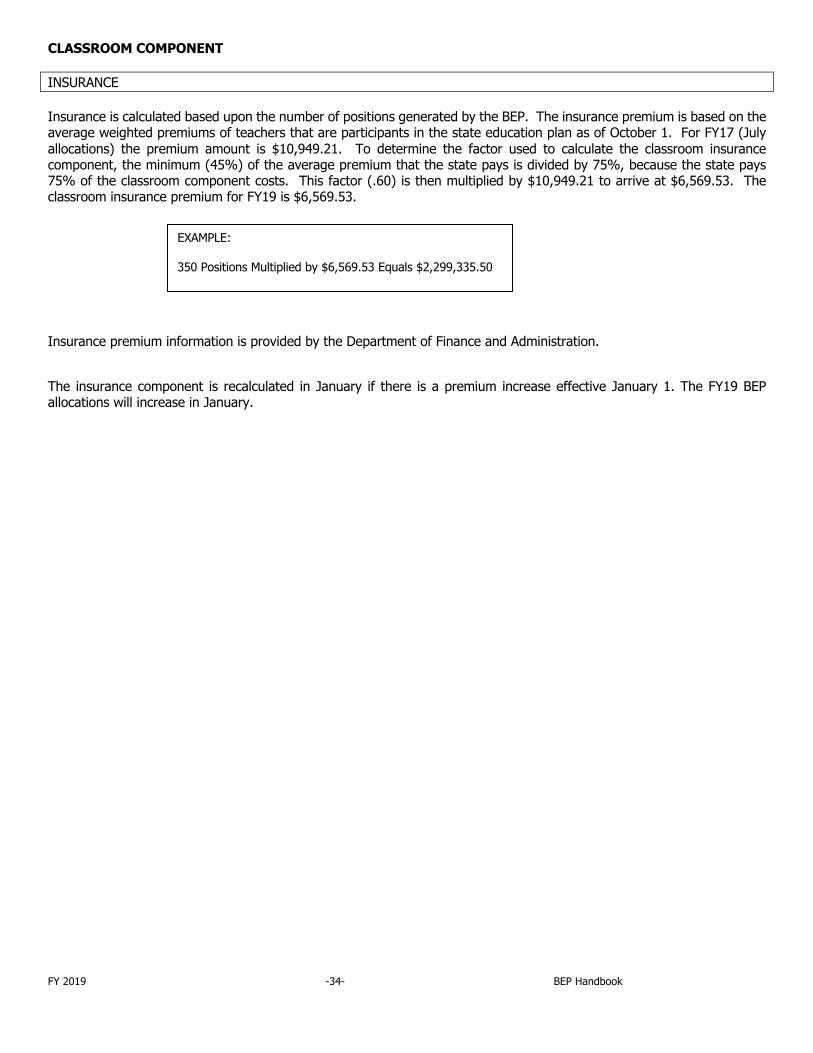
CLASSROOM COMPONENT INSURANCE Insurance is calculated based upon the number of positions generated by the BEP. The insurance premium is based on the average weighted premiums of teachers that are participants in the state education plan as of October 1. For FY17 (July allocations) the premium amount is $10,949.21. To determine the factor used to calculate the classroom insurance component, the minimum (45%) of the average premium that the state pays is divided by 75%, because the state pays 75% of the classroom component costs. This factor (.60) is then multiplied by $10,949.21 to arrive at $6,569.53. The classroom insurance premium for FY19 is $6,569.53. Insurance premium information is provided by the Department of Finance and Administration. The insurance component is recalculated in January if there is a premium increase effective January 1. The FY19 BEP allocations will increase in January.
EXAMPLE: 350 Positions Multiplied by $6,569.53 Equals $2,299,335.50
FY 2019 -35- BEP Handbook
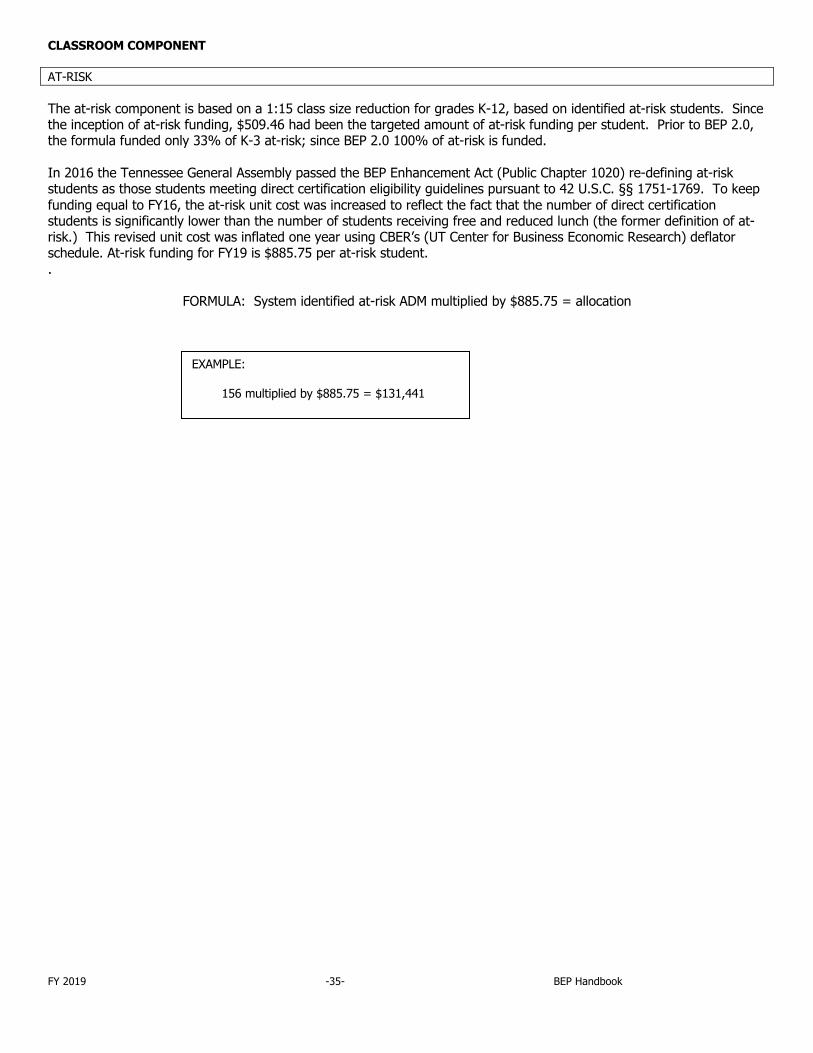
CLASSROOM COMPONENT AT-RISK The at-risk component is based on a 1:15 class size reduction for grades K-12, based on identified at-risk students. Since the inception of at-risk funding, $509.46 had been the targeted amount of at-risk funding per student. Prior to BEP 2.0, the formula funded only 33% of K-3 at-risk; since BEP 2.0 100% of at-risk is funded. In 2016 the Tennessee General Assembly passed the BEP Enhancement Act (Public Chapter 1020) re-defining at-risk students as those students meeting direct certification eligibility guidelines pursuant to 42 U.S.C. §§ 1751-1769. To keep funding equal to FY16, the at-risk unit cost was increased to reflect the fact that the number of direct certification students is significantly lower than the number of students receiving free and reduced lunch (the former definition of at-risk.) This revised unit cost was inflated one year using CBER’s (UT Center for Business Economic Research) deflator schedule. At-risk funding for FY19 is $885.75 per at-risk student. .
FORMULA: System identified at-risk ADM multiplied by $885.75 = allocation
EXAMPLE: 156 multiplied by $885.75 = $131,441
FY 2019 -36- BEP Handbook
CLASSROOM COMPONENT SUBSTITUTE TEACHERS Total expenditure data from three consecutive prior years is divided by same year ADM. The three years expenditure data per ADM is then averaged and inflated up two fiscal years using CBER’s (UT Center for Business Economic Research) deflator schedule. The Substitute teacher for FY19 is allocated at the rate of $61.75 per pupil. FORMULA: System ADM multiplied by $61.75 = allocation
EXAMPLE: 1,247 multiplied by $61.75 Equals $77,002.25
FY 2019 -37- BEP Handbook
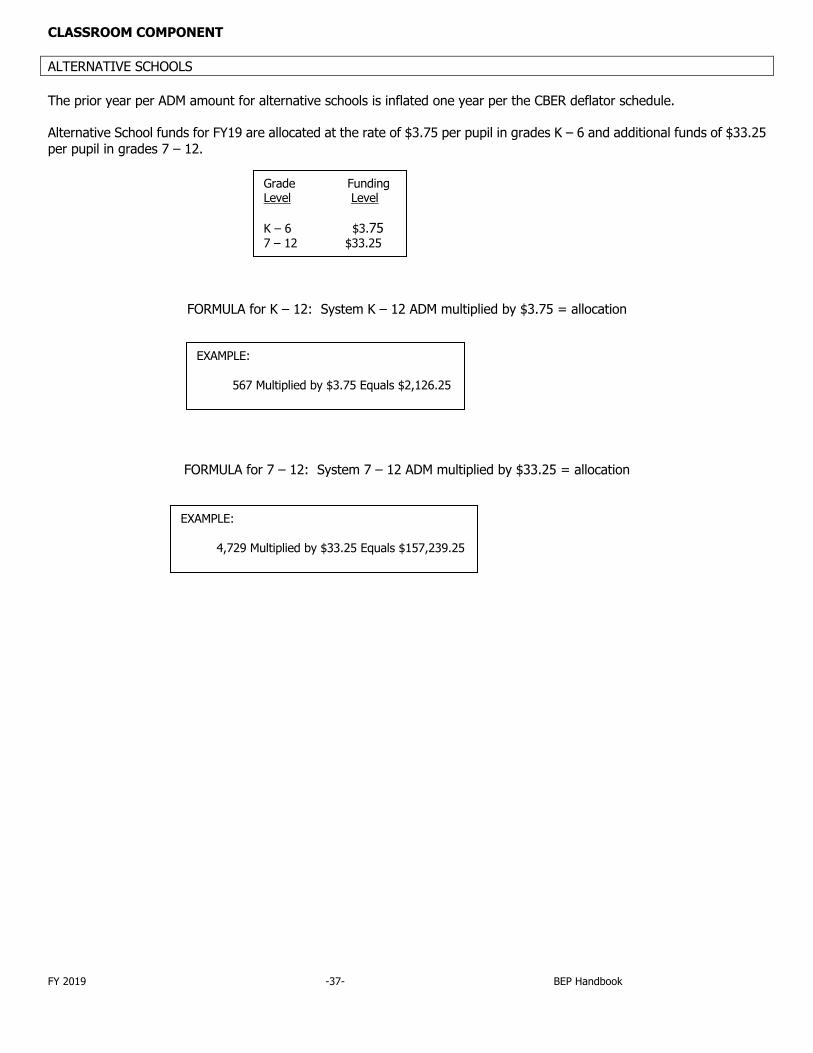
CLASSROOM COMPONENT ALTERNATIVE SCHOOLS The prior year per ADM amount for alternative schools is inflated one year per the CBER deflator schedule. Alternative School funds for FY19 are allocated at the rate of $3.75 per pupil in grades K – 6 and additional funds of $33.25 per pupil in grades 7 – 12.
FORMULA for K – 12: System K – 12 ADM multiplied by $3.75 = allocation
FORMULA for 7 – 12: System 7 – 12 ADM multiplied by $33.25 = allocation
Grade Funding Level Level K – 6 $3.75 7 – 12 $33.25
EXAMPLE: 567 Multiplied by $3.75 Equals $2,126.25
EXAMPLE: 4,729 Multiplied by $33.25 Equals $157,239.25
FY 2019 -38- BEP Handbook
CLASSROOM COMPONENT DUTY FREE LUNCH The prior year per ADM duty free lunch amount is inflated one year per the CBER deflator schedule. Duty Free Lunch funds for FY19 are allocated at the rate of $12.25 per pupil. FORMULA: System ADM multiplied by $12.25 = allocation
EXAMPLE: 2,247 Multiplied by $12.25 Equals $27,525.75
FY 2019 -39- BEP Handbook
CLASSROOM COMPONENT TEXTBOOKS Textbook sales forecast information is received from the Office of Curriculum and Instruction, Textbook Services. This information is averaged with the two prior years to calculate a three-year average for textbook costs. The three-year average is then inflated one year using the CBER deflator schedule. Textbook funds for FY19 are allocated at the rate of $77.50 per pupil. FORMULA: System ADM multiplied by $77.50 = allocation Textbook needs estimate is provided by the Office of Textbook Services, Department of Education.
EXAMPLE: 1,047 Multiplied by $77.50 Equals $81,142.50
FY 2019 -40- BEP Handbook
CLASSROOM COMPONENT MATERIALS AND SUPPLIES Regular Materials and Supplies includes Regular and Alternative Materials and Supplies, and Regular and Alternative Fee Waivers. Total expenditure data from three consecutive prior years is divided by same year ADM. The three years expenditure data per ADM is averaged, and then inflated up two fiscal years using the CBER deflator schedule. Regular Materials and Supplies for FY19 are allocated at the rate of $80.75 per regular student.
FORMULA: Regular ADM multiplied by $80.75 = allocation Special Education Materials and Supplies includes Special Education Materials and Supplies, and Special Education Fee Waivers. Total expenditure data from three consecutive prior years is divided by same year ADM. The three years expenditure data per ADM is averaged, and then inflated up two fiscal years using the CBER deflator schedule. Special Education Materials and Supplies for FY19 are allocated at the rate of $36.50 per special education student.
FORMULA: Special Education Identified & Served multiplied by $36.50 = allocation Vocational Materials and Supplies includes Vocational Materials and Supplies, and Vocational Fee Waivers. Total expenditure data from three consecutive prior years is divided by same year ADM. The three years expenditure data per ADM is averaged, and then inflated up two fiscal years using the CBER deflator schedule. Vocational Education Materials and Supplies for FY19 are allocated at the rate of $157.75 per vocational education student.
FORMULA: Vocational Education FTEADM multiplied by $157.75 = allocation
EXAMPLE: 4,627 Multiplied by $80.75 Equals $373,630.25
EXAMPLE: 256 Multiplied by $36.50 Equals $9,344.00
EXAMPLES: 147 Multiplied by $157.75 Equals $23,189.25

FY 2019 -41- BEP Handbook
CLASSROOM COMPONENT INSTRUCTIONAL EQUIPMENT Regular Instructional Equipment includes Regular Instruction Equipment and Alternative Instruction Equipment. Total expenditure data from three consecutive prior years is divided by same year ADM. The three years expenditure data per ADM is averaged, and then inflated up two fiscal years using the CBER deflator schedule. Regular Instructional Equipment for FY19 is allocated at the rate of $64.25 per regular student.
FORMULA: Regular ADM multiplied by $64.25 = allocation Total expenditure data for Special Education Equipment from three consecutive prior years is divided by same year ADM. The three years expenditure data per ADM is averaged, and then inflated up two fiscal years using the CBER deflator schedule. Special Education Instructional Equipment for FY19 is allocated at the rate of $13.25 per special education student.
FORMULA: Special Education Identified & Served multiplied by $13.25 = allocation Total expenditure data for Vocational Education Equipment from three consecutive prior years is divided by same year ADM. The three years expenditure data per ADM is averaged, and then inflated up two fiscal years using the CBER deflator schedule. Vocational Education Instructional Equipment for FY19 is allocated at the rate of $99.75 per vocational student.
FORMULA: Vocational Education FTEADM multiplied by $99.75 = allocation
EXAMPLE: 4,627 Multiplied by $64.25 Equals $297,284.75
EXAMPLE: 256 Multiplied by $13.25 Equals $3,392.00
EXAMPLE: 147 Multiplied by $99.75 Equals $14,663.25
FY 2019 -42- BEP Handbook
CLASSROOM COMPONENT CLASSROOM-RELATED TRAVEL Regular Classroom-related Travel included Regular Instruction Travel and Alternative Education Travel. Total expenditure data from three consecutive prior years is divided by same year ADM. The three years expenditure data per ADM is averaged, and then inflated up two fiscal years using the CBER deflator schedule. Regular Instructional Travel funds for FY19 are allocated at the rate of $14.50 per regular student.
FORMULA: Regular ADM multiplied by $14.50 = allocation Special Education Classroom-related Travel total expenditure data from three consecutive prior years is divided by same year ADM. The three years expenditure data per ADM is averaged, and then inflated up two fiscal years using the CBER deflator schedule. Special Education Travel funds for FY19 are allocated at the rate of $17.25 per special education student.
FORMULA: Special Education Identified & Served multiplied by $17.25 = allocation Vocational Classroom-related Travel total expenditure data from three consecutive prior years is divided by same year ADM. The three years expenditure data per ADM is averaged, and then inflated up two fiscal years using the CBER deflator schedule. Vocational Education Travel funds for FY19 are allocated at the rate of $50.50 per vocational FTE ADM.
FORMULA: Vocational Education FTEADM multiplied by $50.50 = allocation
EXAMPLE: 4,627 Multiplied by $14.50 Equals $67,091.50
EXAMPLE: 256 Multiplied by $17.25 Equals $4,416.00
EXAMPLE: 148 Multiplied by $50.50 Equals $7,474.00
FY 2019 -43- BEP Handbook
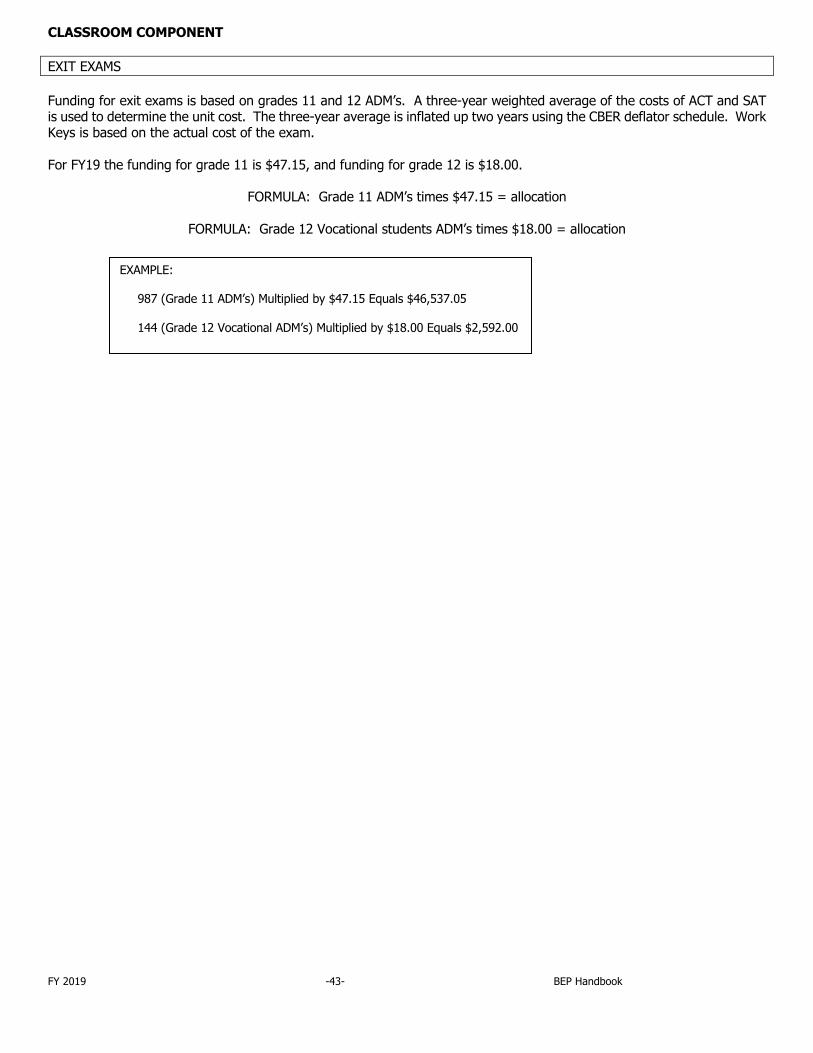
CLASSROOM COMPONENT EXIT EXAMS Funding for exit exams is based on grades 11 and 12 ADM’s. A three-year weighted average of the costs of ACT and SAT is used to determine the unit cost. The three-year average is inflated up two years using the CBER deflator schedule. Work Keys is based on the actual cost of the exam. For FY19 the funding for grade 11 is $47.15, and funding for grade 12 is $18.00.
FORMULA: Grade 11 ADM’s times $47.15 = allocation
FORMULA: Grade 12 Vocational students ADM’s times $18.00 = allocation
EXAMPLE: 987 (Grade 11 ADM’s) Multiplied by $47.15 Equals $46,537.05 144 (Grade 12 Vocational ADM’s) Multiplied by $18.00 Equals $2,592.00
FY 2019 -44- BEP Handbook
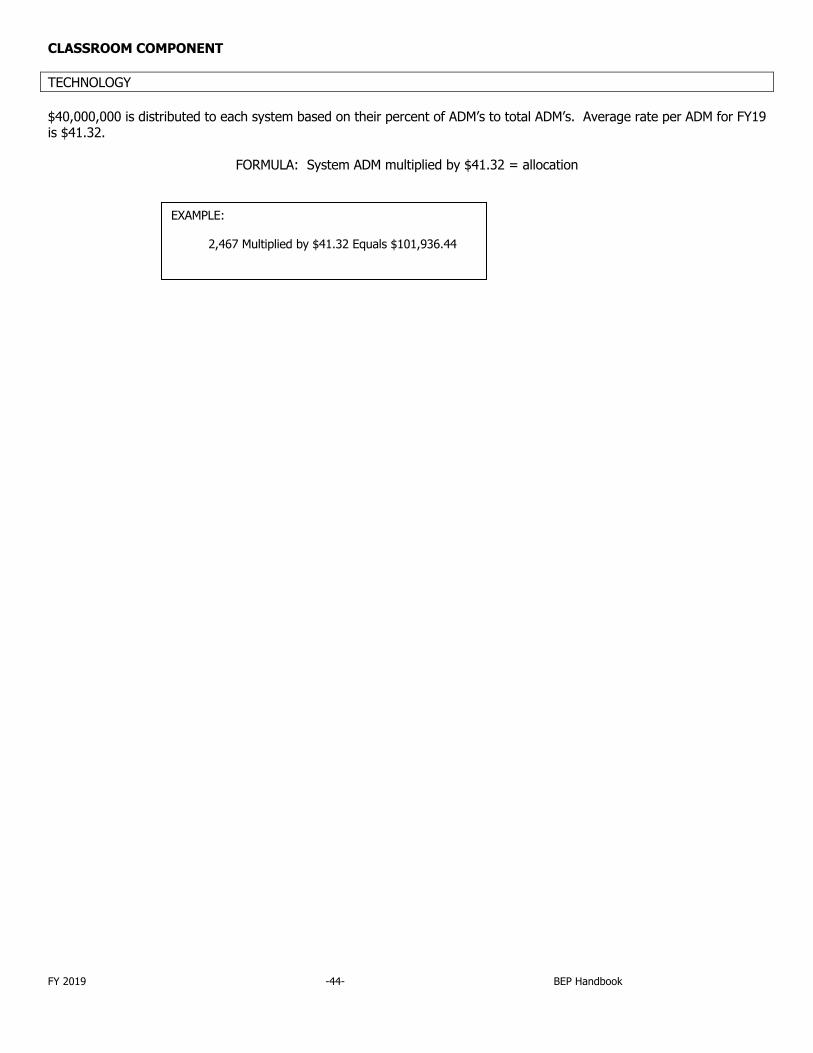
CLASSROOM COMPONENT TECHNOLOGY $40,000,000 is distributed to each system based on their percent of ADM’s to total ADM’s. Average rate per ADM for FY19 is $41.32.
FORMULA: System ADM multiplied by $41.32 = allocation
EXAMPLE: 2,467 Multiplied by $41.32 Equals $101,936.44
FY 2019 -45- BEP Handbook
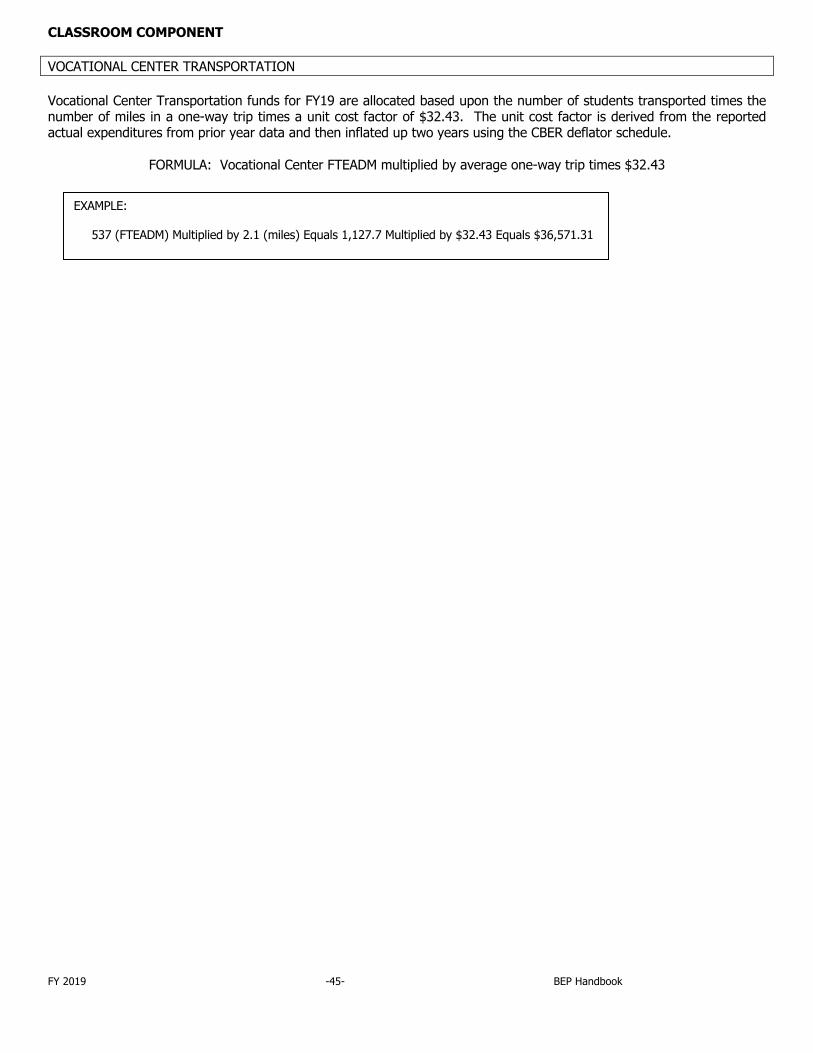
CLASSROOM COMPONENT VOCATIONAL CENTER TRANSPORTATION Vocational Center Transportation funds for FY19 are allocated based upon the number of students transported times the number of miles in a one-way trip times a unit cost factor of $32.43. The unit cost factor is derived from the reported actual expenditures from prior year data and then inflated up two years using the CBER deflator schedule.
FORMULA: Vocational Center FTEADM multiplied by average one-way trip times $32.43
EXAMPLE: 537 (FTEADM) Multiplied by 2.1 (miles) Equals 1,127.7 Multiplied by $32.43 Equals $36,571.31
FY 2019 -46- BEP Handbook
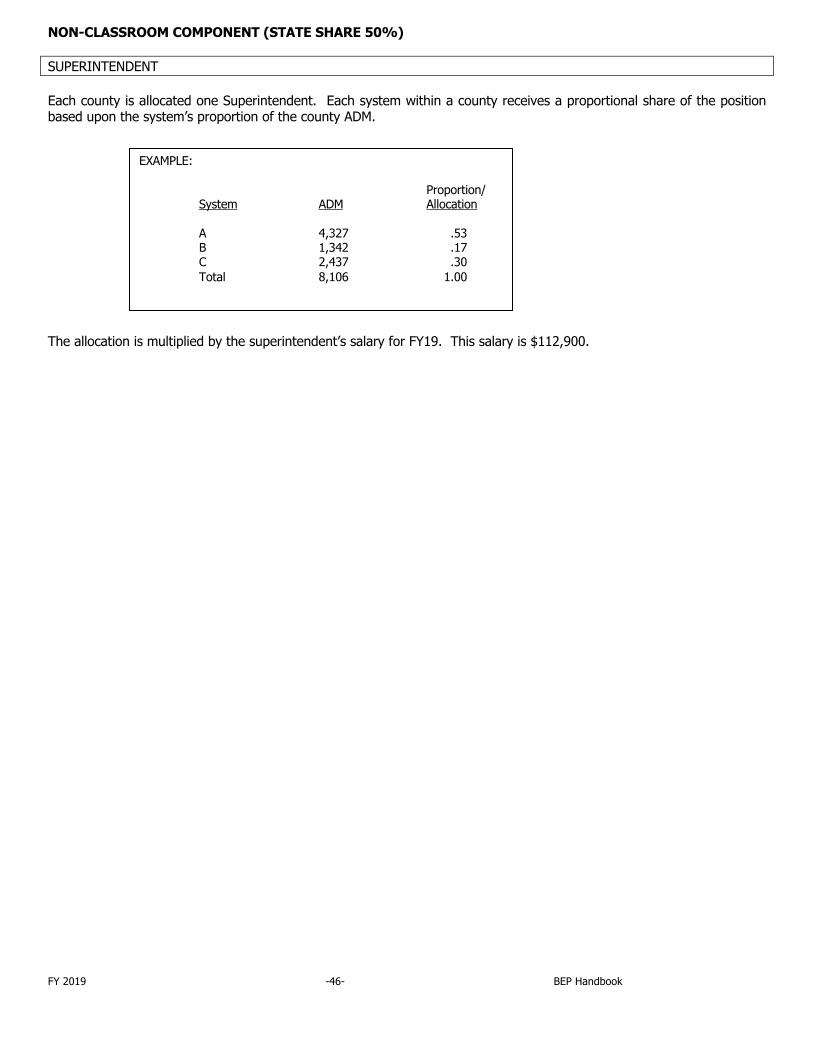
NON-CLASSROOM COMPONENT (STATE SHARE 50%) SUPERINTENDENT Each county is allocated one Superintendent. Each system within a county receives a proportional share of the position based upon the system’s proportion of the county ADM. The allocation is multiplied by the superintendent’s salary for FY19. This salary is $112,900.
EXAMPLE: Proportion/ System ADM Allocation A 4,327 .53 B 1,342 .17 C 2,437 .30 Total 8,106 1.00
FY 2019 -47- BEP Handbook
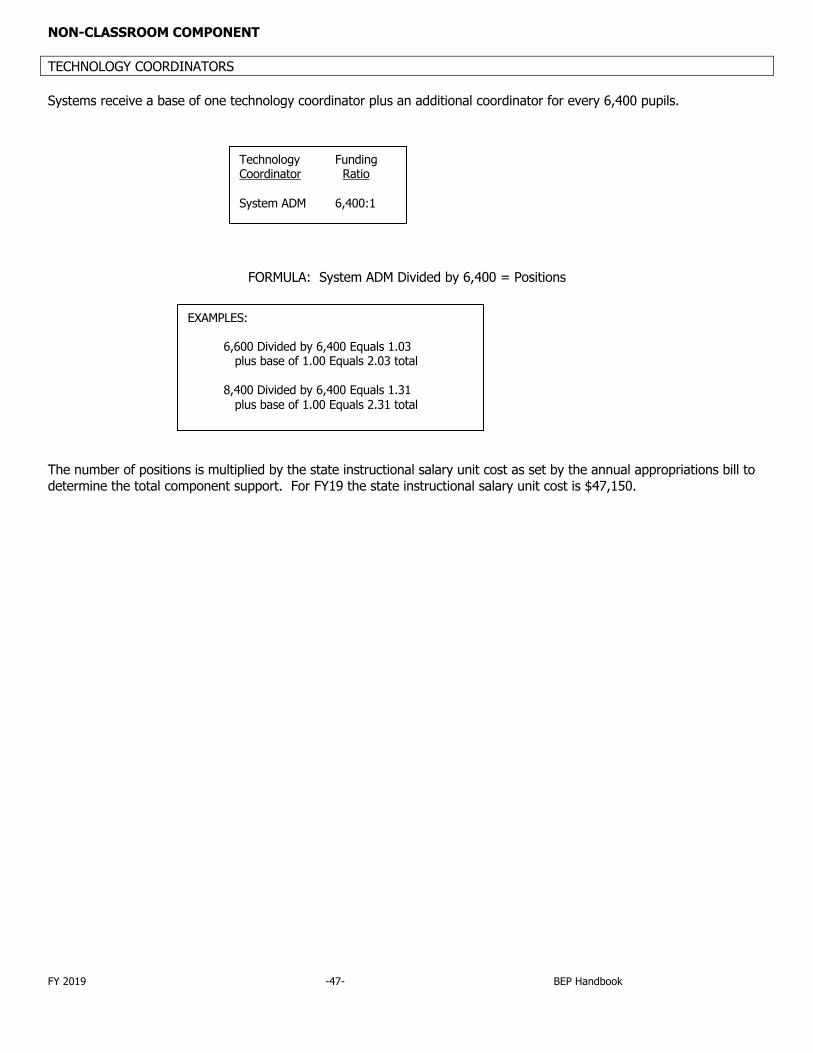
NON-CLASSROOM COMPONENT TECHNOLOGY COORDINATORS Systems receive a base of one technology coordinator plus an additional coordinator for every 6,400 pupils.
FORMULA: System ADM Divided by 6,400 = Positions The number of positions is multiplied by the state instructional salary unit cost as set by the annual appropriations bill to determine the total component support. For FY19 the state instructional salary unit cost is $47,150.
Technology Funding Coordinator Ratio System ADM 6,400:1
EXAMPLES: 6,600 Divided by 6,400 Equals 1.03 plus base of 1.00 Equals 2.03 total 8,400 Divided by 6,400 Equals 1.31 plus base of 1.00 Equals 2.31 total
FY 2019 -48- BEP Handbook
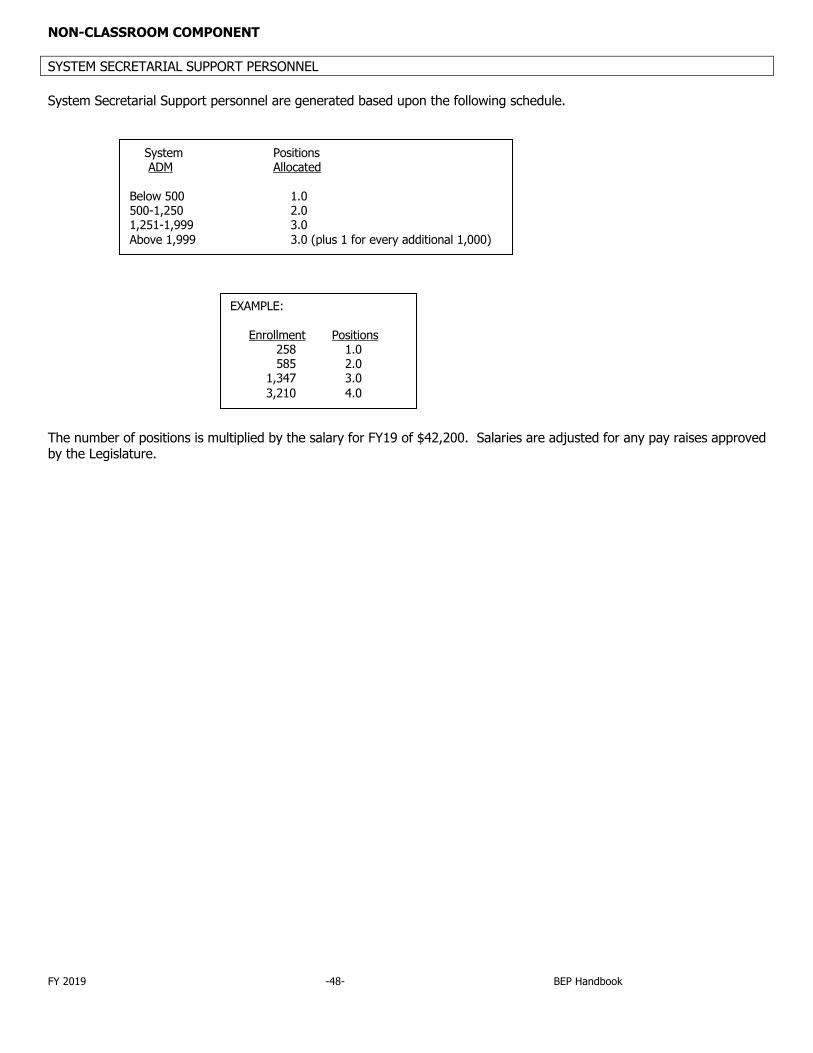
NON-CLASSROOM COMPONENT SYSTEM SECRETARIAL SUPPORT PERSONNEL System Secretarial Support personnel are generated based upon the following schedule. The number of positions is multiplied by the salary for FY19 of $42,200. Salaries are adjusted for any pay raises approved by the Legislature.
System Positions ADM Allocated Below 500 1.0 500-1,250 2.0 1,251-1,999 3.0 Above 1,999 3.0 (plus 1 for every additional 1,000)
EXAMPLE: Enrollment Positions 258 1.0 585 2.0 1,347 3.0 3,210 4.0
FY 2019 -49- BEP Handbook
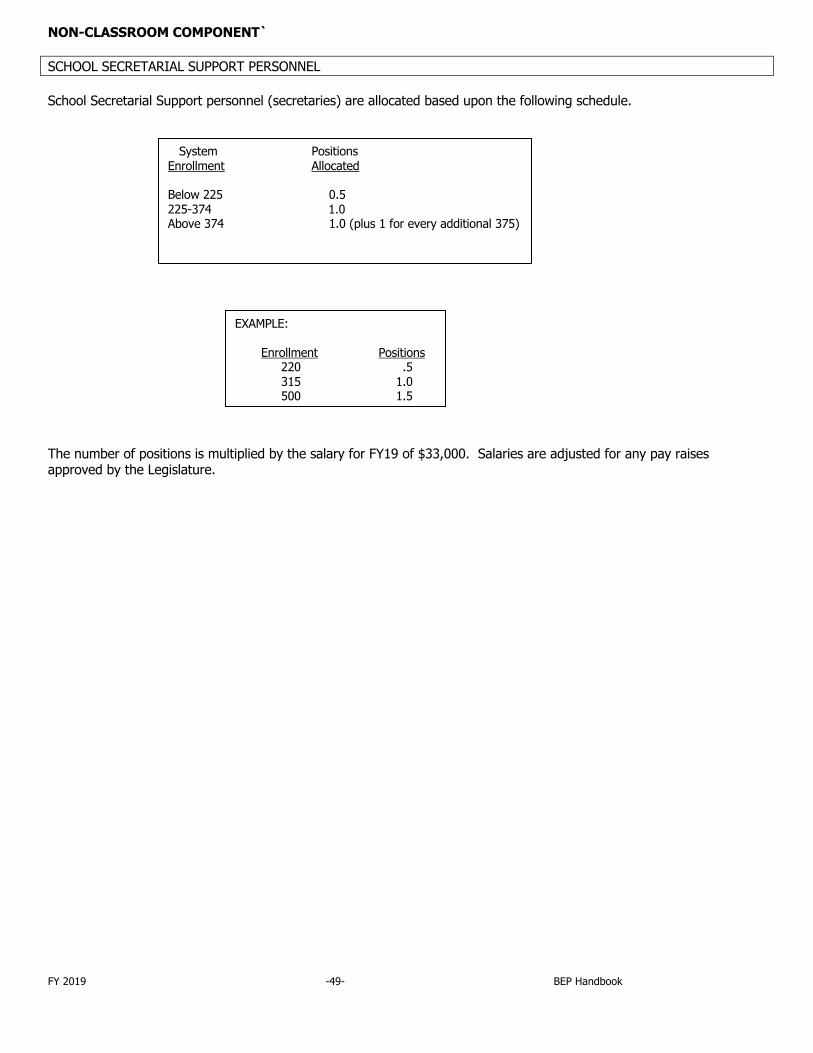
NON-CLASSROOM COMPONENT` SCHOOL SECRETARIAL SUPPORT PERSONNEL School Secretarial Support personnel (secretaries) are allocated based upon the following schedule. The number of positions is multiplied by the salary for FY19 of $33,000. Salaries are adjusted for any pay raises approved by the Legislature.
System Positions Enrollment Allocated Below 225 0.5 225-374 1.0 Above 374 1.0 (plus 1 for every additional 375)
EXAMPLE: Enrollment Positions 220 .5 315 1.0 500 1.5
FY 2019 -50- BEP Handbook
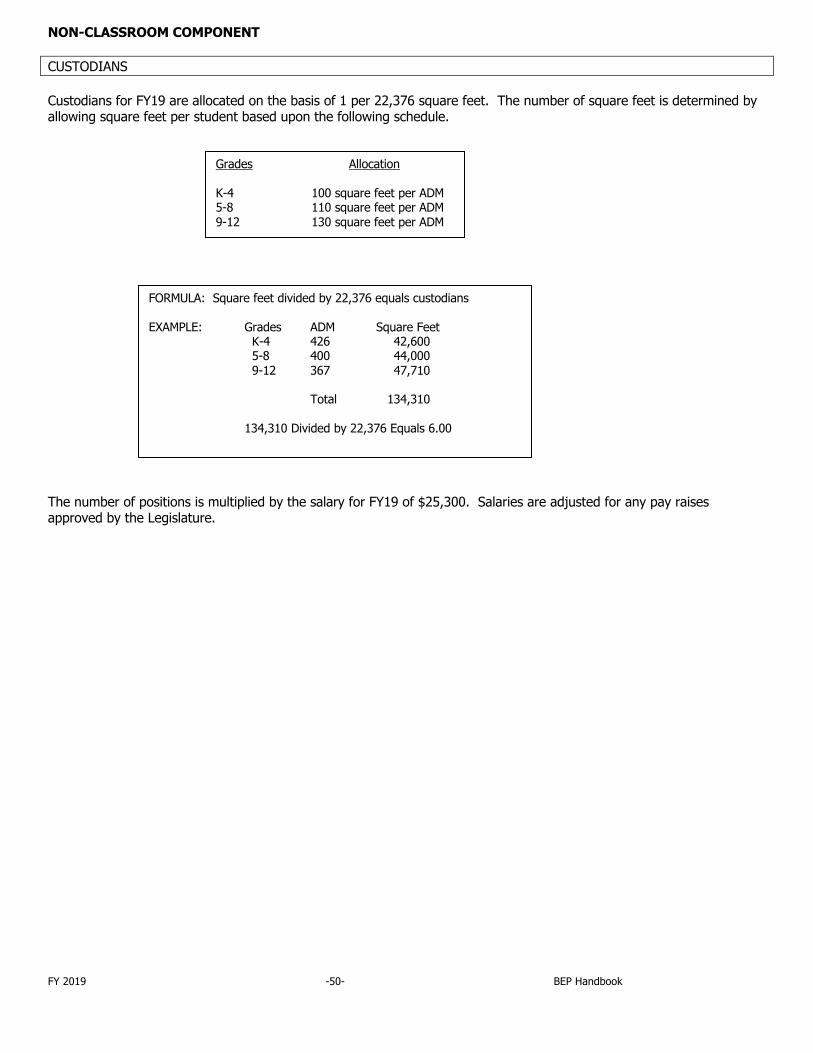
NON-CLASSROOM COMPONENT CUSTODIANS Custodians for FY19 are allocated on the basis of 1 per 22,376 square feet. The number of square feet is determined by allowing square feet per student based upon the following schedule. The number of positions is multiplied by the salary for FY19 of $25,300. Salaries are adjusted for any pay raises approved by the Legislature.
Grades Allocation K-4 100 square feet per ADM 5-8 110 square feet per ADM 9-12 130 square feet per ADM
FORMULA: Square feet divided by 22,376 equals custodians EXAMPLE: Grades ADM Square Feet K-4 426 42,600 5-8 400 44,000 9-12 367 47,710 Total 134,310 134,310 Divided by 22,376 Equals 6.00
FY 2019 -51- BEP Handbook
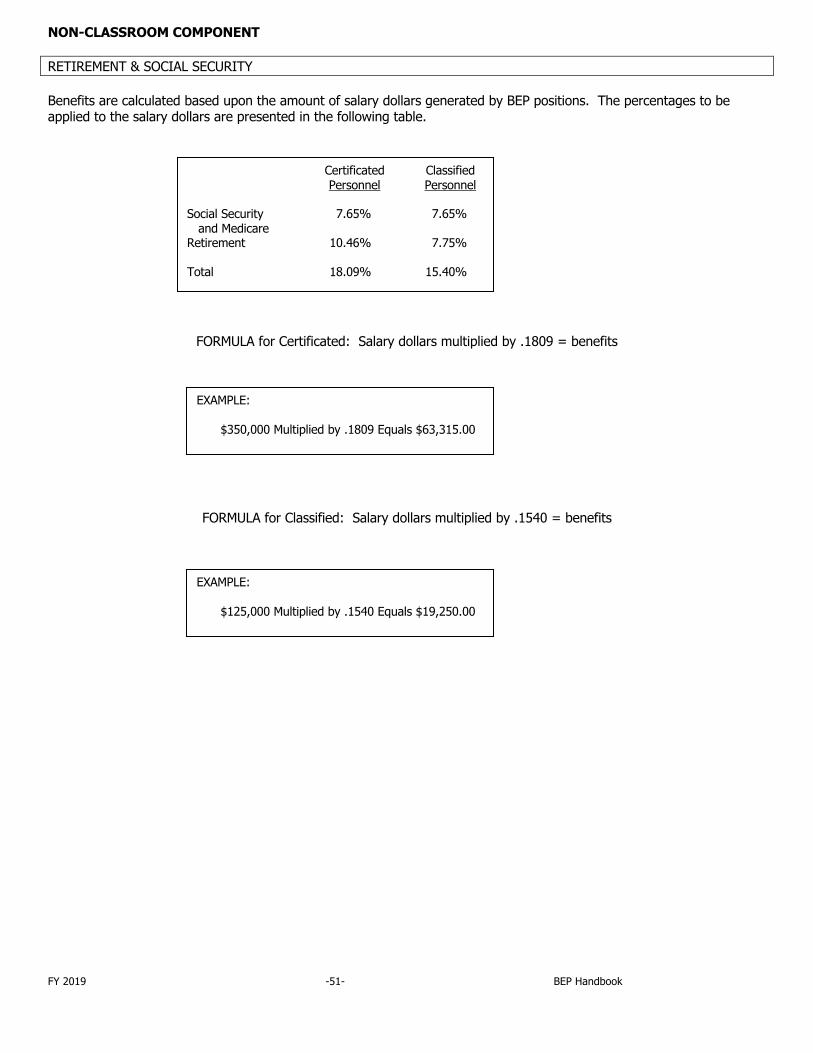
NON-CLASSROOM COMPONENT RETIREMENT & SOCIAL SECURITY Benefits are calculated based upon the amount of salary dollars generated by BEP positions. The percentages to be applied to the salary dollars are presented in the following table.
FORMULA for Certificated: Salary dollars multiplied by .1809 = benefits
FORMULA for Classified: Salary dollars multiplied by .1540 = benefits
Certificated Classified Personnel Personnel Social Security 7.65% 7.65% and Medicare Retirement 10.46% 7.75% Total 18.09% 15.40%
EXAMPLE: $350,000 Multiplied by .1809 Equals $63,315.00
EXAMPLE: $125,000 Multiplied by .1540 Equals $19,250.00
FY 2019 -52- BEP Handbook
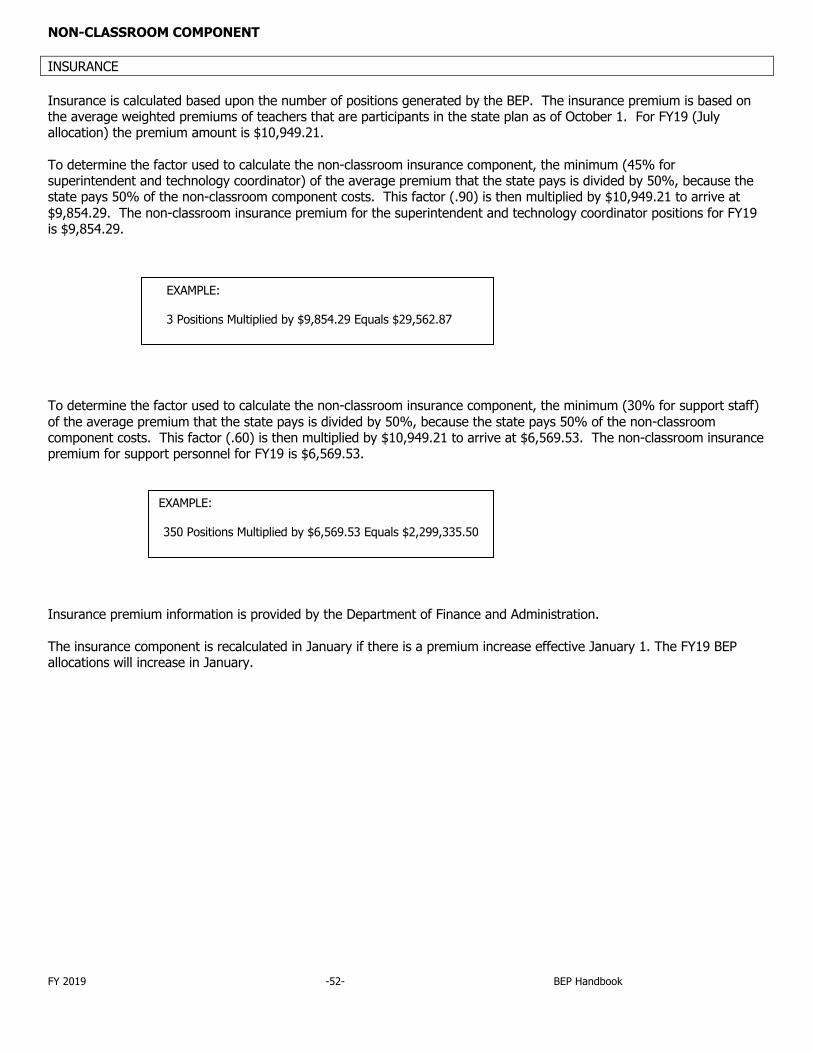
NON-CLASSROOM COMPONENT INSURANCE Insurance is calculated based upon the number of positions generated by the BEP. The insurance premium is based on the average weighted premiums of teachers that are participants in the state plan as of October 1. For FY19 (July allocation) the premium amount is $10,949.21. To determine the factor used to calculate the non-classroom insurance component, the minimum (45% for superintendent and technology coordinator) of the average premium that the state pays is divided by 50%, because the state pays 50% of the non-classroom component costs. This factor (.90) is then multiplied by $10,949.21 to arrive at $9,854.29. The non-classroom insurance premium for the superintendent and technology coordinator positions for FY19 is $9,854.29. To determine the factor used to calculate the non-classroom insurance component, the minimum (30% for support staff) of the average premium that the state pays is divided by 50%, because the state pays 50% of the non-classroom component costs. This factor (.60) is then multiplied by $10,949.21 to arrive at $6,569.53. The non-classroom insurance premium for support personnel for FY19 is $6,569.53.
Insurance premium information is provided by the Department of Finance and Administration. The insurance component is recalculated in January if there is a premium increase effective January 1. The FY19 BEP allocations will increase in January.
EXAMPLE: 350 Positions Multiplied by $6,569.53 Equals $2,299,335.50
EXAMPLE: 3 Positions Multiplied by $9,854.29 Equals $29,562.87
FY 2019 -53- BEP Handbook
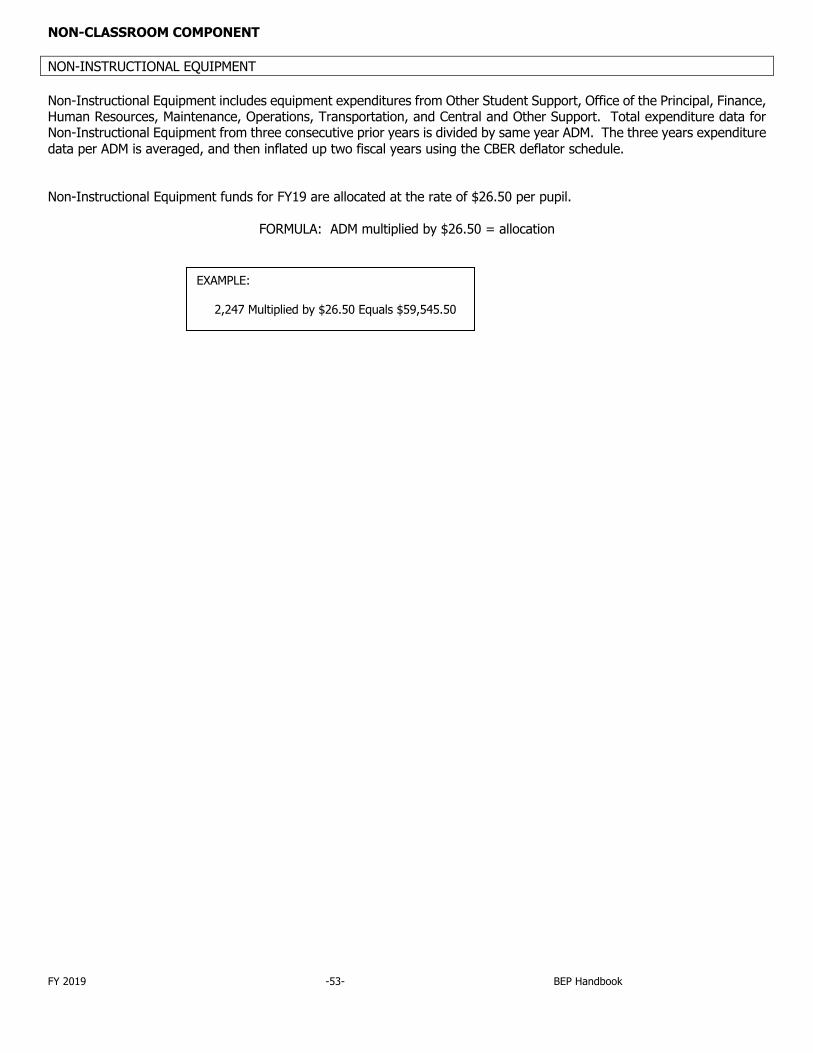
NON-CLASSROOM COMPONENT NON-INSTRUCTIONAL EQUIPMENT Non-Instructional Equipment includes equipment expenditures from Other Student Support, Office of the Principal, Finance, Human Resources, Maintenance, Operations, Transportation, and Central and Other Support. Total expenditure data for Non-Instructional Equipment from three consecutive prior years is divided by same year ADM. The three years expenditure data per ADM is averaged, and then inflated up two fiscal years using the CBER deflator schedule. Non-Instructional Equipment funds for FY19 are allocated at the rate of $26.50 per pupil.
FORMULA: ADM multiplied by $26.50 = allocation
EXAMPLE: 2,247 Multiplied by $26.50 Equals $59,545.50
FY 2019 -54- BEP Handbook
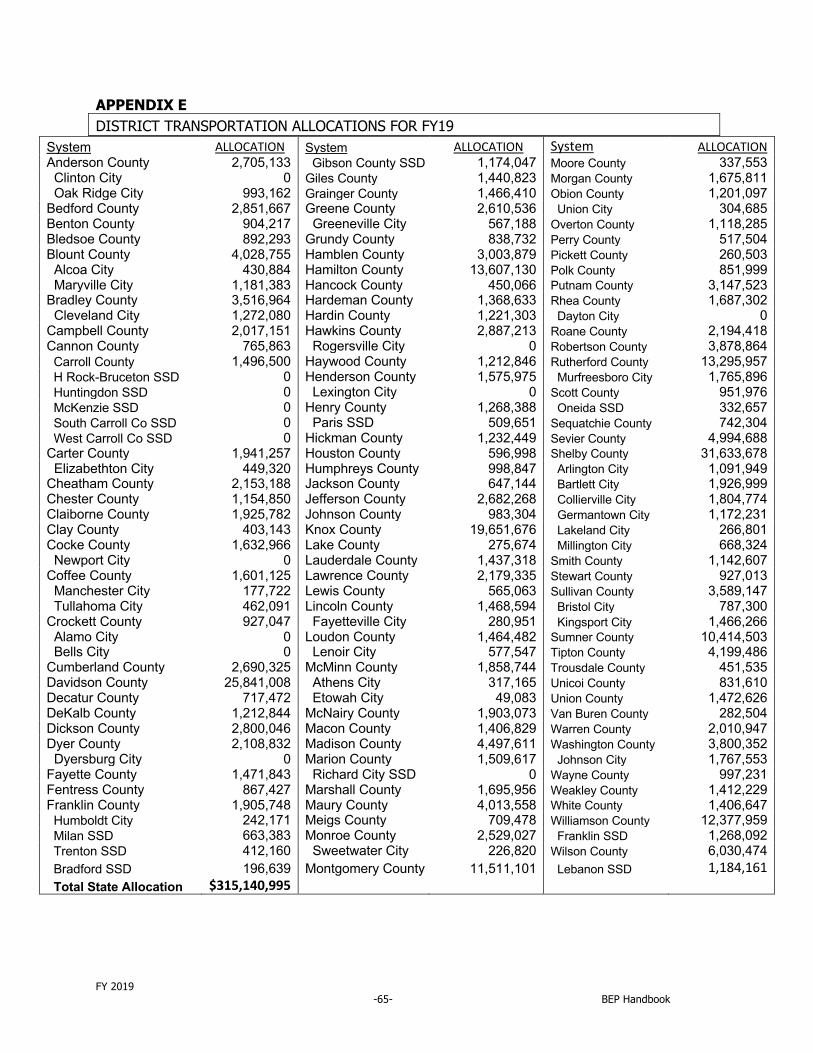
NON-CLASSROOM COMPONENT PUPIL TRANSPORTATION The BEP funds transportation based on the estimated cost of the transportation services the school system provides. The transportation funding is based upon a formula, which takes into consideration the number of pupils transported and the number of miles the students are transported. In order to determine transportation funding, information from the Annual Transportation Report and Annual Financial Report is required. Three-year averages of data, which determine the funding for each system, are: • Three-year average transportation cost per ADM. • Ratio of three-year average daily transported to ADM. • Ratio of three-year average mile traveled to ADM. • Percent of ADT to total ADM. These three-year averages are then inflated up two fiscal years. After calculating the three-year averages of actual transportation expenditures and inflating them up two fiscal years, the BEP formula then uses a statistical model (multiple regression) to estimate the impact of four different factors on each system’s transportation spending over the three years prior to the current BEP funding year. Those four factors, based on three-year averages are: • Average daily students transported (ADT) • Average daily special education students transported (SpEdADT) • Daily one-way miles driven (miles) • ADM
The model estimates the average, statewide effects (coefficients) of these factors on transportation expenditures and multiplies those estimated effects by each system’s respective factors to calculate the estimated cost to the system of providing transportation services. Transportation cost allocations for each school system for FY19 are found in Appendix E.
FY 2019 -55- BEP Handbook
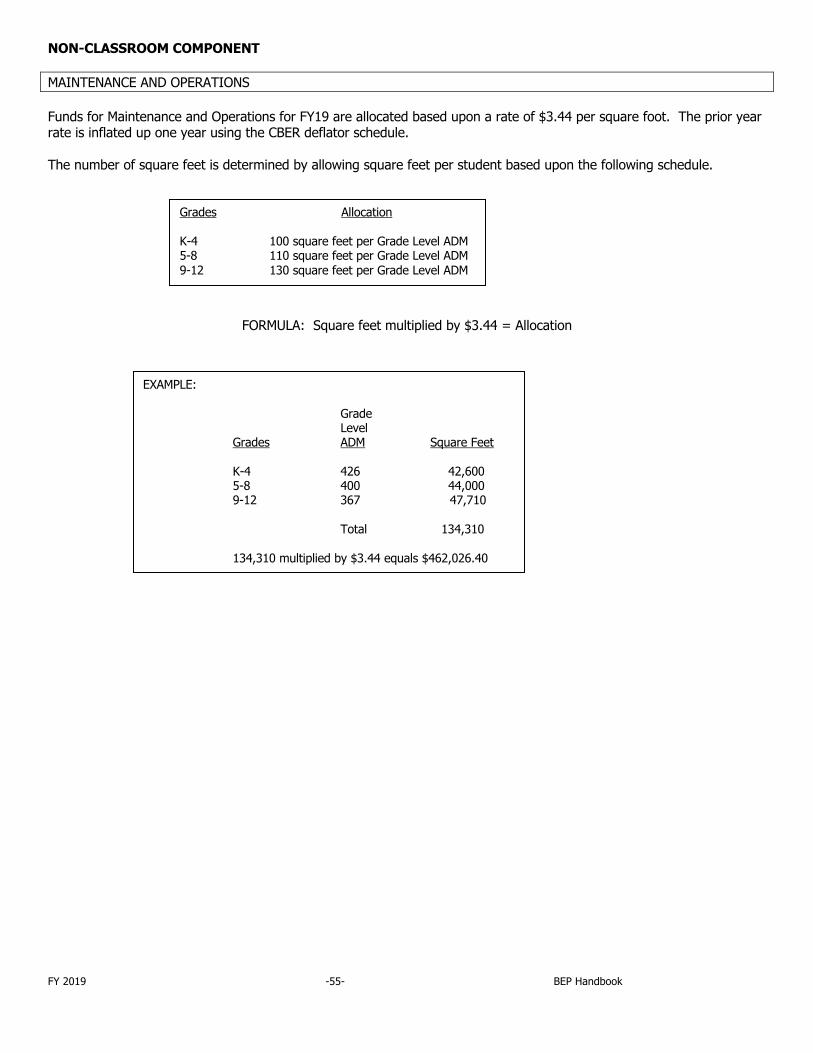
NON-CLASSROOM COMPONENT MAINTENANCE AND OPERATIONS Funds for Maintenance and Operations for FY19 are allocated based upon a rate of $3.44 per square foot. The prior year rate is inflated up one year using the CBER deflator schedule. The number of square feet is determined by allowing square feet per student based upon the following schedule.
FORMULA: Square feet multiplied by $3.44 = Allocation
Grades Allocation K-4 100 square feet per Grade Level ADM 5-8 110 square feet per Grade Level ADM 9-12 130 square feet per Grade Level ADM
EXAMPLE: Grade Level Grades ADM Square Feet K-4 426 42,600 5-8 400 44,000 9-12 367 47,710 Total 134,310 134,310 multiplied by $3.44 equals $462,026.40
FY 2019 -56- BEP Handbook
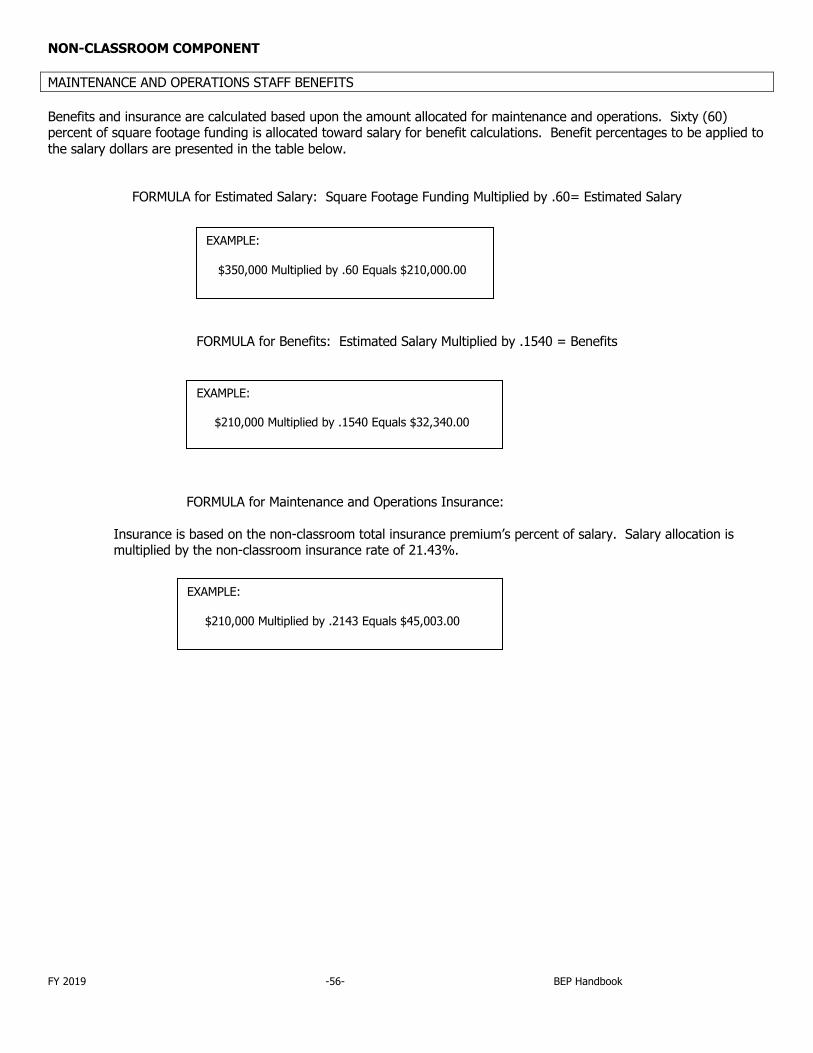
NON-CLASSROOM COMPONENT MAINTENANCE AND OPERATIONS STAFF BENEFITS Benefits and insurance are calculated based upon the amount allocated for maintenance and operations. Sixty (60) percent of square footage funding is allocated toward salary for benefit calculations. Benefit percentages to be applied to the salary dollars are presented in the table below.
FORMULA for Estimated Salary: Square Footage Funding Multiplied by .60= Estimated Salary
FORMULA for Benefits: Estimated Salary Multiplied by .1540 = Benefits
FORMULA for Maintenance and Operations Insurance:
Insurance is based on the non-classroom total insurance premium’s percent of salary. Salary allocation is multiplied by the non-classroom insurance rate of 21.43%.
EXAMPLE: $350,000 Multiplied by .60 Equals $210,000.00
EXAMPLE: $210,000 Multiplied by .1540 Equals $32,340.00
EXAMPLE: $210,000 Multiplied by .2143 Equals $45,003.00
FY 2019 -57- BEP Handbook
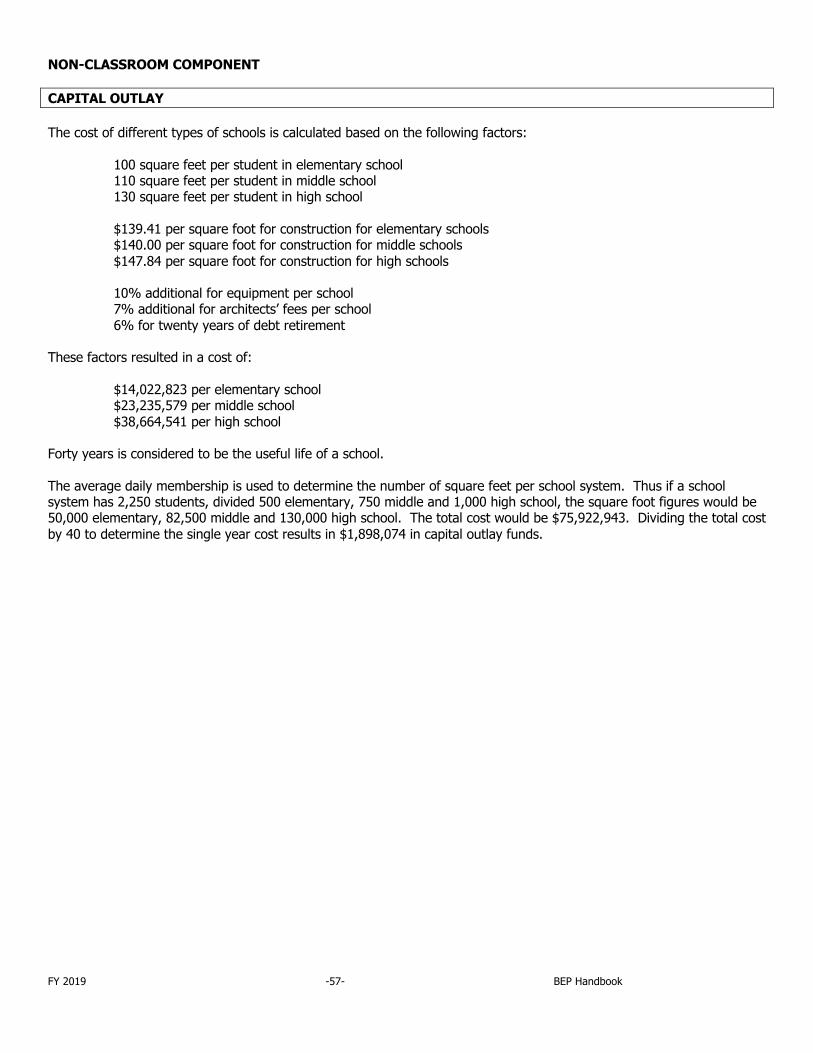
NON-CLASSROOM COMPONENT CAPITAL OUTLAY The cost of different types of schools is calculated based on the following factors: 100 square feet per student in elementary school 110 square feet per student in middle school 130 square feet per student in high school $139.41 per square foot for construction for elementary schools $140.00 per square foot for construction for middle schools $147.84 per square foot for construction for high schools 10% additional for equipment per school 7% additional for architects’ fees per school 6% for twenty years of debt retirement These factors resulted in a cost of: $14,022,823 per elementary school $23,235,579 per middle school $38,664,541 per high school Forty years is considered to be the useful life of a school. The average daily membership is used to determine the number of square feet per school system. Thus if a school system has 2,250 students, divided 500 elementary, 750 middle and 1,000 high school, the square foot figures would be 50,000 elementary, 82,500 middle and 130,000 high school. The total cost would be $75,922,943. Dividing the total cost by 40 to determine the single year cost results in $1,898,074 in capital outlay funds.
FY 2019 -58- BEP Handbook
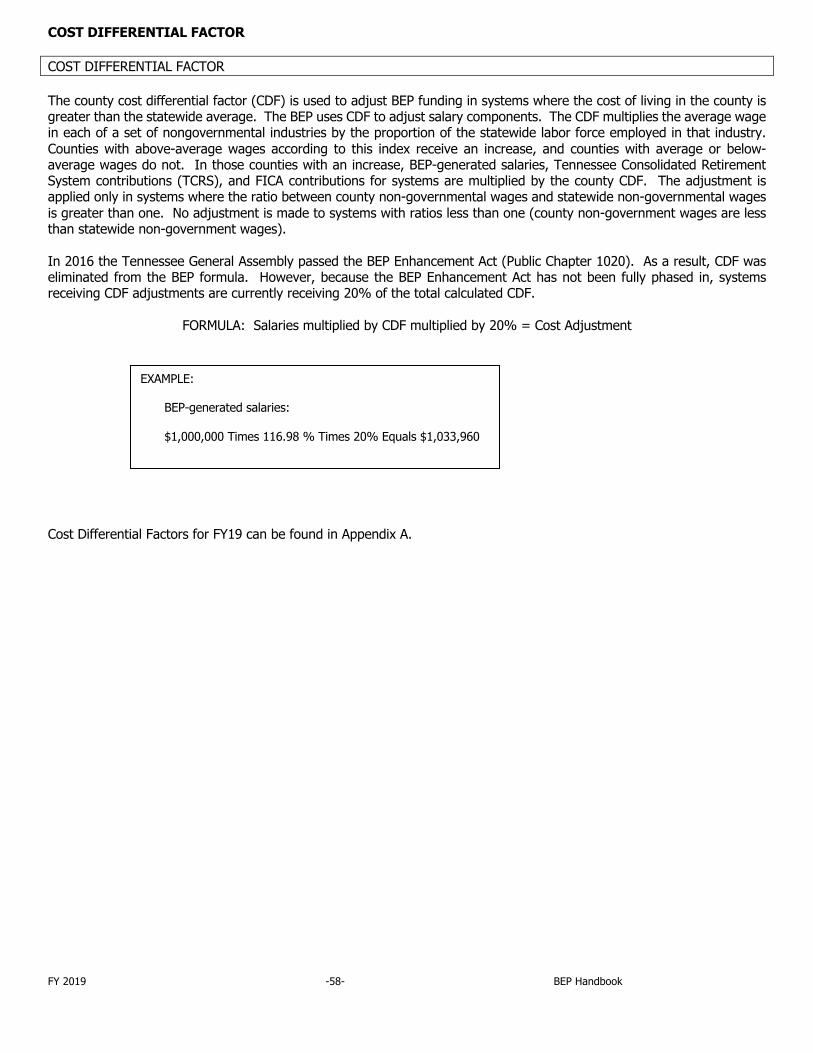
COST DIFFERENTIAL FACTOR COST DIFFERENTIAL FACTOR The county cost differential factor (CDF) is used to adjust BEP funding in systems where the cost of living in the county is greater than the statewide average. The BEP uses CDF to adjust salary components. The CDF multiplies the average wage in each of a set of nongovernmental industries by the proportion of the statewide labor force employed in that industry. Counties with above-average wages according to this index receive an increase, and counties with average or below-average wages do not. In those counties with an increase, BEP-generated salaries, Tennessee Consolidated Retirement System contributions (TCRS), and FICA contributions for systems are multiplied by the county CDF. The adjustment is applied only in systems where the ratio between county non-governmental wages and statewide non-governmental wages is greater than one. No adjustment is made to systems with ratios less than one (county non-government wages are less than statewide non-government wages). In 2016 the Tennessee General Assembly passed the BEP Enhancement Act (Public Chapter 1020). As a result, CDF was eliminated from the BEP formula. However, because the BEP Enhancement Act has not been fully phased in, systems receiving CDF adjustments are currently receiving 20% of the total calculated CDF.
FORMULA: Salaries multiplied by CDF multiplied by 20% = Cost Adjustment Cost Differential Factors for FY19 can be found in Appendix A.
EXAMPLE: BEP-generated salaries: $1,000,000 Times 116.98 % Times 20% Equals $1,033,960

FY 2019 -59- BEP Handbook
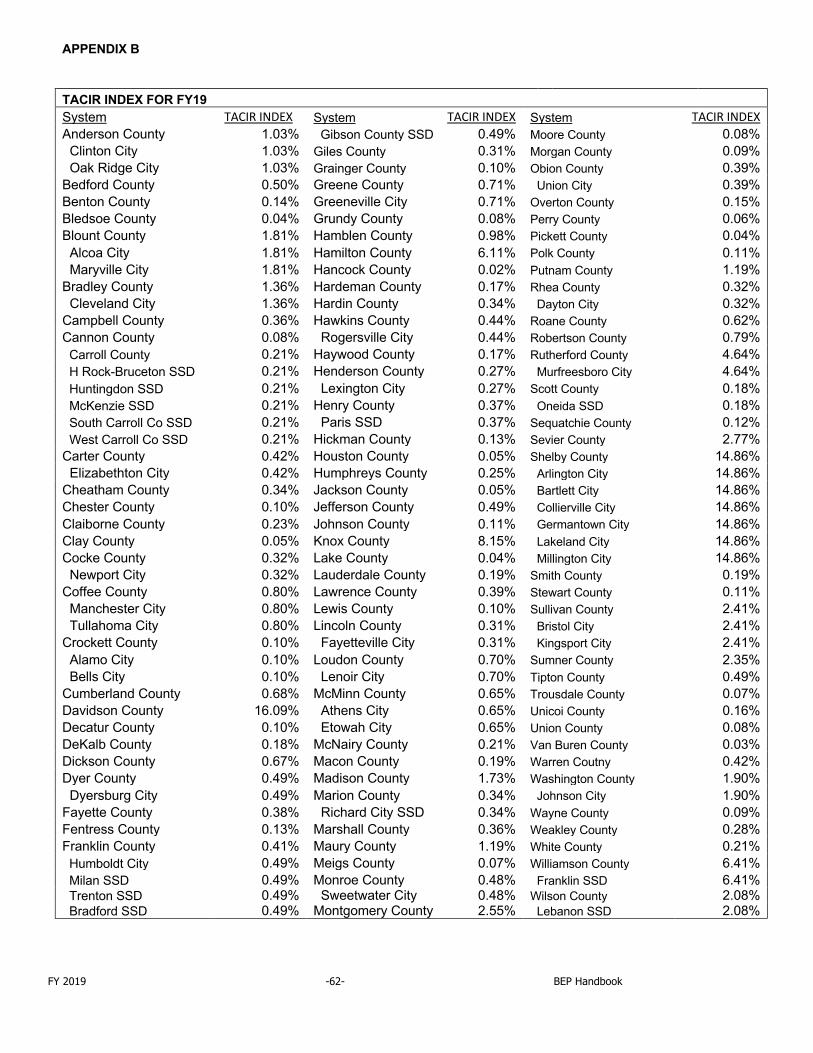
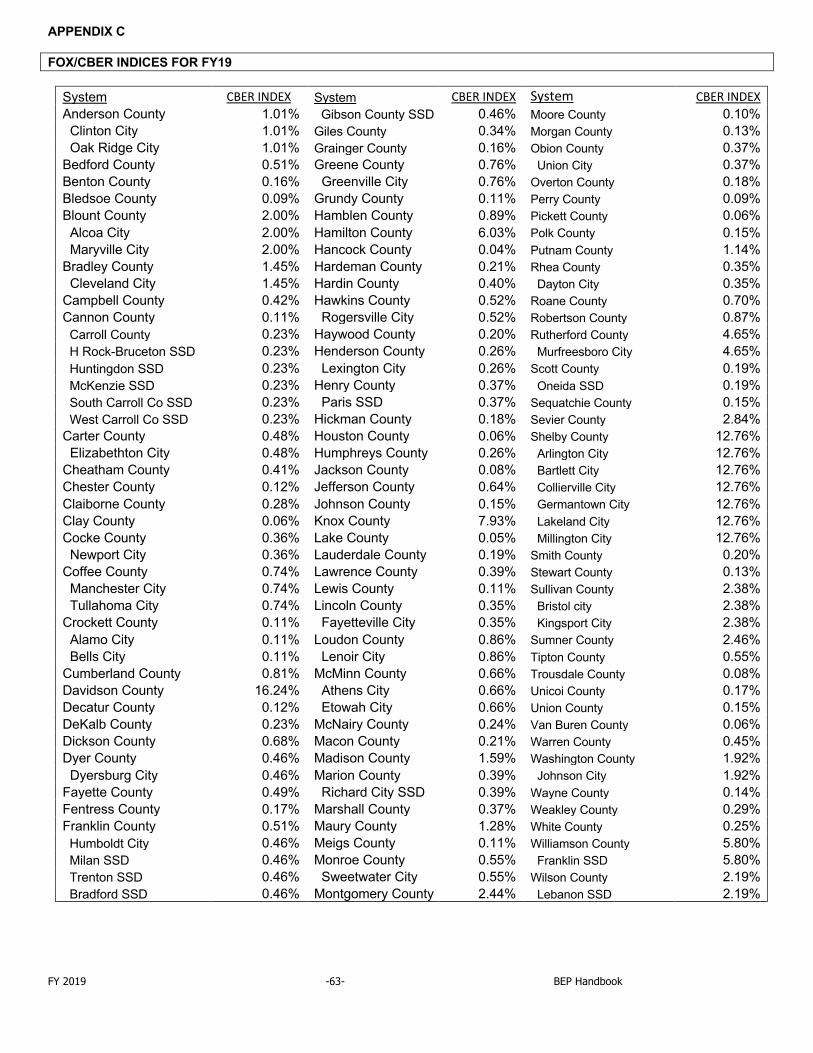
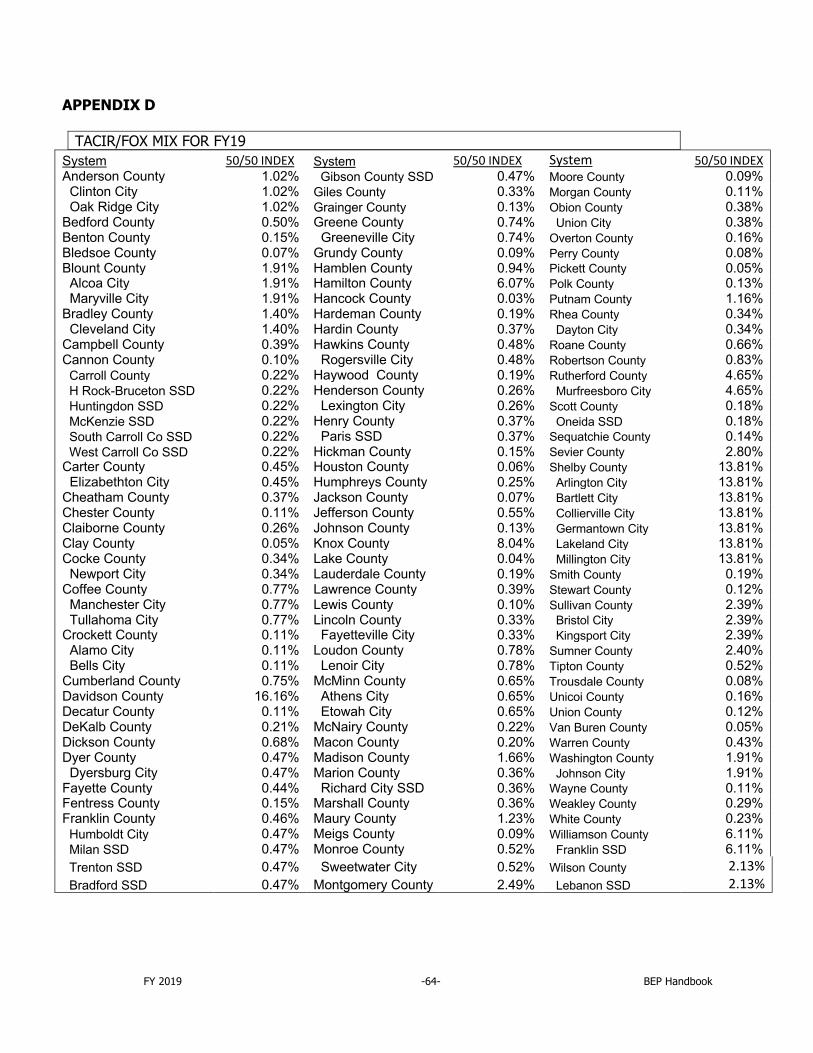
FISCAL CAPACITY TACIR INDEX / FOX INDEX The fiscal capacity index is the primary equalization instrument in the BEP formula. It is a statistical estimate of a county’s relative ability to raise revenue for education. The state and local share for each school system is based on an equalization formula that is applied to the BEP. Fiscal capacity and cost differential factors should not be confused. In general, the fiscal capacity index analyzes and adjusts for a county’s ability to pay for education. CDF takes into consideration cost of living differences. Although the state funds 70, 75, and 50 percent of the total BEP generated instructional, classroom and non-classroom components, respectively, the state and local shares for individual districts vary considerably. Through the fiscal capacity index, the BEP directs more state funds to systems in counties with less ability to fund education with local resources. A school system in a county with high fiscal capacity has greater ability to raise revenues through local sources, such as property tax or the local option sales tax; a school system in a county with low fiscal capacity has less ability to raise local revenues. Because of this, the BEP requires systems in counties with higher fiscal capacity to fund a greater portion with local dollars. In 2016 the Tennessee General Assembly passed the BEP Enhancement Act (Public Chapter 1020). As a result, the TACIR index and the Fox index are equally weighted in the equalization formula. The fiscal capacity index is applied at the county level. Therefore, the state and local shares for a county system would be the same as the state and local shares for a city system residing within the same county.
FORMULA: Total BEP funds generated in a category times Average local share times County fiscal capacity index = County’s local funded amount
County’s total generated BEP funds in a category minus County’s local funded amount = County’s state funded amount
TACIR Index for FY19 is found in Appendix B. Fox Index for FY19 is found in Appendix C. The blended fiscal capacity index for FY19 is found in Appendix D.
EXAMPLE: Local BEP-funded instructional component: $3,000,000,000 times 30% times .14 = $126,000,000 $275,000,000 minus $126,000,000 = $149,000,000
FY 2019 -60- BEP Handbook
FINAL COMPARISONS MINIMUM FUNDING A system is on minimum funding if the total state BEP funds it generates in the current year are less than the sum of its 2015-16 BEP appropriation, adjusted for loss in enrollment, plus increases in instructional salaries and benefits. The instructional increase amount is determined by multiplying the system’s current instructional positions by the increase in salary, insurance premiums or TCRS contributions. This amount is then multiplied by the system’s equalized state share percentage and then added to 2015-16 BEP appropriation amount to determine the system’s minimum funding. In the current year, a system receives the greater of minimum funding or the amount it generates.
FORMULA: Increase in salary (and/or TCRS and/or insurance) Multiplied by the number of BEP-instructional positions times Equalized state share percentage = Mandatory Increase
EXAMPLE: Instructional Salary and Benefits Increase: $3,090.33 Times 478 positions times .65 Equals $960,166

FY 2019 -61- BEP Handbook
APPENDIX A COST DIFFERENTIAL FACTORS FOR FY19
System CDF% System CDF% System CDF% Anderson County 104.96% Gibson County SSD 71.76% Moore County 88.89% Clinton City 104.96% Giles County 74.73% Morgan County 78.42% Oak Ridge City 104.96% Grainger County 70.50% Obion County 77.35% Bedford County 75.48% Greene County 74.58% Union City 77.35% Benton County 71.02% Greeneville City 74.58% Overton County 76.70% Bledsoe County 63.61% Grundy County 55.15% Perry County 61.43% Blount County 98.29% Hamblen County 75.95% Pickett County 65.97% Alcoa City 98.29% Hamilton County 99.01% Polk County 73.96% Maryville City 98.29% Hancock County 59.05% Putnam County 77.32% Bradley County 83.88% Hardeman County 74.13% Rhea County 68.43% Cleveland City 83.88% Hardin County 80.08% Dayton City 68.43% Campbell County 76.72% Hawkins County 77.54% Roane County 101.27% Cannon County 74.31% Rogersville City 77.54% Robertson County 76.95% Carroll County 72.01% Haywood County 74.78% Rutherford County 94.84% H Rock-Bruceton SSD 72.01% Henderson County 70.66% Murfreesboro City 94.84% Huntingdon SSD 72.01% Lexington City 70.66% Scott County 68.80% McKenzie SSD 72.01% Henry County 75.60% Oneida SSD 68.80% South Carroll Co SSD 72.01% Paris SSD 75.60% Sequatchie County 67.51% West Carroll Co SSD 72.01% Hickman County 78.52% Sevier County 79.57% Carter County 76.11% Houston County 68.32% Shelby County 116.13% Elizabethton City 76.11% Humphreys County 92.08% Arlington City 116.13% Cheatham County 88.04% Jackson County 66.89% Bartlett City 116.13% Chester County 71.10% Jefferson County 81.85% Collierville City 116.13% Claiborne County 75.69% Johnson County 90.35% Germantown City 116.13% Clay County 65.86% Knox County 100.71% Lakeland City 116.13% Cocke County 74.65% Lake County 65.37% Millington City 116.13% Newport City 74.65% Lauderdale County 71.27% Smith County 79.07% Coffee County 92.18% Lawrence County 72.17% Stewart County 75.43% Manchester City 92.18% Lewis County 64.15% Sullivan County 97.32% Tullahoma City 92.18% Lincoln County 72.21% Bristol City 97.32% Crockett County 72.90% Fayetteville City 72.21% Kingsport City 97.32% Alamo City 72.90% Loudon County 94.05% Sumner County 90.36% Bells City 72.90% Lenoir City 94.05% Tipton County 76.66% Cumberland County 74.70% McMinn County 77.99% Trousdale County 66.00% Davidson County 120.02% Athens City 77.99% Unicoi County 90.61% Decatur County 72.96% Etowah City 77.99% Union County 69.07% DeKalb County 75.35% McNairy County 66.44% Van Buren County 71.53% Dickson County 78.03% Macon County 68.92% Warren County 72.29% Dyer County 76.09% Madison County 84.32% Washington County 83.47% Dyersburg City 76.09% Marion County 79.68% Johnson City 83.47% Fayette County 89.69% Richard City SSD 79.68% Wayne County 68.45% Fentress County 70.57% Marshall County 72.05% Weakley County 66.81% Franklin County 76.91% Maury County 92.64% White County 71.00% Humboldt City 71.76% Meigs County 77.80% Williamson County 128.52% Milan SSD 71.76% Monroe County 83.00% Franklin SSD 128.52% Trenton SSD 71.76% Sweetwater City 83.00% Wilson County 95.38% Bradford SSD 71.76% Montgomery County 81.89% Lebanon SSD 95.38%
FY 2019 -62- BEP Handbook
APPENDIX B TACIR INDEX FOR FY19 TACIR INDEX System TACIR INDEX System TACIR INDEX System TACIR INDEX Anderson County 1.03% Gibson County SSD 0.49% Moore County 0.08% Clinton City 1.03% Giles County 0.31% Morgan County 0.09% Oak Ridge City 1.03% Grainger County 0.10% Obion County 0.39% Bedford County 0.50% Greene County 0.71% Union City 0.39% Benton County 0.14% Greeneville City 0.71% Overton County 0.15% Bledsoe County 0.04% Grundy County 0.08% Perry County 0.06% Blount County 1.81% Hamblen County 0.98% Pickett County 0.04% Alcoa City 1.81% Hamilton County 6.11% Polk County 0.11% Maryville City 1.81% Hancock County 0.02% Putnam County 1.19% Bradley County 1.36% Hardeman County 0.17% Rhea County 0.32% Cleveland City 1.36% Hardin County 0.34% Dayton City 0.32% Campbell County 0.36% Hawkins County 0.44% Roane County 0.62% Cannon County 0.08% Rogersville City 0.44% Robertson County 0.79% Carroll County 0.21% Haywood County 0.17% Rutherford County 4.64% H Rock-Bruceton SSD 0.21% Henderson County 0.27% Murfreesboro City 4.64% Huntingdon SSD 0.21% Lexington City 0.27% Scott County 0.18% McKenzie SSD 0.21% Henry County 0.37% Oneida SSD 0.18% South Carroll Co SSD 0.21% Paris SSD 0.37% Sequatchie County 0.12% West Carroll Co SSD 0.21% Hickman County 0.13% Sevier County 2.77% Carter County 0.42% Houston County 0.05% Shelby County 14.86% Elizabethton City 0.42% Humphreys County 0.25% Arlington City 14.86% Cheatham County 0.34% Jackson County 0.05% Bartlett City 14.86% Chester County 0.10% Jefferson County 0.49% Collierville City 14.86% Claiborne County 0.23% Johnson County 0.11% Germantown City 14.86% Clay County 0.05% Knox County 8.15% Lakeland City 14.86% Cocke County 0.32% Lake County 0.04% Millington City 14.86% Newport City 0.32% Lauderdale County 0.19% Smith County 0.19% Coffee County 0.80% Lawrence County 0.39% Stewart County 0.11% Manchester City 0.80% Lewis County 0.10% Sullivan County 2.41% Tullahoma City 0.80% Lincoln County 0.31% Bristol City 2.41% Crockett County 0.10% Fayetteville City 0.31% Kingsport City 2.41% Alamo City 0.10% Loudon County 0.70% Sumner County 2.35% Bells City 0.10% Lenoir City 0.70% Tipton County 0.49% Cumberland County 0.68% McMinn County 0.65% Trousdale County 0.07% Davidson County 16.09% Athens City 0.65% Unicoi County 0.16% Decatur County 0.10% Etowah City 0.65% Union County 0.08% DeKalb County 0.18% McNairy County 0.21% Van Buren County 0.03% Dickson County 0.67% Macon County 0.19% Warren Coutny 0.42% Dyer County 0.49% Madison County 1.73% Washington County 1.90% Dyersburg City 0.49% Marion County 0.34% Johnson City 1.90% Fayette County 0.38% Richard City SSD 0.34% Wayne County 0.09% Fentress County 0.13% Marshall County 0.36% Weakley County 0.28% Franklin County 0.41% Maury County 1.19% White County 0.21% Humboldt City 0.49% Meigs County 0.07% Williamson County 6.41% Milan SSD 0.49% Monroe County 0.48% Franklin SSD 6.41% Trenton SSD 0.49% Sweetwater City 0.48% Wilson County 2.08% Bradford SSD 0.49% Montgomery County 2.55% Lebanon SSD 2.08%
FY 2019 -63- BEP Handbook
APPENDIX C FOX/CBER INDICES FOR FY19
System CBER INDEX System CBER INDEX System CBER INDEX Anderson County 1.01% Gibson County SSD 0.46% Moore County 0.10% Clinton City 1.01% Giles County 0.34% Morgan County 0.13% Oak Ridge City 1.01% Grainger County 0.16% Obion County 0.37% Bedford County 0.51% Greene County 0.76% Union City 0.37% Benton County 0.16% Greenville City 0.76% Overton County 0.18% Bledsoe County 0.09% Grundy County 0.11% Perry County 0.09% Blount County 2.00% Hamblen County 0.89% Pickett County 0.06% Alcoa City 2.00% Hamilton County 6.03% Polk County 0.15% Maryville City 2.00% Hancock County 0.04% Putnam County 1.14% Bradley County 1.45% Hardeman County 0.21% Rhea County 0.35% Cleveland City 1.45% Hardin County 0.40% Dayton City 0.35% Campbell County 0.42% Hawkins County 0.52% Roane County 0.70% Cannon County 0.11% Rogersville City 0.52% Robertson County 0.87% Carroll County 0.23% Haywood County 0.20% Rutherford County 4.65% H Rock-Bruceton SSD 0.23% Henderson County 0.26% Murfreesboro City 4.65% Huntingdon SSD 0.23% Lexington City 0.26% Scott County 0.19% McKenzie SSD 0.23% Henry County 0.37% Oneida SSD 0.19% South Carroll Co SSD 0.23% Paris SSD 0.37% Sequatchie County 0.15% West Carroll Co SSD 0.23% Hickman County 0.18% Sevier County 2.84% Carter County 0.48% Houston County 0.06% Shelby County 12.76% Elizabethton City 0.48% Humphreys County 0.26% Arlington City 12.76% Cheatham County 0.41% Jackson County 0.08% Bartlett City 12.76% Chester County 0.12% Jefferson County 0.64% Collierville City 12.76% Claiborne County 0.28% Johnson County 0.15% Germantown City 12.76% Clay County 0.06% Knox County 7.93% Lakeland City 12.76% Cocke County 0.36% Lake County 0.05% Millington City 12.76% Newport City 0.36% Lauderdale County 0.19% Smith County 0.20% Coffee County 0.74% Lawrence County 0.39% Stewart County 0.13% Manchester City 0.74% Lewis County 0.11% Sullivan County 2.38% Tullahoma City 0.74% Lincoln County 0.35% Bristol city 2.38% Crockett County 0.11% Fayetteville City 0.35% Kingsport City 2.38% Alamo City 0.11% Loudon County 0.86% Sumner County 2.46% Bells City 0.11% Lenoir City 0.86% Tipton County 0.55% Cumberland County 0.81% McMinn County 0.66% Trousdale County 0.08% Davidson County 16.24% Athens City 0.66% Unicoi County 0.17% Decatur County 0.12% Etowah City 0.66% Union County 0.15% DeKalb County 0.23% McNairy County 0.24% Van Buren County 0.06% Dickson County 0.68% Macon County 0.21% Warren County 0.45% Dyer County 0.46% Madison County 1.59% Washington County 1.92% Dyersburg City 0.46% Marion County 0.39% Johnson City 1.92% Fayette County 0.49% Richard City SSD 0.39% Wayne County 0.14% Fentress County 0.17% Marshall County 0.37% Weakley County 0.29% Franklin County 0.51% Maury County 1.28% White County 0.25% Humboldt City 0.46% Meigs County 0.11% Williamson County 5.80% Milan SSD 0.46% Monroe County 0.55% Franklin SSD 5.80% Trenton SSD 0.46% Sweetwater City 0.55% Wilson County 2.19% Bradford SSD 0.46% Montgomery County 2.44% Lebanon SSD 2.19%
FY 2019 -64- BEP Handbook
APPENDIX D
TACIR/FOX MIX FOR FY19
System 50/50 INDEX System 50/50 INDEX System 50/50 INDEX Anderson County 1.02% Gibson County SSD 0.47% Moore County 0.09% Clinton City 1.02% Giles County 0.33% Morgan County 0.11% Oak Ridge City 1.02% Grainger County 0.13% Obion County 0.38% Bedford County 0.50% Greene County 0.74% Union City 0.38% Benton County 0.15% Greeneville City 0.74% Overton County 0.16% Bledsoe County 0.07% Grundy County 0.09% Perry County 0.08% Blount County 1.91% Hamblen County 0.94% Pickett County 0.05% Alcoa City 1.91% Hamilton County 6.07% Polk County 0.13% Maryville City 1.91% Hancock County 0.03% Putnam County 1.16% Bradley County 1.40% Hardeman County 0.19% Rhea County 0.34% Cleveland City 1.40% Hardin County 0.37% Dayton City 0.34% Campbell County 0.39% Hawkins County 0.48% Roane County 0.66% Cannon County 0.10% Rogersville City 0.48% Robertson County 0.83% Carroll County 0.22% Haywood County 0.19% Rutherford County 4.65% H Rock-Bruceton SSD 0.22% Henderson County 0.26% Murfreesboro City 4.65% Huntingdon SSD 0.22% Lexington City 0.26% Scott County 0.18% McKenzie SSD 0.22% Henry County 0.37% Oneida SSD 0.18% South Carroll Co SSD 0.22% Paris SSD 0.37% Sequatchie County 0.14% West Carroll Co SSD 0.22% Hickman County 0.15% Sevier County 2.80% Carter County 0.45% Houston County 0.06% Shelby County 13.81% Elizabethton City 0.45% Humphreys County 0.25% Arlington City 13.81% Cheatham County 0.37% Jackson County 0.07% Bartlett City 13.81% Chester County 0.11% Jefferson County 0.55% Collierville City 13.81% Claiborne County 0.26% Johnson County 0.13% Germantown City 13.81% Clay County 0.05% Knox County 8.04% Lakeland City 13.81% Cocke County 0.34% Lake County 0.04% Millington City 13.81% Newport City 0.34% Lauderdale County 0.19% Smith County 0.19% Coffee County 0.77% Lawrence County 0.39% Stewart County 0.12% Manchester City 0.77% Lewis County 0.10% Sullivan County 2.39% Tullahoma City 0.77% Lincoln County 0.33% Bristol City 2.39% Crockett County 0.11% Fayetteville City 0.33% Kingsport City 2.39% Alamo City 0.11% Loudon County 0.78% Sumner County 2.40% Bells City 0.11% Lenoir City 0.78% Tipton County 0.52% Cumberland County 0.75% McMinn County 0.65% Trousdale County 0.08% Davidson County 16.16% Athens City 0.65% Unicoi County 0.16% Decatur County 0.11% Etowah City 0.65% Union County 0.12% DeKalb County 0.21% McNairy County 0.22% Van Buren County 0.05% Dickson County 0.68% Macon County 0.20% Warren County 0.43% Dyer County 0.47% Madison County 1.66% Washington County 1.91% Dyersburg City 0.47% Marion County 0.36% Johnson City 1.91% Fayette County 0.44% Richard City SSD 0.36% Wayne County 0.11% Fentress County 0.15% Marshall County 0.36% Weakley County 0.29% Franklin County 0.46% Maury County 1.23% White County 0.23% Humboldt City 0.47% Meigs County 0.09% Williamson County 6.11% Milan SSD 0.47% Monroe County 0.52% Franklin SSD 6.11% Trenton SSD 0.47% Sweetwater City 0.52% Wilson County 2.13% Bradford SSD 0.47% Montgomery County 2.49% Lebanon SSD 2.13%
FY 2019 -65- BEP Handbook
APPENDIX E DISTRICT TRANSPORTATION ALLOCATIONS FOR FY19
System ALLOCATION System ALLOCATION System ALLOCATION Anderson County 2,705,133 Gibson County SSD 1,174,047 Moore County 337,553 Clinton City 0 Giles County 1,440,823 Morgan County 1,675,811 Oak Ridge City 993,162 Grainger County 1,466,410 Obion County 1,201,097 Bedford County 2,851,667 Greene County 2,610,536 Union City 304,685 Benton County 904,217 Greeneville City 567,188 Overton County 1,118,285 Bledsoe County 892,293 Grundy County 838,732 Perry County 517,504 Blount County 4,028,755 Hamblen County 3,003,879 Pickett County 260,503 Alcoa City 430,884 Hamilton County 13,607,130 Polk County 851,999 Maryville City 1,181,383 Hancock County 450,066 Putnam County 3,147,523 Bradley County 3,516,964 Hardeman County 1,368,633 Rhea County 1,687,302 Cleveland City 1,272,080 Hardin County 1,221,303 Dayton City 0 Campbell County 2,017,151 Hawkins County 2,887,213 Roane County 2,194,418 Cannon County 765,863 Rogersville City 0 Robertson County 3,878,864 Carroll County 1,496,500 Haywood County 1,212,846 Rutherford County 13,295,957 H Rock-Bruceton SSD 0 Henderson County 1,575,975 Murfreesboro City 1,765,896 Huntingdon SSD 0 Lexington City 0 Scott County 951,976 McKenzie SSD 0 Henry County 1,268,388 Oneida SSD 332,657 South Carroll Co SSD 0 Paris SSD 509,651 Sequatchie County 742,304 West Carroll Co SSD 0 Hickman County 1,232,449 Sevier County 4,994,688 Carter County 1,941,257 Houston County 596,998 Shelby County 31,633,678 Elizabethton City 449,320 Humphreys County 998,847 Arlington City 1,091,949 Cheatham County 2,153,188 Jackson County 647,144 Bartlett City 1,926,999 Chester County 1,154,850 Jefferson County 2,682,268 Collierville City 1,804,774 Claiborne County 1,925,782 Johnson County 983,304 Germantown City 1,172,231 Clay County 403,143 Knox County 19,651,676 Lakeland City 266,801 Cocke County 1,632,966 Lake County 275,674 Millington City 668,324 Newport City 0 Lauderdale County 1,437,318 Smith County 1,142,607 Coffee County 1,601,125 Lawrence County 2,179,335 Stewart County 927,013 Manchester City 177,722 Lewis County 565,063 Sullivan County 3,589,147 Tullahoma City 462,091 Lincoln County 1,468,594 Bristol City 787,300 Crockett County 927,047 Fayetteville City 280,951 Kingsport City 1,466,266 Alamo City 0 Loudon County 1,464,482 Sumner County 10,414,503 Bells City 0 Lenoir City 577,547 Tipton County 4,199,486 Cumberland County 2,690,325 McMinn County 1,858,744 Trousdale County 451,535 Davidson County 25,841,008 Athens City 317,165 Unicoi County 831,610 Decatur County 717,472 Etowah City 49,083 Union County 1,472,626 DeKalb County 1,212,844 McNairy County 1,903,073 Van Buren County 282,504 Dickson County 2,800,046 Macon County 1,406,829 Warren County 2,010,947 Dyer County 2,108,832 Madison County 4,497,611 Washington County 3,800,352 Dyersburg City 0 Marion County 1,509,617 Johnson City 1,767,553 Fayette County 1,471,843 Richard City SSD 0 Wayne County 997,231 Fentress County 867,427 Marshall County 1,695,956 Weakley County 1,412,229 Franklin County 1,905,748 Maury County 4,013,558 White County 1,406,647 Humboldt City 242,171 Meigs County 709,478 Williamson County 12,377,959 Milan SSD 663,383 Monroe County 2,529,027 Franklin SSD 1,268,092 Trenton SSD 412,160 Sweetwater City 226,820 Wilson County 6,030,474 Bradford SSD 196,639 Montgomery County 11,511,101 Lebanon SSD 1,184,161 Total State Allocation $315,140,995
FY 2019 -66- BEP Handbook
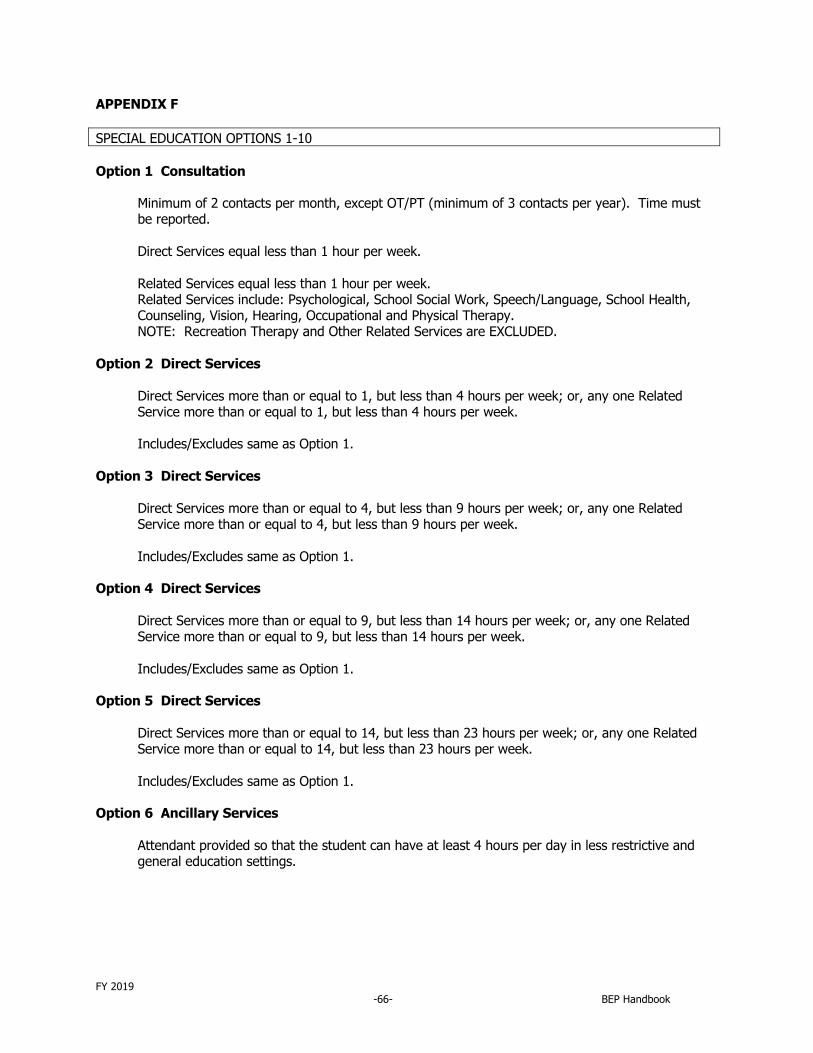
APPENDIX F SPECIAL EDUCATION OPTIONS 1-10 Option 1 Consultation Minimum of 2 contacts per month, except OT/PT (minimum of 3 contacts per year). Time must
be reported. Direct Services equal less than 1 hour per week. Related Services equal less than 1 hour per week. Related Services include: Psychological, School Social Work, Speech/Language, School Health,
Counseling, Vision, Hearing, Occupational and Physical Therapy. NOTE: Recreation Therapy and Other Related Services are EXCLUDED. Option 2 Direct Services Direct Services more than or equal to 1, but less than 4 hours per week; or, any one Related
Service more than or equal to 1, but less than 4 hours per week. Includes/Excludes same as Option 1. Option 3 Direct Services Direct Services more than or equal to 4, but less than 9 hours per week; or, any one Related
Service more than or equal to 4, but less than 9 hours per week. Includes/Excludes same as Option 1. Option 4 Direct Services Direct Services more than or equal to 9, but less than 14 hours per week; or, any one Related
Service more than or equal to 9, but less than 14 hours per week. Includes/Excludes same as Option 1. Option 5 Direct Services Direct Services more than or equal to 14, but less than 23 hours per week; or, any one Related
Service more than or equal to 14, but less than 23 hours per week. Includes/Excludes same as Option 1. Option 6 Ancillary Services Attendant provided so that the student can have at least 4 hours per day in less restrictive and
general education settings.
FY 2019 -67- BEP Handbook
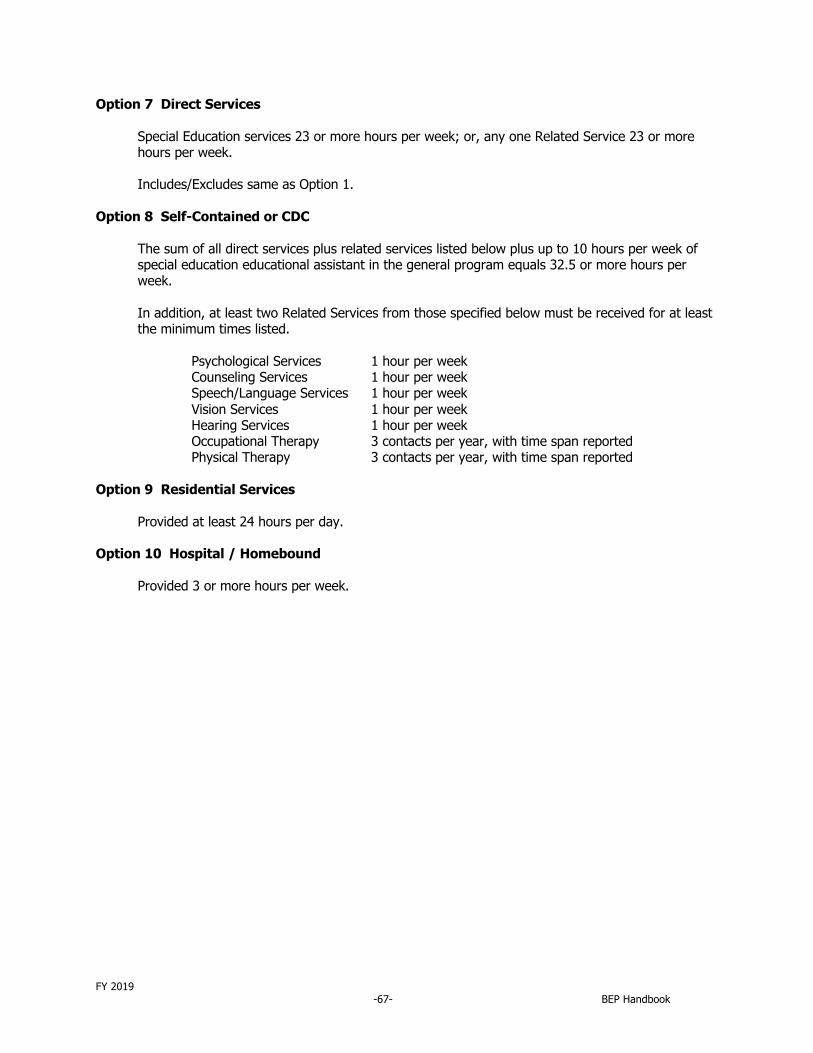
Option 7 Direct Services Special Education services 23 or more hours per week; or, any one Related Service 23 or more
hours per week. Includes/Excludes same as Option 1. Option 8 Self-Contained or CDC The sum of all direct services plus related services listed below plus up to 10 hours per week of
special education educational assistant in the general program equals 32.5 or more hours per week.
In addition, at least two Related Services from those specified below must be received for at least
the minimum times listed. Psychological Services 1 hour per week Counseling Services 1 hour per week Speech/Language Services 1 hour per week Vision Services 1 hour per week Hearing Services 1 hour per week Occupational Therapy 3 contacts per year, with time span reported Physical Therapy 3 contacts per year, with time span reported Option 9 Residential Services Provided at least 24 hours per day. Option 10 Hospital / Homebound Provided 3 or more hours per week.
FY 2019 -68- BEP Handbook
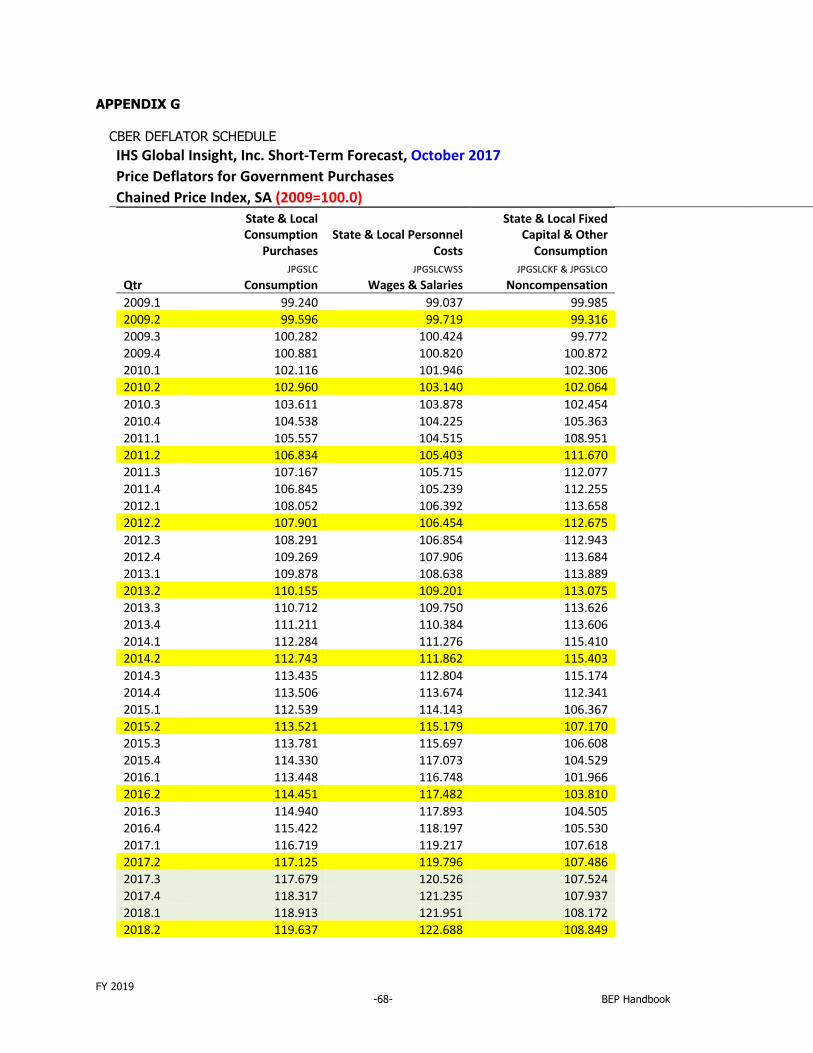
APPENDIX G
CBER DEFLATOR SCHEDULE IHS Global Insight, Inc. Short-Term Forecast, October 2017 Price Deflators for Government Purchases Chained Price Index, SA (2009=100.0)
State & Local Consumption
Purchases State & Local Personnel
Costs
State & Local Fixed Capital & Other
Consumption JPGSLC JPGSLCWSS JPGSLCKF & JPGSLCO
Qtr Consumption Wages & Salaries Noncompensation 2009.1 99.240 99.037 99.985 2009.2 99.596 99.719 99.316 2009.3 100.282 100.424 99.772 2009.4 100.881 100.820 100.872 2010.1 102.116 101.946 102.306 2010.2 102.960 103.140 102.064 2010.3 103.611 103.878 102.454 2010.4 104.538 104.225 105.363 2011.1 105.557 104.515 108.951 2011.2 106.834 105.403 111.670 2011.3 107.167 105.715 112.077 2011.4 106.845 105.239 112.255 2012.1 108.052 106.392 113.658 2012.2 107.901 106.454 112.675 2012.3 108.291 106.854 112.943 2012.4 109.269 107.906 113.684 2013.1 109.878 108.638 113.889 2013.2 110.155 109.201 113.075 2013.3 110.712 109.750 113.626 2013.4 111.211 110.384 113.606 2014.1 112.284 111.276 115.410 2014.2 112.743 111.862 115.403 2014.3 113.435 112.804 115.174 2014.4 113.506 113.674 112.341 2015.1 112.539 114.143 106.367 2015.2 113.521 115.179 107.170 2015.3 113.781 115.697 106.608 2015.4 114.330 117.073 104.529 2016.1 113.448 116.748 101.966 2016.2 114.451 117.482 103.810 2016.3 114.940 117.893 104.505 2016.4 115.422 118.197 105.530 2017.1 116.719 119.217 107.618 2017.2 117.125 119.796 107.486 2017.3 117.679 120.526 107.524 2017.4 118.317 121.235 107.937 2018.1 118.913 121.951 108.172 2018.2 119.637 122.688 108.849
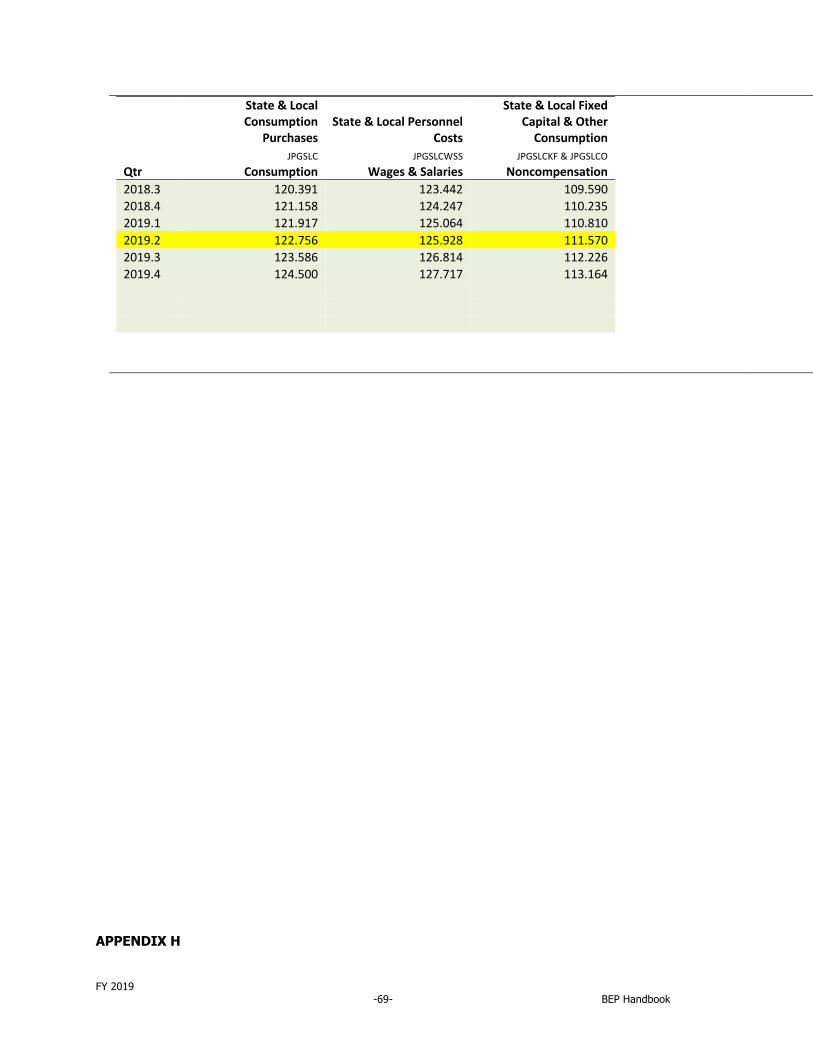
FY 2019 -69- BEP Handbook
State & Local Consumption
Purchases State & Local Personnel
Costs
State & Local Fixed Capital & Other
Consumption JPGSLC JPGSLCWSS JPGSLCKF & JPGSLCO
Qtr Consumption Wages & Salaries Noncompensation 2018.3 120.391 123.442 109.590 2018.4 121.158 124.247 110.235 2019.1 121.917 125.064 110.810 2019.2 122.756 125.928 111.570 2019.3 123.586 126.814 112.226 2019.4 124.500 127.717 113.164
APPENDIX H
FY 2019 -70- BEP Handbook
DETAILED INSTRUCTIONS FOR CALCULATION OF BEP FORMULA Appendix H details the actual calculation of the BEP formula by the State Department of Education (DOE) personnel. This information will be of primary interest to DOE personnel, as well as others who calculation of BEP funding. The files referred to, and the links contained therein, reside on the server at the DOE, and are accessible to appropriate staff members. Calculating the Basic Education Program (BEP) The BEP Blue Books details current teacher to pupil funding ratios along with current unit costs for all components in the BEP and is accessible at www.tn.gov/sbe/bep.html. Any changes in funding ratios, deletions, additions, or structural changes to the BEP formula must first be approved by the State Board of Education and/or the General Assembly. The Department of Education is authorized annually to update unit costs based on inflation and salaries as specified in the Appropriations Act. Also, each year’s fiscal capacity indices and Cost Differential Factors (CDF) may be incorporated into the formula without prior approval. The BEP file is maintained and calculated by the Office of Local Finance within the Department of Education. The calculation instructions are divided into four major sections: I. The Budget File II. Calculating April, May and June Estimates and the July Final File III. January Revised BEP File IV. BEP Growth Calculation and Payments to LEAs Exhibit 1 Function of the Tabs in the BEP File Exhibit 2 Checklist of BEP Component Updates Exhibit 3 Volunteer School System – sample allocation sheet BEP timeline:
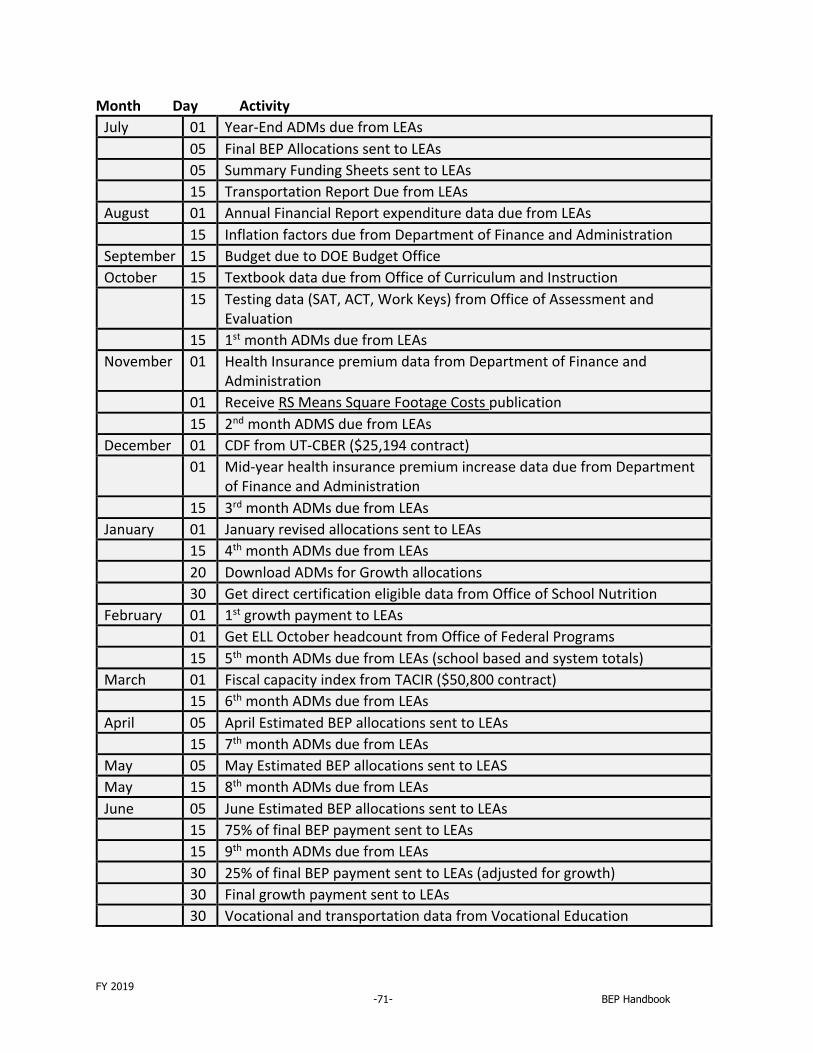
FY 2019 -71- BEP Handbook
Month Day Activity July 01 Year-End ADMs due from LEAs 05 Final BEP Allocations sent to LEAs 05 Summary Funding Sheets sent to LEAs 15 Transportation Report Due from LEAs August 01 Annual Financial Report expenditure data due from LEAs 15 Inflation factors due from Department of Finance and Administration September 15 Budget due to DOE Budget Office October 15 Textbook data due from Office of Curriculum and Instruction 15 Testing data (SAT, ACT, Work Keys) from Office of Assessment and
Evaluation 15 1st month ADMs due from LEAs November 01 Health Insurance premium data from Department of Finance and
Administration 01 Receive RS Means Square Footage Costs publication 15 2nd month ADMS due from LEAs December 01 CDF from UT-CBER ($25,194 contract) 01 Mid-year health insurance premium increase data due from Department
of Finance and Administration 15 3rd month ADMs due from LEAs January 01 January revised allocations sent to LEAs 15 4th month ADMs due from LEAs 20 Download ADMs for Growth allocations 30 Get direct certification eligible data from Office of School Nutrition February 01 1st growth payment to LEAs 01 Get ELL October headcount from Office of Federal Programs 15 5th month ADMs due from LEAs (school based and system totals) March 01 Fiscal capacity index from TACIR ($50,800 contract) 15 6th month ADMs due from LEAs April 05 April Estimated BEP allocations sent to LEAs 15 7th month ADMs due from LEAs May 05 May Estimated BEP allocations sent to LEAS May 15 8th month ADMs due from LEAs June 05 June Estimated BEP allocations sent to LEAs 15 75% of final BEP payment sent to LEAs 15 9th month ADMs due from LEAs 30 25% of final BEP payment sent to LEAs (adjusted for growth) 30 Final growth payment sent to LEAs 30 Vocational and transportation data from Vocational Education
FY 2019 -72- BEP Handbook
I Budget File
NOTE: For purposes of this document, FY19 is the fiscal year for which we are budgeting and 2016-2017 is the fiscal year just completed.
The BEP file is an Excel workbook comprised of several worksheets. The department starts with the July Final file from the previous fiscal year as the basis for the budget file. The budget file then becomes the basis for the April Estimate. In like manner each succeeding file becomes the basis for the next file. The order of BEP files is as follows: Budget, April Estimate, May Estimate, June Estimate, July Final, January Revised, and Growth. Finance and Administration may request several updates to the Budget file prior to the April Estimate.
. File Location: H:\Local Finance\FY18\January\FY18 January Revised. New file saved as: H:\Local Finance\FY19\Budget\FY19 budget.
A. Update Average Daily Membership (ADMs) Based on total ADMs from the previous three years, the department estimates a percentage that ADMs will grow during the current year. A formula is inserted into the ADMs tab that inflates the regular, vocational and special education ADMs from the previous year by the estimated growth percentage. (This formula is inserted in each grade, system vocational, vocational education total, each special education option, elementary subtotal, middle subtotal, high school subtotal, 11th grade, and 12th grade Vocational estimate.)
B. Update 3yr Avg (3 Year Average) Unit Costs:
File Location: H:\Local Finance\FY18\Budget\Unit Cost\2018 Unit Cost. New file saved as: H:\Local Finance\FY19\Budget\Unit Cost\2019 Unit Cost.
1. Inflation Indices The department requests the current year’s Price Deflators for Government Purchases from Finance and Administration. In the Inflation tab, a column is inserted for 2019. Using the Price Deflators, all previous years’ quarter 2 indices are replaced, and the quarter 2 indices for 2019 in the Inflation tab are inserted as follows: consumption to combined, wages and salaries to compensation, and non-compensation to non-compensation. All three percentage changes for 2019 are also calculated in the Inflation Tab, current year.
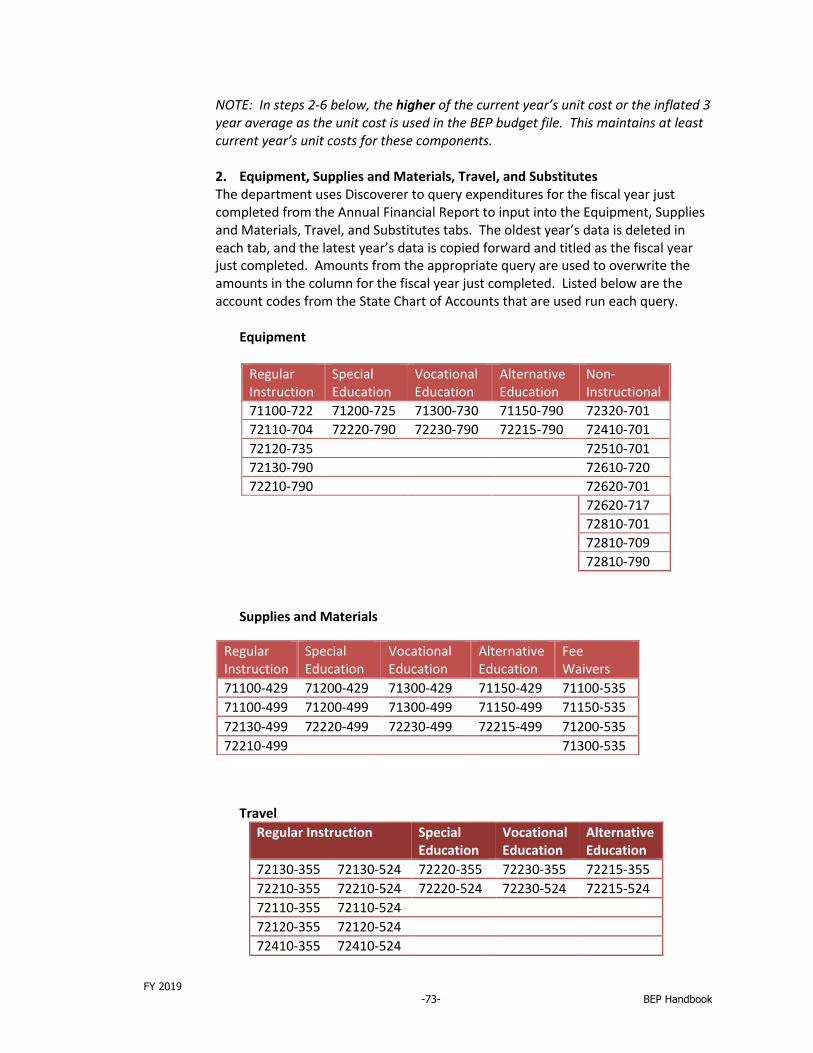
FY 2019 -73- BEP Handbook
NOTE: In steps 2-6 below, the higher of the current year’s unit cost or the inflated 3 year average as the unit cost is used in the BEP budget file. This maintains at least current year’s unit costs for these components.
2. Equipment, Supplies and Materials, Travel, and Substitutes The department uses Discoverer to query expenditures for the fiscal year just completed from the Annual Financial Report to input into the Equipment, Supplies and Materials, Travel, and Substitutes tabs. The oldest year’s data is deleted in each tab, and the latest year’s data is copied forward and titled as the fiscal year just completed. Amounts from the appropriate query are used to overwrite the amounts in the column for the fiscal year just completed. Listed below are the account codes from the State Chart of Accounts that are used run each query.
Equipment
Regular Instruction
Special Education
Vocational Education
Alternative Education
Non-Instructional
71100-722 71200-725 71300-730 71150-790 72320-701 72110-704 72220-790 72230-790 72215-790 72410-701 72120-735 72510-701 72130-790 72610-720 72210-790 72620-701
72620-717 72810-701 72810-709 72810-790
Supplies and Materials
Travel Regular Instruction Special
Education Vocational Education
Alternative Education
72130-355 72130-524 72220-355 72230-355 72215-355 72210-355 72210-524 72220-524 72230-524 72215-524 72110-355 72110-524 72120-355 72120-524 72410-355 72410-524
Regular Instruction
Special Education
Vocational Education
Alternative Education
Fee Waivers
71100-429 71200-429 71300-429 71150-429 71100-535 71100-499 71200-499 71300-499 71150-499 71150-535 72130-499 72220-499 72230-499 72215-499 71200-535 72210-499 71300-535
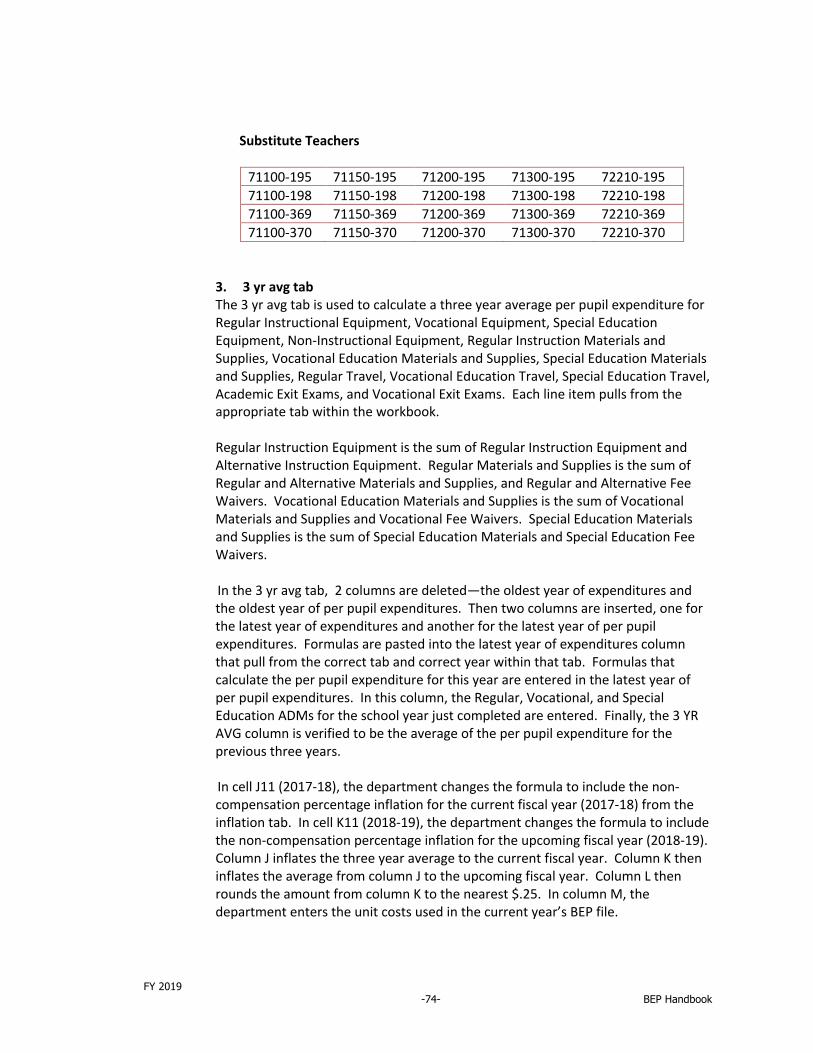
FY 2019 -74- BEP Handbook
Substitute Teachers
71100-195 71150-195 71200-195 71300-195 72210-195 71100-198 71150-198 71200-198 71300-198 72210-198 71100-369 71150-369 71200-369 71300-369 72210-369 71100-370 71150-370 71200-370 71300-370 72210-370
3. 3 yr avg tab The 3 yr avg tab is used to calculate a three year average per pupil expenditure for Regular Instructional Equipment, Vocational Equipment, Special Education Equipment, Non-Instructional Equipment, Regular Instruction Materials and Supplies, Vocational Education Materials and Supplies, Special Education Materials and Supplies, Regular Travel, Vocational Education Travel, Special Education Travel, Academic Exit Exams, and Vocational Exit Exams. Each line item pulls from the appropriate tab within the workbook. Regular Instruction Equipment is the sum of Regular Instruction Equipment and Alternative Instruction Equipment. Regular Materials and Supplies is the sum of Regular and Alternative Materials and Supplies, and Regular and Alternative Fee Waivers. Vocational Education Materials and Supplies is the sum of Vocational Materials and Supplies and Vocational Fee Waivers. Special Education Materials and Supplies is the sum of Special Education Materials and Special Education Fee Waivers.
In the 3 yr avg tab, 2 columns are deleted—the oldest year of expenditures and the oldest year of per pupil expenditures. Then two columns are inserted, one for the latest year of expenditures and another for the latest year of per pupil expenditures. Formulas are pasted into the latest year of expenditures column that pull from the correct tab and correct year within that tab. Formulas that calculate the per pupil expenditure for this year are entered in the latest year of per pupil expenditures. In this column, the Regular, Vocational, and Special Education ADMs for the school year just completed are entered. Finally, the 3 YR AVG column is verified to be the average of the per pupil expenditure for the previous three years. In cell J11 (2017-18), the department changes the formula to include the non-compensation percentage inflation for the current fiscal year (2017-18) from the inflation tab. In cell K11 (2018-19), the department changes the formula to include the non-compensation percentage inflation for the upcoming fiscal year (2018-19). Column J inflates the three year average to the current fiscal year. Column K then inflates the average from column J to the upcoming fiscal year. Column L then rounds the amount from column K to the nearest $.25. In column M, the department enters the unit costs used in the current year’s BEP file.
FY 2019 -75- BEP Handbook
4. Substitutes The department inserts the previous year’s substitute expenditures into the Substitutes tab. It then calculates the three year average expenditures per pupil. This amount is inflated up two fiscal years by multiplying it by the compensation inflation index, and rounded to the nearest $.25. Finally the department records the previous year’s substitute unit cost. 5. Textbooks The department request BEP sales forecast from the Office of Curriculum and Instruction, Textbook Services. For the fiscal year just completed, the actual costs of textbooks are input into the Books tab. The three year average for textbooks calculates in the 3 yr avg tab. Finally, the department enters the unit cost used in the current year’s BEP into Column M. 6. Academic and Vocational Exit Exams In the ACT tab, the department enters the current year cost of the ACT, SAT, and Work Key exams, as well as the current year’s number of purchases of ACT and SAT to arrive at the weighted average cost of SAT and ACT. Each year’s average cost is pulled into the 3 yr avg tab, which inflates the three year average forward two years. In Column M on 3 yr avg tab, enter the unit costs used in the current year’s BEP file are entered in Column M on 3 yr avg tab. 7. Alternative Schools, Duty Free Lunch, Maintenance and Operations, At-Risk In the other costs tab, the department inflates up the previous year’s unit cost for Alternative Schools per Regular ADM, Alternative Schools per 7-12 and Vocational ADM, Duty Free Lunch, Maintenance and Operations, and At Risk unit Cost by multiplying those times the combined inflationary rate for the upcoming fiscal year.
8. Enter new Unit Costs into BEP budget spreadsheet. The department Inputs the unit costs calculated in steps 2-7 above into the appropriate row of Column B of the Assumptions tab in the BEP budget file.
C. Update Additional Unit Costs The department enters additional unit costs from appropriate sources directly into Column B of the Assumptions tab of the BEP budget file.
1. State Funded Percentages The state funded percentages of 70% for instructional salaries, 70% for instructional benefits, 75% for classroom, and 50% for non-classroom change only
FY 2019 -76- BEP Handbook
if legislation is passed to change the state funding percentages for these categories.
2. FICA and TCRS rates The current FICA rate of 7.65% changes only if the combined employer’s tax rate for social security and Medicare is changed by Congress. TCRS provides the department with both the certified and non-certified retirement rates. 3. Health Insurance Premium The average teacher group health insurance annual premium as determined by F&A is entered by the department four times into: 1) Instructional Insurance, 2) Other Classroom Insurance, 3)Non Classroom Insurance, and 4)Superintendent and Technology Coordinator Insurance. The resulting premium amounts arrived at in Column D are used in the formula.
Explanation of Pre-determined factors (Column C of the Assumptions tab)
To determine the factor used to calculate the instructional insurance component, the minimum (45%) of the average premium that the state pays is divided by 70%, because the state pays 70% of instructional component costs. This factor (.64) in Column C is then multiplied by the average premium to arrive at the premium in Column D. 45% of the total annual average premium is derived when the premium amount from column D is multiplied by the equalized state percentage for instructional components of 70%.
Factors of (.60), (.60), and (.90) respectively, are multiplied times the average premium in Column B to arrive at the health insurance premium used in the formula for Classroom, Non-Classroom, and Superintendent/Technology Coordinators. These factors ensure that on average the state pays 45% of the average premium for educational assistants, superintendents, and technology coordinators and 30% of the average premium for the non-classroom positions of system secretaries, school secretaries, and custodians.
4. Percent Personnel The formula allocates 45% of Transportation costs and 60% of Maintenance and Operation costs to personnel in the non-classroom category. These percentages do not change.
5. School Building Construction This section includes the factors necessary to calculate the capital outlay funds generated in the non-classroom category. Only the cost per square foot for elementary, middle, and high schools are changed annually.
The department calculates the costs per square foot using the following spreadsheet:
H:/Local Finance/FY19/budget/unit costs/3 yr avg sq. ft. cost.
FY 2019 -77- BEP Handbook
In this spreadsheet, the department inserts the current square footage costs by type of school and related architect costs from the RS Means Square Footage Costs publication. In addition, the current year’s city cost indices for Tennessee are entered into the spreadsheet. The three year average construction costs net of the three year average architect’s fees are multiplied by the three year average Tennessee city cost index. These subtotals are then inflated up one year by multiplying those times the non-compensation inflation factor for the budget year. The result is rounded to the nearest dollar. The department inputs the resulting square footage costs by school type into Column B of the Assumptions tab of the BEP budget file. The Capital tab calculates the total capital outlay generated for each system.
6. Salaries In Column B of the Assumptions tab, the department inputs the salary unit cost used in the current year’s BEP file for: Teacher Certificated, Other Certificated, Nurses, Teacher Aides, School Secretaries, System Secretaries, Custodians, and Superintendents. These salaries are multiplied by a raise factor in Column C. For Teacher Certificated, Other Certificated, and Nurses, the department inputs a factor of “1" plus the percent state raise (as determined by F&A) (For example a factor of 1.025 indicates a raise of 2.5%.) In Column C, for the remaining salaries, the department inputs a factor of “1” plus the same percentage state raise from above. The resulting salaries in Column D are used in the formula.
D. Update Transportation Allocations
1. Transportation File Location: H:\Local Finance\FY18\budget\unit cost\2018trans.xls New file saved as: H:\Local Finance\FY19\ budget\unit cost\2019trans.xls. The department Inserts the total transportation expenditures by district for the fiscal year just completed (2017) into the Expenditures tab. The oldest year’s expenditure data is deleted. The previous two years’ expenditures are inflated up to (2019) using the appropriate inflationary factors calculated in the Assumptions tab of the BEP budget file. (Each year’s transportation inflation index is the sum of 45% of that year’s compensation index and 55% of that year’s non-compensation index.) The three year average expenditures are calculated in (2017) dollars and inflated up two years (2018 and 2019) using the appropriate fiscal years’ transportation inflation indices.
The department pulls ADT (average daily students transported), Special Education ADT, and daily one-way miles driven for the fiscal year just completed (2017) from LEAs’ Transportation reports. These counts along with the previous year’s ADM are inserted into the Counts tab. The oldest year’s data is deleted. This tab then
FY 2019 -78- BEP Handbook
calculates the three year average ADT, Special Education ADT, one-way miles driven, and ADM. For each district providing transportation, the Regression tab calculates the dependent variable of transportation cost per ADM. It also calculates the independent variables of ADT per ADM, Miles per ADM, and Special Education ADT per ADM. A fourth independent variable of type indicates whether or not the district is a county or non-county district (a value of 1 is for a county district and a value of 0 is for a non-county district). Given these independent variables and the dependent variable, the department use the multi-variable linear regression tool (named Regression) in Excel to calculate coefficients for each variable. The new coefficients are input into the Regression tab. Based on these coefficients, this tab calculates a Transportation Cost per ADM for each district. The Results tab then multiplies the Transportation Cost per ADM by each district’s ADM to arrive at a Predicted Cost (of Transportation). The calculated Predicted Costs are inserted into the Total Transportation column in the Non-classroom tab of the BEP budget file. 2. Vocational Center Transportation File Location: H:\Local Finance\FY18\budget\unit cost\Vocctr18.xls New file saved as: H:\Local Finance\FY19\budget\unit cost\Vocctr19.xls. In the Vocctr tab, the department links each district to the FTE ADM times one way mileage total from the Vocational transportation report obtained from Vocational Education. In the Unit Cost tab, the previous year’s unit cost is inflated up one year using the budget year’s non-compensation index. The Vocctr tab then multiplies each district’s FTE ADM one-way mileage times this unit cost to arrive at each district’s allocation. The department pastes these allocations from the Vocctr tab into the Vocational Center Transportation column in the Classroom tab of the BEP budget file. E. Finishing the Initial Budget File Once the department has updated ADMs, transportation allocations, vocational transportation allocations, and all unit costs for which data is available, five final steps need to be completed before the budget file is submitted to F&A. NOTE: In the current year, each system should receive the greater of 1) the total state BEP funds it generates or 2) minimum funding 1. Update Minimum Funding For FY19, minimum funding is equal to 2015-16 appropriations, as adjusted for ADM decreases that have occurred since 2015-16. The department recalculates the 2015-16 BEP file using these ADM decreases to arrive at minimum funding amounts.
FY 2019 -79- BEP Handbook
2. Update values for Mandatory Increase The values in Cells C3:C6 in the Insurance tab are updated to include the applicable health insurance premium amounts from the previous year’s July Final file Assumptions tab. 3. Run the Mandatory Increase Macro NOTE: Macros must be activated before this step can be completed. For this step, the Calculate the Mandatory Increase on Stability macro is used. The Assumptions tab contains the macro button. This macro requires the input of the certificated health insurance premium from the previous year and current year, certificated raise, and previous year and current year certificated and non-certificated TCRS rates. Column AJ in the BEPFINAL tab then calculates the mandatory increase amount for systems on stability. 4. Total BEP Funding The total BEP funding each district is projected to receive is reflected in Column V of the BEPFINAL tab. The values in Column X are the greater of 1) the total state BEP funds that a system generates or 2) minimum funding. 5. Quality Assurance After the BEP is calculated, two staff members in the Office of Local Finance review all sets of input (as detailed in a quality assurance document) to ensure their accuracy. Prior to public release, two members of senior management then review the BEP file as a final check on the accuracy of inputs.
II Calculating April, May, and June Estimates and July Final file
Beginning in April, BEP estimates are sent to the LEAs. The budget file becomes the basis for the April Estimate file. The April Estimate is the basis for the May Estimate. The May Estimate is the basis for the June Estimate. The June Estimate is the basis for the July Final. Each of these files is compiled in the corresponding month.
A. Update Additional Counts
1. At Risk Counts The department obtains the number of direct certified eligible children (At Risk). The At Risk counts are inserted into the At Risk tab of the BEP file.
2. ELL Counts The department obtains the number of ELL (English Language Learners) children for the previous year from the Office of Federal Programs. The ELL numbers are inserted into the ELL column of the ADMs tab of the BEP file.
FY 2019 -80- BEP Handbook
B. Update CDF and Fiscal Capacity
1. CDF (Cost Differential Factor) In 2016 the Tennessee General Assembly passed the BEP Enhancement Act (Public Chapter 1020). As a result, the CDF was eliminated from the BEP formula. However, because the BEP Enhancement Act has not been fully phased in, LEAs with CDF adjustments receive 20% of their CDF adjustment.
The department obtains current CDF factors from the University of Tennessee, Center for Business and Economic Research (CBER). A new column in the CDFs tab of the BEP budget file is inserted, and the current CDF factors are copied into that column. The current indices are multiplied by 20%. Column C is linked to this 20% CDF column. Column C is linked to salary and benefit calculations in the instructional, classroom, and non-classroom tabs of the BEP file.
2. How Fiscal Capacity is used in the BEP Formula On average, the state funds 70, 70, 75, and 50 percent of the total BEP generated instructional salaries, instructional benefits, classroom, and non-classroom categories, respectively. However, each district’s state and local share of these categories varies based on its fiscal capacity. Counties with high fiscal capacity are required to fund a greater portion of the total BEP generated dollars with local funds.
Each county’s index is the proportion of its fiscal capacity to total statewide fiscal capacity. The indices are expressed as a percentage and all 95 county indices total 100%.
Each district’s fiscal capacity index is a 50/50 blend of its county’s TACIR index and CBER index. The blended indices feed into the Equalizing tab of the BEP file. In the Equalizing tab, the total BEP generated dollars for the instructional salaries, instructional benefits, classroom, and non-classroom categories are multiplied respectively by the average state funding percentages of 70, 70, 75, and 50. The total state funds for each category are subtracted from the total BEP generated funds for each category to arrive at the total local funded amounts of each category. The total local funded amount of each category is multiplied by each county’s blended fiscal capacity index to determine the amount of each category that that county will fund. Based on ADMs, multiple districts within the same county are allocated a proportionate share of their county’s local funded amount.
3. TACIR (Tennessee Advisory Commission on Intergovernmental Relations) Fiscal Capacity Index
The department obtains the current fiscal capacity indices from TACIR. A new column is inserted in the TACIR tab of the BEP file. The current indices are pasted into the new column. Column C is updated to reflect the current fiscal capacity indices. Column C is linked to the TACIR-FOX Mix tab of the BEP file.
4. CBER (Fox) Fiscal Capacity Index The CBER fiscal capacity index is also referred to as the Fox fiscal capacity index, because it was developed by UT economist, Dr. Bill Fox.
FY 2019 -81- BEP Handbook
The department obtains the current fiscal capacity indices from the University of Tennessee, Center for Business and Economic Research (CBER). A new column is inserted into the FOX tab of the BEP file. The current indices are pasted into the new column. Column C is updated to reflect the current fiscal capacity indices. Column C is linked to the TACIR-FOX Mix tab of the BEP file.
5. TACIR-FOX Mix tab In the TACIR-FOX Mix tab, the Prior Scenario column is linked to the previous year’s fiscal capacity indices. The Current Scenario column calculates the blended fiscal capacity index. This calculation limits the change that can occur in the index from the previous year to 30%. A column for the current year’s fiscal capacity indices is inserted. The indices from the Current Scenario column are pasted into the column that was inserted. Column C reflects the current blended fiscal capacity indices and links to the Equalizing tab in the BEP file.
C. Update ADMs and School Based Positions
1. Update ADMs LEAs report the number of students identified and served in special education (I&S) and regular and vocational ADMs by funding period or month via an upload into the Education Information System (EIS). Each funding period or month consists of twenty instructional days. ADMs and I&S from the first reporting period are due on October 15. ADMs and I&S from the second period are due on November 15. Each successive period’s ADMs and I&S are due 30 days from the prior submission.
Following each month’s reporting deadline, Local Finance staff members query EIS and aggregate the ADMs and I&S into a spreadsheet named XX ADMs – budget, where XX represents the current fiscal year and budget represents the BEP file being compiled. Each ADMs spreadsheet is located in H:\Common\FNA\Finance\SCHFINAN\BEP\ADM\SY20XX\budget, where XX represents the current fiscal year and budget represents the BEP file being compiled.
BEP funding is based on weighted average ADMs for periods 2, 3, 6, and 7. Period 2 is weighted 12.5%. Period 3 is weighted 17.5%. Period 6 and period 7 are weighted 35% each. As ADMs and I&S are collected throughout the year, the most recent period downloaded substitutes for any of the weighted periods that have not been submitted.
In the BEP file, the department edits the links to the previous ADMs spreadsheet to the appropriate month’s ADMs file. The ADMs and I&S link to the ADMs tab of the BEP file. When calculating the estimates for LEAs, the estimated growth factor from the budget file is not used. Instead, current year ADMs as available are used.
2. Update School Based Positions LEAs report ADMs by school for the fifth funding period or month. Local Finance staff members compile these ADMs by school into a spreadsheet named 20XX School Based Positions, where XX represents the current fiscal year. This spreadsheet calculates the
FY 2019 -82- BEP Handbook
number of librarians, library assistants, principals, assistant principals, and school secretaries that each LEA earns based on school staffing ratios detailed in the BEP Blue Book. Each School Based Positions spreadsheet is located in H:\Common\FNA\Finance\SCHFINAN\BEP\ADM\SY20XX\budget, where XX represents the current fiscal year and budget represents the BEP file being compiled.
In the BEP file, the department edits the links to the previous School Based Positions spreadsheet to the appropriate month’s School Based Positions file. The number of school based positions link to the Positions tab in the BEP file. 3. Update Charter Schools Capital Calculation In the Charter Schools tab, the list of current charter schools is updated (including those opening during the upcoming school year.) Each charter school’s enrollment is updated by grade to reflect each school’s year end enrollment. Projected enrollment is used for new charter schools. The non-classroom percentage for each LEA is changed to reflect the current year’s value. The calculations are reviewed to ensure that each charter school will receive the proper amount of capital outlay funds based on its enrollment. One-tenth of these charter school capital outlay amounts will be withheld from the host LEA and paid monthly directly to the respective charter school by the department. 4. Update Achievement School District and State Board of Education Allocation In the ASD tab, the list of current schools run by the Achievement School District is updated (including those opening during the upcoming school year.) Each ASD school’s enrollment is updated by school to reflect the projected enrollment for the coming year. Actual local revenues from the Maintenance of Effort Test are input by participating LEA. Once budgets are finalized in October after the July Final has been completed, the actual local revenues are replaced by budgeted local revenues for the coming year. The department calculates the per pupil amount to withhold from the respective LEA and totaled to determine the allocation for the Achievement School District. The same process is followed for the charter schools operated by the State Board of Education. The allocations for these schools is calculated in the State Board tab of the spreadsheet.
D. Finishing the current BEP file and July Final
Once the CDF, fiscal capacity, and ADMs and I&S have been updated, the mandatory increase macro is run (as detailed above.) Again, total BEP allocations for each LEA are reflected in Column X of the BEP Final tab. (ADMs and I&S may be updated multiple times as ADMs are downloaded. As a result, multiple BEP files may be created and compiled throughout the year until the July Final file is compiled.)
The department emails each LEA their How To and Allocation sheets as each month’s BEP file (April, May, June, and July) is completed.
FY 2019 -83- BEP Handbook
In early July, the department downloads ADMs and I&S and verifies the data for accuracy. After reviewing and making any necessary corrections, these ADMs and I&S are linked into the July Final BEP file. Finally the mandatory increase macro is run. Total Allocations from the BEP Final tab are the amounts LEAs will be funded in the upcoming fiscal year. One-tenth of this final allocation is paid to the LEAs starting on August 15 and on the fifteenth day of each succeeding month through April 15, and the remainder due each LEA shall be paid in June. The department submits this file to F&A.
III January Revised BEP
If there is a health insurance premium increase in January, the department updates the health insurance premiums in the Assumptions tab of the previously completed July Final BEP file using the premium amount from F&A. (The FY19 July Final file is updated to become the FY19 January Revised file.) The mandatory increase macro is rerun. The difference between each LEA’s January Revised BEP allocation and allocation from the July Final file is divided by five and added to each LEA’s original monthly allocation. These revised monthly allocations are paid to the LEAs starting January 15 and on the fifteenth day of each succeeding month through April 15. The final payment will be paid to the LEAs in June.
FY 2019 -84- BEP Handbook
IV BEP Growth Calculation and Payments to LEAs
TCA 49-3-351(d) states “If the LEA's current year ADM and I&S, taken as a whole, exceeds by more than two percent (2%) the prior year's ADM and I&S, taken as a whole, then that LEA's allocation of state funds shall be calculated on the basis of the current year's ADM and I&S less the first two percent (2%) by which it exceeds the prior year's ADM and I&S. If the funds appropriated for that purpose are insufficient to provide for the LEA's increased allocations, the commissioner shall apply a pro rata reduction to the increased amount each LEA is otherwise eligible to receive. If the funds appropriated for that purpose exceed the amount required to fund growth in excess of two percent (2%), then that percentage may be lowered to a percentage that may ensure that all funds appropriated are allocated and disbursed to LEAs. An estimated fifty percent (50%) of the appropriated amount shall be distributed to such an eligible LEA by February 1, with the remainder, subject to any adjustment of numbers by the department of education that may affect the remaining amount, to be distributed by the following June 30.”
Each year in January, BEP growth funding is calculated by using current ADMs and I&S in the previous year’s July Final file. For example, in January 2019, ADMs and I&S from the 2018-2019 school year would be used in the FY19 July Final file. First the current year’s ADMs and I&S are linked into the July Final file and saved as FY19 Growth. For each LEA, the department calculates the variance between the BEP allocation from Column M of the BEP Final tab in the Growth file and the BEP allocation from Column M of the BEP Final tab in the July Final file. All positive variances as a result of this calculation added together represent 100% growth funding. If this aggregate amount does not exceed the appropriation for BEP growth funding, then those LEAs with growth would receive half their growth amount on February 1.
However, if 100% growth funding exceeds the appropriation for growth, then the department recalculates the Growth file using current year's ADM and I&S less the first two percent (2%) by which it exceeds the prior year's ADM and I&S. The department again calculates each LEAs’ variance between the BEP allocation in Column M of the BEP Final tab in the Growth file and the BEP allocation in Column M of the BEP Final tab in the July Final tab. Should the sum of all positive variances exceed the appropriation of growth, the department recalculates the Growth file using higher percentages of ADM growth until the calculated growth funding amount is equal to the appropriation amount. Likewise, should the 2% growth funding amount be less than the appropriation for growth, the department recalculates the Growth file using lesser percentages of ADM growth until the calculated growth funding amount is equal to the appropriation amount. After arriving at the calculated growth funding amount, one-half of the estimated growth is distributed to the LEAs on February 1.
This same process is repeated in June to calculate the final growth funding for LEAs. On June 30, LEAs are paid any remaining growth funds that were not paid to them in February. If an LEA were paid estimated growth funds in February and as result of the June calculation it generated no growth funds, the amount of the February growth payment is withheld from that LEAs June 30 BEP payment. The June growth calculation completes a full year’s cycle of BEP calculations.
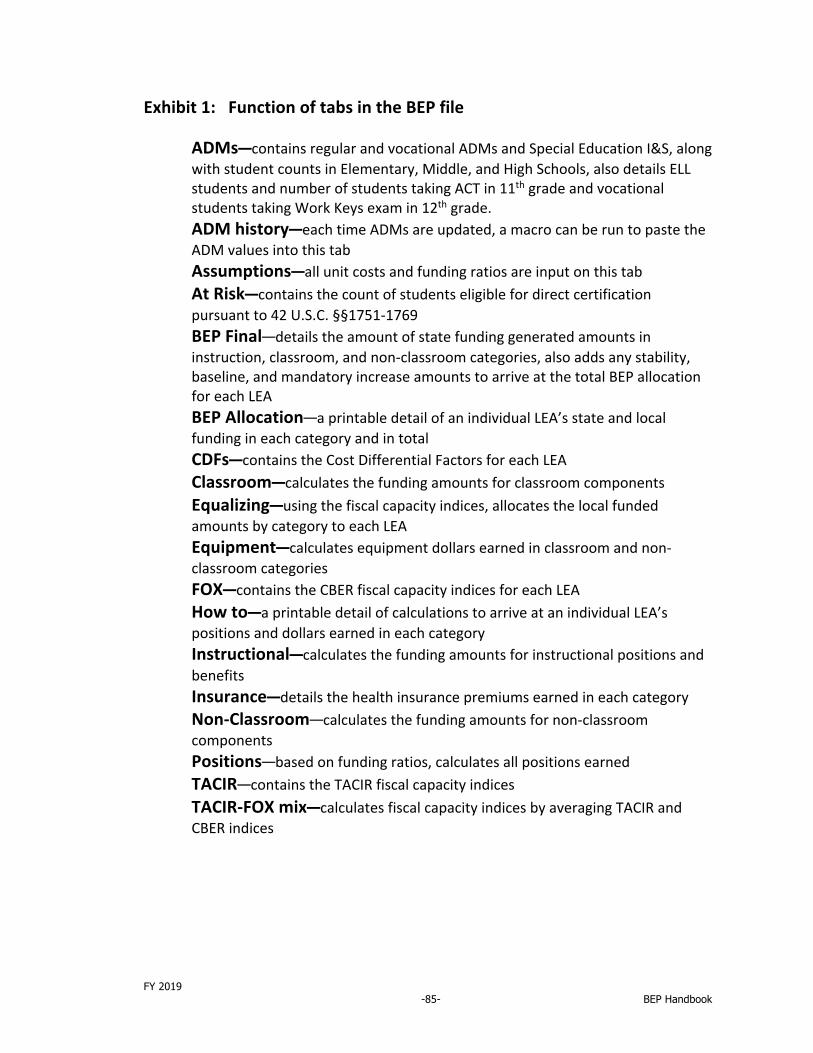
FY 2019 -85- BEP Handbook
Exhibit 1: Function of tabs in the BEP file
ADMs—contains regular and vocational ADMs and Special Education I&S, along with student counts in Elementary, Middle, and High Schools, also details ELL students and number of students taking ACT in 11th grade and vocational students taking Work Keys exam in 12th grade. ADM history—each time ADMs are updated, a macro can be run to paste the ADM values into this tab Assumptions—all unit costs and funding ratios are input on this tab At Risk—contains the count of students eligible for direct certification pursuant to 42 U.S.C. §§1751-1769 BEP Final—details the amount of state funding generated amounts in instruction, classroom, and non-classroom categories, also adds any stability, baseline, and mandatory increase amounts to arrive at the total BEP allocation for each LEA BEP Allocation—a printable detail of an individual LEA’s state and local funding in each category and in total CDFs—contains the Cost Differential Factors for each LEA Classroom—calculates the funding amounts for classroom components Equalizing—using the fiscal capacity indices, allocates the local funded amounts by category to each LEA Equipment—calculates equipment dollars earned in classroom and non-classroom categories FOX—contains the CBER fiscal capacity indices for each LEA How to—a printable detail of calculations to arrive at an individual LEA’s positions and dollars earned in each category Instructional—calculates the funding amounts for instructional positions and benefits Insurance—details the health insurance premiums earned in each category Non-Classroom—calculates the funding amounts for non-classroom components Positions—based on funding ratios, calculates all positions earned TACIR—contains the TACIR fiscal capacity indices TACIR-FOX mix—calculates fiscal capacity indices by averaging TACIR and CBER indices
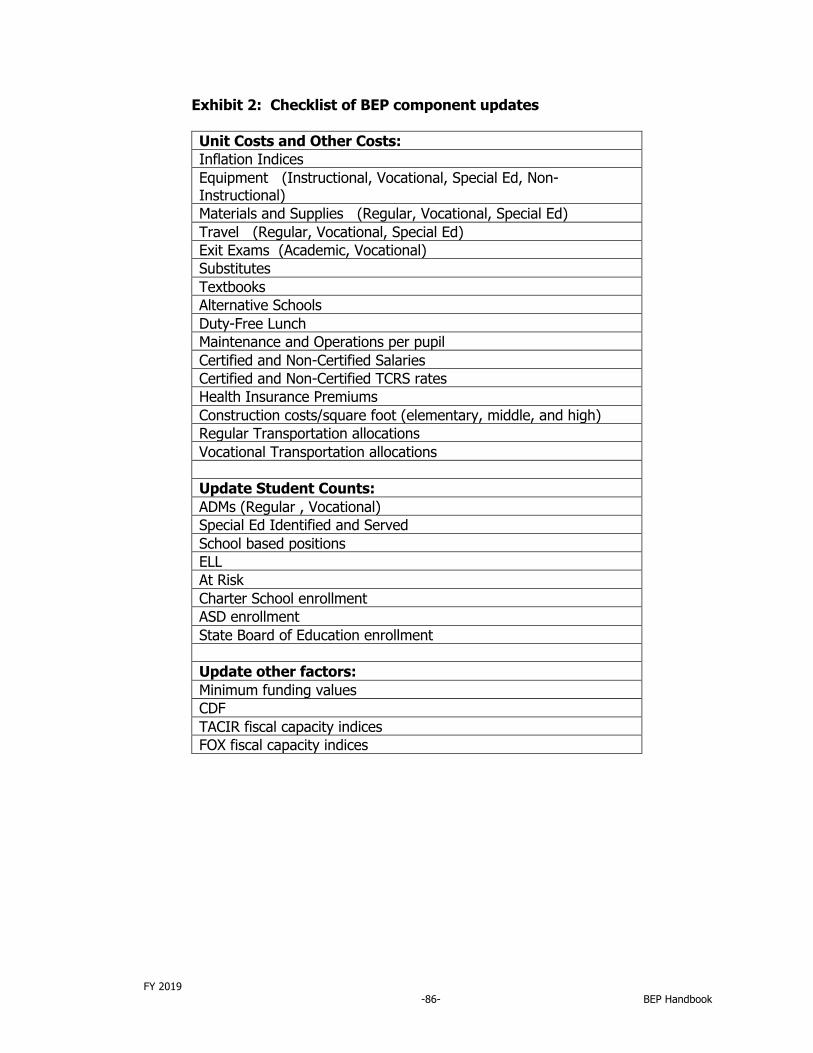
FY 2019 -86- BEP Handbook
Exhibit 2: Checklist of BEP component updates Unit Costs and Other Costs: Inflation Indices Equipment (Instructional, Vocational, Special Ed, Non-Instructional) Materials and Supplies (Regular, Vocational, Special Ed) Travel (Regular, Vocational, Special Ed) Exit Exams (Academic, Vocational) Substitutes Textbooks Alternative Schools Duty-Free Lunch Maintenance and Operations per pupil Certified and Non-Certified Salaries Certified and Non-Certified TCRS rates Health Insurance Premiums Construction costs/square foot (elementary, middle, and high) Regular Transportation allocations Vocational Transportation allocations Update Student Counts: ADMs (Regular , Vocational) Special Ed Identified and Served School based positions ELL At Risk Charter School enrollment ASD enrollment State Board of Education enrollment Update other factors: Minimum funding values CDF TACIR fiscal capacity indices FOX fiscal capacity indices
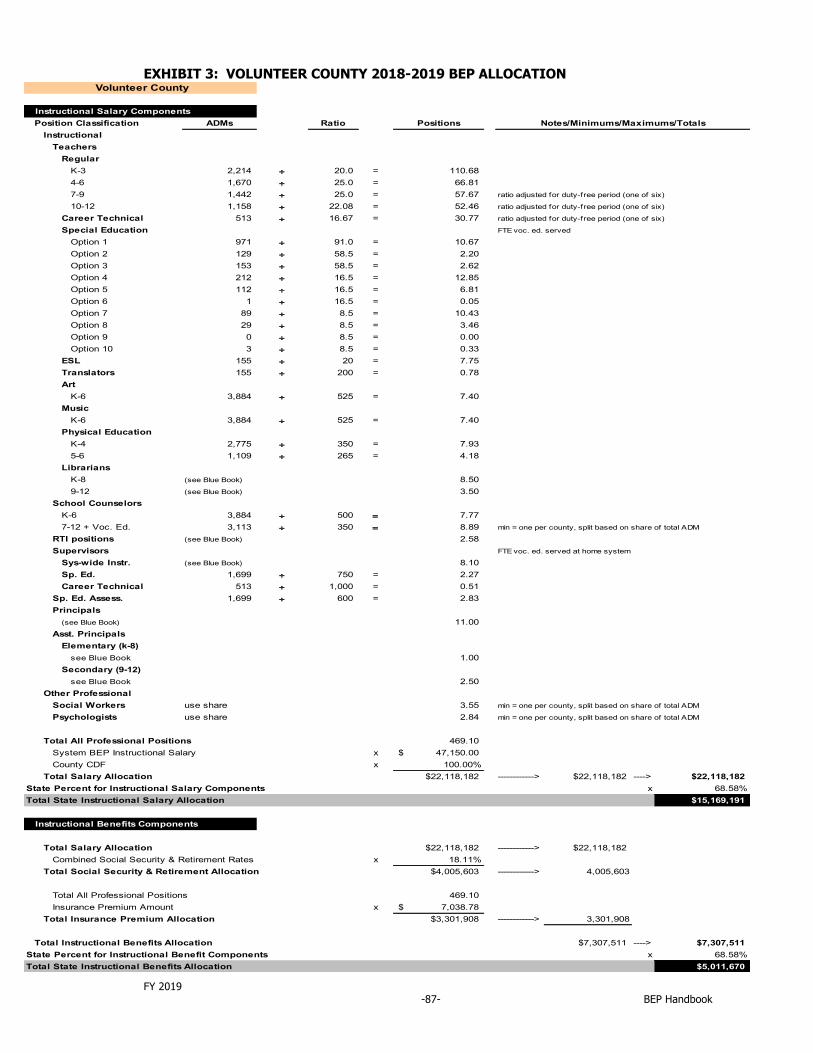
FY 2019 -87- BEP Handbook
EXHIBIT 3: VOLUNTEER COUNTY 2018-2019 BEP ALLOCATION
Volunteer County
Instructional Salary ComponentsPosition Classification ADMs Ratio Positions Notes/Minimums/Maximums/Totals
InstructionalTeachers
RegularK-3 2,214 ÷ 20.0 = 110.684-6 1,670 ÷ 25.0 = 66.817-9 1,442 ÷ 25.0 = 57.67 ratio adjusted for duty-free period (one of six)
10-12 1,158 ÷ 22.08 = 52.46 ratio adjusted for duty-free period (one of six)
Career Technical 513 ÷ 16.67 = 30.77 ratio adjusted for duty-free period (one of six)
Special Education FTE voc. ed. served
Option 1 971 ÷ 91.0 = 10.67Option 2 129 ÷ 58.5 = 2.20Option 3 153 ÷ 58.5 = 2.62Option 4 212 ÷ 16.5 = 12.85Option 5 112 ÷ 16.5 = 6.81Option 6 1 ÷ 16.5 = 0.05Option 7 89 ÷ 8.5 = 10.43Option 8 29 ÷ 8.5 = 3.46Option 9 0 ÷ 8.5 = 0.00Option 10 3 ÷ 8.5 = 0.33
ESL 155 ÷ 20 = 7.75Translators 155 ÷ 200 = 0.78Art
K-6 3,884 ÷ 525 = 7.40Music
K-6 3,884 ÷ 525 = 7.40Physical Education
K-4 2,775 ÷ 350 = 7.935-6 1,109 ÷ 265 = 4.18
LibrariansK-8 (see Blue Book) 8.509-12 (see Blue Book) 3.50
School CounselorsK-6 3,884 ÷ 500 = 7.777-12 + Voc. Ed. 3,113 ÷ 350 = 8.89 min = one per county, split based on share of total ADM
RTI positions (see Blue Book) 2.58Supervisors FTE voc. ed. served at home system
Sys-wide Instr. (see Blue Book) 8.10Sp. Ed. 1,699 ÷ 750 = 2.27Career Technical 513 ÷ 1,000 = 0.51
Sp. Ed. Assess. 1,699 ÷ 600 = 2.83Principals
(see Blue Book) 11.00Asst. Principals
Elementary (k-8)see Blue Book 1.00
Secondary (9-12)see Blue Book 2.50
Other ProfessionalSocial Workers use share 3.55 min = one per county, split based on share of total ADM
Psychologists use share 2.84 min = one per county, split based on share of total ADM
Total All Professional Positions 469.10System BEP Instructional Salary x 47,150.00$ County CDF x 100.00%
Total Salary Allocation $22,118,182 ------------> $22,118,182 ----> $22,118,182State Percent for Instructional Salary Components x 68.58%Total State Instructional Salary Allocation $15,169,191
Instructional Benefits Components
Total Salary Allocation $22,118,182 ------------> $22,118,182Combined Social Security & Retirement Rates x 18.11%
Total Social Security & Retirement Allocation $4,005,603 ------------> 4,005,603
Total All Professional Positions 469.10Insurance Premium Amount x 7,038.78$
Total Insurance Premium Allocation $3,301,908 ------------> 3,301,908
Total Instructional Benefits Allocation $7,307,511 ----> $7,307,511State Percent for Instructional Benefit Components x 68.58%Total State Instructional Benefits Allocation $5,011,670

FY 2019 -88- BEP Handbook
Classroom Components
Nurses 7,102 ÷ 3,000 = 2.37 min = one per systemSalary Allocation 47,150.00
Total Salary Allocation for Nurses $111,618.87 ------------> $111,619
AssistantsInstructional
K-6 3,884 ÷ 75 = 51.79Special Education
Options 5,7,8 230 ÷ 60 = 3.84Library
see Blue Book 4.50
Total All Assistant Positions 60.13Salary Allocation for Assistants x $23,500.00
Total Salary Allocation for Assistants $1,412,990 ------------> 1,412,990
Total Salary Allocation for Nurses and Assistants $1,524,609 <------------ $1,524,609County CDF x 100.00%
Total Salary Allocation for Nurses and Asst. w/CDF $1,524,609 ------------> $1,524,609Combined Social Security & Retirement Rates x 15.40%
Total Social Security & Retirement Allocation $234,790 ------------> 234,790
Total All Non-professional Education Positions 62.49Insurance Premium Amount x $6,569.53
Total Ins. Allocation for Nurses and Assistants $410,560 ------------> 410,560
Total Allocation for Nurses and Assistants $2,169,959 ----> 2,169,959
Other Classroom AllocationsAt Risk
Total Eligibles 2,609 x $885.75 = $2,310,921.75Substitute Teachers
Total ADM 7,102 x $61.75 = $438,544.96Alternative Schools
Total ADM 7,102 x $3.75 = 26,632.297-12 + CTE 3,113 x $33.25 = 103,503.01 FTE voc. ed. at home system
Duty-free LunchTotal ADM 7,102 x $12.25 = 86,998.80
TextbooksTotal ADM 7,102 x $77.50 = 550,400.56
Classroom Materials & Suppliesreg. k-12 + Opt. 7-9 6,589 x $80.75 = 532,076.25Career Technical 513 x $157.75 = 80,888.39 FTE voc. ed. servedSp. Ed. 1,699 x $36.50 = 62,027.05
Instructional Equipmentreg. k-12 + Opt. 7-9 6,589 x $64.25 = 423,354.79Career Technical 513 x $99.75 = 51,148.13 FTE voc. ed. servedSp. Ed. 1,699 x $13.25 = 22,516.67
Classroom-related Travelreg. k-12 + Opt. 7-9 6,589 x $14.50 = 95,543.10Career Technical 513 x $50.50 = 25,894.54 FTE voc. ed. servedSp. Ed. 1,699 x $17.25 = 29,314.15
Exit ExamsAcademic grade 11 466 x $47.15 = 21,983.43Career Technical grade 12 114 x $18.00 = 2,054.36
Career Technical Education Center Transportationsee Work Sheet #1 4,365.72
TechnologyTotal ADM 7,102 x $41.32 = 293,465.20
Total Other Allocations $5,161,633.14 ----------------------------------------> 5,161,633
Total All Classroom Allocations $7,331,592State Percent for Classroom Components x 75.15%Total State Classroom Allocation $5,509,515
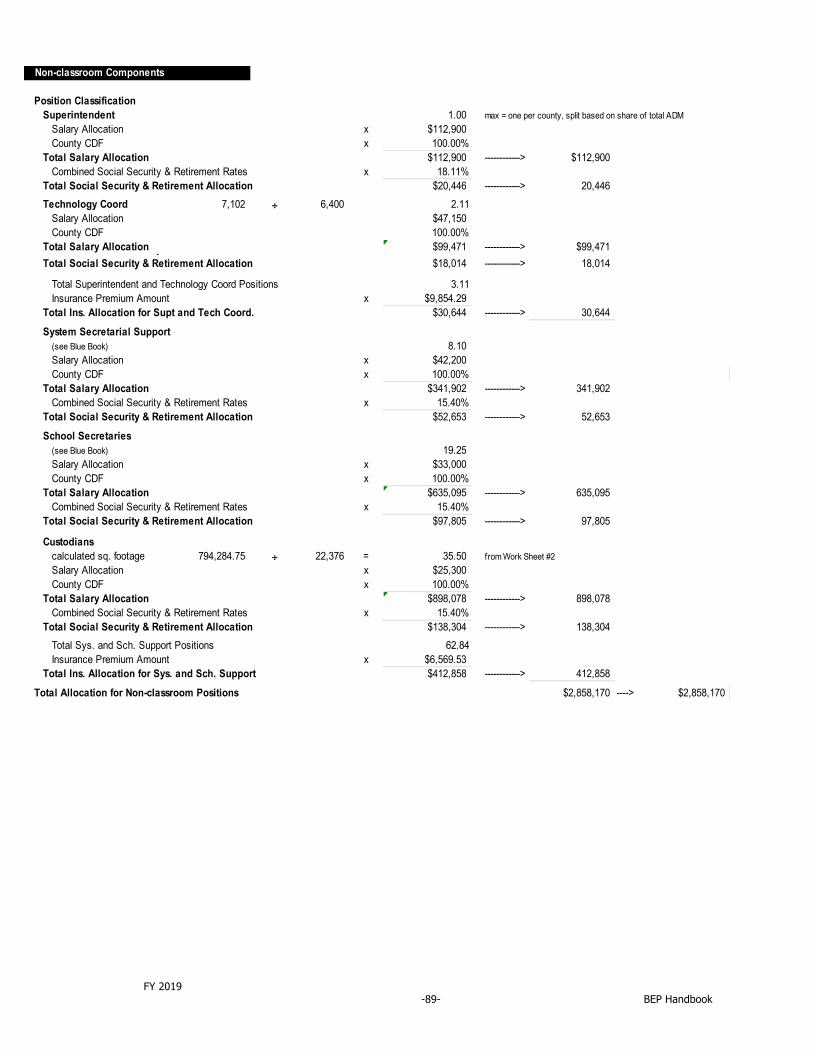
FY 2019 -89- BEP Handbook
Non-classroom Components
Position ClassificationSuperintendent 1.00 max = one per county, split based on share of total ADM
Salary Allocation x $112,900County CDF x 100.00%
Total Salary Allocation $112,900 ------------> $112,900Combined Social Security & Retirement Rates x 18.11%
Total Social Security & Retirement Allocation $20,446 ------------> 20,446Technology Coord 7,102 ÷ 6,400 2.11
Salary Allocation $47,150County CDF 100.00%
Total Salary Allocation $99,471 ------------> $99,471Combined Social Security & Retirement Rates 18.11%Total Social Security & Retirement Allocation $18,014 ------------> 18,014
Total Superintendent and Technology Coord Positions 3.11Insurance Premium Amount x $9,854.29
Total Ins. Allocation for Supt and Tech Coord. $30,644 ------------> 30,644
System Secretarial Support(see Blue Book) 8.10Salary Allocation x $42,200County CDF x 100.00%
Total Salary Allocation $341,902 ------------> 341,902Combined Social Security & Retirement Rates x 15.40%
Total Social Security & Retirement Allocation $52,653 ------------> 52,653
School Secretaries(see Blue Book) 19.25Salary Allocation x $33,000County CDF x 100.00%
Total Salary Allocation $635,095 ------------> 635,095Combined Social Security & Retirement Rates x 15.40%
Total Social Security & Retirement Allocation $97,805 ------------> 97,805
Custodianscalculated sq. footage 794,284.75 ÷ 22,376 = 35.50 from Work Sheet #2Salary Allocation x $25,300County CDF x 100.00%
Total Salary Allocation $898,078 ------------> 898,078Combined Social Security & Retirement Rates x 15.40%
Total Social Security & Retirement Allocation $138,304 ------------> 138,304Total Sys. and Sch. Support Positions 62.84Insurance Premium Amount x $6,569.53
Total Ins. Allocation for Sys. and Sch. Support $412,858 ------------> 412,858
Total Allocation for Non-classroom Positions $2,858,170 ----> $2,858,170
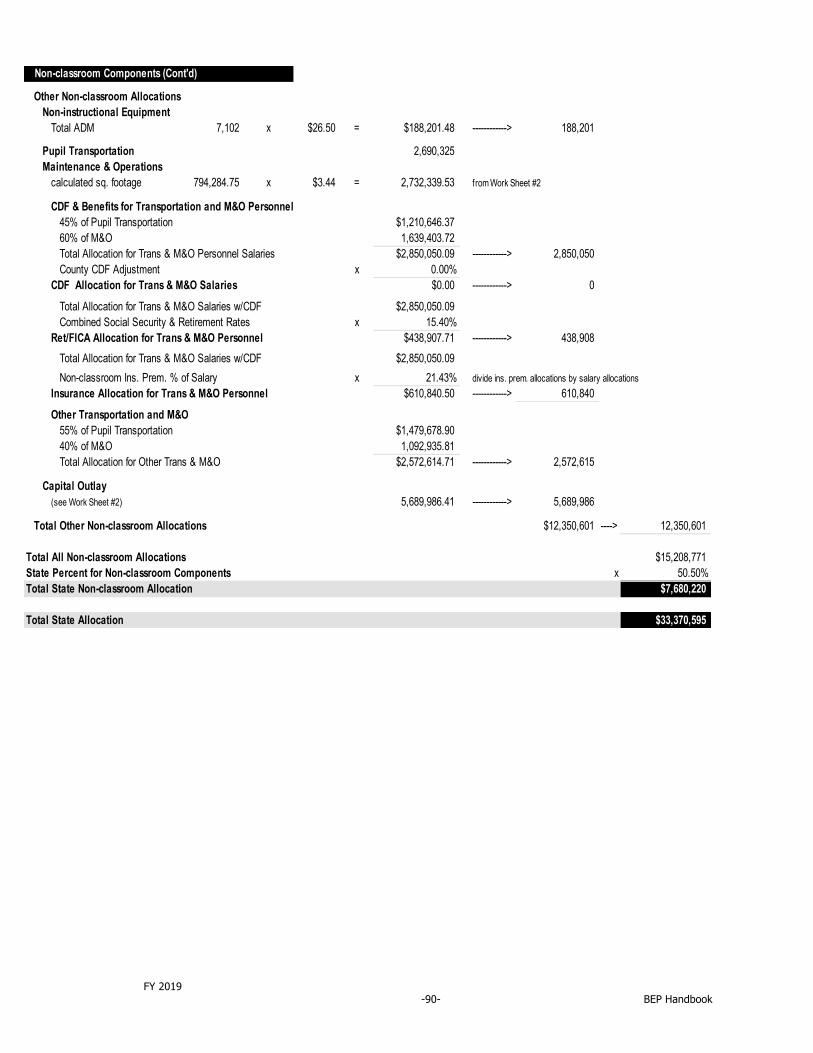
FY 2019 -90- BEP Handbook
Non-classroom Components (Cont'd)
Other Non-classroom AllocationsNon-instructional Equipment
Total ADM 7,102 x $26.50 = $188,201.48 ------------> 188,201
Pupil Transportation 2,690,325Maintenance & Operations
calculated sq. footage 794,284.75 x $3.44 = 2,732,339.53 from Work Sheet #2
CDF & Benefits for Transportation and M&O Personnel45% of Pupil Transportation $1,210,646.3760% of M&O 1,639,403.72Total Allocation for Trans & M&O Personnel Salaries $2,850,050.09 ------------> 2,850,050County CDF Adjustment x 0.00%
CDF Allocation for Trans & M&O Salaries $0.00 ------------> 0
Total Allocation for Trans & M&O Salaries w/CDF $2,850,050.09Combined Social Security & Retirement Rates x 15.40%
Ret/FICA Allocation for Trans & M&O Personnel $438,907.71 ------------> 438,908Total Allocation for Trans & M&O Salaries w/CDF $2,850,050.09Non-classroom Ins. Prem. % of Salary x 21.43% divide ins. prem. allocations by salary allocations
Insurance Allocation for Trans & M&O Personnel $610,840.50 ------------> 610,840
Other Transportation and M&O 55% of Pupil Transportation $1,479,678.9040% of M&O 1,092,935.81Total Allocation for Other Trans & M&O $2,572,614.71 ------------> 2,572,615
Capital Outlay(see Work Sheet #2) 5,689,986.41 ------------> 5,689,986
Total Other Non-classroom Allocations $12,350,601 ----> 12,350,601
Total All Non-classroom Allocations $15,208,771State Percent for Non-classroom Components x 50.50%Total State Non-classroom Allocation $7,680,220
Total State Allocation $33,370,595
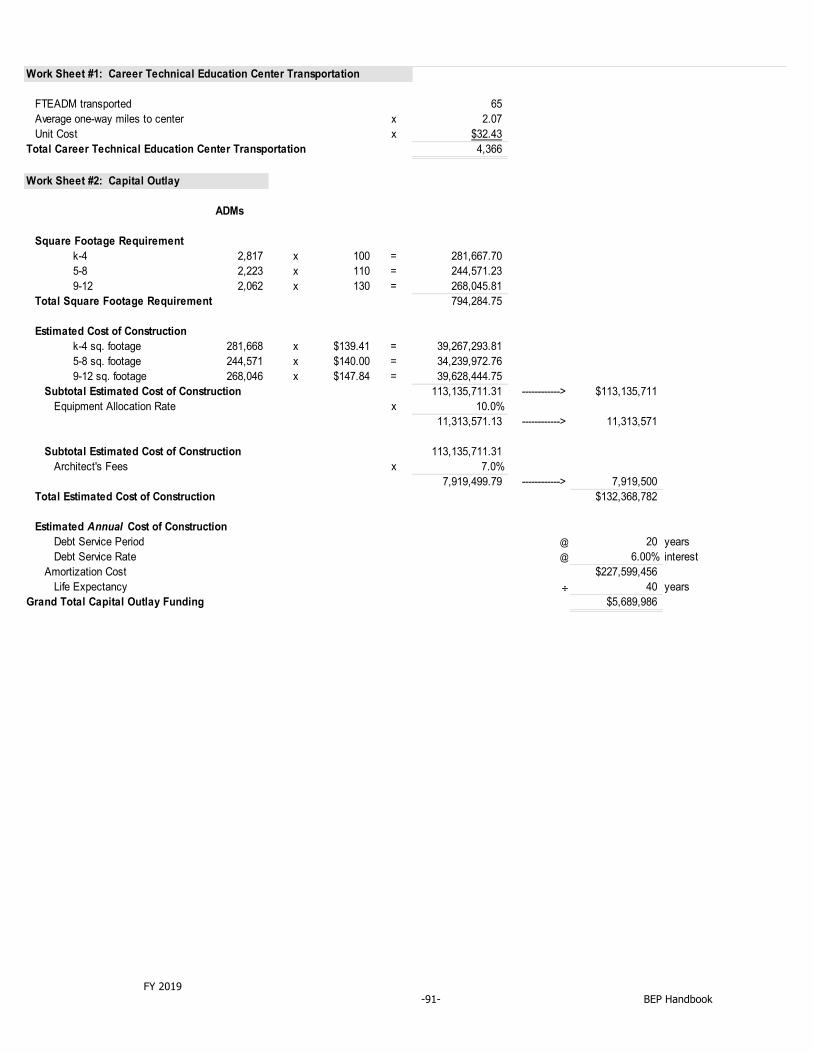
FY 2019 -91- BEP Handbook
Work Sheet #1: Career Technical Education Center Transportation
FTEADM transported 65Average one-way miles to center x 2.07Unit Cost x $32.43
Total Career Technical Education Center Transportation 4,366
Work Sheet #2: Capital Outlay
ADMs
Square Footage Requirementk-4 2,817 x 100 = 281,667.705-8 2,223 x 110 = 244,571.239-12 2,062 x 130 = 268,045.81
Total Square Footage Requirement 794,284.75
Estimated Cost of Constructionk-4 sq. footage 281,668 x $139.41 = 39,267,293.815-8 sq. footage 244,571 x $140.00 = 34,239,972.769-12 sq. footage 268,046 x $147.84 = 39,628,444.75
Subtotal Estimated Cost of Construction 113,135,711.31 ------------> $113,135,711Equipment Allocation Rate x 10.0%
11,313,571.13 ------------> 11,313,571
Subtotal Estimated Cost of Construction 113,135,711.31Architect's Fees x 7.0%
7,919,499.79 ------------> 7,919,500Total Estimated Cost of Construction $132,368,782
Estimated Annual Cost of ConstructionDebt Service Period @ 20 yearsDebt Service Rate @ 6.00% interest
Amortization Cost $227,599,456Life Expectancy ÷ 40 years
Grand Total Capital Outlay Funding $5,689,986
FY 2019 -92- BEP Handbook
APPENDIX I FISCAL CAPACITY MODEL COMPARISON FISCAL CAPACITY The original county-level fiscal capacity model was developed by the Tennessee Advisory Commission on Intergovernmental Relations (TACIR) and adopted by the State Board of Education to fulfill the requirement in the Education Improvement Act to equalize funding for the BEP. The BEP Enhancement Act of 2016 codified the combination of two fiscal indices (TACIR and CBER), with each weighted at 50%. TACIR MODEL The purpose of the TACIR model is to ensure that the burden of funding schools is approximately equal across the state, given different local tax bases and other factors related to the ability to raise funds for education. The TACIR model estimates the per pupil amount that each county area can afford to pay to fund education. The TACIR model is based on six components:
1. Per Pupil Own-Source Revenue – Amount of local money that the school systems in the county report that they spend on education, divided by enrollment (average daily membership).
2. Per Pupil Equalized Property Assessment – Total property assessment for the county area, equalized by the appropriate county appraisal-to-sales ratio, and then divided by ADM. This is a measure of the local ability to raise revenue.
3. Per Pupil Taxable Sales – Local sales tax base divided by ADM-measure of the local ability to raise revenue.
4. Per Capita Income – Per capita income is included in the fiscal capacity model as a proxy measurement for ability to pay for education; and for all other local revenue not accounted for by property or sales taxes.
5. Tax Burden – Ratio of total equalized residential and farm assessment in each county divided by the total equalized property assessment. This variable is intended as a proxy for a county’s potential ability to export taxes. A high residential/farm ratio indicates a low ability to pass taxes on to non-residents.
6. Service Burden – Included as a reflection of spending needs. It equals average daily membership divided by county population. The greater the number of pupils per 100 residents, the greater the fiscal burden for each taxpayer.
The TACIR model uses multiple regression analysis to determine the fiscal capacity index. The model is based on a set of averages. The analysis takes one factor at a time and compares it for all counties. From this process, an average weight is calculated for each factor. The average weight is multiplied by the value of each factor for each county and summed. This produces a per pupil fiscal capacity amount. The State Board and Department of Education use a percent of total measure of fiscal capacity rather than a per pupil measure. Once TACIR determines per pupil capacity for each county, this value is multiplied by average daily membership. This produces a county-wide measure of total fiscal capacity. The values of the 95 counties are summed, and each county is expressed as a proportion of the total. The fiscal capacity index for each county is this proportion. The TACIR indices for each county are calculated annually by TACIR and reported to the State Department of Education in March each year.
FY 2019 -93- BEP Handbook
CBER Model The UT Center for Business and Economic Research (CBER) model was developed for BEP 2.0 in order to simplify the fiscal capacity methodology. The CBER model is intended to be less complex and more transparent than the TACIR model and to provide a reasonable relative measure of the fiscal capacity of counties. Property taxes and sales taxes are the only two variables used in the CBER model. The CBER model applies uniform tax rates to a standard set of tax bases. Fiscal capacity is calculated by multiplying each county’s sales tax and property tax base times the average tax rate for each tax base across the state. The tax rates are calculated as the average use of each base by local governments for education. The most recent average tax rates used for the FY 19 BEP are 1.1337% for property tax and 1.6360% for sales tax. The CBER fiscal capacity indices for each county are calculated annually by CBER and reported to the State Department of Education by May of each year. FORMULA: (Equalized Assessed Property plus IDBs (3 year average) Multiplied by Average State Property Tax Rate for Education) Plus (Sales Tax Base (3 year average) Multiplied by Average State Sales Tax Rate for Education) Divided by State Total Volunteer County Equalized Assessed Property plus IDBs (3 year average) $19,130,924,199 Sales Tax Base (3 year average) $10,702,878,267 = ($19,130,924,199 x 1.1337%) + ($10,702,878,267 x 1.6360%) = $231,887,288 + $175,099,088 = $406,986,376 = $406,986,376 / $3,324,467,393 (state total) = 12.24% (CBER Fiscal Capacity Index)