telangana state pollution control board upgradation of ...tspcb.cgg.gov.in/cbipmp/consultancy...
TRANSCRIPT
Telangana State Pollution Control
Board
Upgradation of Sewage Treatment
Plant and related activities at Noor
Mohammed Kunta site, Hyderabad,
Telangana
Drainage and water quality

Telangana State Pollution Control
Board
Upgradation of Sewage Treatment
Plant and related activities at Noor
Mohammed Kunta site, Hyderabad,
Telangana
Drainage and water quality
Witteveen+Bos
Van Twickelostraat 2
P.O. Box 233
7400 AE Deventer
The Netherlands
+31 570 69 79 11
www.witteveenbos.com
reference project code status
IND50-2/16-012.096 IND50-2 Final version 03
project manager project director date
P.G.B. Hermans MSc J.F. Kramer MSc 8 July 2016
authorisation name initials
Approved P.G.B. Hermans MSc
The Quality management system of Witteveen+Bos has been approved based on ISO 9001.
© Witteveen+Bos
No part of this document may be reproduced and/or published in any form, without prior written permission of Witteveen+Bos Consulting engineers, nor may it be used for any work other than that for which it was manufactured without such permission, unless otherwise agreed in writing. Witteveen+Bos Consulting engineers does not accept liability for any damage arising out of or related to changing the content of the document provided by Witteveen+Bos Consulting engineers.

INDEX p.
1. INTRODUCTION 1 1.1. Background 1 1.2. Project goal 1
2. EXISTING SITUATION 3 2.1. Land use and local industries 3 2.2. (Geo) hydrological description 5
3. HYDROLOGICAL MODEL 11 3.1. General 11 3.2. Model set-up 11 3.3. Assessment of peak-flow 16
3.3.1. Pre-monsoon season 16 3.3.2. Monsoon season 18
3.4. Assessment of waste water volume quantification 21
4. ECOLOGICAL ASSESSMENT 23 4.1. Approach to ecological assessment 23 4.2. Assessment of existing situation 26 4.3. Nutrient balances 27
4.3.1. Existing situation (reference) 27 4.3.2. Scenario 1: Restoration of STP infrastructure 30 4.3.3. Scenario 2: Proposed remediation without restoration of STP
infrastructure 33 4.3.4. Scenario 3: Proposed remediation with restoration of STP
infrastructure 36 4.3.5. Scenario 4: Upgrade of STP with proposed remediation 38
4.4. Conclusions on the nutrient balances 41 4.5. Ecological norm versus water quality standards 44
5. GAP ANALYSIS 47 5.1. Weaknesses 47 5.2. Recommendations 49
6. REFERENCES 51
last page 51
APPENDICES number of p.
I Pictures of the catchment area 16
II Industrial activities in the Kattedan Industrial Area 43
III The used catchments, their size, and the flow points 1
IV Field measurements 4
V General standard for discharge of effluents 8
VI Water quality assessment - analysis results 20

Witteveen+Bos, IND50-2/16-012.096 Final version 03 dated 8 July 2016, Upgradation of Sewage Treatment Plant and related activities at Noor Mohammed Kunta site, Hyderabad, Telangana Drainage and water quality
1
1. INTRODUCTION
1.1. Background
The Government of India, through the Ministry of Environment, Forest and Climate Change
(MoEF & CC), is implementing a project on Capacity Building and Industrial Pollution
Management, with financial assistance from the World Bank. Under this project Lake Noor
Muhammed Kunta (NMK) has been chosen for remediation because it plays an important
role for the hydrology of the area.
Lake NMK has a long history of discharge of residential and industrial wastes from the
industrial areas in the catchment of the lake. The historical waste discharges have resulted
in accumulation of pollutants in surface waters, soils and sediments throughout the
catchment area. In an effort to reduce the loading of nutrients and pollutants to the lake, an
STP has been constructed that has been in operation since 2009. The STP treats part of
the wastewater generated in the catchment area. Treated water is released into Lake NMK.
The ultimate goal of the efforts of the Telangana State Pollution Control Board (TSPCB) is
to successfully remediate Lake NMK. To achieve this goal the project should identify and
elaborate on the most effective method to minimise the loading of nutrients and pollutants
to the lake.
1.2. Project goal
To enable design of effective remediation measures Witteveen+Bos has included a
systems analysis in its offer to the client. This systems analysis provides guidance for
optimisation of the project execution. The following questions will be key to this
optimisation:
- What is the maximum nutrient loading that lake NMK can deal with (carrying capacity)
in the current situation?
- What will be the effect of the already proposed measures (dredging and sand spraying)
on the nutrient loading to the lake?
- Can the nutrient loading to the lake be limited to this maximum using water treatment
techniques?
If so, which technique is most suitable and effective?
If not, which water treatment technique can best be applied to limit the nutrient
loading as much as possible?
To answer the first two questions an assessment of the carrying capacity of Lake NMK in
both the existing and future situation will be made. To answer the third question an
assessment of effect of various possible water treatment measures is made. Based on the
system analysis the impact of various measures on the water quality in the lake is predicted
taking into regard the functioning of the water system throughout the year. If remediation is
feasible by upgrading the STP facilities, a maximum allowable discharge standard for the
STP will be given.

Witteveen+Bos, IND50-2/16-012.096 Final version 03 dated 8 July 2016, Upgradation of Sewage Treatment Plant and related activities at Noor Mohammed Kunta site, Hyderabad, Telangana Drainage and water quality
2
Witteveen+Bos, IND50-2/16-012.096 Final version 03 dated 8 July 2016, Upgradation of Sewage Treatment Plant and related activities at Noor Mohammed Kunta site, Hyderabad, Telangana Drainage and water quality
3
2. EXISTING SITUATION
In this chapter general information about the site is described. The information is obtained by a preliminary desk study and site-visits. In appendix I a photo report of the area is shown.
2.1. Land use and local industries
Noor Mohammed Kunta (NMK) is a lake near the city Hyderabad in India. It has a
catchment area of about 190 hectares (see appendix III) and receives wastewater
discharges and storm water runoff from industrial and residential areas. The discharges
from the lake flow to another lake downstream.
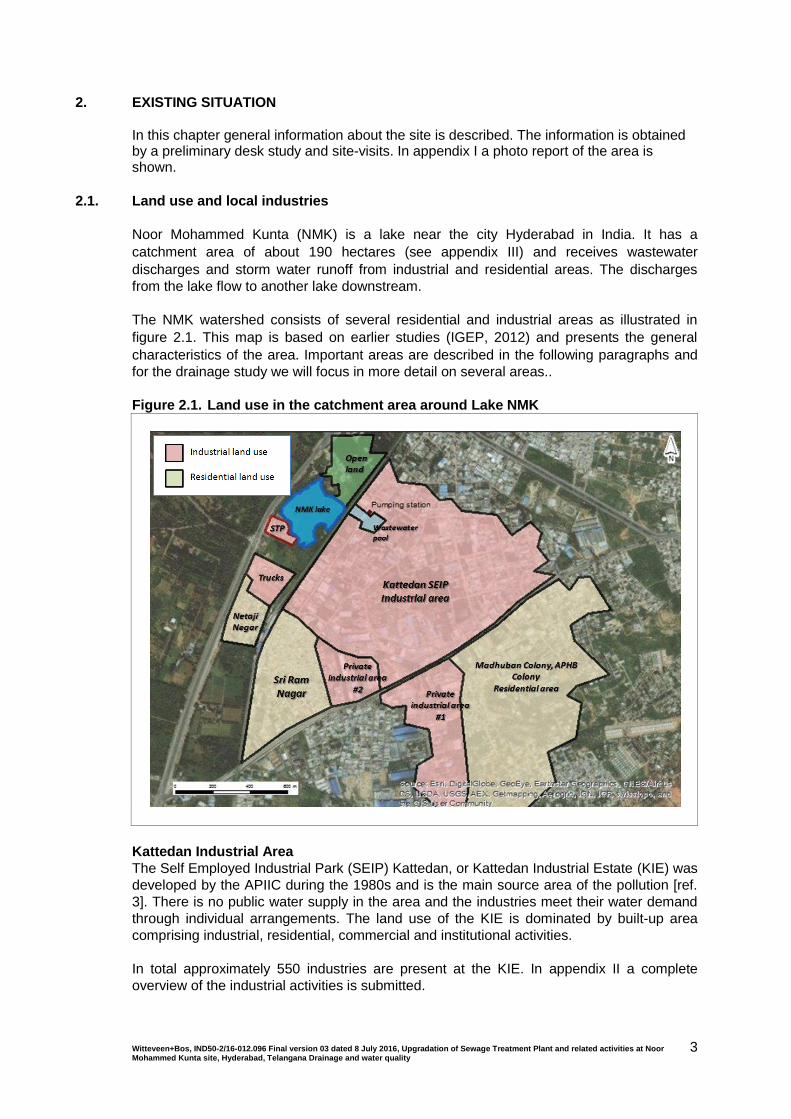
The NMK watershed consists of several residential and industrial areas as illustrated in
figure 2.1. This map is based on earlier studies (IGEP, 2012) and presents the general
characteristics of the area. Important areas are described in the following paragraphs and
for the drainage study we will focus in more detail on several areas..
Figure 2.1. Land use in the catchment area around Lake NMK
Kattedan Industrial Area
The Self Employed Industrial Park (SEIP) Kattedan, or Kattedan Industrial Estate (KIE) was
developed by the APIIC during the 1980s and is the main source area of the pollution [ref.
3]. There is no public water supply in the area and the industries meet their water demand
through individual arrangements. The land use of the KIE is dominated by built-up area
comprising industrial, residential, commercial and institutional activities.
In total approximately 550 industries are present at the KIE. In appendix II a complete
overview of the industrial activities is submitted.
Witteveen+Bos, IND50-2/16-012.096 Final version 03 dated 8 July 2016, Upgradation of Sewage Treatment Plant and related activities at Noor Mohammed Kunta site, Hyderabad, Telangana Drainage and water quality
4
At the KIE most of the industries are in small-midscale sector and are indicated as ‘green’
industry. Most of the industries at the KIE release their effluent into nearby ditches, drains
and streams and the solid waste is randomly dumped on open land along roads and lakes.
The industrial effluents contain appreciable amounts of inorganic and organic chemicals as
their by-products.
Sewage treatment plant (STP)
The domestic waste water at the residential areas in the surroundings passes by a pipeline
to the sewage treatment plant located next to the lake NMK. The secondary level treatment
plant has a capacity of 4 MLD, is operated by HMDA. At the moment the STP serves only
RAM residential area and a small part of the Industrial area KIE (total 20 ha) as per figure
2.1 (total area is about 230 hectares). The STP consists of an influent buffer, 2 parallel
aeration tanks, and biological treatment of the sludge, a sludge separator and an effluent
buffer. At present the STP is operated with a capacity of 1-2 MLD. The treated water is
discharged into the lake.
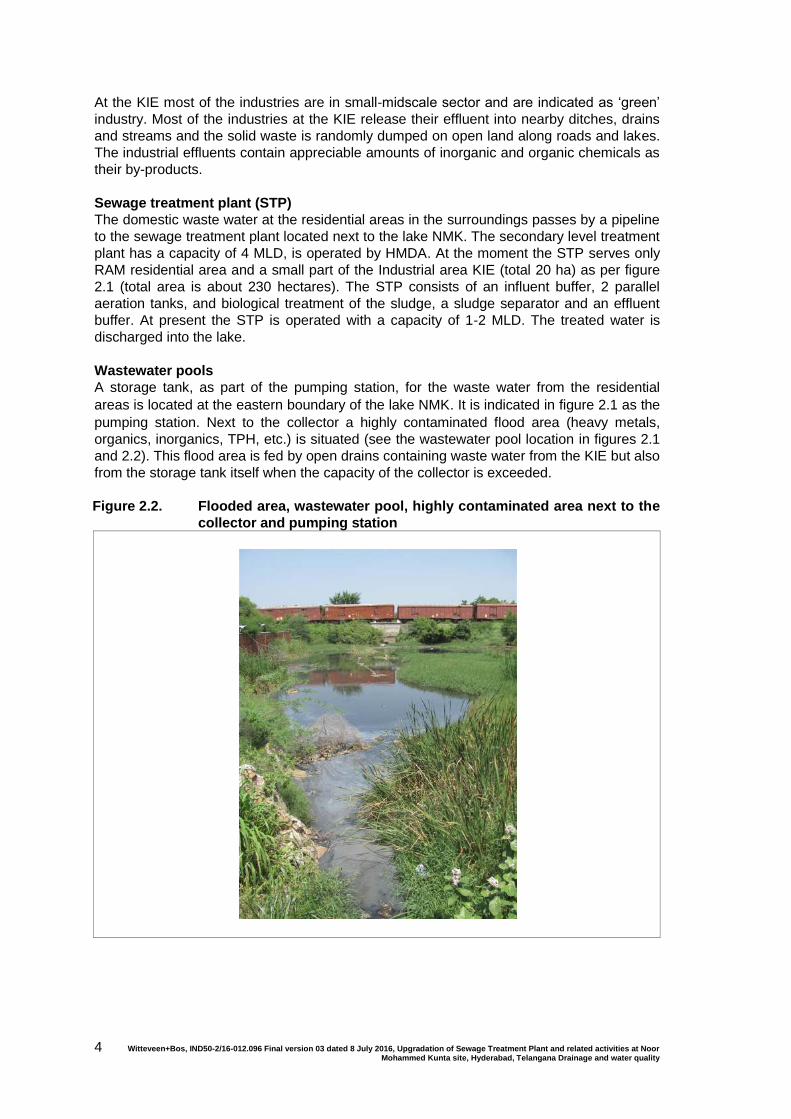
Wastewater pools
A storage tank, as part of the pumping station, for the waste water from the residential
areas is located at the eastern boundary of the lake NMK. It is indicated in figure 2.1 as the
pumping station. Next to the collector a highly contaminated flood area (heavy metals,
organics, inorganics, TPH, etc.) is situated (see the wastewater pool location in figures 2.1
and 2.2). This flood area is fed by open drains containing waste water from the KIE but also
from the storage tank itself when the capacity of the collector is exceeded.
Figure 2.2. Flooded area, wastewater pool, highly contaminated area next to the
collector and pumping station
Witteveen+Bos, IND50-2/16-012.096 Final version 03 dated 8 July 2016, Upgradation of Sewage Treatment Plant and related activities at Noor Mohammed Kunta site, Hyderabad, Telangana Drainage and water quality
5
2.2. (Geo) hydrological description
The Noor Mohammed Kunta Lake area is gently sloping towards the north with the
industrial area located in the highest elevated areas to the south. The general flow direction
of the catchment is towards the northwest.
Groundwater
The groundwater occurs under phreatic conditions in the shallow weathered zone and
under semi confined to confined conditions in the fractured and sheared zones at deeper
levels. In general the weathered zone thickness is limited to 10-15 m thickness. The
groundwater level, measured at several locations, has an average level of approximately 8-
10 m-bgl. Groundwater level contours show a predominant groundwater direction towards
the Mir Alam Tank (north east, see figure 2.3), but it has to be mentioned that groundwater
levels and groundwater direction are influenced by local pumping conditions.
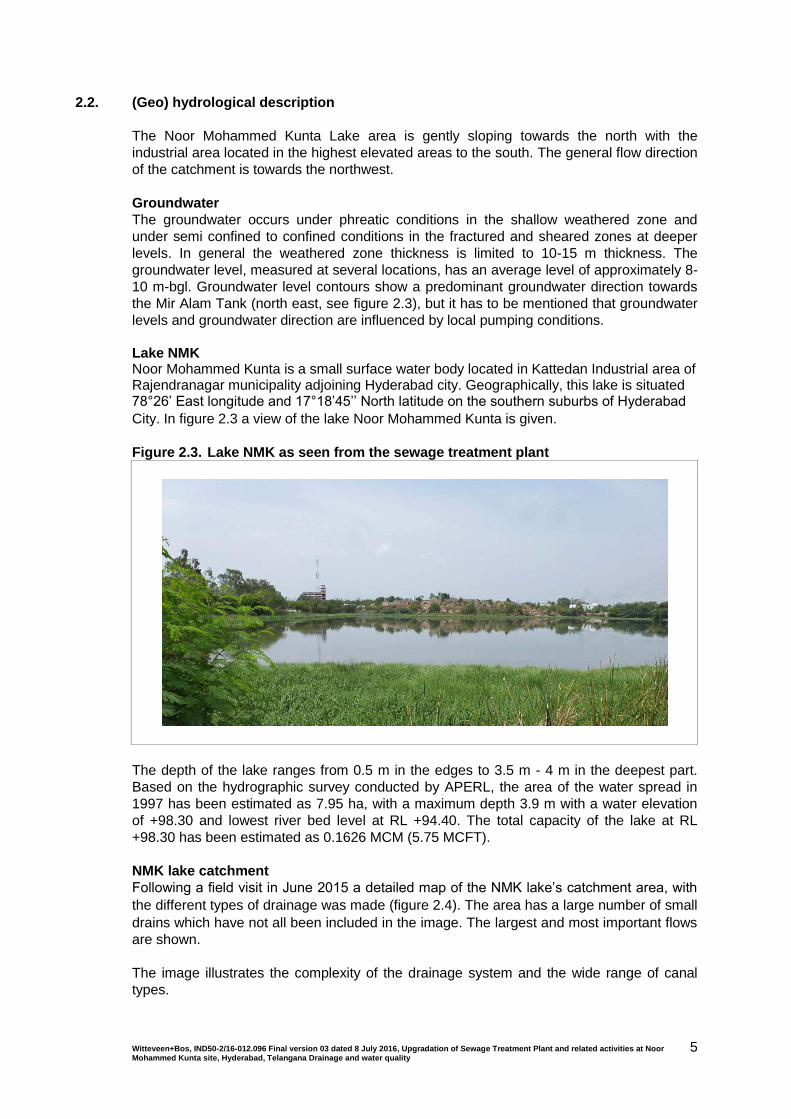
Lake NMK Noor Mohammed Kunta is a small surface water body located in Kattedan Industrial area of Rajendranagar municipality adjoining Hyderabad city. Geographically, this lake is situated 78°26’ East longitude and 17°18’45’’ North latitude on the southern suburbs of Hyderabad
City. In figure 2.3 a view of the lake Noor Mohammed Kunta is given.
Figure 2.3. Lake NMK as seen from the sewage treatment plant
The depth of the lake ranges from 0.5 m in the edges to 3.5 m - 4 m in the deepest part.
Based on the hydrographic survey conducted by APERL, the area of the water spread in
1997 has been estimated as 7.95 ha, with a maximum depth 3.9 m with a water elevation
of +98.30 and lowest river bed level at RL +94.40. The total capacity of the lake at RL
+98.30 has been estimated as 0.1626 MCM (5.75 MCFT).
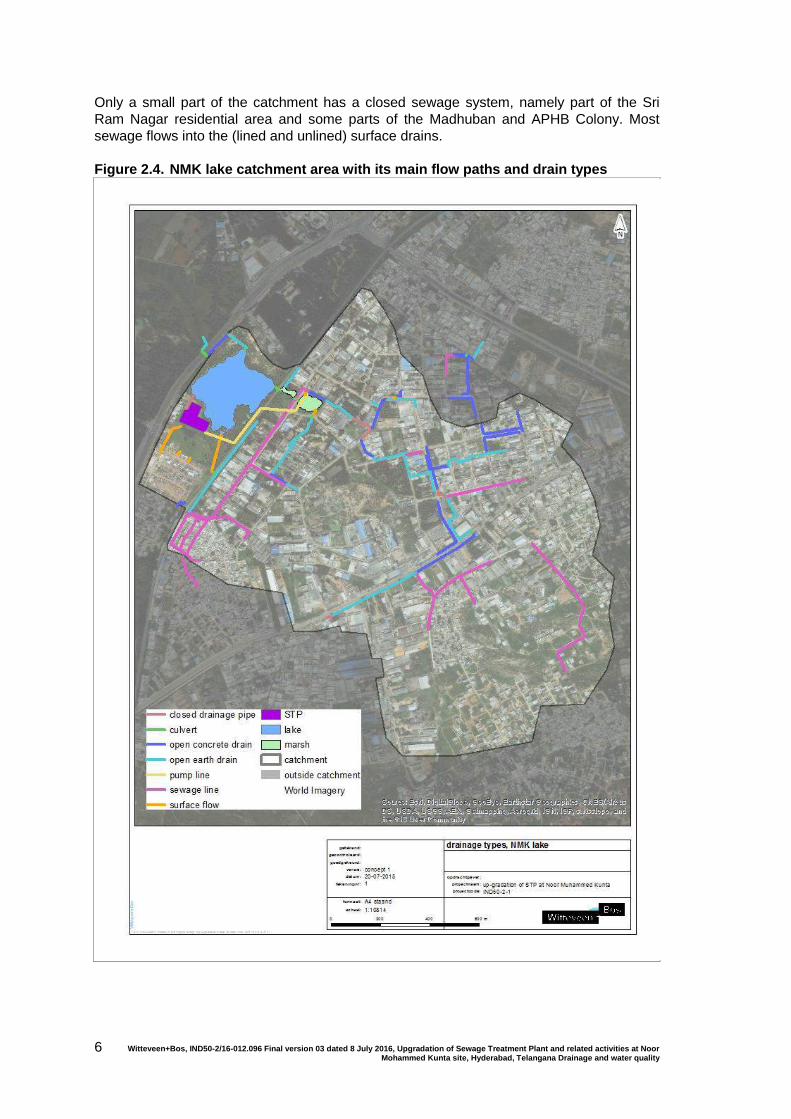
NMK lake catchment
Following a field visit in June 2015 a detailed map of the NMK lake’s catchment area, with
the different types of drainage was made (figure 2.4). The area has a large number of small
drains which have not all been included in the image. The largest and most important flows
are shown.
The image illustrates the complexity of the drainage system and the wide range of canal
types.
Witteveen+Bos, IND50-2/16-012.096 Final version 03 dated 8 July 2016, Upgradation of Sewage Treatment Plant and related activities at Noor Mohammed Kunta site, Hyderabad, Telangana Drainage and water quality
6
Only a small part of the catchment has a closed sewage system, namely part of the Sri
Ram Nagar residential area and some parts of the Madhuban and APHB Colony. Most
sewage flows into the (lined and unlined) surface drains.
Figure 2.4. NMK lake catchment area with its main flow paths and drain types
Witteveen+Bos, IND50-2/16-012.096 Final version 03 dated 8 July 2016, Upgradation of Sewage Treatment Plant and related activities at Noor Mohammed Kunta site, Hyderabad, Telangana Drainage and water quality
7
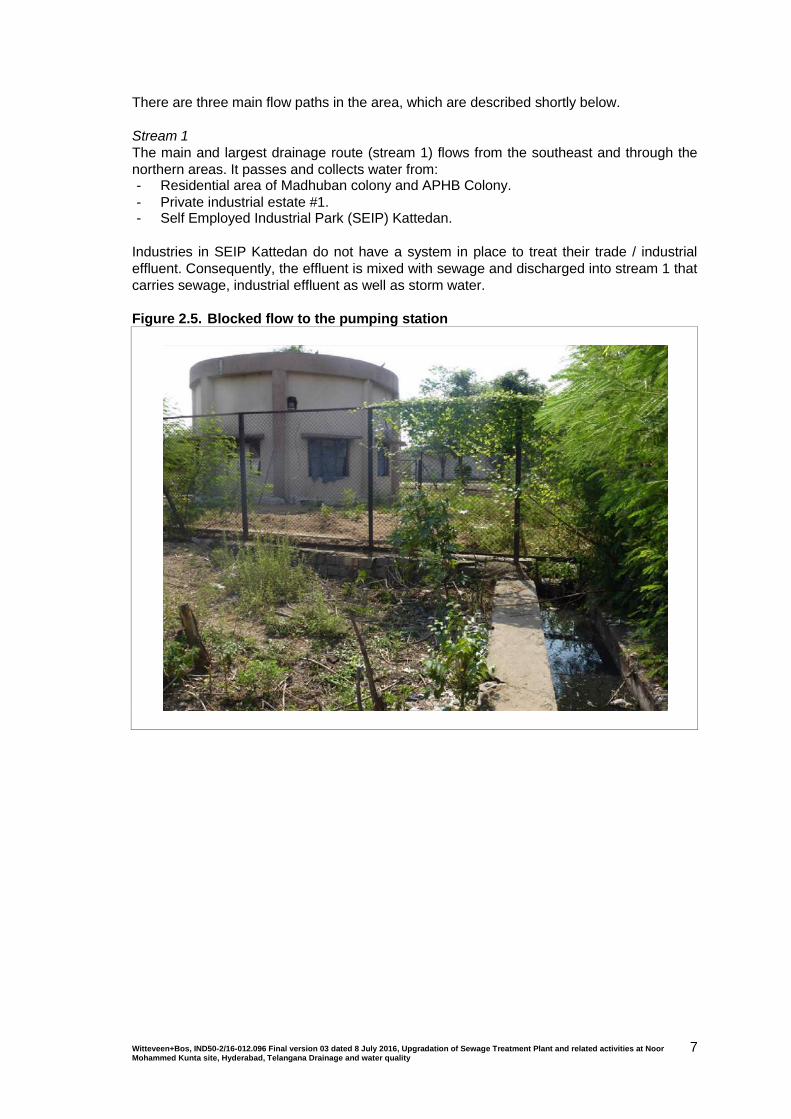
There are three main flow paths in the area, which are described shortly below.
Stream 1
The main and largest drainage route (stream 1) flows from the southeast and through the
northern areas. It passes and collects water from: - Residential area of Madhuban colony and APHB Colony.
- Private industrial estate #1. - Self Employed Industrial Park (SEIP) Kattedan.
Industries in SEIP Kattedan do not have a system in place to treat their trade / industrial
effluent. Consequently, the effluent is mixed with sewage and discharged into stream 1 that
carries sewage, industrial effluent as well as storm water.
Figure 2.5. Blocked flow to the pumping station
Witteveen+Bos, IND50-2/16-012.096 Final version 03 dated 8 July 2016, Upgradation of Sewage Treatment Plant and related activities at Noor Mohammed Kunta site, Hyderabad, Telangana Drainage and water quality
8
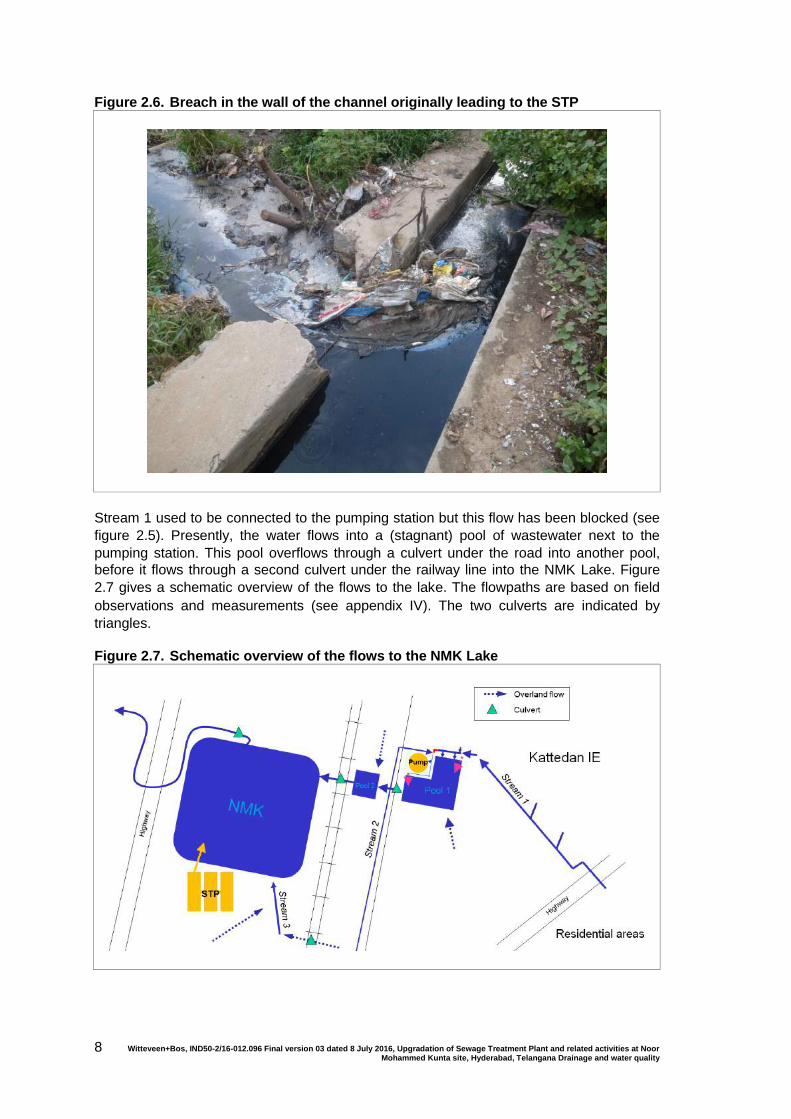
Figure 2.6. Breach in the wall of the channel originally leading to the STP
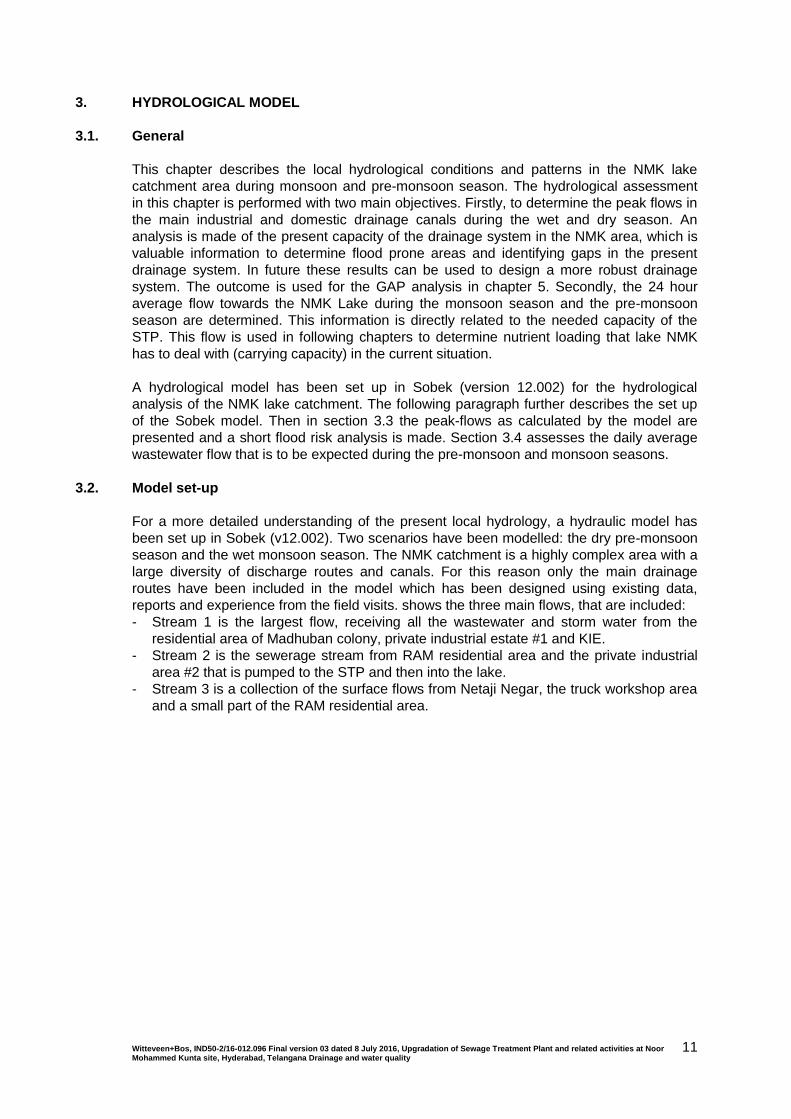
Stream 1 used to be connected to the pumping station but this flow has been blocked (see
figure 2.5). Presently, the water flows into a (stagnant) pool of wastewater next to the
pumping station. This pool overflows through a culvert under the road into another pool,
before it flows through a second culvert under the railway line into the NMK Lake. Figure
2.7 gives a schematic overview of the flows to the lake. The flowpaths are based on field
observations and measurements (see appendix IV). The two culverts are indicated by
triangles.
Figure 2.7. Schematic overview of the flows to the NMK Lake

Witteveen+Bos, IND50-2/16-012.096 Final version 03 dated 8 July 2016, Upgradation of Sewage Treatment Plant and related activities at Noor Mohammed Kunta site, Hyderabad, Telangana Drainage and water quality
9
Stream 2
The second large water flow (stream 2), located to the south of the lake, and comes
through sewage lines from the RAM residential area and the private industrial area #2. This
water flows through sewage pipes to the pumping station and is pumped to the sewage
treatment plant (STP). During heavy rainstorms the pumping station cannot cope with the
large water flows and the excess water is directed into the wastewater pool.
The surface flow around the sewerage line itself flows straight into the lake. This water
flows through an open earth drain underneath the railway tracks and over the surface
(joining with steam 3) to the lake.
Stream 3
Stream 3 is actually a collection of surface flows, with waste and storm water from the area
around stream 2, Netaji Negar and the truck workshop area. This water flows directly into
the lake.

Witteveen+Bos, IND50-2/16-012.096 Final version 03 dated 8 July 2016, Upgradation of Sewage Treatment Plant and related activities at Noor Mohammed Kunta site, Hyderabad, Telangana Drainage and water quality
10
Witteveen+Bos, IND50-2/16-012.096 Final version 03 dated 8 July 2016, Upgradation of Sewage Treatment Plant and related activities at Noor Mohammed Kunta site, Hyderabad, Telangana Drainage and water quality
11
3. HYDROLOGICAL MODEL
3.1. General
This chapter describes the local hydrological conditions and patterns in the NMK lake
catchment area during monsoon and pre-monsoon season. The hydrological assessment
in this chapter is performed with two main objectives. Firstly, to determine the peak flows in
the main industrial and domestic drainage canals during the wet and dry season. An
analysis is made of the present capacity of the drainage system in the NMK area, which is
valuable information to determine flood prone areas and identifying gaps in the present
drainage system. In future these results can be used to design a more robust drainage
system. The outcome is used for the GAP analysis in chapter 5. Secondly, the 24 hour
average flow towards the NMK Lake during the monsoon season and the pre-monsoon
season are determined. This information is directly related to the needed capacity of the
STP. This flow is used in following chapters to determine nutrient loading that lake NMK
has to deal with (carrying capacity) in the current situation.
A hydrological model has been set up in Sobek (version 12.002) for the hydrological
analysis of the NMK lake catchment. The following paragraph further describes the set up
of the Sobek model. Then in section 3.3 the peak-flows as calculated by the model are
presented and a short flood risk analysis is made. Section 3.4 assesses the daily average
wastewater flow that is to be expected during the pre-monsoon and monsoon seasons.
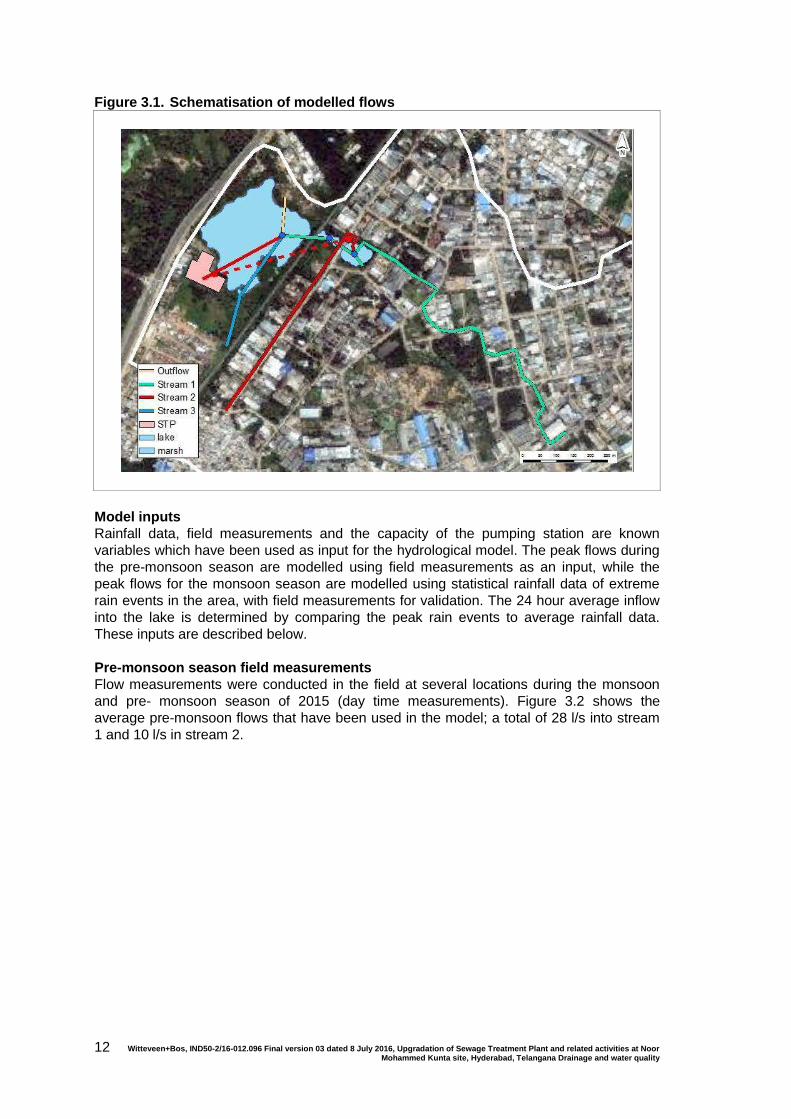
3.2. Model set-up
For a more detailed understanding of the present local hydrology, a hydraulic model has
been set up in Sobek (v12.002). Two scenarios have been modelled: the dry pre-monsoon
season and the wet monsoon season. The NMK catchment is a highly complex area with a
large diversity of discharge routes and canals. For this reason only the main drainage
routes have been included in the model which has been designed using existing data,
reports and experience from the field visits. shows the three main flows, that are included:
- Stream 1 is the largest flow, receiving all the wastewater and storm water from the
residential area of Madhuban colony, private industrial estate #1 and KIE.
- Stream 2 is the sewerage stream from RAM residential area and the private industrial
area #2 that is pumped to the STP and then into the lake.
- Stream 3 is a collection of the surface flows from Netaji Negar, the truck workshop area
and a small part of the RAM residential area.
Witteveen+Bos, IND50-2/16-012.096 Final version 03 dated 8 July 2016, Upgradation of Sewage Treatment Plant and related activities at Noor Mohammed Kunta site, Hyderabad, Telangana Drainage and water quality
12
Figure 3.1. Schematisation of modelled flows
Model inputs
Rainfall data, field measurements and the capacity of the pumping station are known
variables which have been used as input for the hydrological model. The peak flows during
the pre-monsoon season are modelled using field measurements as an input, while the
peak flows for the monsoon season are modelled using statistical rainfall data of extreme
rain events in the area, with field measurements for validation. The 24 hour average inflow
into the lake is determined by comparing the peak rain events to average rainfall data.
These inputs are described below.
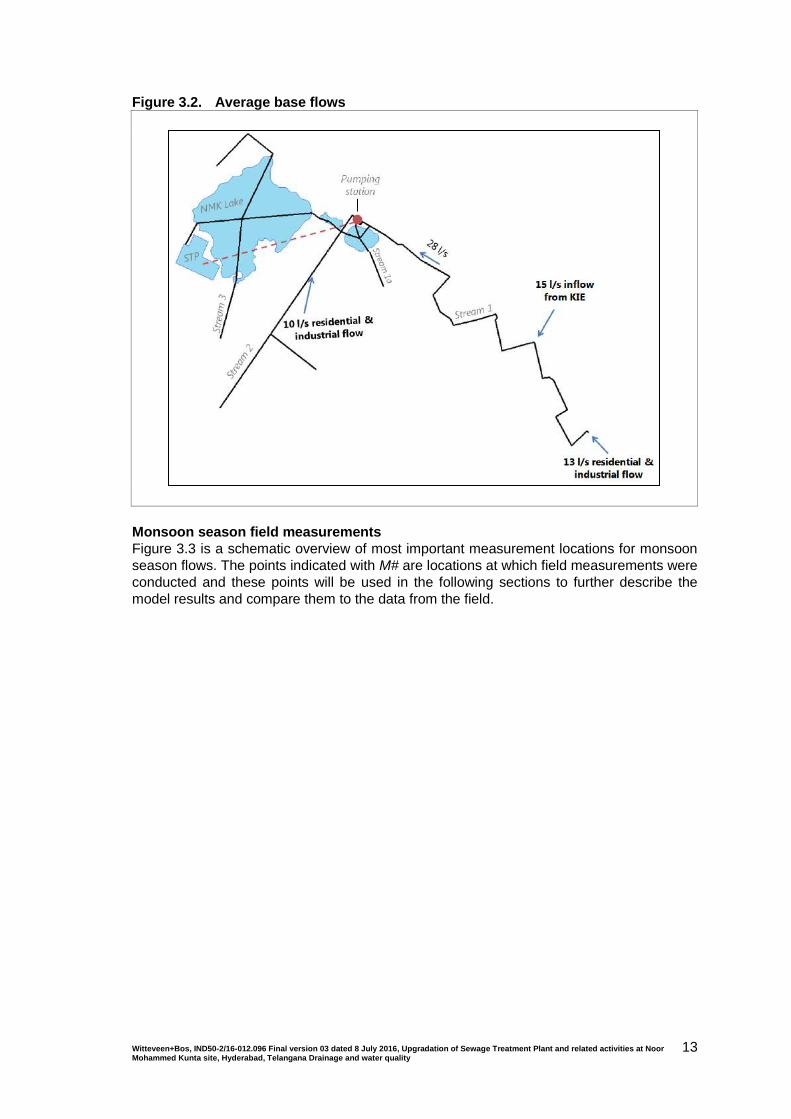
Pre-monsoon season field measurements
Flow measurements were conducted in the field at several locations during the monsoon
and pre- monsoon season of 2015 (day time measurements). Figure 3.2 shows the
average pre-monsoon flows that have been used in the model; a total of 28 l/s into stream
1 and 10 l/s in stream 2.
Witteveen+Bos, IND50-2/16-012.096 Final version 03 dated 8 July 2016, Upgradation of Sewage Treatment Plant and related activities at Noor Mohammed Kunta site, Hyderabad, Telangana Drainage and water quality
13
Figure 3.2. Average base flows
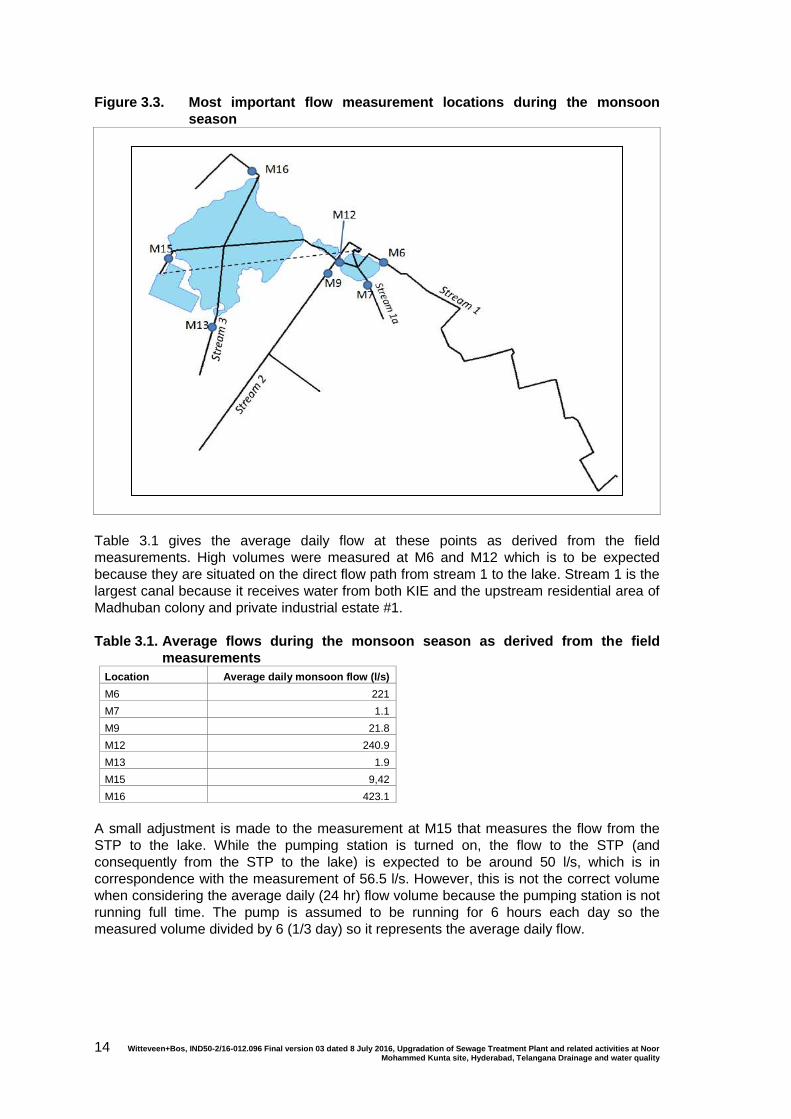
Monsoon season field measurements
Figure 3.3 is a schematic overview of most important measurement locations for monsoon
season flows. The points indicated with M# are locations at which field measurements were
conducted and these points will be used in the following sections to further describe the
model results and compare them to the data from the field.
Witteveen+Bos, IND50-2/16-012.096 Final version 03 dated 8 July 2016, Upgradation of Sewage Treatment Plant and related activities at Noor Mohammed Kunta site, Hyderabad, Telangana Drainage and water quality
14
Figure 3.3. Most important flow measurement locations during the monsoon
season
Table 3.1 gives the average daily flow at these points as derived from the field
measurements. High volumes were measured at M6 and M12 which is to be expected
because they are situated on the direct flow path from stream 1 to the lake. Stream 1 is the
largest canal because it receives water from both KIE and the upstream residential area of
Madhuban colony and private industrial estate #1.
Table 3.1. Average flows during the monsoon season as derived from the field
measurements
Location Average daily monsoon flow (l/s)
M6 221
M7 1.1
M9 21.8
M12 240.9
M13 1.9
M15 9,42
M16 423.1
A small adjustment is made to the measurement at M15 that measures the flow from the
STP to the lake. While the pumping station is turned on, the flow to the STP (and
consequently from the STP to the lake) is expected to be around 50 l/s, which is in
correspondence with the measurement of 56.5 l/s. However, this is not the correct volume
when considering the average daily (24 hr) flow volume because the pumping station is not
running full time. The pump is assumed to be running for 6 hours each day so the
measured volume divided by 6 (1/3 day) so it represents the average daily flow.
Witteveen+Bos, IND50-2/16-012.096 Final version 03 dated 8 July 2016, Upgradation of Sewage Treatment Plant and related activities at Noor Mohammed Kunta site, Hyderabad, Telangana Drainage and water quality
15
Pump discharge
The pumping station, just east of the lake, has five pumps which were installed to pump
sewage water from stream 1 and stream 2 to the STP. In reality only one of these pumps
functions at a time, with a capacity of approximately 170 m3/ hour.
Pumping Station has a holding capacity of 0.5 MLD. Pumping to STP is done in 3 batches
per day.
Statistical rainfall data of extreme events
For the extreme rainfall events, rainfall depths with a return period of 1 year and 5 years
were used, see table 3.2. The 1 and 2 hour duration of the events is based on the system
time of concentration, which is the expected time it takes for a drop of water to flow from
the top of the system to the bottom. The estimated time of concentration of 1 to 2 hours
was underpinned by the experience of locals.
The amount of rainfall was derived from [ref. 1] and divided equally into timeslots of 15
minutes.
Table 3.2. Cumulative rainfall depth during extreme rainfall events (in mm)
Time (minutes)
Return period and event length
1 year, 1 hour event 5 years, 1 hour event 1 year, 2 hour event 5 years, 2 hour event
15 5.4 7.4 3.4 5.0
30 5.4 7.4 3.4 5.0
45 5.4 7.4 3.4 5.0
60 5.4 7.4 3.4 5.0
75 3.4 5.0
90 3.4 5.0
105 3.4 5.0
120 3.4 5.0
Average rainfall data
Rainfall data from the Hyderabad area from 1980 to 2002 has been used to determine
average rainfall. The average monthly rainfall was derived and using the average number
of ‘rain days’ per month, the average rainfall on a rainy day was calculated. During the
monsoon season it is expected to rain near to 18 mm per day on a rainy day.
Table 3.3. Rainfall averages for the monsoon season, based on Hyderabad rainfall
data 1980 to 2002
Period Average rainfall
(mm/month)
Average rain days Average rainfall per
rain day (mm/day)
Jun 130.35 7 18.62
Jul 190.35 11 17.30
Aug 235.71 11 21.43
Sep 132.54 9 14.73
Oct 111.12 6 18.52
Monsoon season averages 160.01 8.8 18.12
Additional input
Some additional input is needed for the hydrological model beside the field measurements
and rainfall data. The most important points are listed below. These are based on field
visits, existing reports and expert judgement.

Witteveen+Bos, IND50-2/16-012.096 Final version 03 dated 8 July 2016, Upgradation of Sewage Treatment Plant and related activities at Noor Mohammed Kunta site, Hyderabad, Telangana Drainage and water quality
16
The dimensions of the canals and structures were derived from field measurements and
pictures taken during the field visit:
- Hydrological characteristics of the canals and floodplains were based on experience
from the field.
- Each model run spans a period of 24 hours.
- The modelled canals are filled with the base flow at the start of the simulation, based on
field measurements during pre-monsoon season.
- The beginning of stream 1 is estimated to have an elevation of 4 meters above the
pumping station. The beginning of stream 2 is assumed to be 2 meters above the
pumping station [ref. 2].
- Different canal types have different flow resistance:
Earth lined and surface flow canals have the manning n coefficient of 0.022 s*m-⅓
and 0.035 s*m-⅓ respectively.
Open concrete canals have the manning n coefficient of 0.014 s*m-⅓.
Closed sewage pipes are assumed to have the Colebrook White coefficient of
0.03 m.
- The culvert between the two wastewater ponds has a width of 1.4 m and height of 0.8 m
(see appendix I, picture 14).
- The culvert between the second wastewater pond and the lake has a width of 2.5 m and
height of 0.8 m. This is an assumption. The outflow is over land to the lake (see
appendix I, picture 15).
- The culvert at the lake outflow has a width of 0.3 m and height of 0.3 m (see appendix I
picture 29).
- Inflow points of rainwater runoff are located at strategic points along the streams. The
used catchments, their size and the inflow points can be seen in appendix III.
3.3. Assessment of peak-flow
In this section the peak flows from rainfall runoff, industrial discharges and domestic waste
water flows is given, as proposed in subtask 1.1e of the TECH-4 report. The peak flow is
determined for the pre-monsoon and the monsoon seasons separately.
3.3.1. Pre-monsoon season
During the pre-monsoon season there is assumed to be only dry weather flow (base flow),
which means that the only water in the system is sewage and industrial wastewater. Point
measurements of the flow and water level at different locations were made during the field
visits and used as input for the hydrological model (figure 3.2) flows and water depths
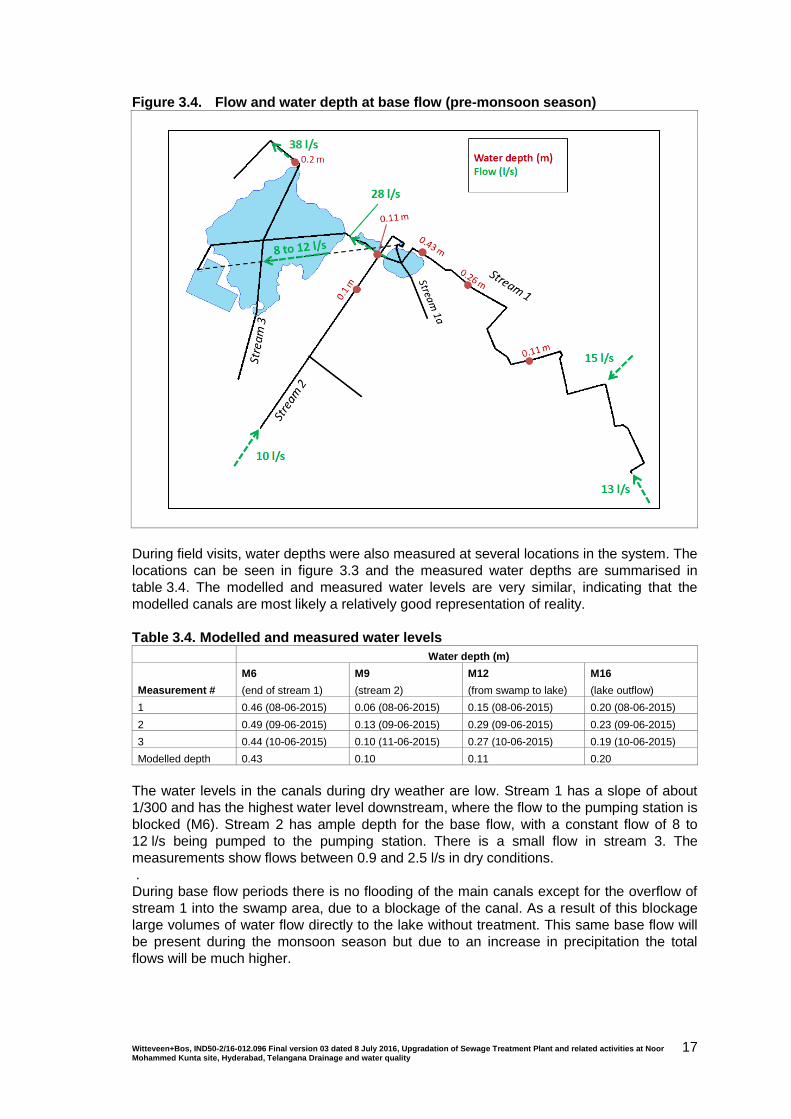
calculated with the Sobek model are illustrated in figure 3.4.
Witteveen+Bos, IND50-2/16-012.096 Final version 03 dated 8 July 2016, Upgradation of Sewage Treatment Plant and related activities at Noor Mohammed Kunta site, Hyderabad, Telangana Drainage and water quality
17
Figure 3.4. Flow and water depth at base flow (pre-monsoon season)
During field visits, water depths were also measured at several locations in the system. The
locations can be seen in figure 3.3 and the measured water depths are summarised in
table 3.4. The modelled and measured water levels are very similar, indicating that the
modelled canals are most likely a relatively good representation of reality.
Table 3.4. Modelled and measured water levels
Water depth (m)
Measurement #
M6
(end of stream 1)
M9
(stream 2)
M12
(from swamp to lake)
M16
(lake outflow)
1 0.46 (08-06-2015) 0.06 (08-06-2015) 0.15 (08-06-2015) 0.20 (08-06-2015)
2 0.49 (09-06-2015) 0.13 (09-06-2015) 0.29 (09-06-2015) 0.23 (09-06-2015)
3 0.44 (10-06-2015) 0.10 (11-06-2015) 0.27 (10-06-2015) 0.19 (10-06-2015)
Modelled depth 0.43 0.10 0.11 0.20
The water levels in the canals during dry weather are low. Stream 1 has a slope of about
1/300 and has the highest water level downstream, where the flow to the pumping station is
blocked (M6). Stream 2 has ample depth for the base flow, with a constant flow of 8 to
12 l/s being pumped to the pumping station. There is a small flow in stream 3. The
measurements show flows between 0.9 and 2.5 l/s in dry conditions.
.
During base flow periods there is no flooding of the main canals except for the overflow of
stream 1 into the swamp area, due to a blockage of the canal. As a result of this blockage
large volumes of water flow directly to the lake without treatment. This same base flow will
be present during the monsoon season but due to an increase in precipitation the total
flows will be much higher.
Witteveen+Bos, IND50-2/16-012.096 Final version 03 dated 8 July 2016, Upgradation of Sewage Treatment Plant and related activities at Noor Mohammed Kunta site, Hyderabad, Telangana Drainage and water quality
18
3.3.2. Monsoon season
The following section gives an overview of the expected flow volumes and velocities in the
main drainage canals during the monsoon season. Sobek was used to assess the peak
flows after big rainfall events. The model outcome is compared to the available point
measurements that were made during field visits. Unlike for the pre-monsoon model,
statistical rainfall data of extreme rain events is used as a model input, so not the point
measurements.
For the extreme rainfall events, 1 and 2 hour events with a return period of 1 year and 5
years were used. As mentioned earlier, the 1 and 2 hour duration of the events is based on
the system time of concentration, which is the expected time it takes for a drop of water to
flow from the top of the system to the bottom. During field visits and the monitoring
campaign we discussed the flooding problem with management of several industrial
companies and STP staff. The estimated time of concentration of 1 to 2 hours was
underpinned by the experience of locals.
Table 3.5 shows the maximum flow at different points in the system during different rainfall
events. The maximum flows are very high and result in flooding throughout the catchment.
These peak flows are interesting to determine the flood volume after a large rain event and
can be used to design a more robust drainage system. The volumes indicated below are
the maximum flows after a large rain event (22 to 40 mm) and will only occur during or
shortly after the downfall.
Table 3.5. Maximum modelled flows in 24 hours after event
Maximum flow through points (litres/sec)
M6 M7 M9 M12 M13 M15 M16
Base flow 28 0 10 28 0 10 38
T1 for 1 hour 1355 360 120 1160 930 50 100
T5 for 1 hour 1376 490 124 1240 1255 50 151
T1 for 2 hours 1270 220 115 1235 623 50 137
T5 for 2 hours 1310 330 118 1340 900 50 200
Table 3.5 shows that the flow velocities during a 1 hour storm are higher than during the
first hour of a two hour storm. Thus, the system has to cope with larger volumes of water in
a shorter time span. On the other hand, the longer storms have a higher total rainfall
volume. This has to be taken in consideration when designing the capacity and storage
basin of a new pumping station.
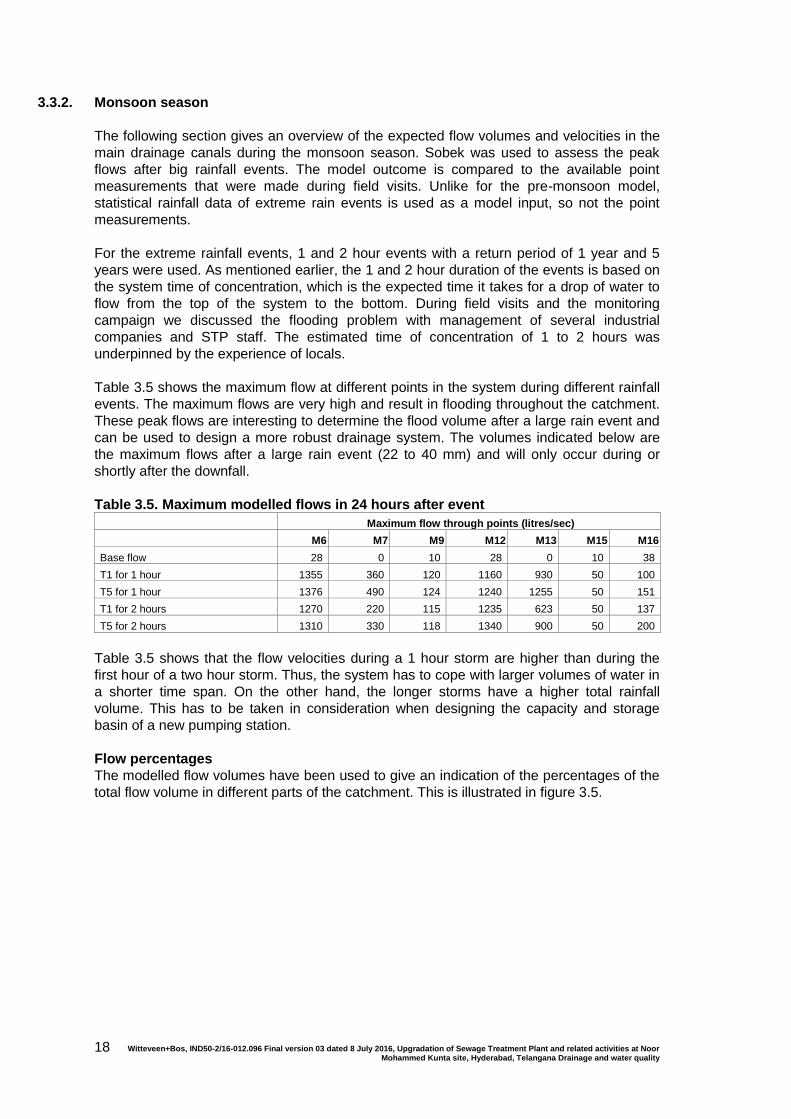
Flow percentages
The modelled flow volumes have been used to give an indication of the percentages of the
total flow volume in different parts of the catchment. This is illustrated in figure 3.5.
Witteveen+Bos, IND50-2/16-012.096 Final version 03 dated 8 July 2016, Upgradation of Sewage Treatment Plant and related activities at Noor Mohammed Kunta site, Hyderabad, Telangana Drainage and water quality
19
Figure 3.5. Percentages of the total flow volume
The calculations show that the largest volume of storm water flows through stream 1 and
into the first wastewater pool. The volume of water transported to the STP is very minimal
in extreme storm water conditions.
Water levels and flooding during storm events
Large parts of the drainage system floods during storm events. Table 3.6 shows the
modelled water levels at several points in the system (see figure 3.3 for locations).
Table 3.6. maximum water depths during storm events
Water depth during storm events (m)
M6 M7 M9 M12 M13 M16
(after weir)
Base flow 0.43 - 0.10 0.11 - 0.20
T1 for 1 hour 1.19 1.15 0.4 (full) 1.20 0.30 0.20
T5 for 1 hour 1.20 1.25 0.4 (full) 1.12 0.30 0.20
T1 for 2 hours 1.36 1.50 0.4 (full) 1.20 0.30 0.23
T5 for 2 hours 1.70 1.60 0.4 (full) 1.45 0.31 0.27
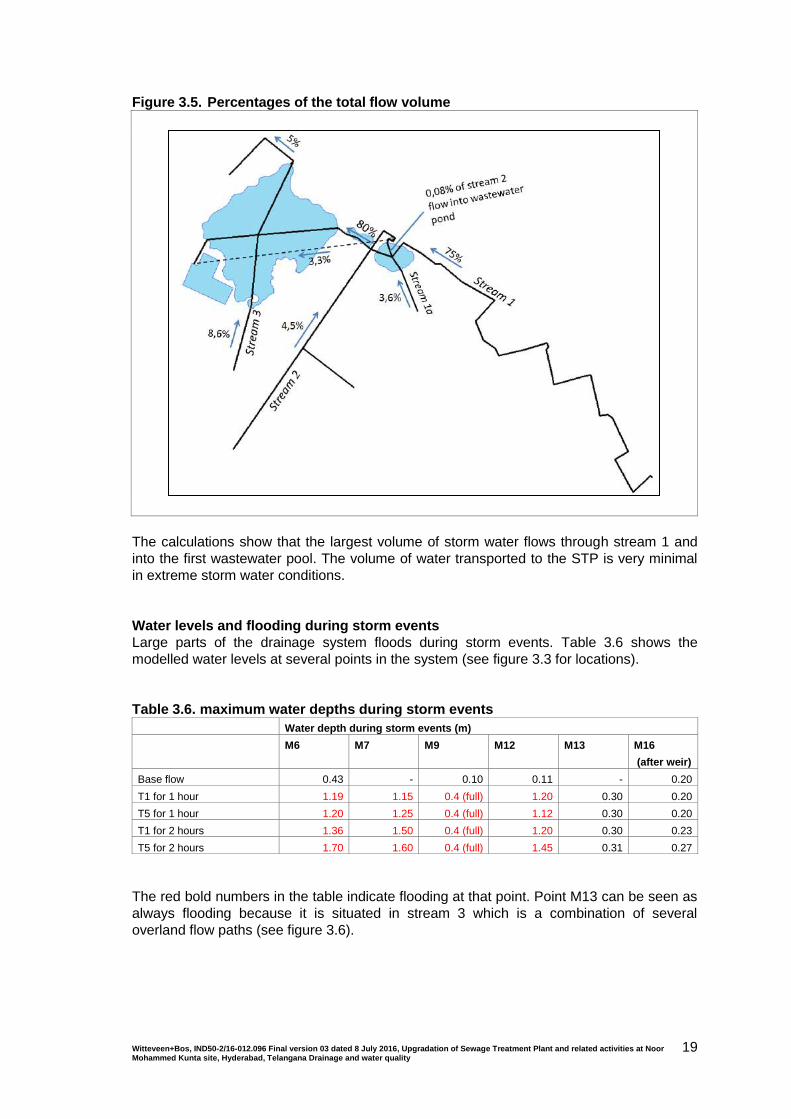
The red bold numbers in the table indicate flooding at that point. Point M13 can be seen as
always flooding because it is situated in stream 3 which is a combination of several
overland flow paths (see figure 3.6).
Witteveen+Bos, IND50-2/16-012.096 Final version 03 dated 8 July 2016, Upgradation of Sewage Treatment Plant and related activities at Noor Mohammed Kunta site, Hyderabad, Telangana Drainage and water quality
20
Figure 3.6. Flow from truck repair shops to NMK lake
The outflow from the lake is not much higher than the base flow. This is due to the storage
capacity of the lake which holds much of the runoff water and discharges it slowly. Also the
water levels are taken after the small (0.3 x 0.3 m) culvert, which only allows for a low flow
velocity.
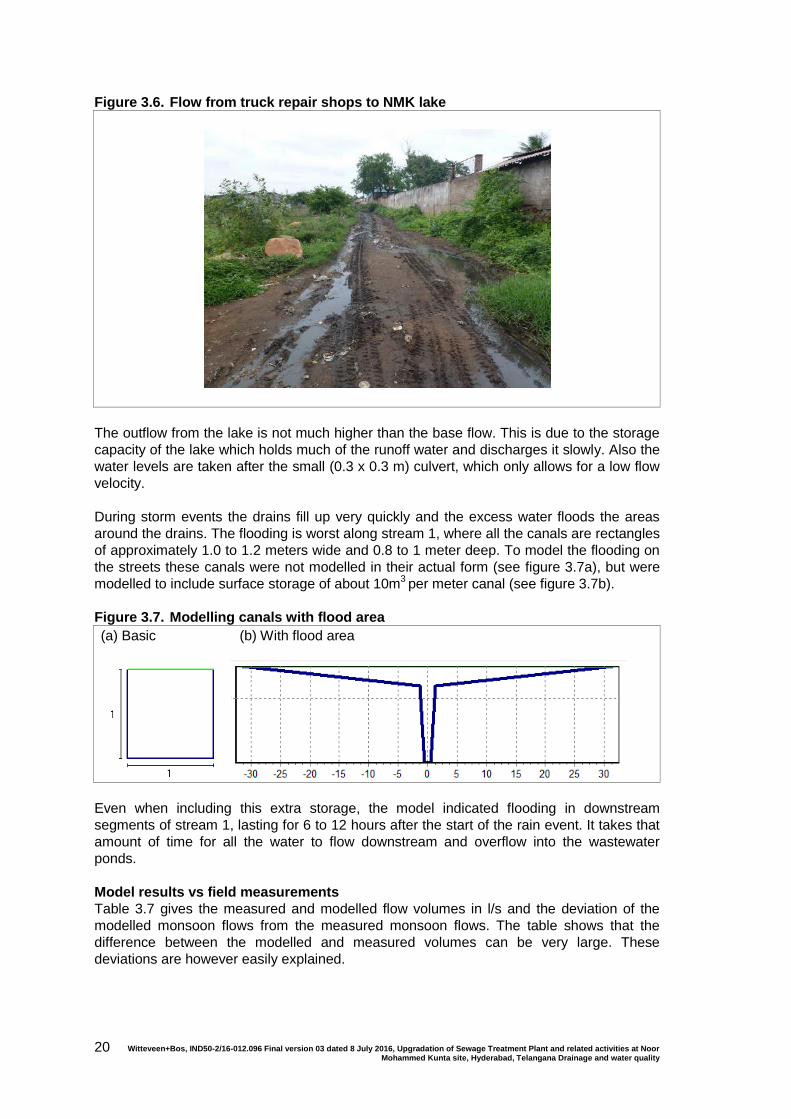
During storm events the drains fill up very quickly and the excess water floods the areas
around the drains. The flooding is worst along stream 1, where all the canals are rectangles
of approximately 1.0 to 1.2 meters wide and 0.8 to 1 meter deep. To model the flooding on
the streets these canals were not modelled in their actual form (see figure 3.7a), but were
modelled to include surface storage of about 10m3 per meter canal (see figure 3.7b).
Figure 3.7. Modelling canals with flood area
(a) Basic (b) With flood area
Even when including this extra storage, the model indicated flooding in downstream
segments of stream 1, lasting for 6 to 12 hours after the start of the rain event. It takes that
amount of time for all the water to flow downstream and overflow into the wastewater
ponds.
Model results vs field measurements
Table 3.7 gives the measured and modelled flow volumes in l/s and the deviation of the
modelled monsoon flows from the measured monsoon flows. The table shows that the
difference between the modelled and measured volumes can be very large. These
deviations are however easily explained.
Witteveen+Bos, IND50-2/16-012.096 Final version 03 dated 8 July 2016, Upgradation of Sewage Treatment Plant and related activities at Noor Mohammed Kunta site, Hyderabad, Telangana Drainage and water quality
21
To start with, the measurements presented below are based on several point
measurements conducted over a number of days at certain times. We do not have a
dataset with continuous measurements to work with which makes it difficult to determine
the actual average flows. Furthermore, the T1, 1 hour rain event represents extreme rainfall
that is to be expected once each year. It is unlikely that the measurements were conducted
after an event of that magnitude. Thus the exact difference between the measured and
modelled data is not of interest but the order of magnitude of the flows.
Table 3.7 Comparison of field measurements and modelled flows
Measured
(daily average flow in l/s)
Modelled
(average flow over 24 hours after
T1, 1 hour event in l/s)
Locations Pre- monsoon Monsoon Monsoon Deviation (%)
Bottom of stream 1 (M6) 28 221,0 330 49%
Stream 2 10 21,8 24 10%
Stream 3 0 1,9 36 1795%
Total swamp inflow 38 243,9 369 51%
Overflow from swamp to lake 28 240,9 354 47%
From STP to lake 10 9,4 19 102%
Total lake inflow 38 252,2 409 62%
3.4. Assessment of waste water volume quantification
This section describes the present, 24 hour average flow towards the NMK lake during the
monsoon season and the pre-monsoon season, which will be used in following chapters to
determine nutrient loading that lake NMK has to deal with in the current situation.
During the pre-monsoon season there is assumed to be only dry weather flow (base flow),
which means that the only water in the system is sewage and industrial wastewater. The
average 24 hour flow is the same as the flow described in section 3.3.1.
Table 3.8 Pre-monsoon flow into NMK lake in MLD
Location Pre-monsoon flow (MLD)
Overflow from swamp to lake 2.4
From STP to lake 0.9
Total lake inflow 3.3
The average daily lake inflow during the monsoon is based on hydrological calculations
using daily rainfall data from 2014 to 2015. For these years daily rainfall data is available.
From the data we concluded monsoon in these years was relatively dry. Therefore we also
assessed the average monsoon conditions, based on monthly data. The calculated
average flows are lower than the T1 event flows because the T1 event represents an
extreme rainfall event.
Table 3.9 shows the calculated average flows during the monsoon.

Witteveen+Bos, IND50-2/16-012.096 Final version 03 dated 8 July 2016, Upgradation of Sewage Treatment Plant and related activities at Noor Mohammed Kunta site, Hyderabad, Telangana Drainage and water quality
22
Table 3.9. Lake inflow after average and extreme rain events during the monsoon in
MLD
Location Maximum flow
After T1, 1 hour storm
(MLD)
Average flow
During monsoon season
- dialy data 2014/2015
(MLD)
Average flow
During monsoon season
- monthly datadialy data
(MLD)
Overflow directly to lake 33.7 10.2 14.9
From STP to lake 1.6 0.9 0.9
Total lake inflow 35.3 11.1 16,8
Witteveen+Bos, IND50-2/16-012.096 Final version 03 dated 8 July 2016, Upgradation of Sewage Treatment Plant and related activities at Noor Mohammed Kunta site, Hyderabad, Telangana Drainage and water quality
23
4. ECOLOGICAL ASSESSMENT
4.1. Approach to ecological assessment
To create an understanding of the water quality issues at hand in Lake NMK we make an
ecological assessment in which a systems approach is used. This analysis focuses on
identification of the key processes that define the water quality in Lake NMK. To identify
these processes we look at both the current condition of a lake (its appearance), and the
preconditions (the factors and processes that cause this appearance). The reason for
choosing this approach is that the current condition of a lake can be the result of different
developments in the past. In other words, the current condition only tells half the story. To
be able to identify effective measures the factors and processes that cause water quality
problems have to be well understood. Selection of measures based on the current
condition alone may result in choice of suboptimal measures.
For the assessment of the preconditions we make use of the conceptual framework of the
Ecological Key Factors (see textbox). This conceptual framework helps us to structure the
analysis. In the framework the water quality in the lake is considered in the light of 9
identified preconditions. For every precondition a separate assessment is made. In this
assessment a check is done whether the lake does comply with the defined precondition in
the existing situation.
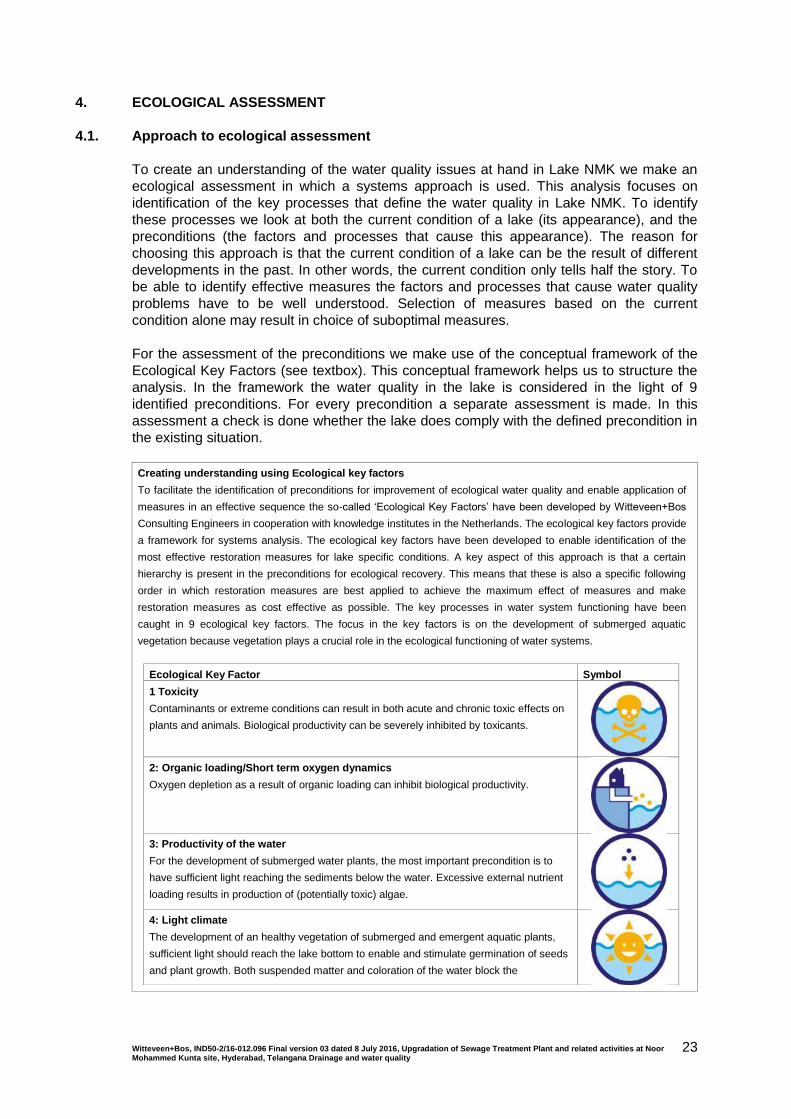
Creating understanding using Ecological key factors
To facilitate the identification of preconditions for improvement of ecological water quality and enable application of
measures in an effective sequence the so-called ‘Ecological Key Factors’ have been developed by Witteveen+Bos
Consulting Engineers in cooperation with knowledge institutes in the Netherlands. The ecological key factors provide
a framework for systems analysis. The ecological key factors have been developed to enable identification of the
most effective restoration measures for lake specific conditions. A key aspect of this approach is that a certain
hierarchy is present in the preconditions for ecological recovery. This means that these is also a specific following
order in which restoration measures are best applied to achieve the maximum effect of measures and make
restoration measures as cost effective as possible. The key processes in water system functioning have been
caught in 9 ecological key factors. The focus in the key factors is on the development of submerged aquatic
vegetation because vegetation plays a crucial role in the ecological functioning of water systems.
Ecological Key Factor Symbol
1 Toxicity
Contaminants or extreme conditions can result in both acute and chronic toxic effects on
plants and animals. Biological productivity can be severely inhibited by toxicants.
2: Organic loading/Short term oxygen dynamics
Oxygen depletion as a result of organic loading can inhibit biological productivity.
3: Productivity of the water
For the development of submerged water plants, the most important precondition is to
have sufficient light reaching the sediments below the water. Excessive external nutrient
loading results in production of (potentially toxic) algae.
4: Light climate
The development of an healthy vegetation of submerged and emergent aquatic plants,
sufficient light should reach the lake bottom to enable and stimulate germination of seeds
and plant growth. Both suspended matter and coloration of the water block the
Witteveen+Bos, IND50-2/16-012.096 Final version 03 dated 8 July 2016, Upgradation of Sewage Treatment Plant and related activities at Noor Mohammed Kunta site, Hyderabad, Telangana Drainage and water quality
24
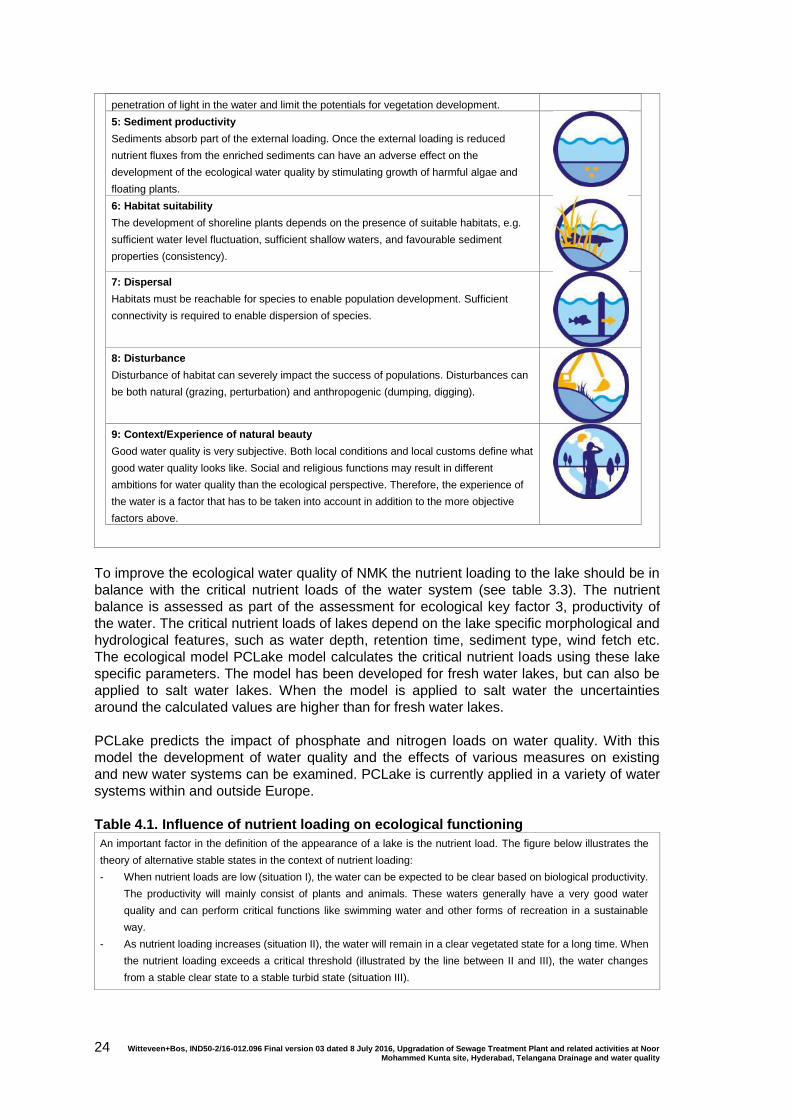
penetration of light in the water and limit the potentials for vegetation development.
5: Sediment productivity
Sediments absorb part of the external loading. Once the external loading is reduced
nutrient fluxes from the enriched sediments can have an adverse effect on the
development of the ecological water quality by stimulating growth of harmful algae and
floating plants.
6: Habitat suitability
The development of shoreline plants depends on the presence of suitable habitats, e.g.
sufficient water level fluctuation, sufficient shallow waters, and favourable sediment
properties (consistency).
7: Dispersal
Habitats must be reachable for species to enable population development. Sufficient
connectivity is required to enable dispersion of species.
8: Disturbance
Disturbance of habitat can severely impact the success of populations. Disturbances can
be both natural (grazing, perturbation) and anthropogenic (dumping, digging).
9: Context/Experience of natural beauty
Good water quality is very subjective. Both local conditions and local customs define what
good water quality looks like. Social and religious functions may result in different
ambitions for water quality than the ecological perspective. Therefore, the experience of
the water is a factor that has to be taken into account in addition to the more objective
factors above.
To improve the ecological water quality of NMK the nutrient loading to the lake should be in
balance with the critical nutrient loads of the water system (see table 3.3). The nutrient
balance is assessed as part of the assessment for ecological key factor 3, productivity of
the water. The critical nutrient loads of lakes depend on the lake specific morphological and
hydrological features, such as water depth, retention time, sediment type, wind fetch etc.
The ecological model PCLake model calculates the critical nutrient loads using these lake
specific parameters. The model has been developed for fresh water lakes, but can also be
applied to salt water lakes. When the model is applied to salt water the uncertainties
around the calculated values are higher than for fresh water lakes.
PCLake predicts the impact of phosphate and nitrogen loads on water quality. With this
model the development of water quality and the effects of various measures on existing
and new water systems can be examined. PCLake is currently applied in a variety of water
systems within and outside Europe.
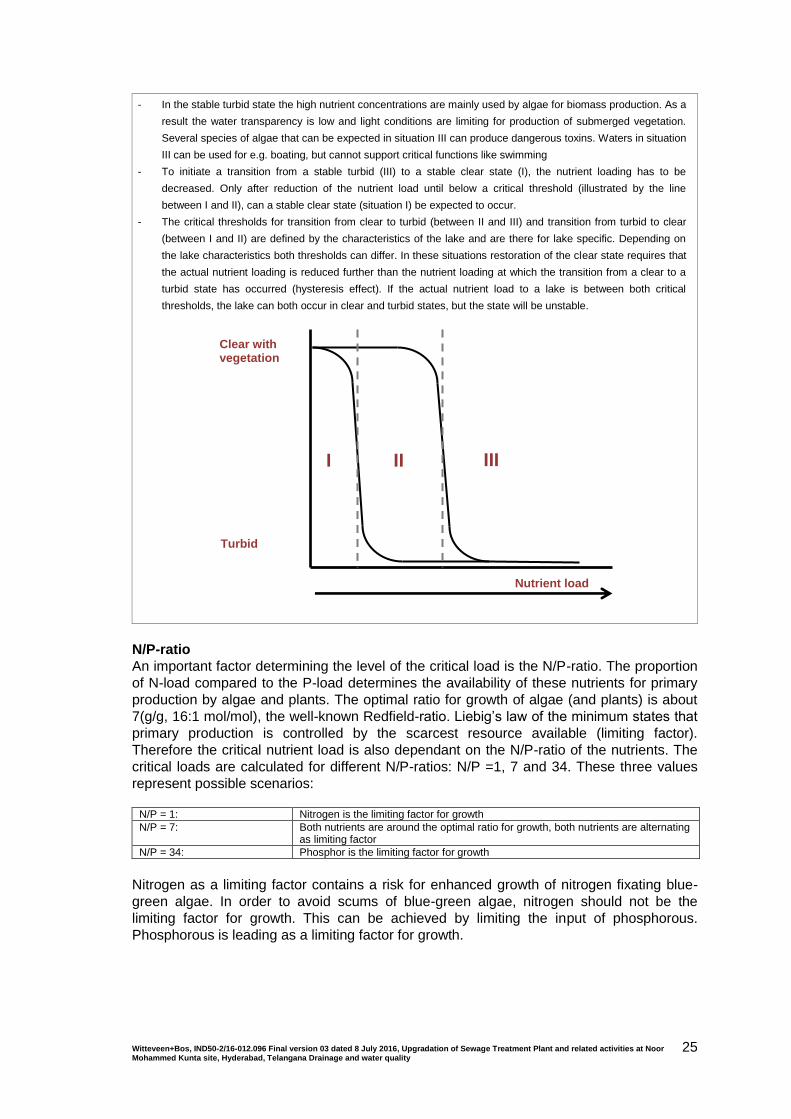
Table 4.1. Influence of nutrient loading on ecological functioning
An important factor in the definition of the appearance of a lake is the nutrient load. The figure below illustrates the
theory of alternative stable states in the context of nutrient loading:
- When nutrient loads are low (situation I), the water can be expected to be clear based on biological productivity.
The productivity will mainly consist of plants and animals. These waters generally have a very good water
quality and can perform critical functions like swimming water and other forms of recreation in a sustainable
way.
- As nutrient loading increases (situation II), the water will remain in a clear vegetated state for a long time. When
the nutrient loading exceeds a critical threshold (illustrated by the line between II and III), the water changes
from a stable clear state to a stable turbid state (situation III).
Witteveen+Bos, IND50-2/16-012.096 Final version 03 dated 8 July 2016, Upgradation of Sewage Treatment Plant and related activities at Noor Mohammed Kunta site, Hyderabad, Telangana Drainage and water quality
25
- In the stable turbid state the high nutrient concentrations are mainly used by algae for biomass production. As a
result the water transparency is low and light conditions are limiting for production of submerged vegetation.
Several species of algae that can be expected in situation III can produce dangerous toxins. Waters in situation
III can be used for e.g. boating, but cannot support critical functions like swimming
- To initiate a transition from a stable turbid (III) to a stable clear state (I), the nutrient loading has to be
decreased. Only after reduction of the nutrient load until below a critical threshold (illustrated by the line
between I and II), can a stable clear state (situation I) be expected to occur.
- The critical thresholds for transition from clear to turbid (between II and III) and transition from turbid to clear
(between I and II) are defined by the characteristics of the lake and are there for lake specific. Depending on
the lake characteristics both thresholds can differ. In these situations restoration of the clear state requires that
the actual nutrient loading is reduced further than the nutrient loading at which the transition from a clear to a
turbid state has occurred (hysteresis effect). If the actual nutrient load to a lake is between both critical
thresholds, the lake can both occur in clear and turbid states, but the state will be unstable.
N/P-ratio
An important factor determining the level of the critical load is the N/P-ratio. The proportion
of N-load compared to the P-load determines the availability of these nutrients for primary
production by algae and plants. The optimal ratio for growth of algae (and plants) is about
7(g/g, 16:1 mol/mol), the well-known Redfield-ratio. Liebig’s law of the minimum states that
primary production is controlled by the scarcest resource available (limiting factor).
Therefore the critical nutrient load is also dependant on the N/P-ratio of the nutrients. The
critical loads are calculated for different N/P-ratios: N/P =1, 7 and 34. These three values
represent possible scenarios:
N/P = 1: Nitrogen is the limiting factor for growth
N/P = 7: Both nutrients are around the optimal ratio for growth, both nutrients are alternating as limiting factor
N/P = 34: Phosphor is the limiting factor for growth
Nitrogen as a limiting factor contains a risk for enhanced growth of nitrogen fixating blue-
green algae. In order to avoid scums of blue-green algae, nitrogen should not be the
limiting factor for growth. This can be achieved by limiting the input of phosphorous.
Phosphorous is leading as a limiting factor for growth.
Clear with vegetation
Turbid
Nutrient load
I II III
Witteveen+Bos, IND50-2/16-012.096 Final version 03 dated 8 July 2016, Upgradation of Sewage Treatment Plant and related activities at Noor Mohammed Kunta site, Hyderabad, Telangana Drainage and water quality
26
4.2. Assessment of existing situation
Based on the field visits a preliminary assessment of the ecological condition of lake NMK
has been made. In table 4.2 the current condition is described with the Ecological Key
Factors.
Table 4.2. Assessment of the current situation in lake NMK with the Ecological Key
Factors
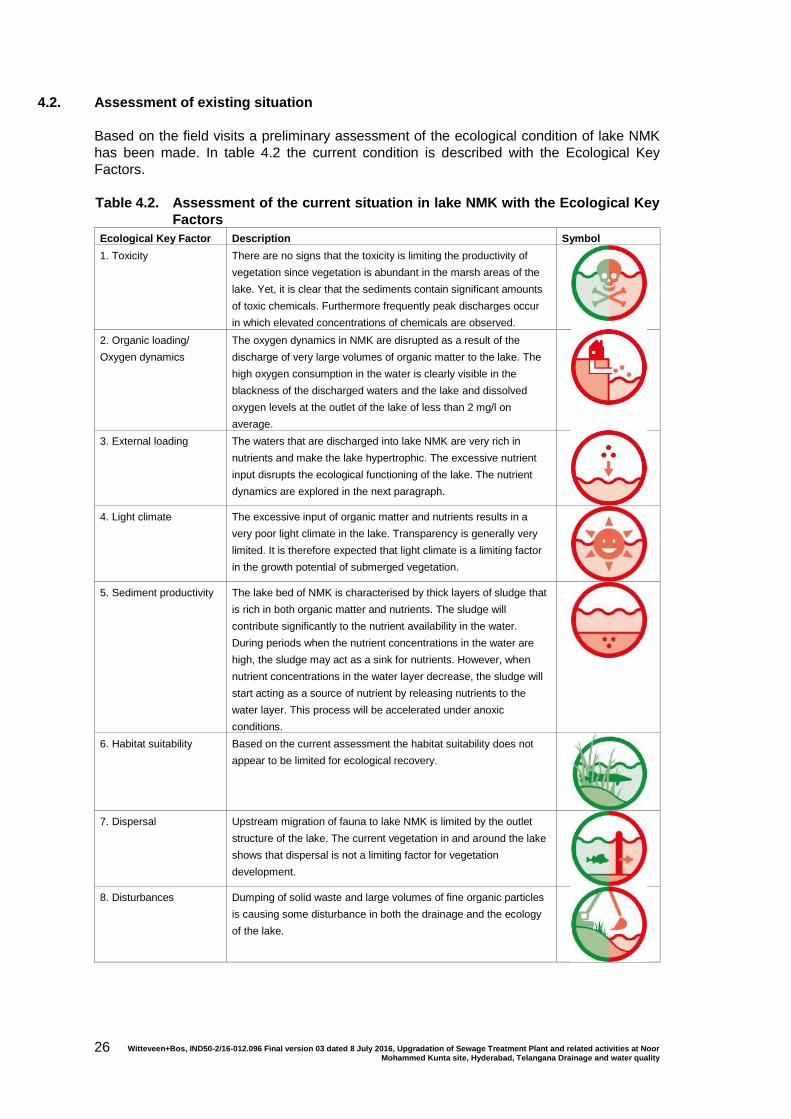
Ecological Key Factor Description Symbol
1. Toxicity There are no signs that the toxicity is limiting the productivity of
vegetation since vegetation is abundant in the marsh areas of the
lake. Yet, it is clear that the sediments contain significant amounts
of toxic chemicals. Furthermore frequently peak discharges occur
in which elevated concentrations of chemicals are observed.
2. Organic loading/
Oxygen dynamics
The oxygen dynamics in NMK are disrupted as a result of the
discharge of very large volumes of organic matter to the lake. The
high oxygen consumption in the water is clearly visible in the
blackness of the discharged waters and the lake and dissolved
oxygen levels at the outlet of the lake of less than 2 mg/l on
average.
3. External loading The waters that are discharged into lake NMK are very rich in
nutrients and make the lake hypertrophic. The excessive nutrient
input disrupts the ecological functioning of the lake. The nutrient
dynamics are explored in the next paragraph.
4. Light climate The excessive input of organic matter and nutrients results in a
very poor light climate in the lake. Transparency is generally very
limited. It is therefore expected that light climate is a limiting factor
in the growth potential of submerged vegetation.
5. Sediment productivity The lake bed of NMK is characterised by thick layers of sludge that
is rich in both organic matter and nutrients. The sludge will
contribute significantly to the nutrient availability in the water.
During periods when the nutrient concentrations in the water are
high, the sludge may act as a sink for nutrients. However, when
nutrient concentrations in the water layer decrease, the sludge will
start acting as a source of nutrient by releasing nutrients to the
water layer. This process will be accelerated under anoxic
conditions.
6. Habitat suitability Based on the current assessment the habitat suitability does not
appear to be limited for ecological recovery.
7. Dispersal Upstream migration of fauna to lake NMK is limited by the outlet
structure of the lake. The current vegetation in and around the lake
shows that dispersal is not a limiting factor for vegetation
development.
8. Disturbances Dumping of solid waste and large volumes of fine organic particles
is causing some disturbance in both the drainage and the ecology
of the lake.
Witteveen+Bos, IND50-2/16-012.096 Final version 03 dated 8 July 2016, Upgradation of Sewage Treatment Plant and related activities at Noor Mohammed Kunta site, Hyderabad, Telangana Drainage and water quality
27
Ecological Key Factor Description Symbol
9. Context The lake is intended to act as a tank for the collection of water for
irrigation. The water quality is however too bad to use the water for
this purpose. The lake suffers from extensive dumping of solid and
liquid wastes.
The key issues for the ecological water quality in Noor Muhammed Kunta are organic
loading, external loading and sediment productivity. A more detailed assessment of the
nutrient dynamics in the lake has been made to gain insight in suitable measures to
address the issues with these key issues. The results have been presented in the following
paragraph.
4.3. Nutrient balances
4.3.1. Existing situation (reference)
For the ecological water quality the water flows that are received by the lake itself are of
importance. As a result of the blockage of the stream 1 (from Kattedan SEIP) in front of the
pumping station and the breach in the channel wall a short circuit around the STP is
created. Due to the short circuit the waste waters from stream 1 do not pass through the
STP, but are discharged to lake NMK untreated. The waste waters coming from stream 2
(coming from Sri Ran Nagar) pass through the pumping station and the STP before being
discharged into the lake.
Nutrient concentrations
To gain insight in the existing water quality the water flows in the Kattedan Industrial Estate,
the STP, and lake NMK have been sampled both in the pre monsoon (9 to 12th of June
2015) and the monsoon (20th August to 17
th September 2015). Tables 4.3 and 4.4 show the
nutrient concentrations for a select number of locations. In appendix VI a complete
overview of the analysis results is given.
Table 4.3. Water quality results for pre monsoon sampling
KjN
(mg N/l)
NO3
(mg N/l)
NO2
(mg N/l)
TN
(mg N/l)
PO4
(mg P/l)
TP
(mg P/l)
1 Direct discharge from Kattedan IE 59.2 2.9 0.0 62.2 39.7 39.8
2 Discharge from STP 19.0 1.4 20.5 7.7 7.7
3 Discharge from stream 2 56.7 1.4 0.0 58.1 36.7 52.7
Total IN Discharge to lake NMK 36.3 0.7 0.0 37.0 7.9 16.4
Table 4.4. Water quality results for monsoon sampling
KjN
(mg N/l)
NO3
(mg N/l)
NO2
(mg N/l)
TN
(mg N/l)
PO4
(mg P/l)
TP
(mg P/l)
1 Direct discharge from Kattedan IE 45.8 1.2 1.1 48.1 24.4 24.5
2 Discharge from STP 5.4 3.9 9.3 3.9 3.9
3 Discharge from stream 2 58.6 0.4 0.0 59.0 31.6 27.7
Total IN Discharge to lake NMK 36.3 0.7 0.0 37.0 7.9 16.4
Critical nutrient loads
The critical thresholds for nutrient loading to the water system have been calculated with
the eutrophication model PCLake. The input in table 4.5 has been used to model the
existing situation. Surface areas have been calculated based on Google Earth satellite
images. The average depth is derived from the remediation plan for NMK (Witteveen+Bos,
Witteveen+Bos, IND50-2/16-012.096 Final version 03 dated 8 July 2016, Upgradation of Sewage Treatment Plant and related activities at Noor Mohammed Kunta site, Hyderabad, Telangana Drainage and water quality
28
2013). For this calculation the total area of the open water of lake NMK and all marshes
has been taken into account.
Table 4.5. Model input for current situation
Parameter Current situation
Total surface (m2) 89,885
Existing marsh area (m2) 35,365
Marsh cover (m2/m
2) 0.394
Average temperature (°C) 26
Temperature fluctuation (°C) 5
Fetch (m) 276.0
Average depth (m) 3.1
Figure 4.1. Relation between N:P ratio and the critical P loads for the dry season
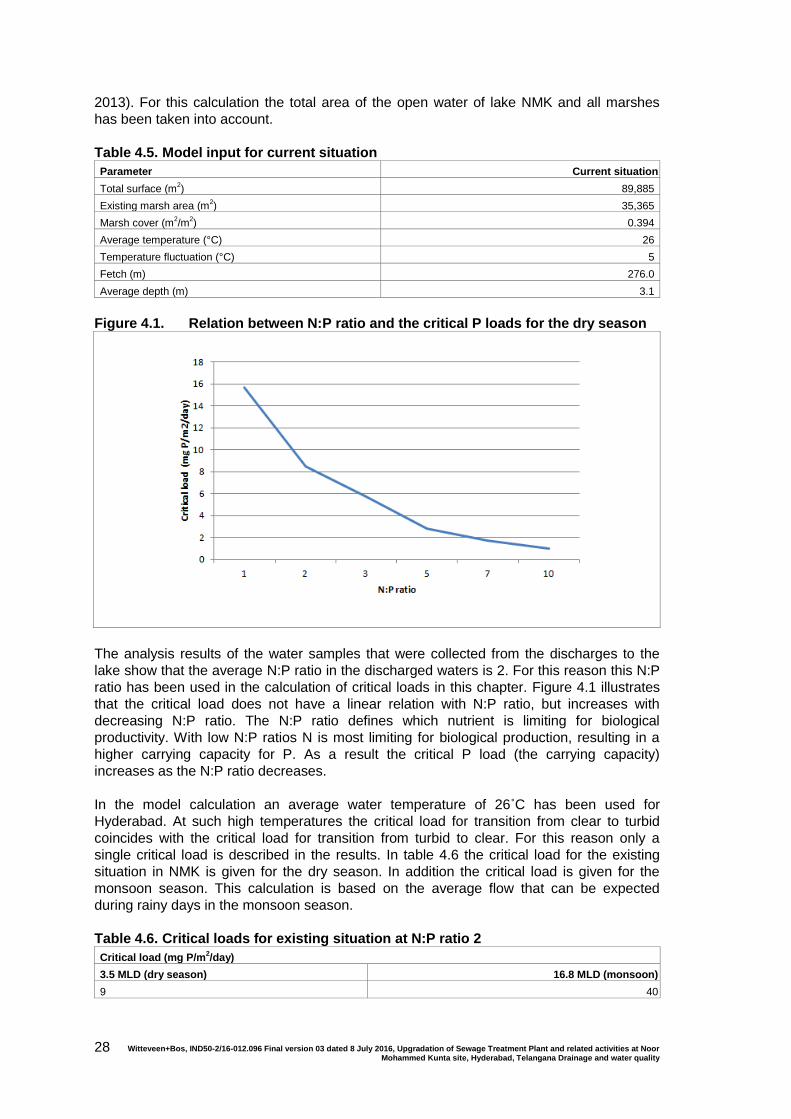
The analysis results of the water samples that were collected from the discharges to the
lake show that the average N:P ratio in the discharged waters is 2. For this reason this N:P
ratio has been used in the calculation of critical loads in this chapter. Figure 4.1 illustrates
that the critical load does not have a linear relation with N:P ratio, but increases with
decreasing N:P ratio. The N:P ratio defines which nutrient is limiting for biological
productivity. With low N:P ratios N is most limiting for biological production, resulting in a
higher carrying capacity for P. As a result the critical P load (the carrying capacity)
increases as the N:P ratio decreases.
In the model calculation an average water temperature of 26˚C has been used for
Hyderabad. At such high temperatures the critical load for transition from clear to turbid
coincides with the critical load for transition from turbid to clear. For this reason only a
single critical load is described in the results. In table 4.6 the critical load for the existing
situation in NMK is given for the dry season. In addition the critical load is given for the
monsoon season. This calculation is based on the average flow that can be expected
during rainy days in the monsoon season.
Table 4.6. Critical loads for existing situation at N:P ratio 2
Critical load (mg P/m2/day)
3.5 MLD (dry season) 16.8 MLD (monsoon)
9 40
Witteveen+Bos, IND50-2/16-012.096 Final version 03 dated 8 July 2016, Upgradation of Sewage Treatment Plant and related activities at Noor Mohammed Kunta site, Hyderabad, Telangana Drainage and water quality
29
Current nutrient loading
For the calculation of the current nutrient loading the predicted flows from the hydrological
assessment are used. The total N and total P values from table 4.4 are multiplied with the
calculated flows to acquire nutrient loads.
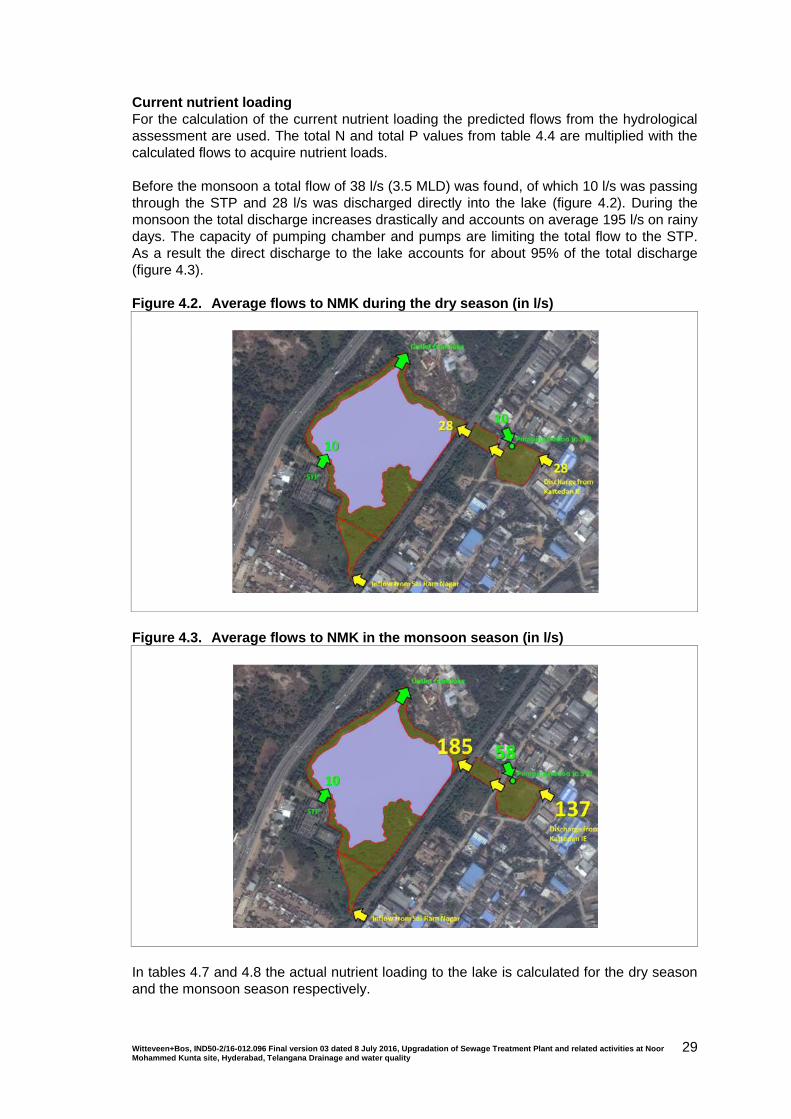
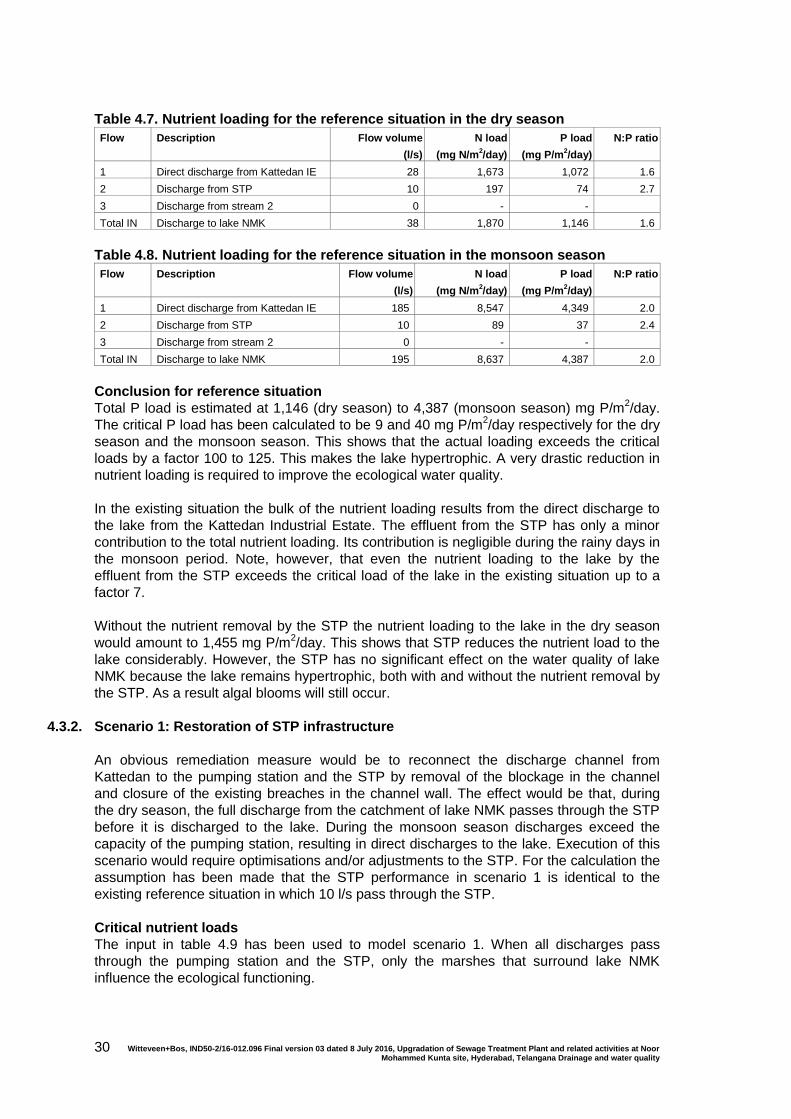
Before the monsoon a total flow of 38 l/s (3.5 MLD) was found, of which 10 l/s was passing
through the STP and 28 l/s was discharged directly into the lake (figure 4.2). During the
monsoon the total discharge increases drastically and accounts on average 195 l/s on rainy
days. The capacity of pumping chamber and pumps are limiting the total flow to the STP.
As a result the direct discharge to the lake accounts for about 95% of the total discharge
(figure 4.3).
Figure 4.2. Average flows to NMK during the dry season (in l/s)
Figure 4.3. Average flows to NMK in the monsoon season (in l/s)
In tables 4.7 and 4.8 the actual nutrient loading to the lake is calculated for the dry season
and the monsoon season respectively.
Witteveen+Bos, IND50-2/16-012.096 Final version 03 dated 8 July 2016, Upgradation of Sewage Treatment Plant and related activities at Noor Mohammed Kunta site, Hyderabad, Telangana Drainage and water quality
30
Table 4.7. Nutrient loading for the reference situation in the dry season
Flow Description Flow volume
(l/s)
N load
(mg N/m2/day)
P load
(mg P/m2/day)
N:P ratio
1 Direct discharge from Kattedan IE 28 1,673 1,072 1.6
2 Discharge from STP 10 197 74 2.7
3 Discharge from stream 2 0 - -
Total IN Discharge to lake NMK 38 1,870 1,146 1.6
Table 4.8. Nutrient loading for the reference situation in the monsoon season
Flow Description Flow volume
(l/s)
N load
(mg N/m2/day)
P load
(mg P/m2/day)
N:P ratio
1 Direct discharge from Kattedan IE 185 8,547 4,349 2.0
2 Discharge from STP 10 89 37 2.4
3 Discharge from stream 2 0 - -
Total IN Discharge to lake NMK 195 8,637 4,387 2.0
Conclusion for reference situation
Total P load is estimated at 1,146 (dry season) to 4,387 (monsoon season) mg P/m2/day.
The critical P load has been calculated to be 9 and 40 mg P/m2/day respectively for the dry
season and the monsoon season. This shows that the actual loading exceeds the critical
loads by a factor 100 to 125. This makes the lake hypertrophic. A very drastic reduction in
nutrient loading is required to improve the ecological water quality.
In the existing situation the bulk of the nutrient loading results from the direct discharge to
the lake from the Kattedan Industrial Estate. The effluent from the STP has only a minor
contribution to the total nutrient loading. Its contribution is negligible during the rainy days in
the monsoon period. Note, however, that even the nutrient loading to the lake by the
effluent from the STP exceeds the critical load of the lake in the existing situation up to a
factor 7.
Without the nutrient removal by the STP the nutrient loading to the lake in the dry season
would amount to 1,455 mg P/m2/day. This shows that STP reduces the nutrient load to the
lake considerably. However, the STP has no significant effect on the water quality of lake
NMK because the lake remains hypertrophic, both with and without the nutrient removal by
the STP. As a result algal blooms will still occur.
4.3.2. Scenario 1: Restoration of STP infrastructure
An obvious remediation measure would be to reconnect the discharge channel from
Kattedan to the pumping station and the STP by removal of the blockage in the channel
and closure of the existing breaches in the channel wall. The effect would be that, during
the dry season, the full discharge from the catchment of lake NMK passes through the STP
before it is discharged to the lake. During the monsoon season discharges exceed the
capacity of the pumping station, resulting in direct discharges to the lake. Execution of this
scenario would require optimisations and/or adjustments to the STP. For the calculation the
assumption has been made that the STP performance in scenario 1 is identical to the
existing reference situation in which 10 l/s pass through the STP.
Critical nutrient loads
The input in table 4.9 has been used to model scenario 1. When all discharges pass
through the pumping station and the STP, only the marshes that surround lake NMK
influence the ecological functioning.
Witteveen+Bos, IND50-2/16-012.096 Final version 03 dated 8 July 2016, Upgradation of Sewage Treatment Plant and related activities at Noor Mohammed Kunta site, Hyderabad, Telangana Drainage and water quality
31
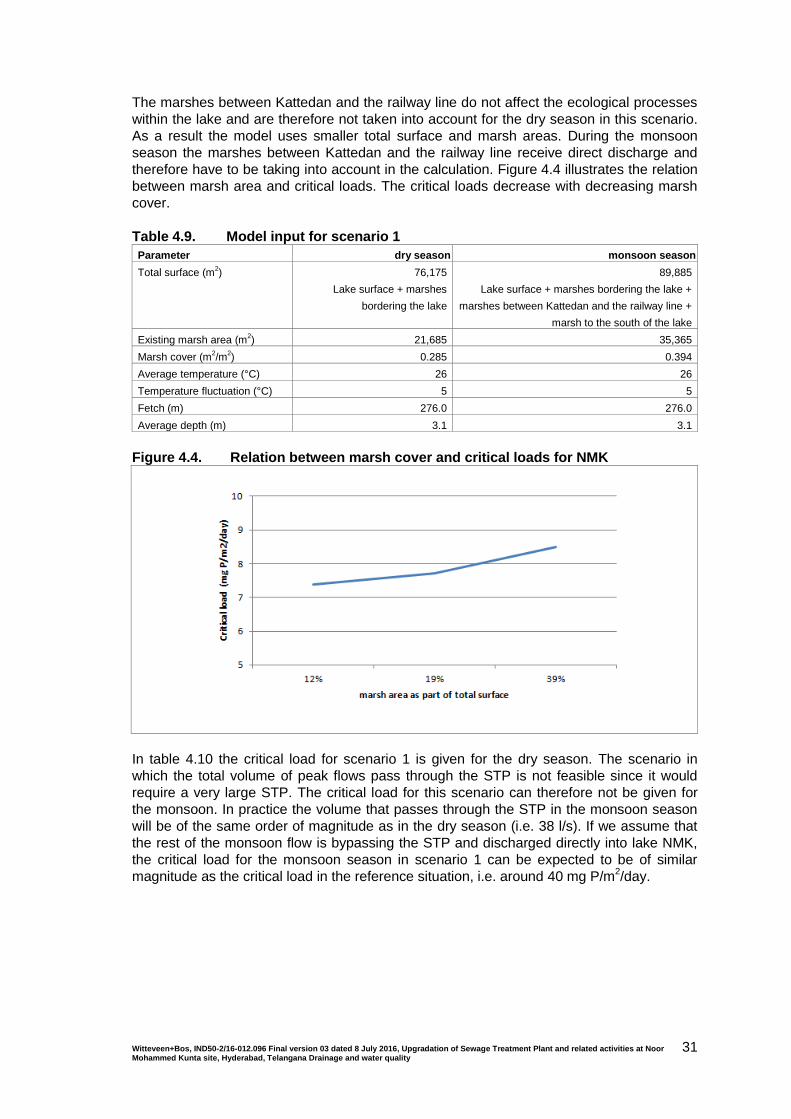
The marshes between Kattedan and the railway line do not affect the ecological processes
within the lake and are therefore not taken into account for the dry season in this scenario.
As a result the model uses smaller total surface and marsh areas. During the monsoon
season the marshes between Kattedan and the railway line receive direct discharge and
therefore have to be taking into account in the calculation. Figure 4.4 illustrates the relation
between marsh area and critical loads. The critical loads decrease with decreasing marsh
cover.
Table 4.9. Model input for scenario 1
Parameter dry season monsoon season
Total surface (m2) 76,175
Lake surface + marshes
bordering the lake
89,885
Lake surface + marshes bordering the lake +
marshes between Kattedan and the railway line +
marsh to the south of the lake
Existing marsh area (m2) 21,685 35,365
Marsh cover (m2/m
2) 0.285 0.394
Average temperature (°C) 26 26
Temperature fluctuation (°C) 5 5
Fetch (m) 276.0 276.0
Average depth (m) 3.1 3.1
Figure 4.4. Relation between marsh cover and critical loads for NMK
In table 4.10 the critical load for scenario 1 is given for the dry season. The scenario in
which the total volume of peak flows pass through the STP is not feasible since it would
require a very large STP. The critical load for this scenario can therefore not be given for
the monsoon. In practice the volume that passes through the STP in the monsoon season
will be of the same order of magnitude as in the dry season (i.e. 38 l/s). If we assume that
the rest of the monsoon flow is bypassing the STP and discharged directly into lake NMK,
the critical load for the monsoon season in scenario 1 can be expected to be of similar
magnitude as the critical load in the reference situation, i.e. around 40 mg P/m2/day.
Witteveen+Bos, IND50-2/16-012.096 Final version 03 dated 8 July 2016, Upgradation of Sewage Treatment Plant and related activities at Noor Mohammed Kunta site, Hyderabad, Telangana Drainage and water quality
32
Table 4.10. Critical loads for scenario 1 at N:P ratio 2
Critical load (mg P/m2/day)
3.5 MLD (dry season) 16.8 MLD (monsoon)
7 40*
* assumes that only 38 l/s passes through the STP
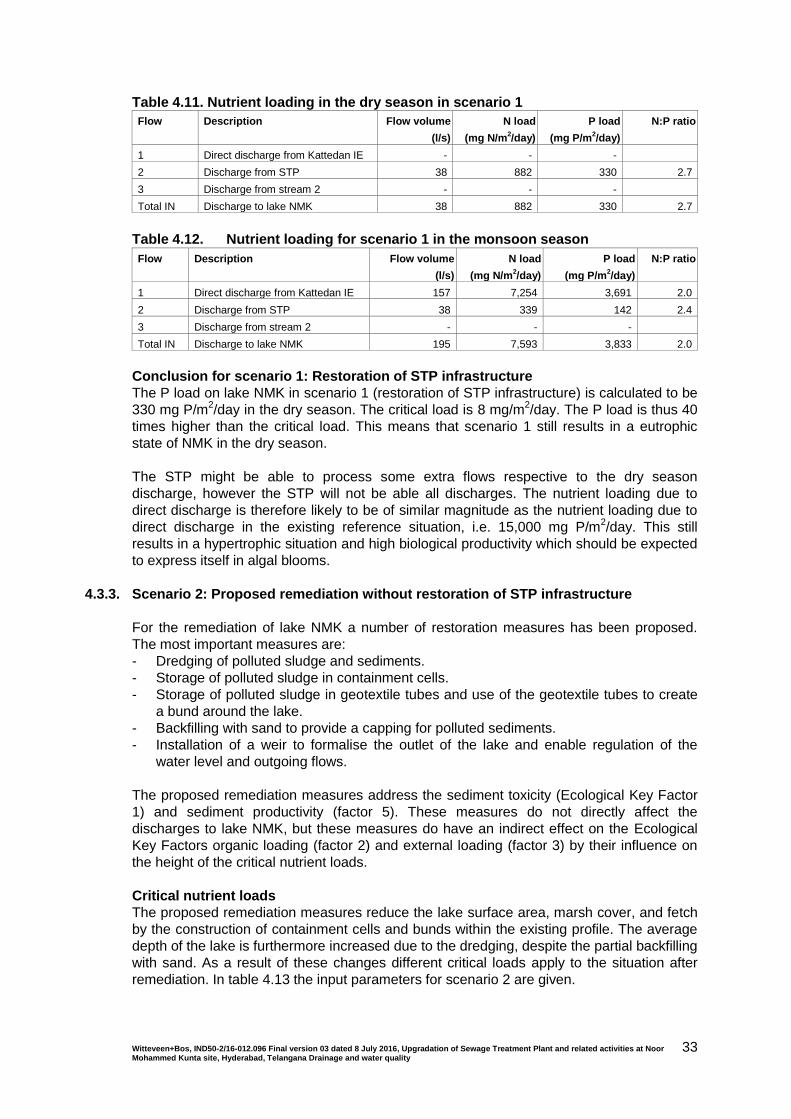
Current nutrient loading
For the calculation of the nutrient loading in scenario 1 the assumption is made that all
calculated flows in the dry season, i.e. 38 l/s, pass through the STP. With this flow a
remaining volume of 157 l/s would be discharged directly to the lake during the monsoon
season. The calculated nutrient loads are presented in tables 4.11 and 4.12.
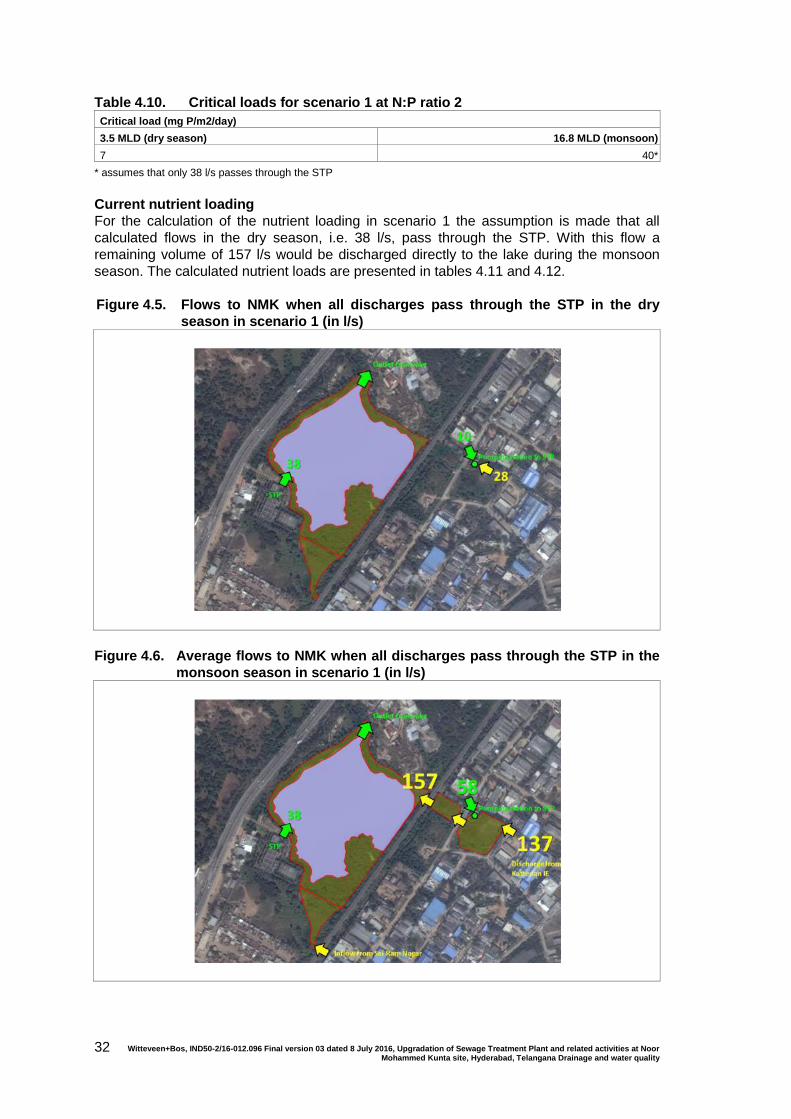
Figure 4.5. Flows to NMK when all discharges pass through the STP in the dry
season in scenario 1 (in l/s)
Figure 4.6. Average flows to NMK when all discharges pass through the STP in the
monsoon season in scenario 1 (in l/s)
Witteveen+Bos, IND50-2/16-012.096 Final version 03 dated 8 July 2016, Upgradation of Sewage Treatment Plant and related activities at Noor Mohammed Kunta site, Hyderabad, Telangana Drainage and water quality
33
Table 4.11. Nutrient loading in the dry season in scenario 1
Flow Description Flow volume
(l/s)
N load
(mg N/m2/day)
P load
(mg P/m2/day)
N:P ratio
1 Direct discharge from Kattedan IE - - -
2 Discharge from STP 38 882 330 2.7
3 Discharge from stream 2 - - -
Total IN Discharge to lake NMK 38 882 330 2.7
Table 4.12. Nutrient loading for scenario 1 in the monsoon season
Flow Description Flow volume
(l/s)
N load
(mg N/m2/day)
P load
(mg P/m2/day)
N:P ratio
1 Direct discharge from Kattedan IE 157 7,254 3,691 2.0
2 Discharge from STP 38 339 142 2.4
3 Discharge from stream 2 - - -
Total IN Discharge to lake NMK 195 7,593 3,833 2.0
Conclusion for scenario 1: Restoration of STP infrastructure
The P load on lake NMK in scenario 1 (restoration of STP infrastructure) is calculated to be
330 mg P/m2/day in the dry season. The critical load is 8 mg/m
2/day. The P load is thus 40
times higher than the critical load. This means that scenario 1 still results in a eutrophic
state of NMK in the dry season.
The STP might be able to process some extra flows respective to the dry season
discharge, however the STP will not be able all discharges. The nutrient loading due to
direct discharge is therefore likely to be of similar magnitude as the nutrient loading due to
direct discharge in the existing reference situation, i.e. 15,000 mg P/m2/day. This still
results in a hypertrophic situation and high biological productivity which should be expected
to express itself in algal blooms.
4.3.3. Scenario 2: Proposed remediation without restoration of STP infrastructure
For the remediation of lake NMK a number of restoration measures has been proposed.
The most important measures are:
- Dredging of polluted sludge and sediments.
- Storage of polluted sludge in containment cells.
- Storage of polluted sludge in geotextile tubes and use of the geotextile tubes to create
a bund around the lake.
- Backfilling with sand to provide a capping for polluted sediments.
- Installation of a weir to formalise the outlet of the lake and enable regulation of the
water level and outgoing flows.
The proposed remediation measures address the sediment toxicity (Ecological Key Factor
1) and sediment productivity (factor 5). These measures do not directly affect the
discharges to lake NMK, but these measures do have an indirect effect on the Ecological
Key Factors organic loading (factor 2) and external loading (factor 3) by their influence on
the height of the critical nutrient loads.
Critical nutrient loads
The proposed remediation measures reduce the lake surface area, marsh cover, and fetch
by the construction of containment cells and bunds within the existing profile. The average
depth of the lake is furthermore increased due to the dredging, despite the partial backfilling
with sand. As a result of these changes different critical loads apply to the situation after
remediation. In table 4.13 the input parameters for scenario 2 are given.
Witteveen+Bos, IND50-2/16-012.096 Final version 03 dated 8 July 2016, Upgradation of Sewage Treatment Plant and related activities at Noor Mohammed Kunta site, Hyderabad, Telangana Drainage and water quality
34
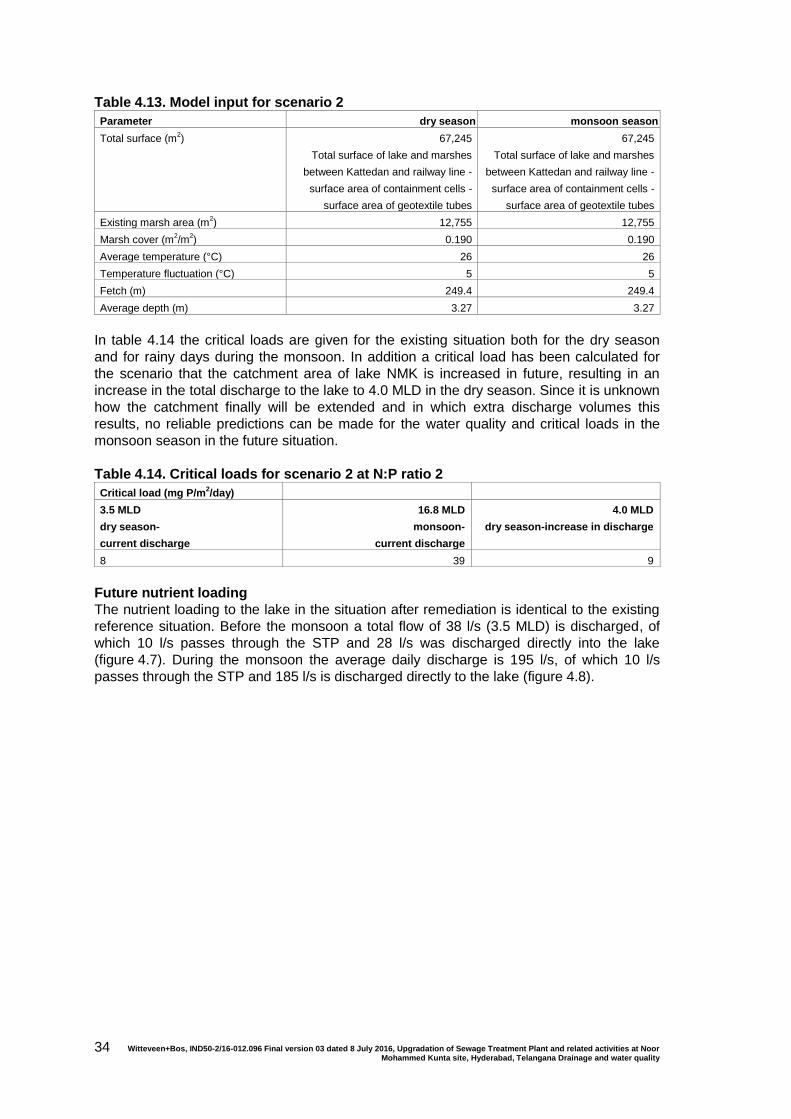
Table 4.13. Model input for scenario 2
Parameter dry season monsoon season
Total surface (m2) 67,245
Total surface of lake and marshes
between Kattedan and railway line -
surface area of containment cells -
surface area of geotextile tubes
67,245
Total surface of lake and marshes
between Kattedan and railway line -
surface area of containment cells -
surface area of geotextile tubes
Existing marsh area (m2) 12,755 12,755
Marsh cover (m2/m
2) 0.190 0.190
Average temperature (°C) 26 26
Temperature fluctuation (°C) 5 5
Fetch (m) 249.4 249.4
Average depth (m) 3.27 3.27
In table 4.14 the critical loads are given for the existing situation both for the dry season
and for rainy days during the monsoon. In addition a critical load has been calculated for
the scenario that the catchment area of lake NMK is increased in future, resulting in an
increase in the total discharge to the lake to 4.0 MLD in the dry season. Since it is unknown
how the catchment finally will be extended and in which extra discharge volumes this
results, no reliable predictions can be made for the water quality and critical loads in the
monsoon season in the future situation.
Table 4.14. Critical loads for scenario 2 at N:P ratio 2
Critical load (mg P/m2/day)
3.5 MLD
dry season-
current discharge
16.8 MLD
monsoon-
current discharge
4.0 MLD
dry season-increase in discharge
8 39 9
Future nutrient loading
The nutrient loading to the lake in the situation after remediation is identical to the existing
reference situation. Before the monsoon a total flow of 38 l/s (3.5 MLD) is discharged, of
which 10 l/s passes through the STP and 28 l/s was discharged directly into the lake
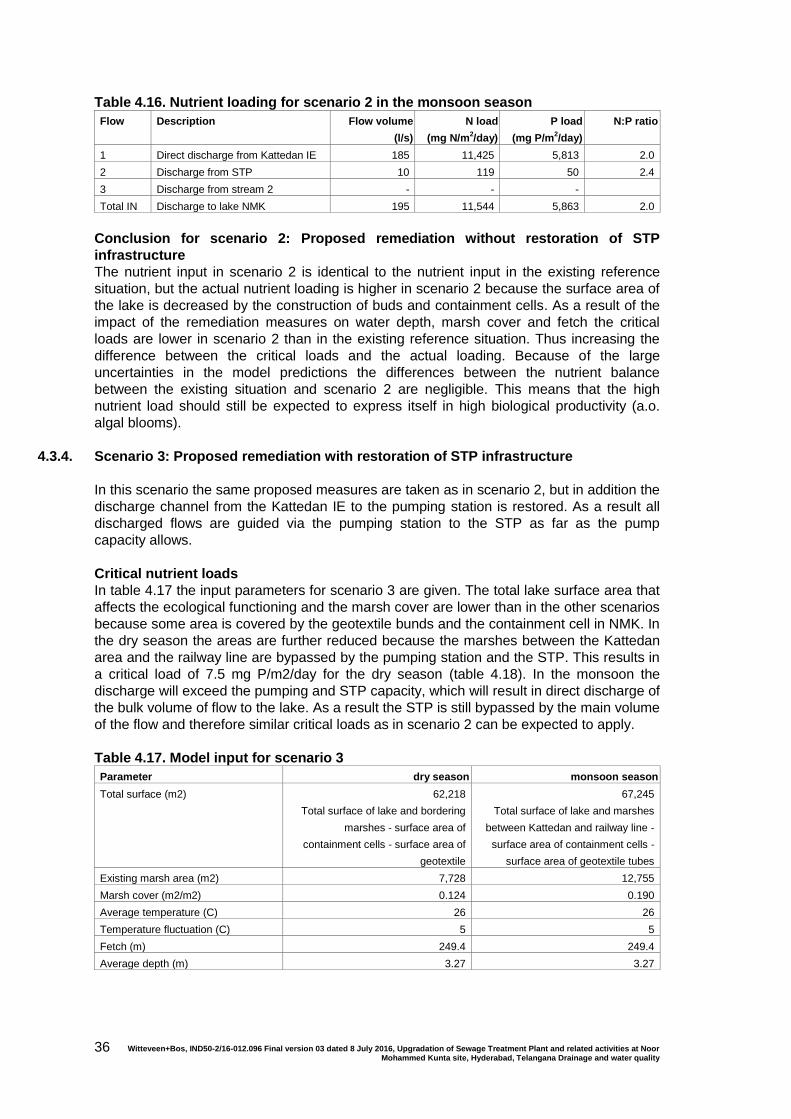
(figure 4.7). During the monsoon the average daily discharge is 195 l/s, of which 10 l/s
passes through the STP and 185 l/s is discharged directly to the lake (figure 4.8).
Witteveen+Bos, IND50-2/16-012.096 Final version 03 dated 8 July 2016, Upgradation of Sewage Treatment Plant and related activities at Noor Mohammed Kunta site, Hyderabad, Telangana Drainage and water quality
35
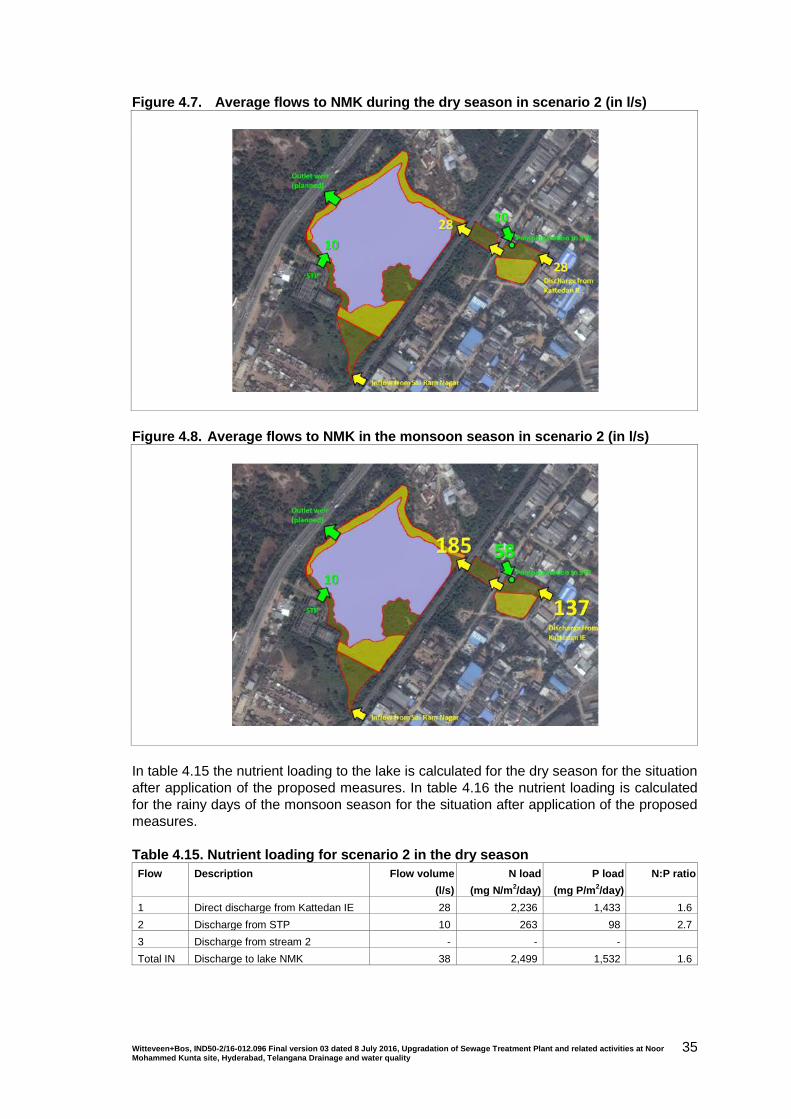
Figure 4.7. Average flows to NMK during the dry season in scenario 2 (in l/s)
Figure 4.8. Average flows to NMK in the monsoon season in scenario 2 (in l/s)
In table 4.15 the nutrient loading to the lake is calculated for the dry season for the situation
after application of the proposed measures. In table 4.16 the nutrient loading is calculated
for the rainy days of the monsoon season for the situation after application of the proposed
measures.
Table 4.15. Nutrient loading for scenario 2 in the dry season
Flow Description Flow volume
(l/s)
N load
(mg N/m2/day)
P load
(mg P/m2/day)
N:P ratio
1 Direct discharge from Kattedan IE 28 2,236 1,433 1.6
2 Discharge from STP 10 263 98 2.7
3 Discharge from stream 2 - - -
Total IN Discharge to lake NMK 38 2,499 1,532 1.6
Witteveen+Bos, IND50-2/16-012.096 Final version 03 dated 8 July 2016, Upgradation of Sewage Treatment Plant and related activities at Noor Mohammed Kunta site, Hyderabad, Telangana Drainage and water quality
36
Table 4.16. Nutrient loading for scenario 2 in the monsoon season
Flow Description Flow volume
(l/s)
N load
(mg N/m2/day)
P load
(mg P/m2/day)
N:P ratio
1 Direct discharge from Kattedan IE 185 11,425 5,813 2.0
2 Discharge from STP 10 119 50 2.4
3 Discharge from stream 2 - - -
Total IN Discharge to lake NMK 195 11,544 5,863 2.0
Conclusion for scenario 2: Proposed remediation without restoration of STP
infrastructure
The nutrient input in scenario 2 is identical to the nutrient input in the existing reference
situation, but the actual nutrient loading is higher in scenario 2 because the surface area of
the lake is decreased by the construction of buds and containment cells. As a result of the
impact of the remediation measures on water depth, marsh cover and fetch the critical
loads are lower in scenario 2 than in the existing reference situation. Thus increasing the
difference between the critical loads and the actual loading. Because of the large
uncertainties in the model predictions the differences between the nutrient balance
between the existing situation and scenario 2 are negligible. This means that the high
nutrient load should still be expected to express itself in high biological productivity (a.o.
algal blooms).
4.3.4. Scenario 3: Proposed remediation with restoration of STP infrastructure
In this scenario the same proposed measures are taken as in scenario 2, but in addition the
discharge channel from the Kattedan IE to the pumping station is restored. As a result all
discharged flows are guided via the pumping station to the STP as far as the pump
capacity allows.
Critical nutrient loads
In table 4.17 the input parameters for scenario 3 are given. The total lake surface area that
affects the ecological functioning and the marsh cover are lower than in the other scenarios
because some area is covered by the geotextile bunds and the containment cell in NMK. In
the dry season the areas are further reduced because the marshes between the Kattedan
area and the railway line are bypassed by the pumping station and the STP. This results in
a critical load of 7.5 mg P/m2/day for the dry season (table 4.18). In the monsoon the
discharge will exceed the pumping and STP capacity, which will result in direct discharge of
the bulk volume of flow to the lake. As a result the STP is still bypassed by the main volume
of the flow and therefore similar critical loads as in scenario 2 can be expected to apply.
Table 4.17. Model input for scenario 3
Parameter dry season monsoon season
Total surface (m2) 62,218
Total surface of lake and bordering
marshes - surface area of
containment cells - surface area of
geotextile
67,245
Total surface of lake and marshes
between Kattedan and railway line -
surface area of containment cells -
surface area of geotextile tubes
Existing marsh area (m2) 7,728 12,755
Marsh cover (m2/m2) 0.124 0.190
Average temperature (C) 26 26
Temperature fluctuation (C) 5 5
Fetch (m) 249.4 249.4
Average depth (m) 3.27 3.27
Witteveen+Bos, IND50-2/16-012.096 Final version 03 dated 8 July 2016, Upgradation of Sewage Treatment Plant and related activities at Noor Mohammed Kunta site, Hyderabad, Telangana Drainage and water quality
37
Table 4.18. Critical loads for scenario 3 at N:P ratio 2
Critical load (mg P/m2/day)
3.5 MLD
dry season - current discharge
16.8 MLD
monsoon - current discharge
4.0 MLD
dry season - increase in discharge
8 39 9
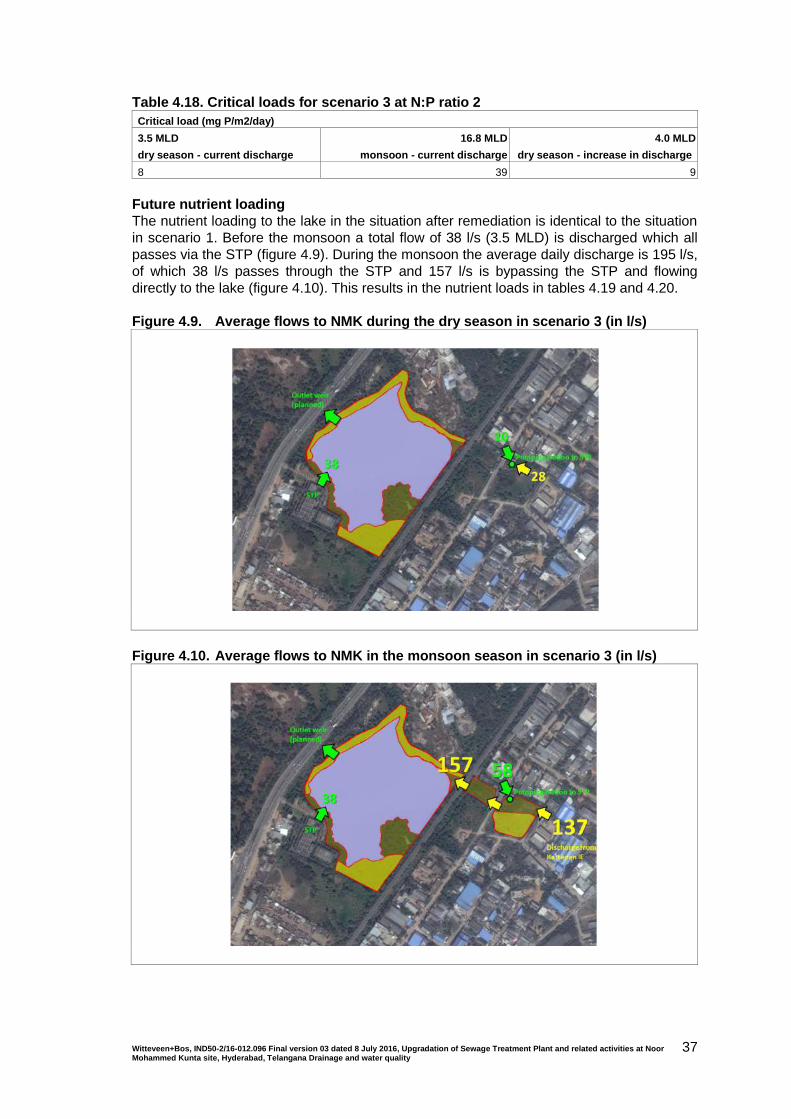
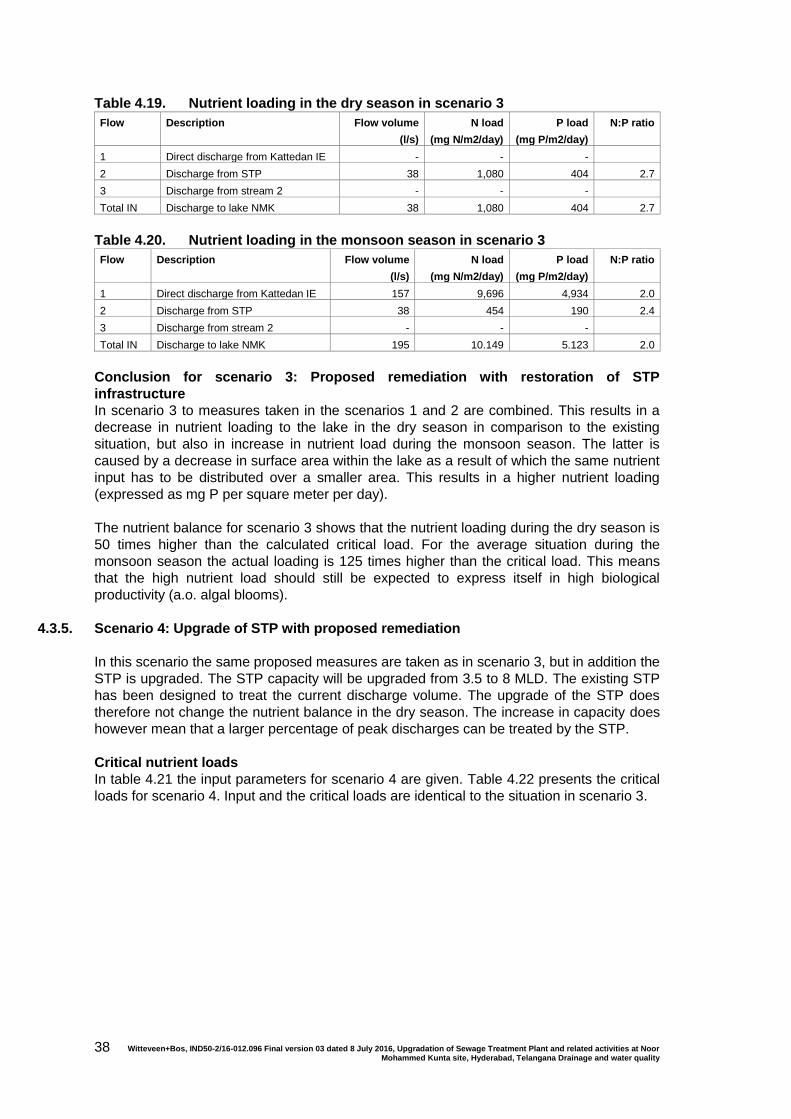
Future nutrient loading
The nutrient loading to the lake in the situation after remediation is identical to the situation
in scenario 1. Before the monsoon a total flow of 38 l/s (3.5 MLD) is discharged which all
passes via the STP (figure 4.9). During the monsoon the average daily discharge is 195 l/s,
of which 38 l/s passes through the STP and 157 l/s is bypassing the STP and flowing
directly to the lake (figure 4.10). This results in the nutrient loads in tables 4.19 and 4.20.
Figure 4.9. Average flows to NMK during the dry season in scenario 3 (in l/s)
Figure 4.10. Average flows to NMK in the monsoon season in scenario 3 (in l/s)
Witteveen+Bos, IND50-2/16-012.096 Final version 03 dated 8 July 2016, Upgradation of Sewage Treatment Plant and related activities at Noor Mohammed Kunta site, Hyderabad, Telangana Drainage and water quality
38
Table 4.19. Nutrient loading in the dry season in scenario 3
Flow Description Flow volume
(l/s)
N load
(mg N/m2/day)
P load
(mg P/m2/day)
N:P ratio
1 Direct discharge from Kattedan IE - - -
2 Discharge from STP 38 1,080 404 2.7
3 Discharge from stream 2 - - -
Total IN Discharge to lake NMK 38 1,080 404 2.7
Table 4.20. Nutrient loading in the monsoon season in scenario 3
Flow Description Flow volume
(l/s)
N load
(mg N/m2/day)
P load
(mg P/m2/day)
N:P ratio
1 Direct discharge from Kattedan IE 157 9,696 4,934 2.0
2 Discharge from STP 38 454 190 2.4
3 Discharge from stream 2 - - -
Total IN Discharge to lake NMK 195 10.149 5.123 2.0
Conclusion for scenario 3: Proposed remediation with restoration of STP
infrastructure
In scenario 3 to measures taken in the scenarios 1 and 2 are combined. This results in a
decrease in nutrient loading to the lake in the dry season in comparison to the existing
situation, but also in increase in nutrient load during the monsoon season. The latter is
caused by a decrease in surface area within the lake as a result of which the same nutrient
input has to be distributed over a smaller area. This results in a higher nutrient loading
(expressed as mg P per square meter per day).
The nutrient balance for scenario 3 shows that the nutrient loading during the dry season is
50 times higher than the calculated critical load. For the average situation during the
monsoon season the actual loading is 125 times higher than the critical load. This means
that the high nutrient load should still be expected to express itself in high biological
productivity (a.o. algal blooms).
4.3.5. Scenario 4: Upgrade of STP with proposed remediation
In this scenario the same proposed measures are taken as in scenario 3, but in addition the
STP is upgraded. The STP capacity will be upgraded from 3.5 to 8 MLD. The existing STP
has been designed to treat the current discharge volume. The upgrade of the STP does
therefore not change the nutrient balance in the dry season. The increase in capacity does
however mean that a larger percentage of peak discharges can be treated by the STP.
Critical nutrient loads
In table 4.21 the input parameters for scenario 4 are given. Table 4.22 presents the critical
loads for scenario 4. Input and the critical loads are identical to the situation in scenario 3.
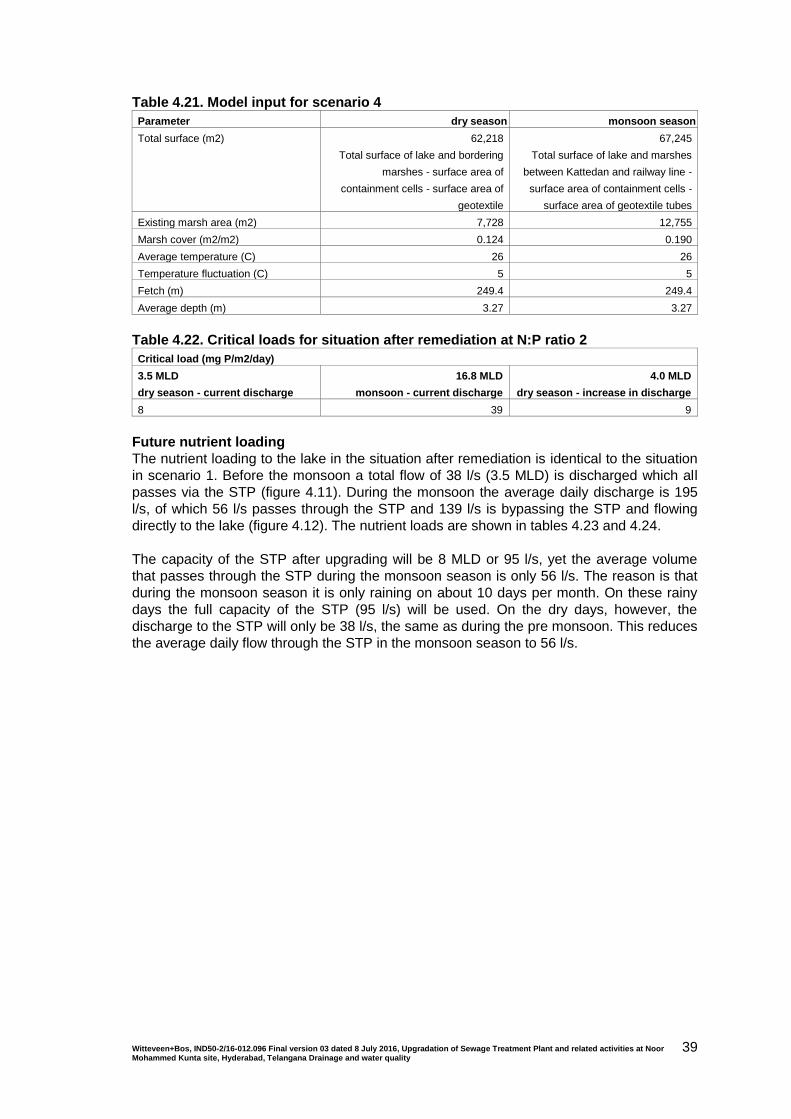
Witteveen+Bos, IND50-2/16-012.096 Final version 03 dated 8 July 2016, Upgradation of Sewage Treatment Plant and related activities at Noor Mohammed Kunta site, Hyderabad, Telangana Drainage and water quality
39
Table 4.21. Model input for scenario 4
Parameter dry season monsoon season
Total surface (m2) 62,218
Total surface of lake and bordering
marshes - surface area of
containment cells - surface area of
geotextile
67,245
Total surface of lake and marshes
between Kattedan and railway line -
surface area of containment cells -
surface area of geotextile tubes
Existing marsh area (m2) 7,728 12,755
Marsh cover (m2/m2) 0.124 0.190
Average temperature (C) 26 26
Temperature fluctuation (C) 5 5
Fetch (m) 249.4 249.4
Average depth (m) 3.27 3.27
Table 4.22. Critical loads for situation after remediation at N:P ratio 2
Critical load (mg P/m2/day)
3.5 MLD
dry season - current discharge
16.8 MLD
monsoon - current discharge
4.0 MLD
dry season - increase in discharge
8 39 9
Future nutrient loading
The nutrient loading to the lake in the situation after remediation is identical to the situation
in scenario 1. Before the monsoon a total flow of 38 l/s (3.5 MLD) is discharged which all
passes via the STP (figure 4.11). During the monsoon the average daily discharge is 195
l/s, of which 56 l/s passes through the STP and 139 l/s is bypassing the STP and flowing
directly to the lake (figure 4.12). The nutrient loads are shown in tables 4.23 and 4.24.
The capacity of the STP after upgrading will be 8 MLD or 95 l/s, yet the average volume
that passes through the STP during the monsoon season is only 56 l/s. The reason is that
during the monsoon season it is only raining on about 10 days per month. On these rainy
days the full capacity of the STP (95 l/s) will be used. On the dry days, however, the
discharge to the STP will only be 38 l/s, the same as during the pre monsoon. This reduces
the average daily flow through the STP in the monsoon season to 56 l/s.
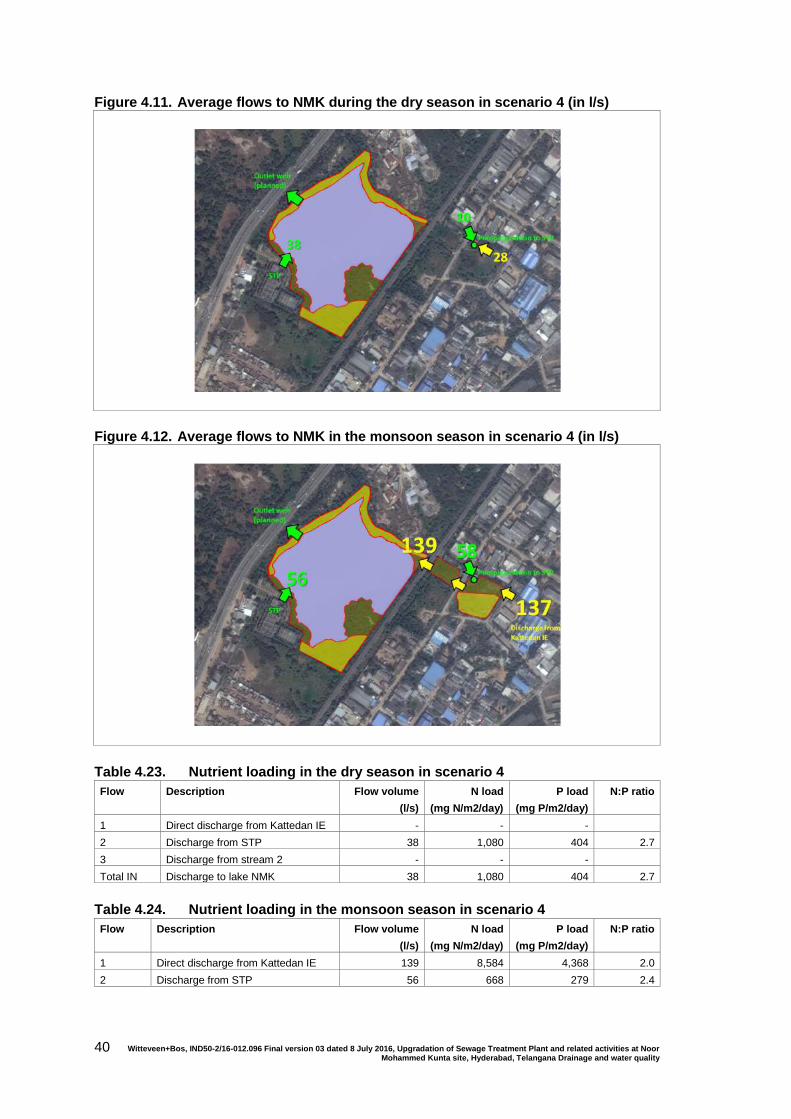
Witteveen+Bos, IND50-2/16-012.096 Final version 03 dated 8 July 2016, Upgradation of Sewage Treatment Plant and related activities at Noor Mohammed Kunta site, Hyderabad, Telangana Drainage and water quality
40
Figure 4.11. Average flows to NMK during the dry season in scenario 4 (in l/s)
Figure 4.12. Average flows to NMK in the monsoon season in scenario 4 (in l/s)
Table 4.23. Nutrient loading in the dry season in scenario 4
Flow Description Flow volume
(l/s)
N load
(mg N/m2/day)
P load
(mg P/m2/day)
N:P ratio
1 Direct discharge from Kattedan IE - - -
2 Discharge from STP 38 1,080 404 2.7
3 Discharge from stream 2 - - -
Total IN Discharge to lake NMK 38 1,080 404 2.7
Table 4.24. Nutrient loading in the monsoon season in scenario 4
Flow Description Flow volume
(l/s)
N load
(mg N/m2/day)
P load
(mg P/m2/day)
N:P ratio
1 Direct discharge from Kattedan IE 139 8,584 4,368 2.0
2 Discharge from STP 56 668 279 2.4
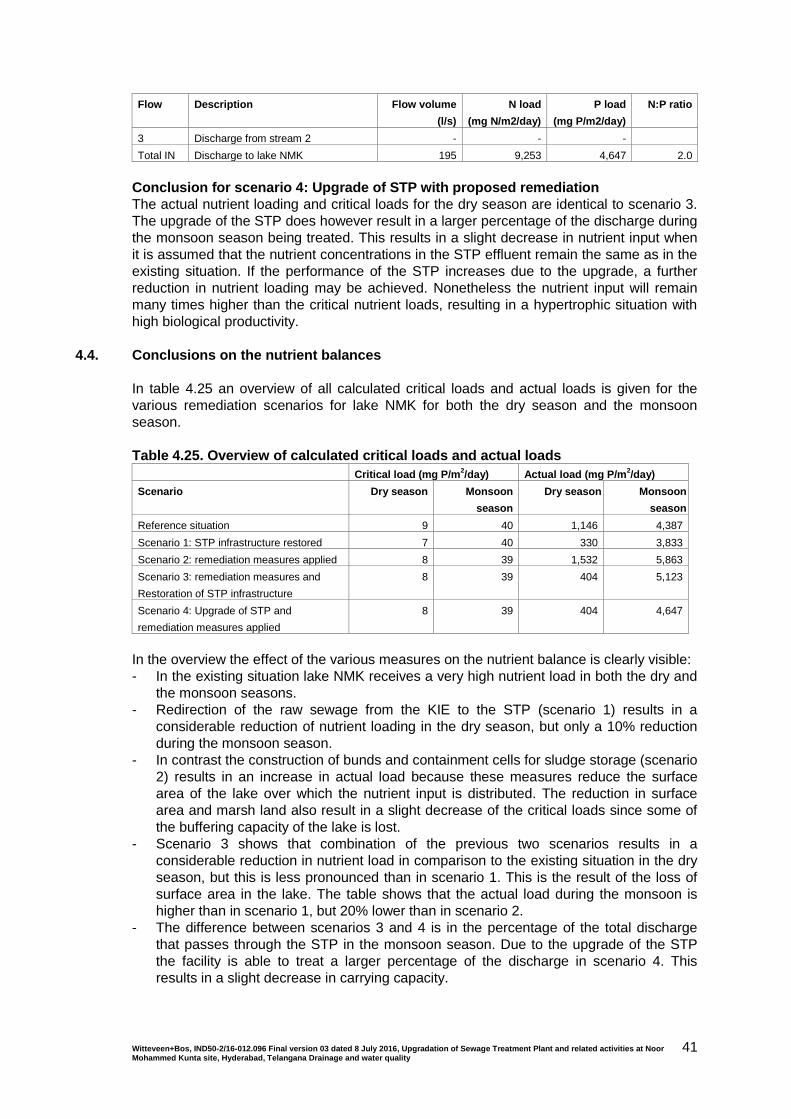
Witteveen+Bos, IND50-2/16-012.096 Final version 03 dated 8 July 2016, Upgradation of Sewage Treatment Plant and related activities at Noor Mohammed Kunta site, Hyderabad, Telangana Drainage and water quality
41
Flow Description Flow volume
(l/s)
N load
(mg N/m2/day)
P load
(mg P/m2/day)
N:P ratio
3 Discharge from stream 2 - - -
Total IN Discharge to lake NMK 195 9,253 4,647 2.0
Conclusion for scenario 4: Upgrade of STP with proposed remediation
The actual nutrient loading and critical loads for the dry season are identical to scenario 3.
The upgrade of the STP does however result in a larger percentage of the discharge during
the monsoon season being treated. This results in a slight decrease in nutrient input when
it is assumed that the nutrient concentrations in the STP effluent remain the same as in the
existing situation. If the performance of the STP increases due to the upgrade, a further
reduction in nutrient loading may be achieved. Nonetheless the nutrient input will remain
many times higher than the critical nutrient loads, resulting in a hypertrophic situation with
high biological productivity.
4.4. Conclusions on the nutrient balances
In table 4.25 an overview of all calculated critical loads and actual loads is given for the
various remediation scenarios for lake NMK for both the dry season and the monsoon
season.
Table 4.25. Overview of calculated critical loads and actual loads
Critical load (mg P/m2/day) Actual load (mg P/m
2/day)
Scenario Dry season Monsoon
season
Dry season Monsoon
season
Reference situation 9 40 1,146 4,387
Scenario 1: STP infrastructure restored 7 40 330 3,833
Scenario 2: remediation measures applied 8 39 1,532 5,863
Scenario 3: remediation measures and
Restoration of STP infrastructure
8 39 404 5,123
Scenario 4: Upgrade of STP and
remediation measures applied
8 39 404 4,647
In the overview the effect of the various measures on the nutrient balance is clearly visible:
- In the existing situation lake NMK receives a very high nutrient load in both the dry and
the monsoon seasons.
- Redirection of the raw sewage from the KIE to the STP (scenario 1) results in a
considerable reduction of nutrient loading in the dry season, but only a 10% reduction
during the monsoon season.
- In contrast the construction of bunds and containment cells for sludge storage (scenario
2) results in an increase in actual load because these measures reduce the surface
area of the lake over which the nutrient input is distributed. The reduction in surface
area and marsh land also result in a slight decrease of the critical loads since some of
the buffering capacity of the lake is lost.
- Scenario 3 shows that combination of the previous two scenarios results in a
considerable reduction in nutrient load in comparison to the existing situation in the dry
season, but this is less pronounced than in scenario 1. This is the result of the loss of
surface area in the lake. The table shows that the actual load during the monsoon is
higher than in scenario 1, but 20% lower than in scenario 2.
- The difference between scenarios 3 and 4 is in the percentage of the total discharge
that passes through the STP in the monsoon season. Due to the upgrade of the STP
the facility is able to treat a larger percentage of the discharge in scenario 4. This
results in a slight decrease in carrying capacity.

Witteveen+Bos, IND50-2/16-012.096 Final version 03 dated 8 July 2016, Upgradation of Sewage Treatment Plant and related activities at Noor Mohammed Kunta site, Hyderabad, Telangana Drainage and water quality
42
The effect of the measures on the critical load is negligible since the actual loads to lake
NMK exceed the critical P loads by far. In none of the scenarios does the actual loading
approach the critical load. In all situations the existing eutrophicated state will remain and
ecological restoration will not take place.
The table shows that the critical P loads decrease considerably by restoration of the
channel leading from the KIE to the STP pumping station (scenarios 1 and 3). Despite this
decrease the difference between critical and actual loads is smallest for these scenarios
because the P concentrations in the STP effluent are low in comparison to the P
concentrations in the directly discharges waters. Yet, the actual loads are still 50 times
higher than the critical loads when the current STP performance is assumed. An increase
in the STP performance would result in a decrease in P concentrations in the STP effluent
and will therefore bring the actual load closer to the critical load. The STP performance
would however have to be very drastically improved to bring the actual load within reach of
the critical loads for the dry season.
The calculated nutrient loads to lake are based on the nutrient concentrations that were
found during sampling of the existing situation in the pre monsoon and the monsoon
seasons. This means that also for scenario 4, in which the STP will be upgraded, the
calculations assume that the nutrient concentrations in the effluent remain unchanged. To
achieve a good ecological water quality, the total nutrient load to the lake should be below
the critical load. For the dry season this means that the nutrient load should be below 8 mg
P/m2/day. In scenario 4 the entire base flow of 38 l/s passes through the STP. With this
flow the P concentration in the STP effluent should be below 0.15 mg P/l (currently 7.66 mg
P/l) to meet the critical nutrient load in the dry season. In the monsoon season the bulk of
the nutrient load to the lake results from direct untreated discharges. This nutrient load due
to direct discharges alone already exceeds the critical nutrient load of the lake.
Effect of peak discharges
For the ecological functioning of lake NMK the situation during the monsoon is a dominant
factor. Table 4.23 shows that the average actual load during the monsoon is extremely high
amounting to 4,000 to 6,000 mg P/m2/day. For all scenarios this is 100 to 150 times higher
than the critical loads. In this calculation both the dry and the rainy days within the
monsoon are taken into account. During the rainy days the nutrient loading to the lake will
be even higher.
It is important to be aware that temporary increase in nutrient load can have an impact on
the nutrient balance for a much longer period. The water volume of a peak discharge
(whether or not connected to rainfall) will pass through the lake within a relatively short
timeframe. It is likely that a considerable part of the nutrient loading will be transported with
the water and pass the lake within a short timeframe as well. It has to be anticipated
however that part of the nutrient load remains within the lake due to bonding to organic
matter and sediments. This may occur to a larger extent to clean sediments after
remediation. Even if a small percentage of the nutrient load of a peak event stays behind in
the lake, this is already likely to result in an nutrient loading that exceeds the critical loads.
It is however difficult to assess this effect since critical loads can only be calculated for
longer time scales and not for peak events. A similar time lag will occur between the
seasons with the impact of higher nutrient loading during the monsoon season influencing
the water balance of the following dry season.
High nutrient load to lake NMK due to direct discharges can occur due to rainfall, but can
also occur as a result of illegal discharges. The results of such an illegal discharge were
witnessed during the field work in the dry season.
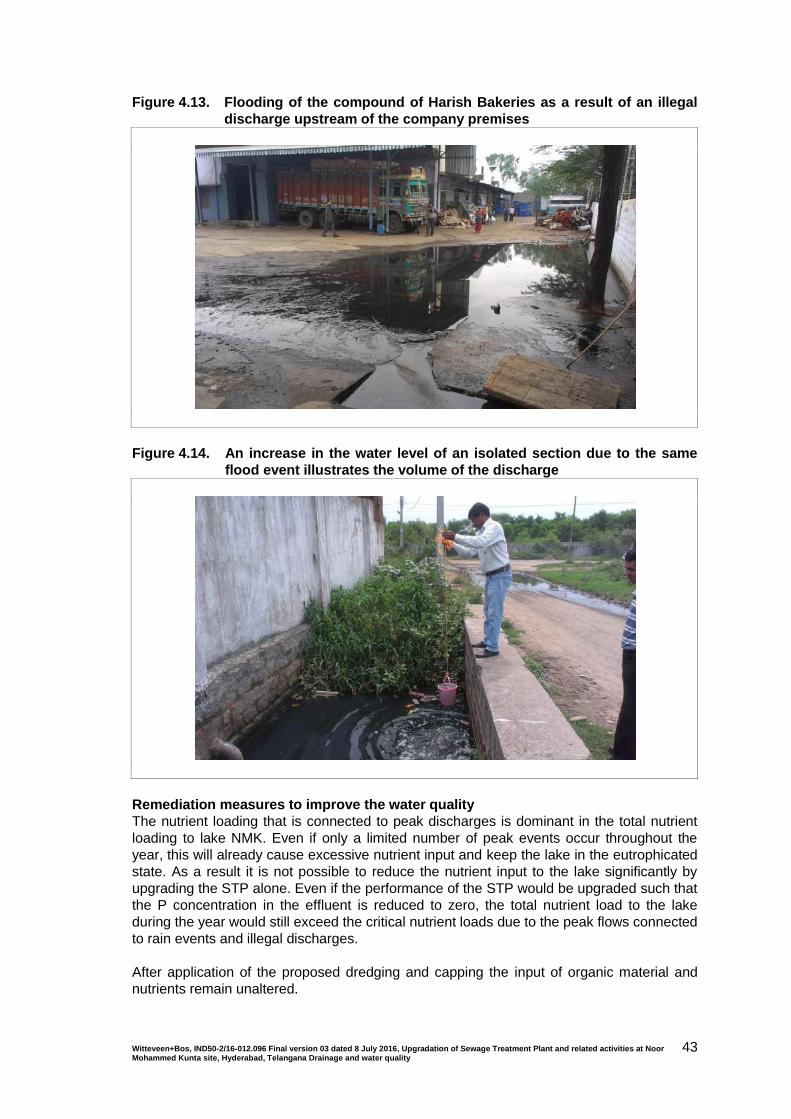
Witteveen+Bos, IND50-2/16-012.096 Final version 03 dated 8 July 2016, Upgradation of Sewage Treatment Plant and related activities at Noor Mohammed Kunta site, Hyderabad, Telangana Drainage and water quality
43
Figure 4.13. Flooding of the compound of Harish Bakeries as a result of an illegal
discharge upstream of the company premises
Figure 4.14. An increase in the water level of an isolated section due to the same
flood event illustrates the volume of the discharge
Remediation measures to improve the water quality
The nutrient loading that is connected to peak discharges is dominant in the total nutrient
loading to lake NMK. Even if only a limited number of peak events occur throughout the
year, this will already cause excessive nutrient input and keep the lake in the eutrophicated
state. As a result it is not possible to reduce the nutrient input to the lake significantly by
upgrading the STP alone. Even if the performance of the STP would be upgraded such that
the P concentration in the effluent is reduced to zero, the total nutrient load to the lake
during the year would still exceed the critical nutrient loads due to the peak flows connected
to rain events and illegal discharges.
After application of the proposed dredging and capping the input of organic material and
nutrients remain unaltered.
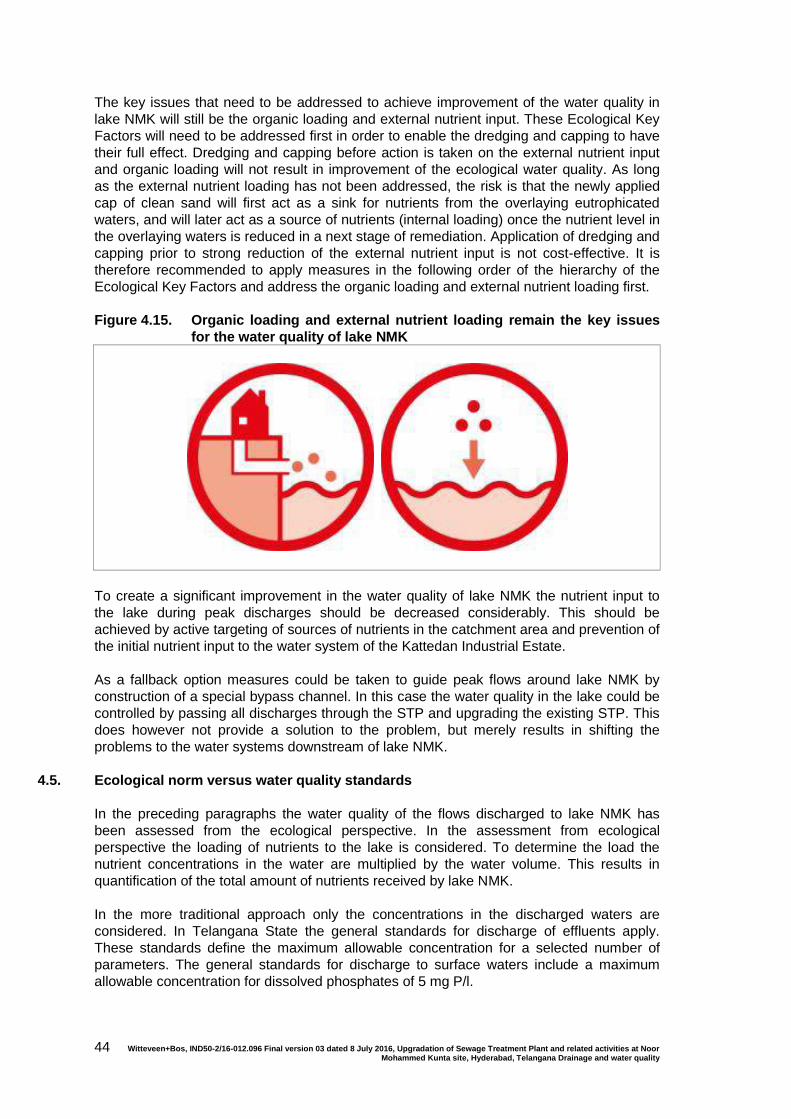
Witteveen+Bos, IND50-2/16-012.096 Final version 03 dated 8 July 2016, Upgradation of Sewage Treatment Plant and related activities at Noor Mohammed Kunta site, Hyderabad, Telangana Drainage and water quality
44
The key issues that need to be addressed to achieve improvement of the water quality in
lake NMK will still be the organic loading and external nutrient input. These Ecological Key
Factors will need to be addressed first in order to enable the dredging and capping to have
their full effect. Dredging and capping before action is taken on the external nutrient input
and organic loading will not result in improvement of the ecological water quality. As long
as the external nutrient loading has not been addressed, the risk is that the newly applied
cap of clean sand will first act as a sink for nutrients from the overlaying eutrophicated
waters, and will later act as a source of nutrients (internal loading) once the nutrient level in
the overlaying waters is reduced in a next stage of remediation. Application of dredging and
capping prior to strong reduction of the external nutrient input is not cost-effective. It is
therefore recommended to apply measures in the following order of the hierarchy of the
Ecological Key Factors and address the organic loading and external nutrient loading first.
Figure 4.15. Organic loading and external nutrient loading remain the key issues
for the water quality of lake NMK
To create a significant improvement in the water quality of lake NMK the nutrient input to
the lake during peak discharges should be decreased considerably. This should be
achieved by active targeting of sources of nutrients in the catchment area and prevention of
the initial nutrient input to the water system of the Kattedan Industrial Estate.
As a fallback option measures could be taken to guide peak flows around lake NMK by
construction of a special bypass channel. In this case the water quality in the lake could be
controlled by passing all discharges through the STP and upgrading the existing STP. This
does however not provide a solution to the problem, but merely results in shifting the
problems to the water systems downstream of lake NMK.
4.5. Ecological norm versus water quality standards
In the preceding paragraphs the water quality of the flows discharged to lake NMK has
been assessed from the ecological perspective. In the assessment from ecological
perspective the loading of nutrients to the lake is considered. To determine the load the
nutrient concentrations in the water are multiplied by the water volume. This results in
quantification of the total amount of nutrients received by lake NMK.
In the more traditional approach only the concentrations in the discharged waters are
considered. In Telangana State the general standards for discharge of effluents apply.
These standards define the maximum allowable concentration for a selected number of
parameters. The general standards for discharge to surface waters include a maximum
allowable concentration for dissolved phosphates of 5 mg P/l.
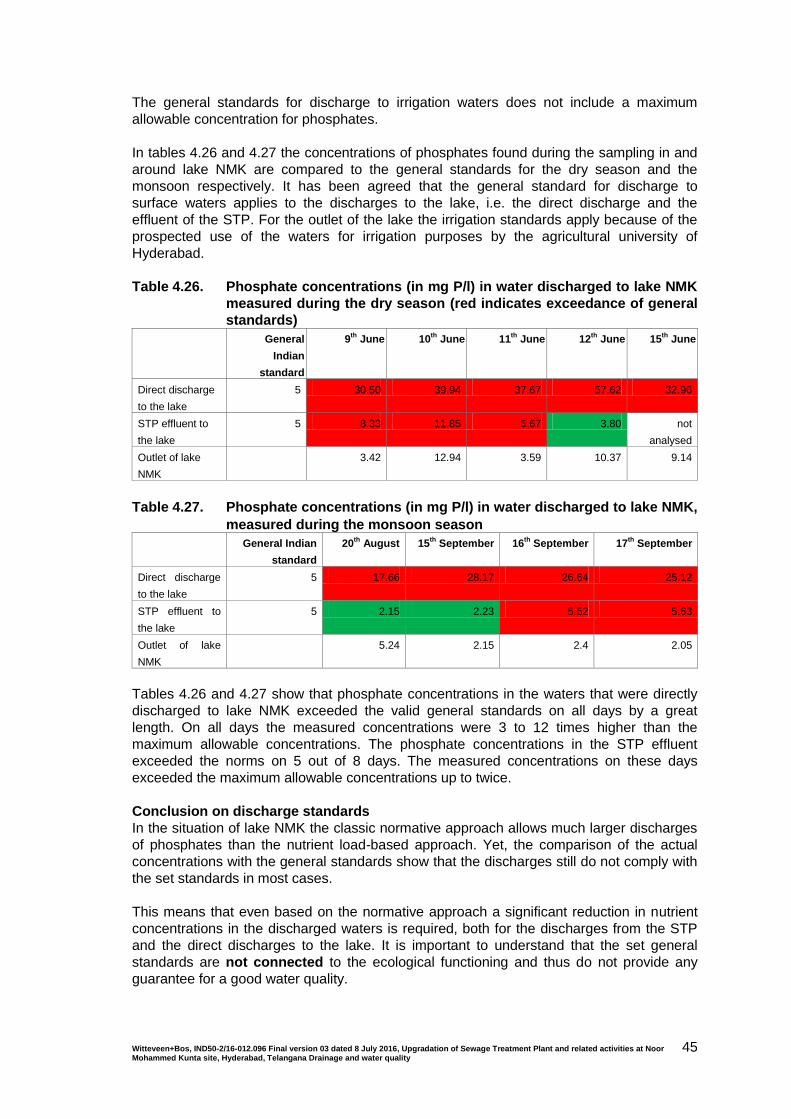
Witteveen+Bos, IND50-2/16-012.096 Final version 03 dated 8 July 2016, Upgradation of Sewage Treatment Plant and related activities at Noor Mohammed Kunta site, Hyderabad, Telangana Drainage and water quality
45
The general standards for discharge to irrigation waters does not include a maximum
allowable concentration for phosphates.
In tables 4.26 and 4.27 the concentrations of phosphates found during the sampling in and
around lake NMK are compared to the general standards for the dry season and the
monsoon respectively. It has been agreed that the general standard for discharge to
surface waters applies to the discharges to the lake, i.e. the direct discharge and the
effluent of the STP. For the outlet of the lake the irrigation standards apply because of the
prospected use of the waters for irrigation purposes by the agricultural university of
Hyderabad.
Table 4.26. Phosphate concentrations (in mg P/l) in water discharged to lake NMK
measured during the dry season (red indicates exceedance of general
standards)
General
Indian
standard
9th
June 10th
June 11th
June 12th
June 15th
June
Direct discharge
to the lake
5 30.50 39.94 37.67 57.62 32.96
STP effluent to
the lake
5 8.33 11.85 6.67 3.80 not
analysed
Outlet of lake
NMK
3.42 12.94 3.59 10.37 9.14
Table 4.27. Phosphate concentrations (in mg P/l) in water discharged to lake NMK,
measured during the monsoon season
General Indian
standard
20th
August 15th
September 16th
September 17th
September
Direct discharge
to the lake
5 17.66 28.17 26.64 25.12
STP effluent to
the lake
5 2.15 2.23 5.52 5.63
Outlet of lake
NMK
5.24 2.15 2.4 2.05
Tables 4.26 and 4.27 show that phosphate concentrations in the waters that were directly
discharged to lake NMK exceeded the valid general standards on all days by a great
length. On all days the measured concentrations were 3 to 12 times higher than the
maximum allowable concentrations. The phosphate concentrations in the STP effluent
exceeded the norms on 5 out of 8 days. The measured concentrations on these days
exceeded the maximum allowable concentrations up to twice.
Conclusion on discharge standards
In the situation of lake NMK the classic normative approach allows much larger discharges
of phosphates than the nutrient load-based approach. Yet, the comparison of the actual
concentrations with the general standards show that the discharges still do not comply with
the set standards in most cases.
This means that even based on the normative approach a significant reduction in nutrient
concentrations in the discharged waters is required, both for the discharges from the STP
and the direct discharges to the lake. It is important to understand that the set general
standards are not connected to the ecological functioning and thus do not provide any
guarantee for a good water quality.

Witteveen+Bos, IND50-2/16-012.096 Final version 03 dated 8 July 2016, Upgradation of Sewage Treatment Plant and related activities at Noor Mohammed Kunta site, Hyderabad, Telangana Drainage and water quality
46
As pointed out in paragraph 4.4, assessment of the discharges based on nutrient loading
shows that reduction of the nutrient concentrations in the effluent of the STP alone is
insufficient to improve the water quality of lake NMK sufficiently. The nutrient
concentrations in both the effluent of the STP and the direct discharges to the lake (also
during peak events) need to be reduced beyond the set Indian standard to enable
improvement of the ecological water quality.
Witteveen+Bos, IND50-2/16-012.096 Final version 03 dated 8 July 2016, Upgradation of Sewage Treatment Plant and related activities at Noor Mohammed Kunta site, Hyderabad, Telangana Drainage and water quality
47
5. GAP ANALYSIS
The previous chapters have clearly shown that the present drainage system is of
insufficient capacity to prevent flooding and maintain a good water quality. The rain events
in the area can be extreme with large volumes of water in a short time, putting a lot of
pressure on the system. In this chapter the findings from the previous chapters are used to
describe weak points in the system and provide recommendations for strengthening it.
5.1. Weaknesses
Discharge volumes and quality
The key issue for the water quality in lake NMK is that the lake is receiving an overload of
nutrients. This excessive nutrient load is the result of high nutrient concentrations in both
the direct discharges to the lake and the effluent of the STP as well as the high discharge
volumes.
Only a small percentage of waste waters is passing through the STP. Most waters are
discharged directly into the lake as a result of blockage in the connection to the STP
pumping station and breaches in the channel wall. During peak discharges the percentage
of the total discharge that passes through the STP becomes marginal. As a result the
nutrient removal has no significance for the total nutrient loading to the lake.
STP performance
At present the STP effluent does not meet the set standards for discharge to surface
waters. Furthermore the nutrient loading from the STP effluent is exceeding the critical
loads for lake NMK in the existing situation. This is the result of the relatively low critical
loads due to the large volume of the direct discharges to the lake.
Canal capacities
The hydrological model has shown that the system is capable of carrying base flows to the
STP without causing overflows or flooding. During storm events however, the drains fill up
very quickly and the excess water floods the areas around the drains. The flooding is worst
along stream 1 because the highest flow volume flows through this stream (around 80%).
During a heavy rainstorm stream 1 fills up quickly, resulting in much of the runoff water
ponding on the streets or running off over land. Especially downstream, near the pumping
station, the canals cannot cope with the flow of water and they flood for periods of 6 to 12
hours, after the start of a storm event. Large volumes flow over land to the first wastewater
pond. Presently all this water, which is contaminated with sewerage and industrial waste,
bypasses the pumping station and flows to the lake.
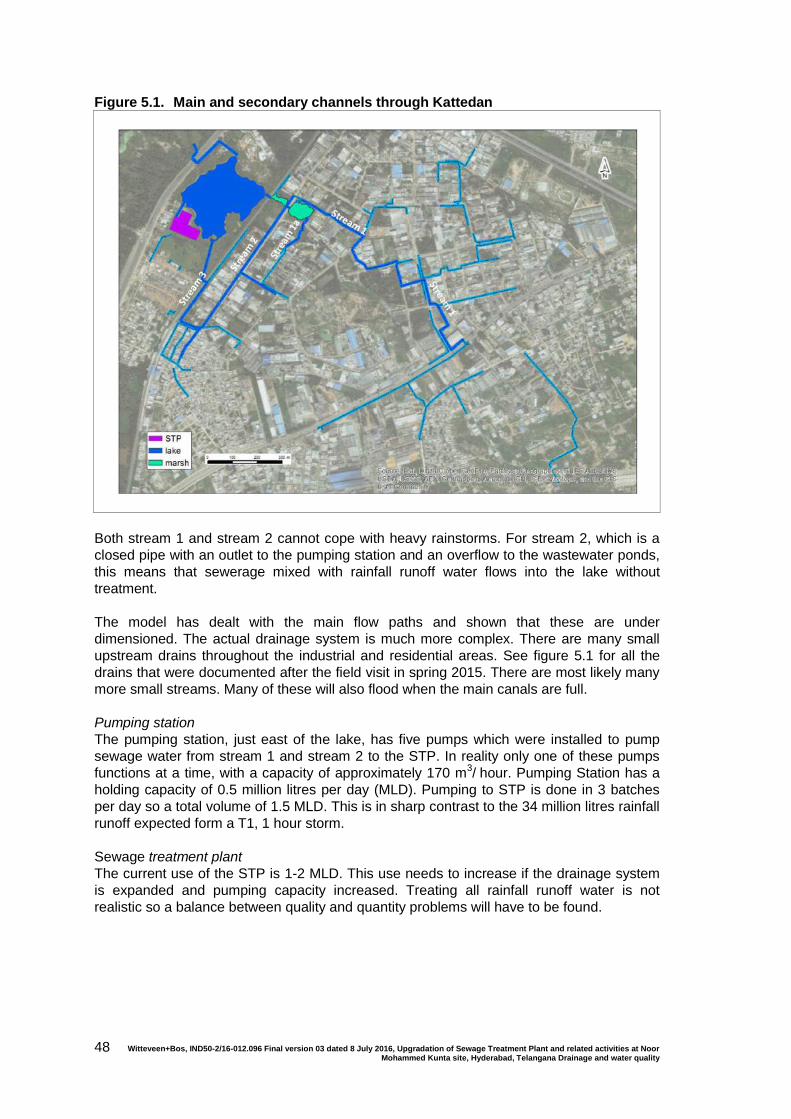
Witteveen+Bos, IND50-2/16-012.096 Final version 03 dated 8 July 2016, Upgradation of Sewage Treatment Plant and related activities at Noor Mohammed Kunta site, Hyderabad, Telangana Drainage and water quality
48
Figure 5.1. Main and secondary channels through Kattedan
Both stream 1 and stream 2 cannot cope with heavy rainstorms. For stream 2, which is a
closed pipe with an outlet to the pumping station and an overflow to the wastewater ponds,
this means that sewerage mixed with rainfall runoff water flows into the lake without
treatment.
The model has dealt with the main flow paths and shown that these are under
dimensioned. The actual drainage system is much more complex. There are many small
upstream drains throughout the industrial and residential areas. See figure 5.1 for all the
drains that were documented after the field visit in spring 2015. There are most likely many
more small streams. Many of these will also flood when the main canals are full.
Pumping station
The pumping station, just east of the lake, has five pumps which were installed to pump
sewage water from stream 1 and stream 2 to the STP. In reality only one of these pumps
functions at a time, with a capacity of approximately 170 m3/ hour. Pumping Station has a
holding capacity of 0.5 million litres per day (MLD). Pumping to STP is done in 3 batches
per day so a total volume of 1.5 MLD. This is in sharp contrast to the 34 million litres rainfall
runoff expected form a T1, 1 hour storm.
Sewage treatment plant
The current use of the STP is 1-2 MLD. This use needs to increase if the drainage system
is expanded and pumping capacity increased. Treating all rainfall runoff water is not
realistic so a balance between quality and quantity problems will have to be found.
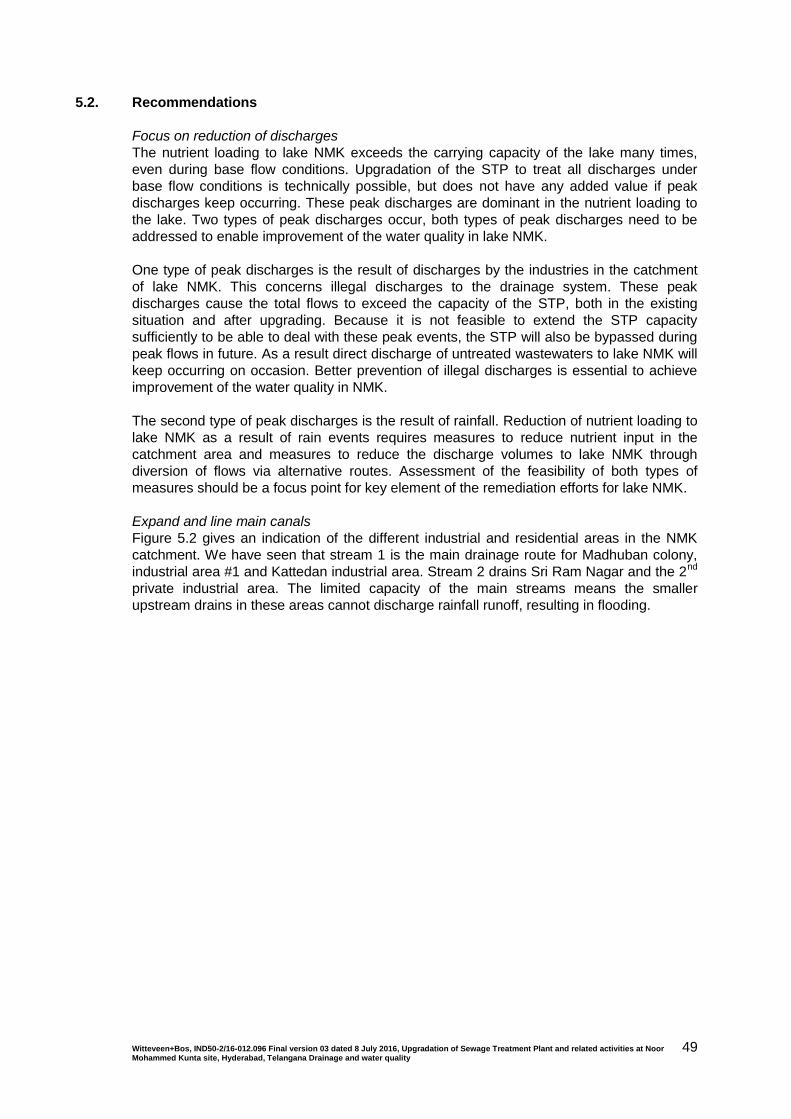
Witteveen+Bos, IND50-2/16-012.096 Final version 03 dated 8 July 2016, Upgradation of Sewage Treatment Plant and related activities at Noor Mohammed Kunta site, Hyderabad, Telangana Drainage and water quality
49
5.2. Recommendations
Focus on reduction of discharges
The nutrient loading to lake NMK exceeds the carrying capacity of the lake many times,
even during base flow conditions. Upgradation of the STP to treat all discharges under
base flow conditions is technically possible, but does not have any added value if peak
discharges keep occurring. These peak discharges are dominant in the nutrient loading to
the lake. Two types of peak discharges occur, both types of peak discharges need to be
addressed to enable improvement of the water quality in lake NMK.
One type of peak discharges is the result of discharges by the industries in the catchment
of lake NMK. This concerns illegal discharges to the drainage system. These peak
discharges cause the total flows to exceed the capacity of the STP, both in the existing
situation and after upgrading. Because it is not feasible to extend the STP capacity
sufficiently to be able to deal with these peak events, the STP will also be bypassed during
peak flows in future. As a result direct discharge of untreated wastewaters to lake NMK will
keep occurring on occasion. Better prevention of illegal discharges is essential to achieve
improvement of the water quality in NMK.
The second type of peak discharges is the result of rainfall. Reduction of nutrient loading to
lake NMK as a result of rain events requires measures to reduce nutrient input in the
catchment area and measures to reduce the discharge volumes to lake NMK through
diversion of flows via alternative routes. Assessment of the feasibility of both types of
measures should be a focus point for key element of the remediation efforts for lake NMK.
Expand and line main canals
Figure 5.2 gives an indication of the different industrial and residential areas in the NMK
catchment. We have seen that stream 1 is the main drainage route for Madhuban colony,
industrial area #1 and Kattedan industrial area. Stream 2 drains Sri Ram Nagar and the 2nd
private industrial area. The limited capacity of the main streams means the smaller
upstream drains in these areas cannot discharge rainfall runoff, resulting in flooding.

Witteveen+Bos, IND50-2/16-012.096 Final version 03 dated 8 July 2016, Upgradation of Sewage Treatment Plant and related activities at Noor Mohammed Kunta site, Hyderabad, Telangana Drainage and water quality
50
Figure 5.2. Catchment areas
The most effective way to improve this situation is to increase the main stream capacities. It
is advisable to construct larger, lined canals that are able to transport at least a T1 rain
event. This way upstream flooding can be minimised. Furthermore the connection between
stream 1 with the pumping station and with the STP should be reopened so that the water
can be treated before it flows to the lake. Stream 1a is an earth canal, which mainly
functions after rain events to transport runoff water. This stream needs to be expanded and
lined and connected to stream 1 or directly to the pumping station because it discharges
waste water.
Connect Nataji Negar and truck area
In reality the flow though stream 3 goes through a series of overland, earth drains (see
appendix I, figure 21). This flow is a combination of runoff, sewage from Netaji Negar and
industrial wastewater from the truck workshop area. Ideally a sewage system would be
constructed to direct these flows to the STP for treatment.
Increase pumping station and STP capacity
Treating all the rainfall runoff is not a realistic option and would ask for a very large STP. An
economically more viable option is to design it to treat the ‘first flush’ of a T1 rain event
because the first flush of a rain event is the most contaminated. It is advisable to expand
the pumping station and STP to transport and treat the estimated dry weather discharge,
including some additional capacity to deal with at least 20% of a T1, 1 hour rain event. This
is equal to about 7 MLD. To transport this volume to the STP in three daily cycles storage
facilities will be needed to hold 7% (2.1 MLD) of the water form a T1 storm
Separate drainage systems
Even with an increased STP capacity, most water from the mixed drains will flow untreated
to the lake. To improve this situation we suggest to start transforming the mixed drainage
system to separate systems for waste water and rainfall runoff. We expect that this will be
difficult for most parts of the system. For stream 2 this will be easier because the connected
area is less complex and already partly connected to a sewage line.

Witteveen+Bos, IND50-2/16-012.096 Final version 03 dated 8 July 2016, Upgradation of Sewage Treatment Plant and related activities at Noor Mohammed Kunta site, Hyderabad, Telangana Drainage and water quality
51
6. REFERENCES
1. Ahmed A. et al. (2012) Rainfall intensity variation for observed data and derived data -
a case study of Imphal. ARPN Journal of Engineering and Applied Sciences. Table 3.
2. Elevation map of project area.
3. Witteveen+Bos (2012) Preliminary site investigation, final report. Reference: IND50-
1_067.
4. Witteveen+Bos (2013) Remediation plan for NMK - final. Reference: IND50-1_099.
5. IGEP (2012), Preliminary Report on “Rapid Assessment of Sources of Pollution of Noor
Mohammed Kunta”.


Witteveen+Bos, appendix I belongs to report IND50-2/16-012.096 dated 8 July 2016
APPENDIX I PICTURES OF THE CATCHMENT AREA

Witteveen+Bos, appendix I belongs to report IND50-2/16-012.096 dated 8 July 2016
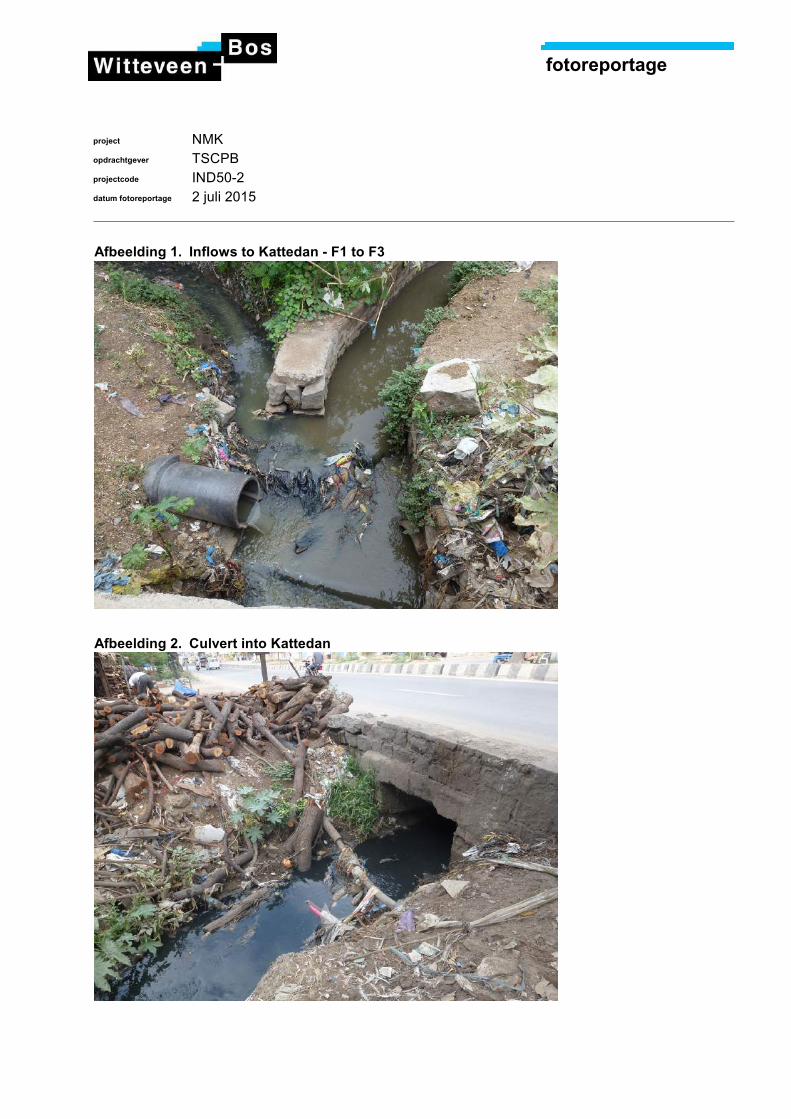
fotoreportage
project
opdrachtgever
projectcode
datum fotoreportage
NMK
TSCPB
IND50-2
2 juli 2015
Afbeelding 1. Inflows to Kattedan - F1 to F3
Afbeelding 2. Culvert into Kattedan
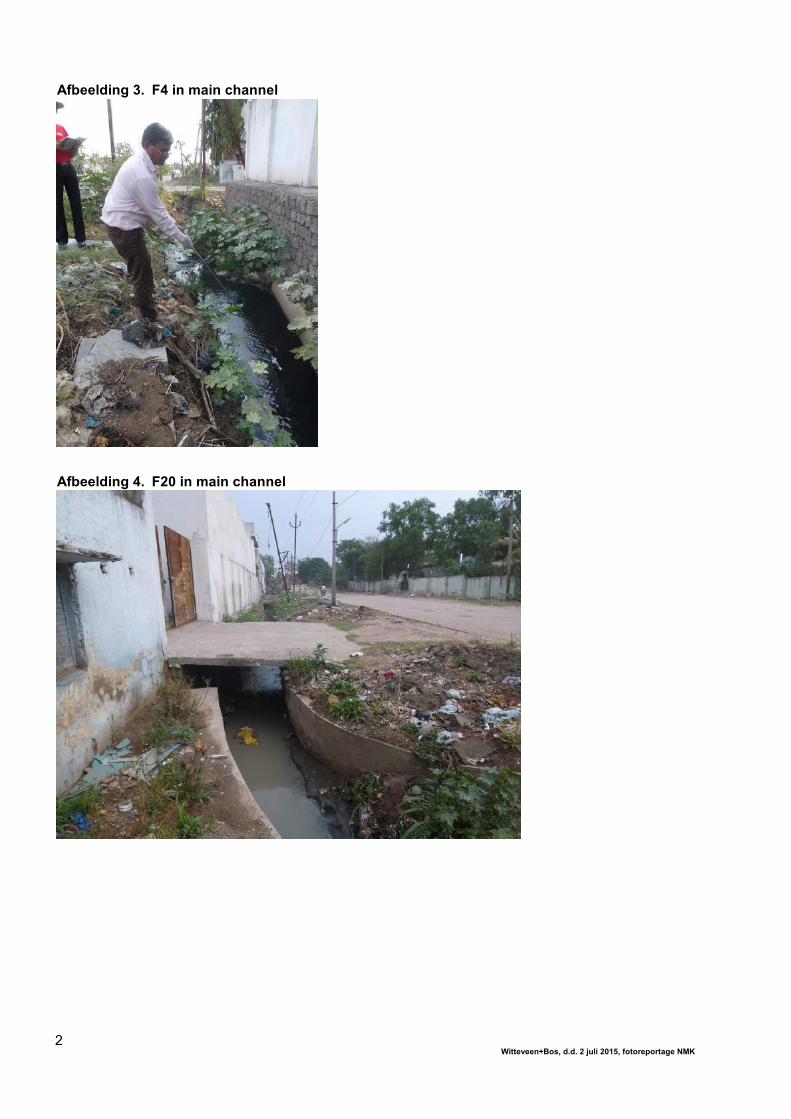
Witteveen+Bos, d.d. 2 juli 2015, fotoreportage NMK2
Afbeelding 3. F4 in main channel
Afbeelding 4. F20 in main channel
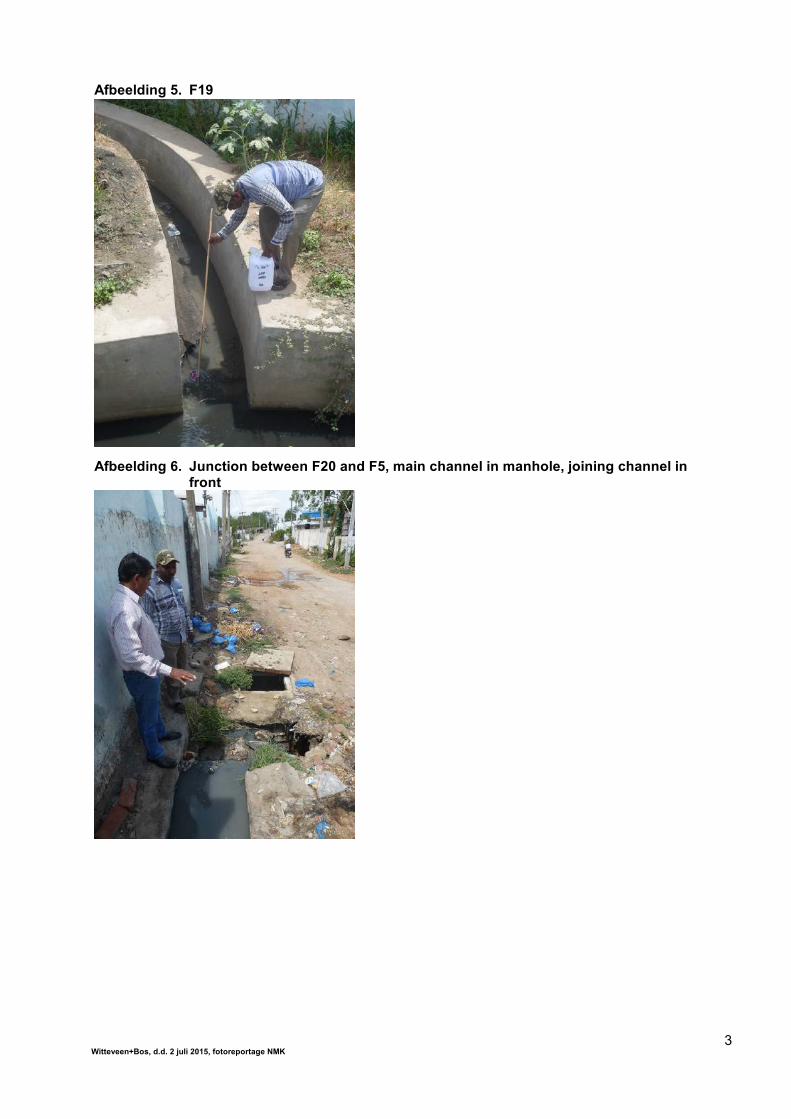
Witteveen+Bos, d.d. 2 juli 2015, fotoreportage NMK3
Afbeelding 5. F19
Afbeelding 6. Junction between F20 and F5, main channel in manhole, joining channel in front
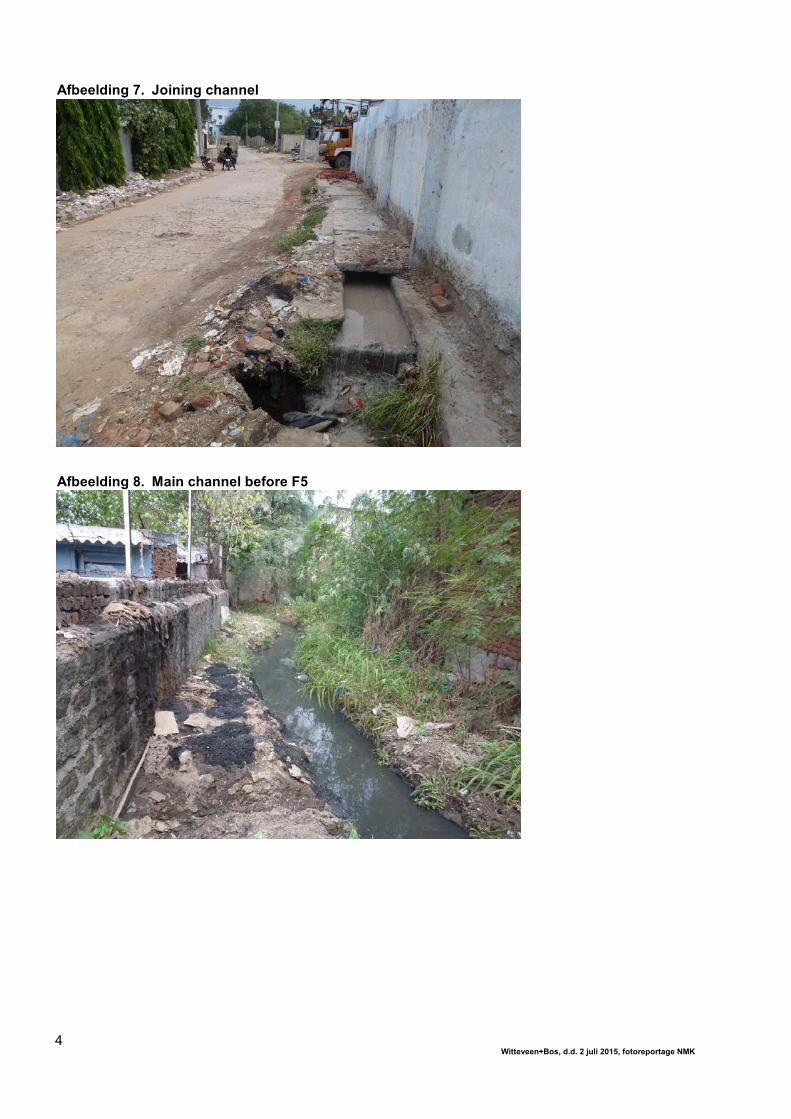
Witteveen+Bos, d.d. 2 juli 2015, fotoreportage NMK4
Afbeelding 7. Joining channel
Afbeelding 8. Main channel before F5
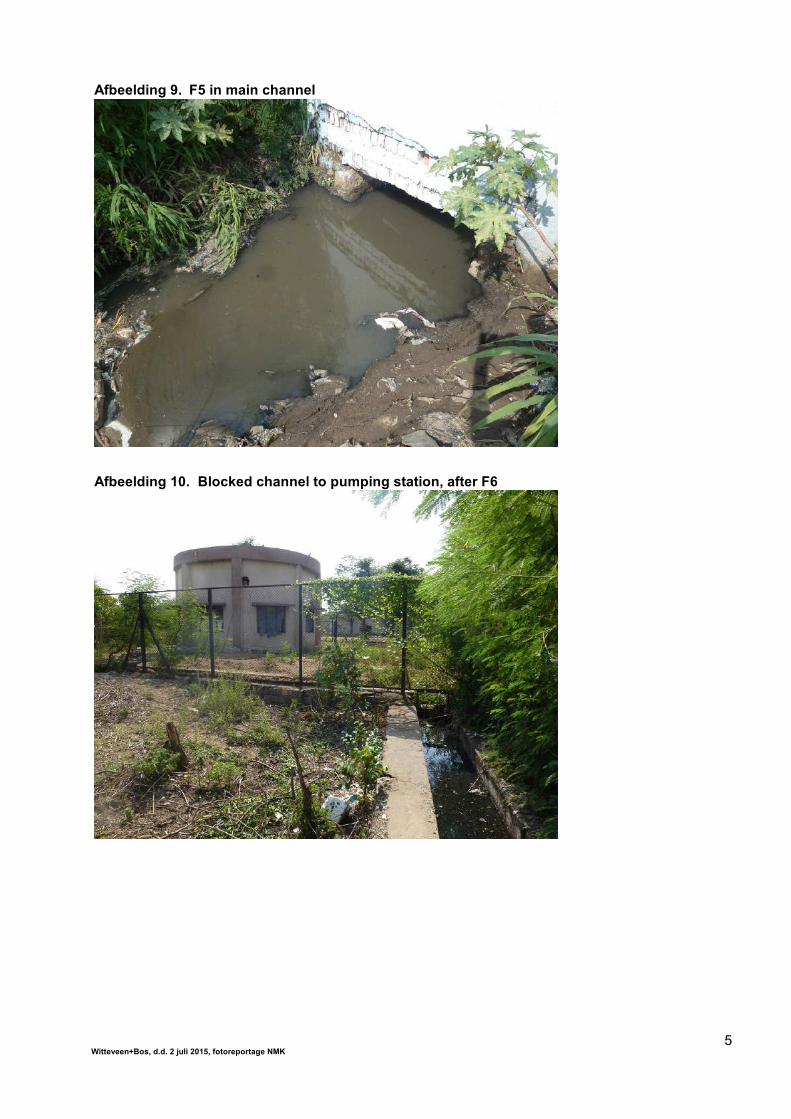
Witteveen+Bos, d.d. 2 juli 2015, fotoreportage NMK5
Afbeelding 9. F5 in main channel
Afbeelding 10. Blocked channel to pumping station, after F6

Witteveen+Bos, d.d. 2 juli 2015, fotoreportage NMK6
Afbeelding 11. Shortcut to marsh after F6
Afbeelding 12. Stream coming downhill at F7
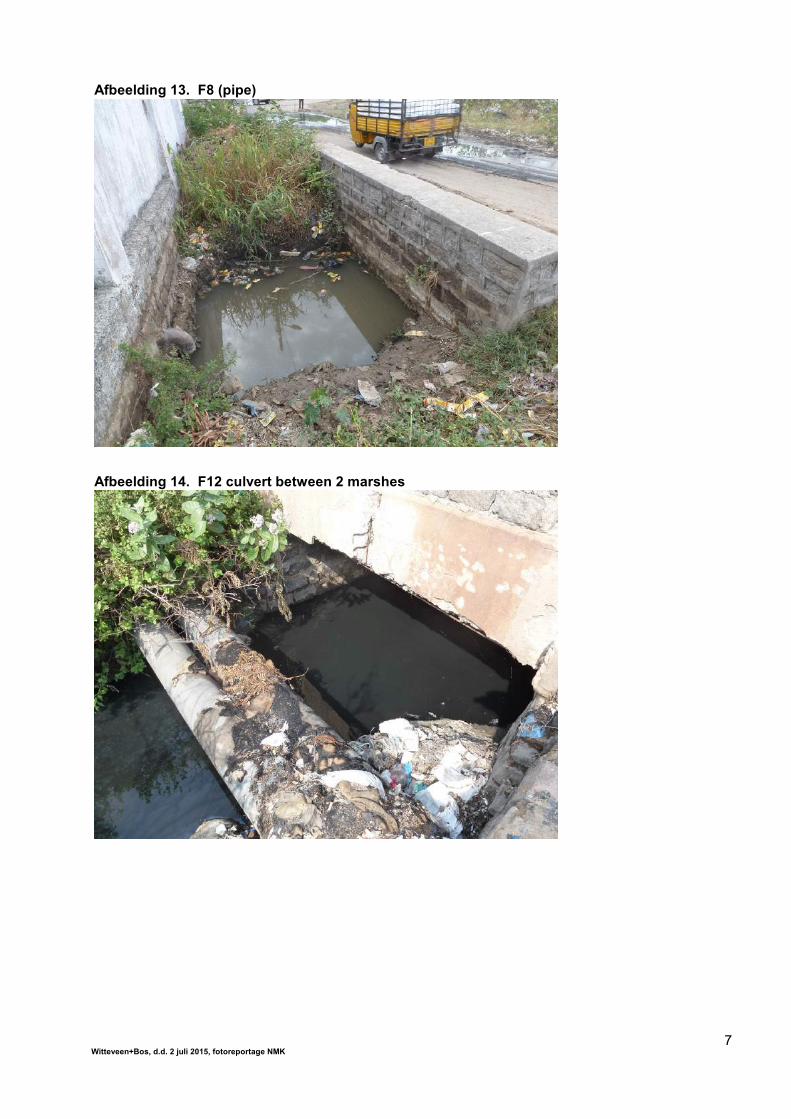
Witteveen+Bos, d.d. 2 juli 2015, fotoreportage NMK7
Afbeelding 13. F8 (pipe)
Afbeelding 14. F12 culvert between 2 marshes
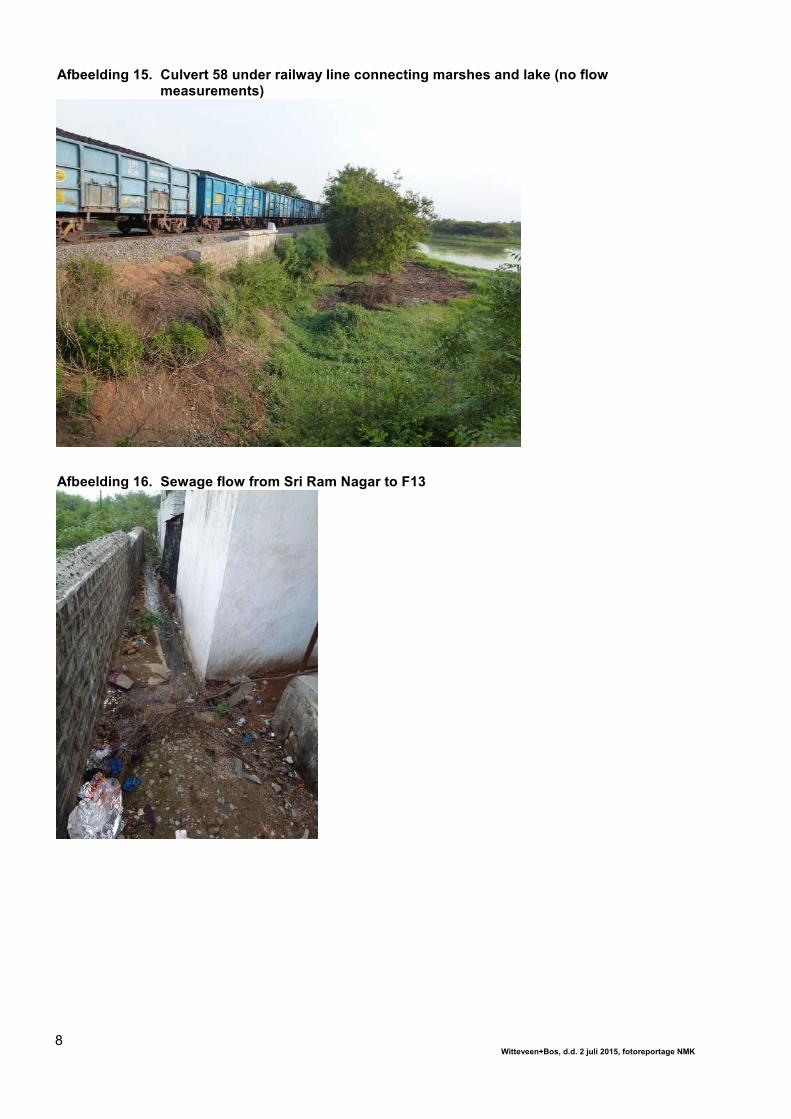
Witteveen+Bos, d.d. 2 juli 2015, fotoreportage NMK8
Afbeelding 15. Culvert 58 under railway line connecting marshes and lake (no flow measurements)
Afbeelding 16. Sewage flow from Sri Ram Nagar to F13
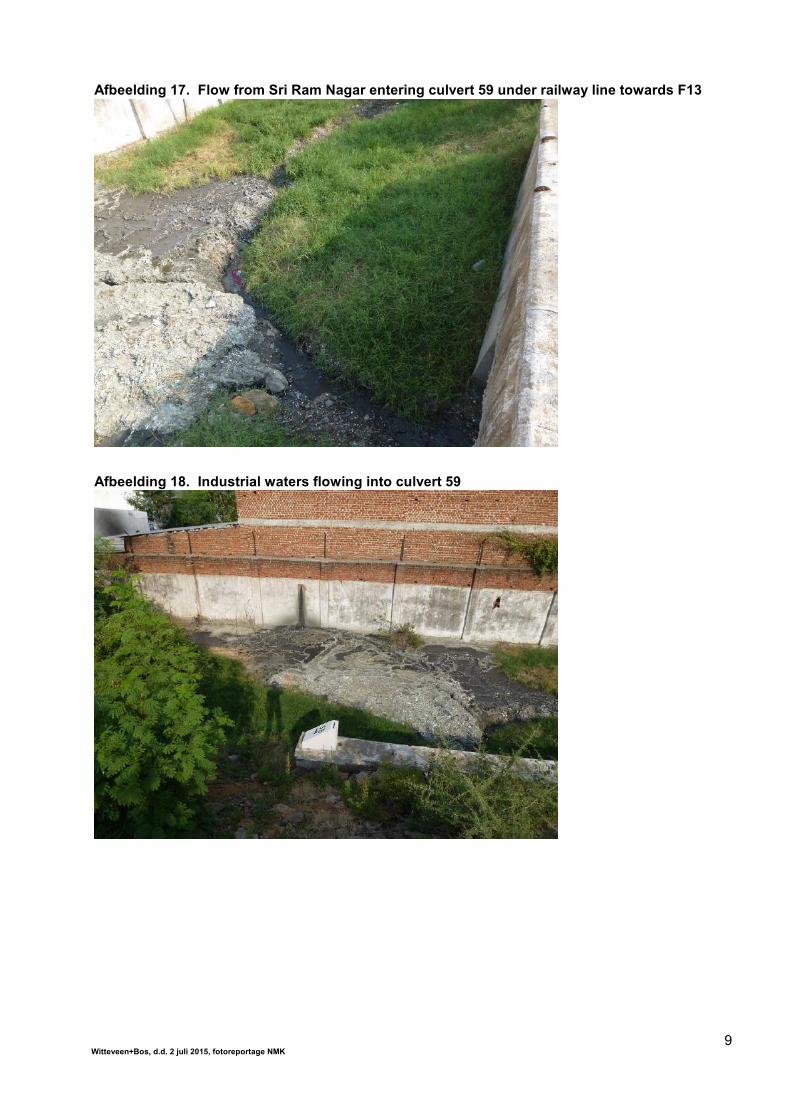
Witteveen+Bos, d.d. 2 juli 2015, fotoreportage NMK9
Afbeelding 17. Flow from Sri Ram Nagar entering culvert 59 under railway line towards F13
Afbeelding 18. Industrial waters flowing into culvert 59
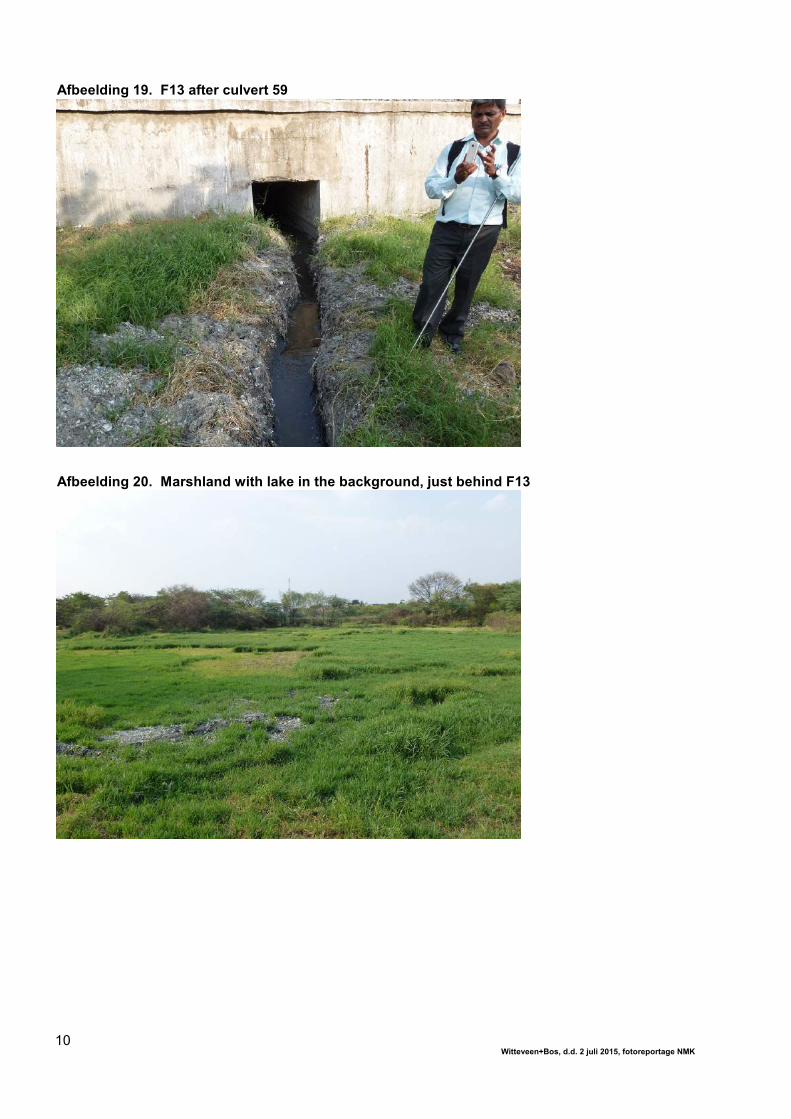
Witteveen+Bos, d.d. 2 juli 2015, fotoreportage NMK10
Afbeelding 19. F13 after culvert 59
Afbeelding 20. Marshland with lake in the background, just behind F13
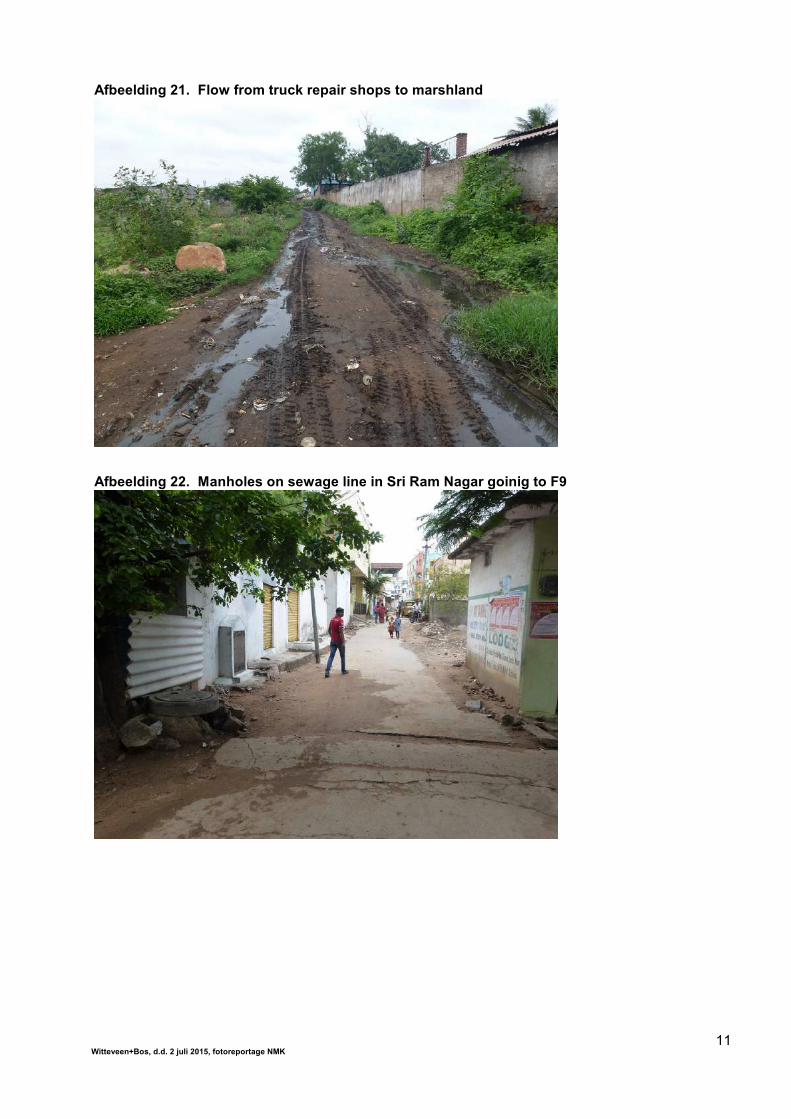
Witteveen+Bos, d.d. 2 juli 2015, fotoreportage NMK11
Afbeelding 21. Flow from truck repair shops to marshland
Afbeelding 22. Manholes on sewage line in Sri Ram Nagar goinig to F9
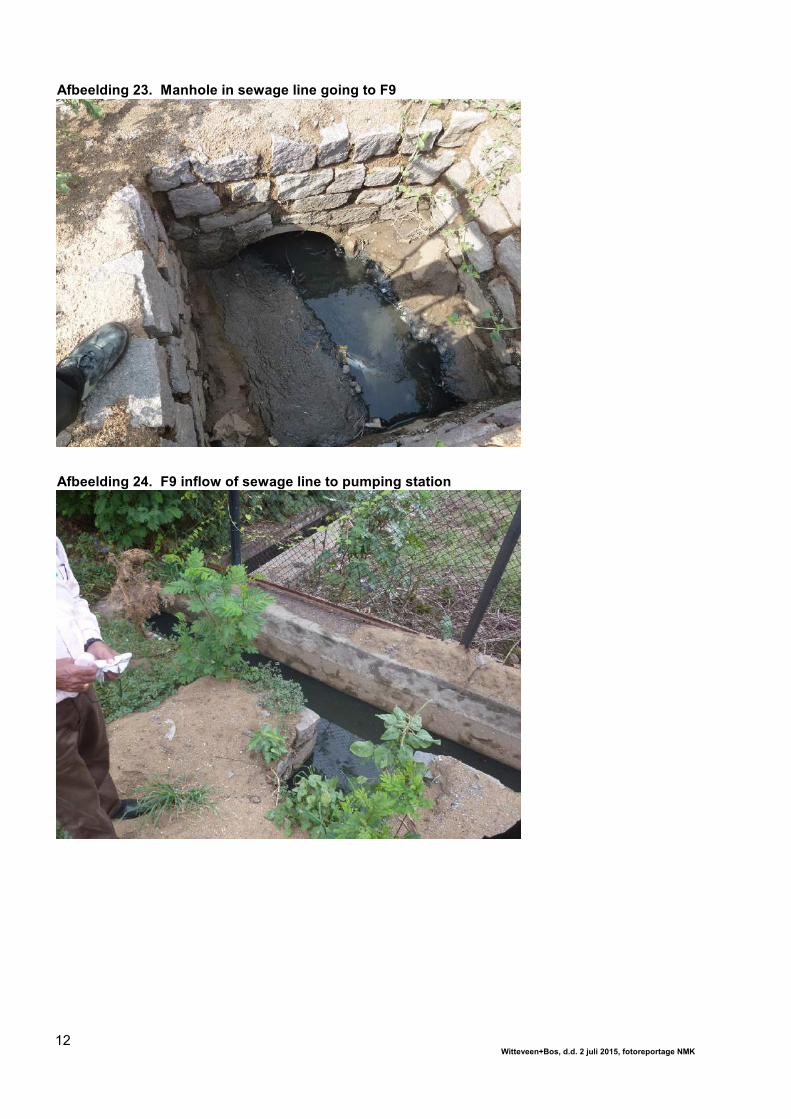
Witteveen+Bos, d.d. 2 juli 2015, fotoreportage NMK12
Afbeelding 23. Manhole in sewage line going to F9
Afbeelding 24. F9 inflow of sewage line to pumping station
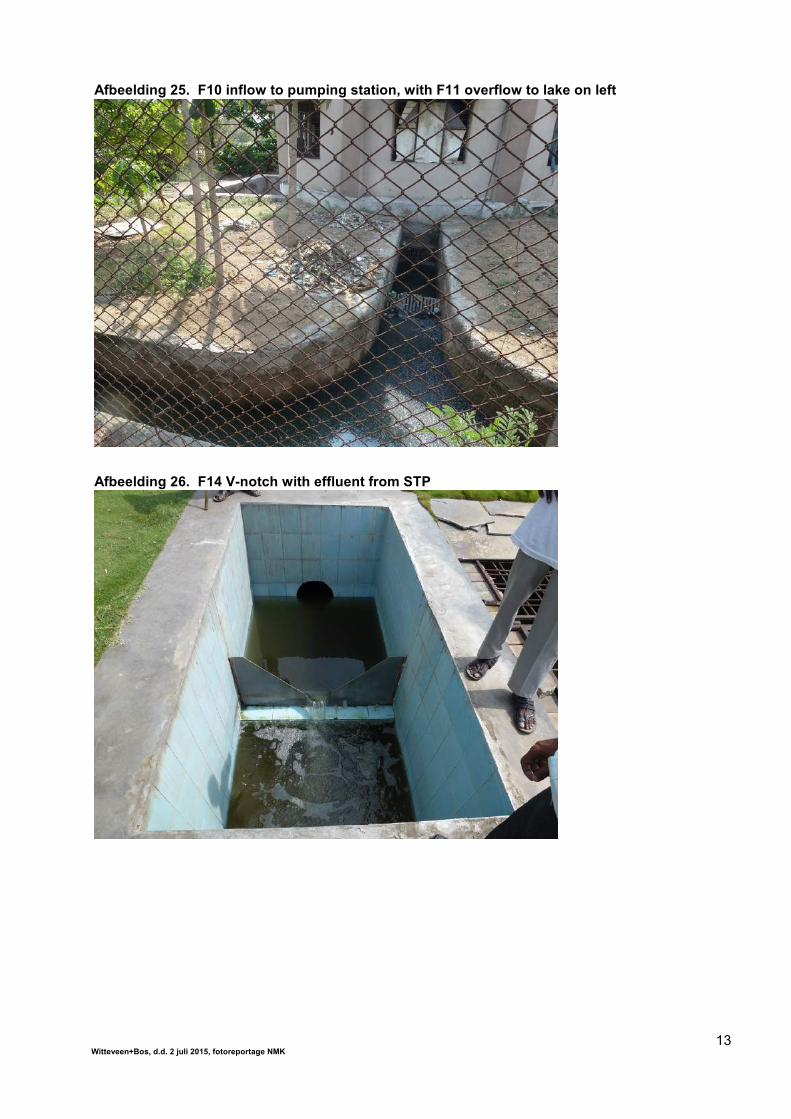
Witteveen+Bos, d.d. 2 juli 2015, fotoreportage NMK13
Afbeelding 25. F10 inflow to pumping station, with F11 overflow to lake on left
Afbeelding 26. F14 V-notch with effluent from STP
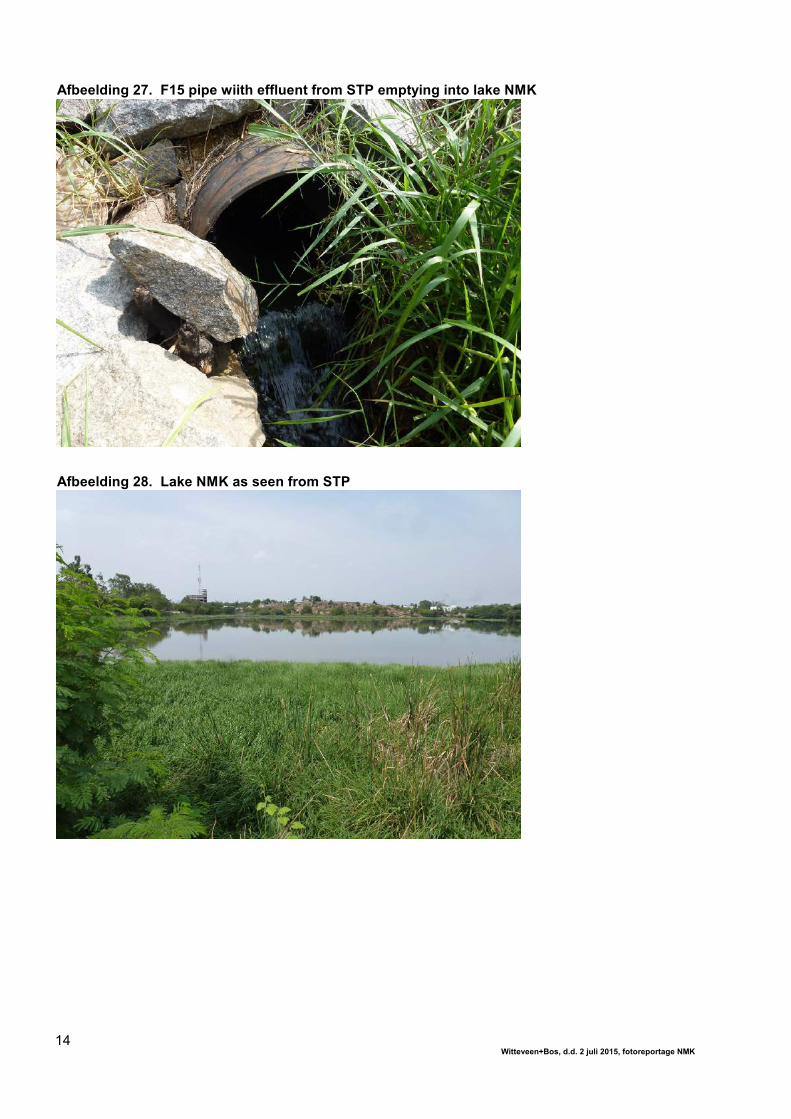
Witteveen+Bos, d.d. 2 juli 2015, fotoreportage NMK14
Afbeelding 27. F15 pipe wiith effluent from STP emptying into lake NMK
Afbeelding 28. Lake NMK as seen from STP
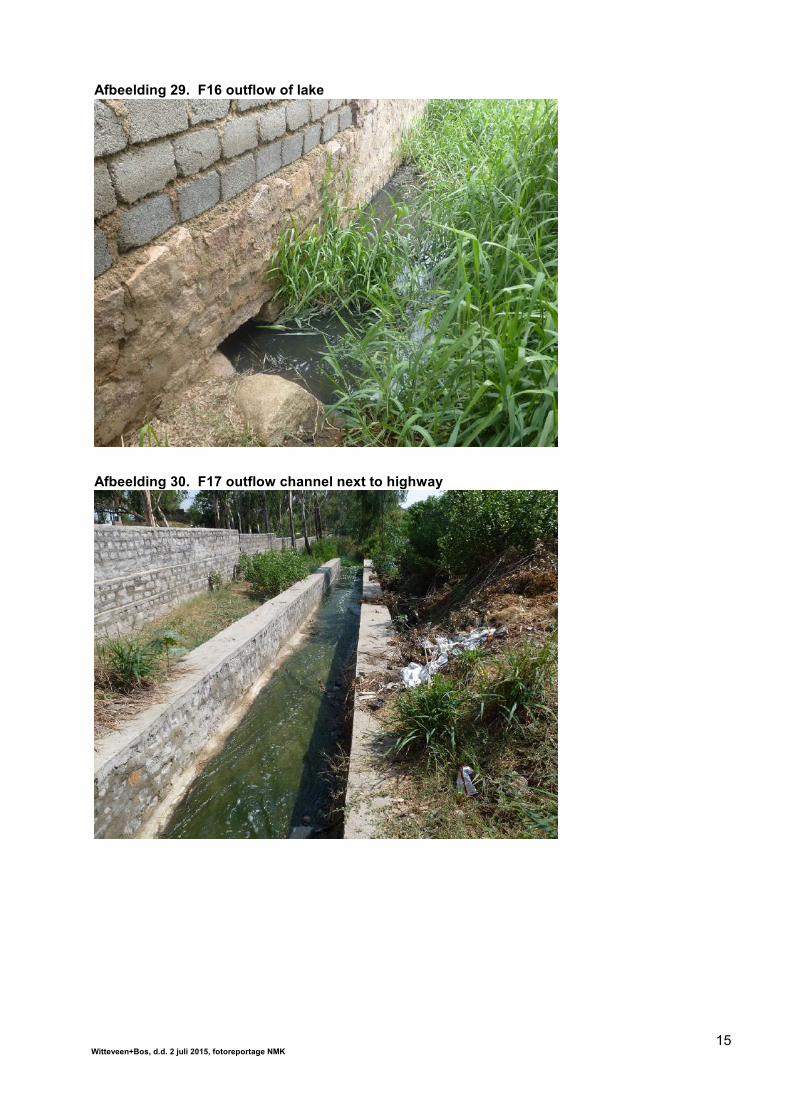
Witteveen+Bos, d.d. 2 juli 2015, fotoreportage NMK15
Afbeelding 29. F16 outflow of lake
Afbeelding 30. F17 outflow channel next to highway
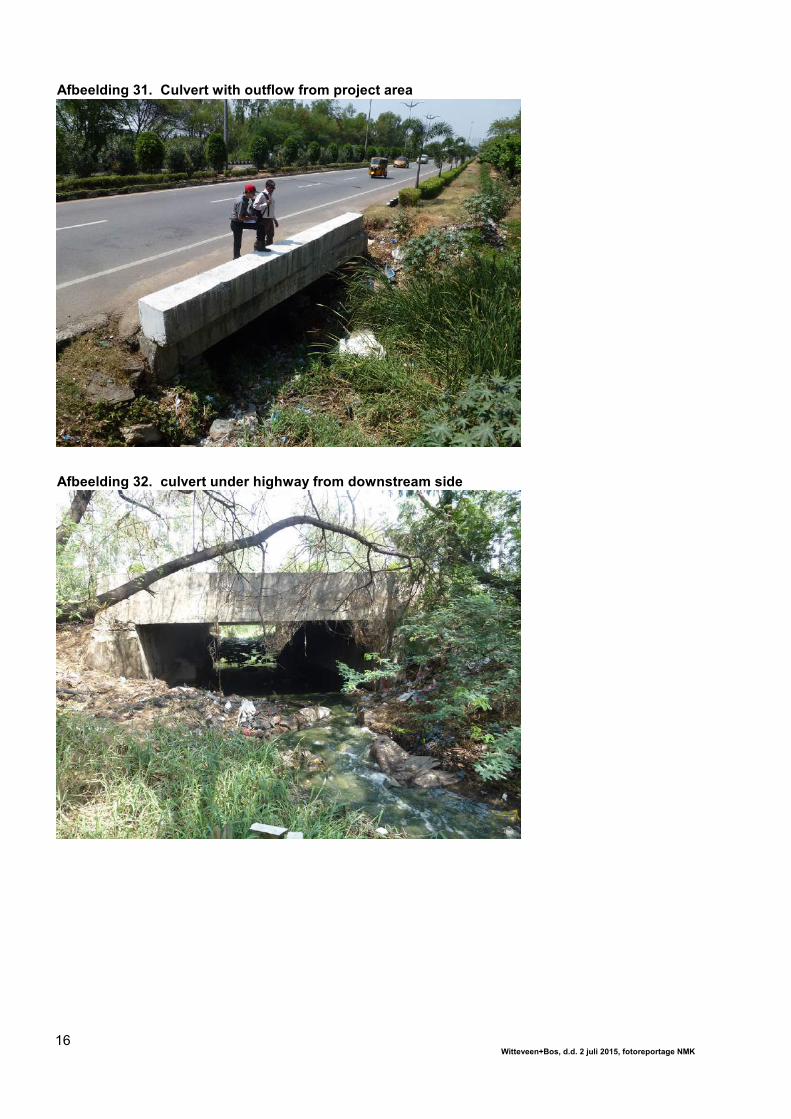
Witteveen+Bos, d.d. 2 juli 2015, fotoreportage NMK16
Afbeelding 31. Culvert with outflow from project area
Afbeelding 32. culvert under highway from downstream side

Witteveen+Bos, appendix II belongs to report IND50-2/16-012.096 dated 8 July 2016
APPENDIX II INDUSTRIAL ACTIVITIES IN THE KATTEDAN INDUSTRIAL AREA

Witteveen+Bos, appendix II belongs to report IND50-2/16-012.096 dated 8 July 2016
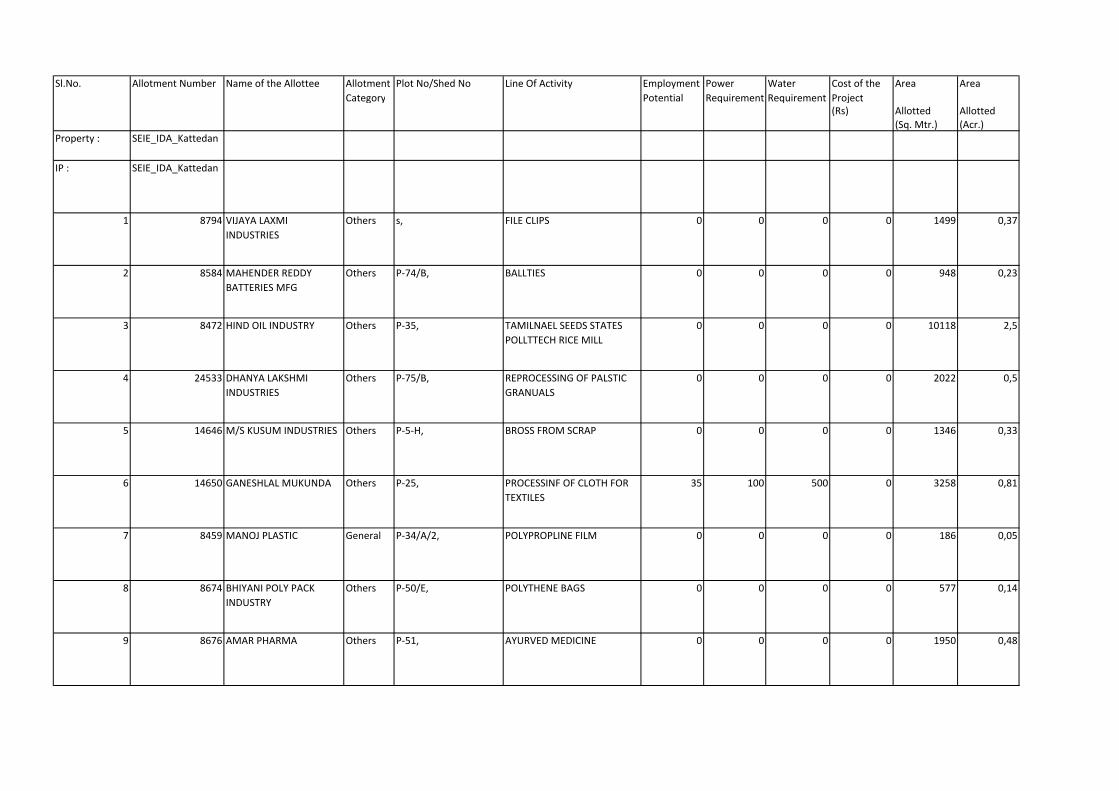
Sl.No. Allotment Number Name of the Allottee Allotment
Category
Plot No/Shed No Line Of Activity Employment
Potential
Power
Requirement
Water
Requirement
Cost of the
Project
Area Area
(Rs) Allotted Allotted
(Sq. Mtr.) (Acr.)
Property : SEIE_IDA_Kattedan
IP : SEIE_IDA_Kattedan
1 8794 VIJAYA LAXMI
INDUSTRIES
Others s, FILE CLIPS 0 0 0 0 1499 0,37
2 8584 MAHENDER REDDY
BATTERIES MFG
Others P-74/B, BALLTIES 0 0 0 0 948 0,23
3 8472 HIND OIL INDUSTRY Others P-35, TAMILNAEL SEEDS STATES
POLLTTECH RICE MILL
0 0 0 0 10118 2,5
4 24533 DHANYA LAKSHMI
INDUSTRIES
Others P-75/B, REPROCESSING OF PALSTIC
GRANUALS
0 0 0 0 2022 0,5
5 14646 M/S KUSUM INDUSTRIES Others P-5-H, BROSS FROM SCRAP 0 0 0 0 1346 0,33
6 14650 GANESHLAL MUKUNDA Others P-25, PROCESSINF OF CLOTH FOR
TEXTILES
35 100 500 0 3258 0,81
7 8459 MANOJ PLASTIC General P-34/A/2, POLYPROPLINE FILM 0 0 0 0 186 0,05
8 8674 BHIYANI POLY PACK
INDUSTRY
Others P-50/E, POLYTHENE BAGS 0 0 0 0 577 0,14
9 8676 AMAR PHARMA Others P-51, AYURVED MEDICINE 0 0 0 0 1950 0,48
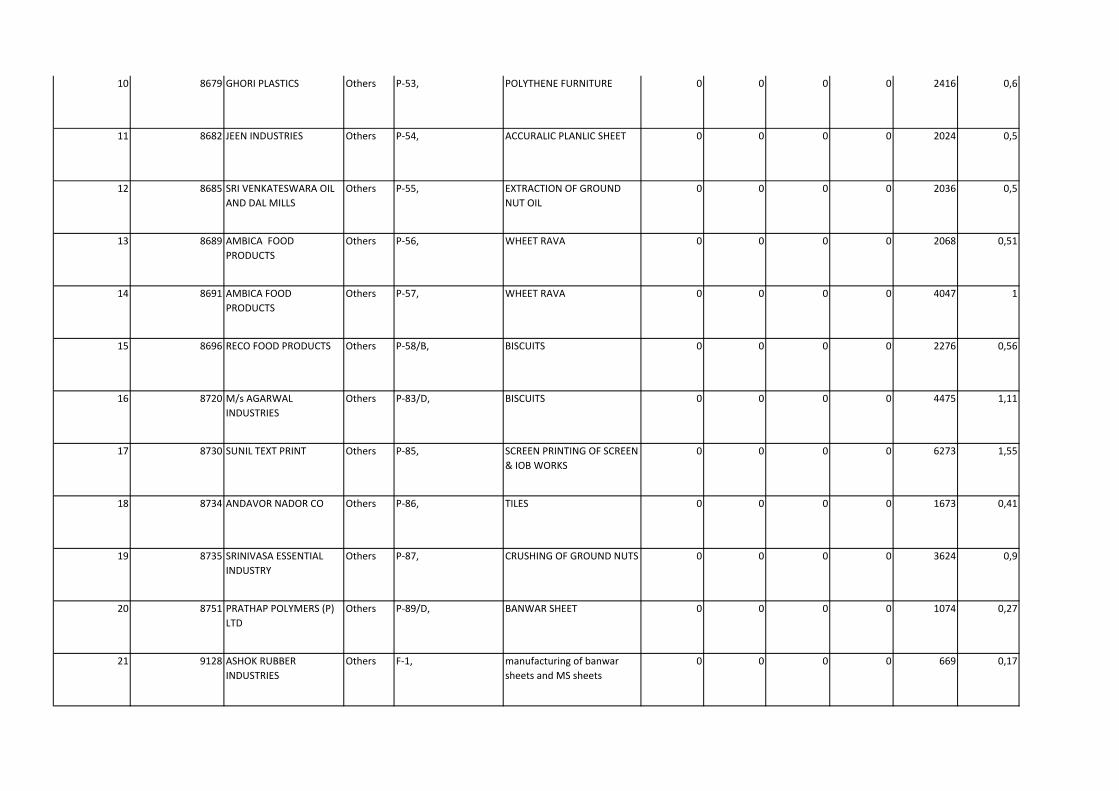
10 8679 GHORI PLASTICS Others P-53, POLYTHENE FURNITURE 0 0 0 0 2416 0,6
11 8682 JEEN INDUSTRIES Others P-54, ACCURALIC PLANLIC SHEET 0 0 0 0 2024 0,5
12 8685 SRI VENKATESWARA OIL
AND DAL MILLS
Others P-55, EXTRACTION OF GROUND
NUT OIL
0 0 0 0 2036 0,5
13 8689 AMBICA FOOD
PRODUCTS
Others P-56, WHEET RAVA 0 0 0 0 2068 0,51
14 8691 AMBICA FOOD
PRODUCTS
Others P-57, WHEET RAVA 0 0 0 0 4047 1
15 8696 RECO FOOD PRODUCTS Others P-58/B, BISCUITS 0 0 0 0 2276 0,56
16 8720 M/s AGARWAL
INDUSTRIES
Others P-83/D, BISCUITS 0 0 0 0 4475 1,11
17 8730 SUNIL TEXT PRINT Others P-85, SCREEN PRINTING OF SCREEN
& IOB WORKS
0 0 0 0 6273 1,55
18 8734 ANDAVOR NADOR CO Others P-86, TILES 0 0 0 0 1673 0,41
19 8735 SRINIVASA ESSENTIAL
INDUSTRY
Others P-87, CRUSHING OF GROUND NUTS 0 0 0 0 3624 0,9
20 8751 PRATHAP POLYMERS (P)
LTD
Others P-89/D, BANWAR SHEET 0 0 0 0 1074 0,27
21 9128 ASHOK RUBBER
INDUSTRIES
Others F-1, manufacturing of banwar
sheets and MS sheets
0 0 0 0 669 0,17
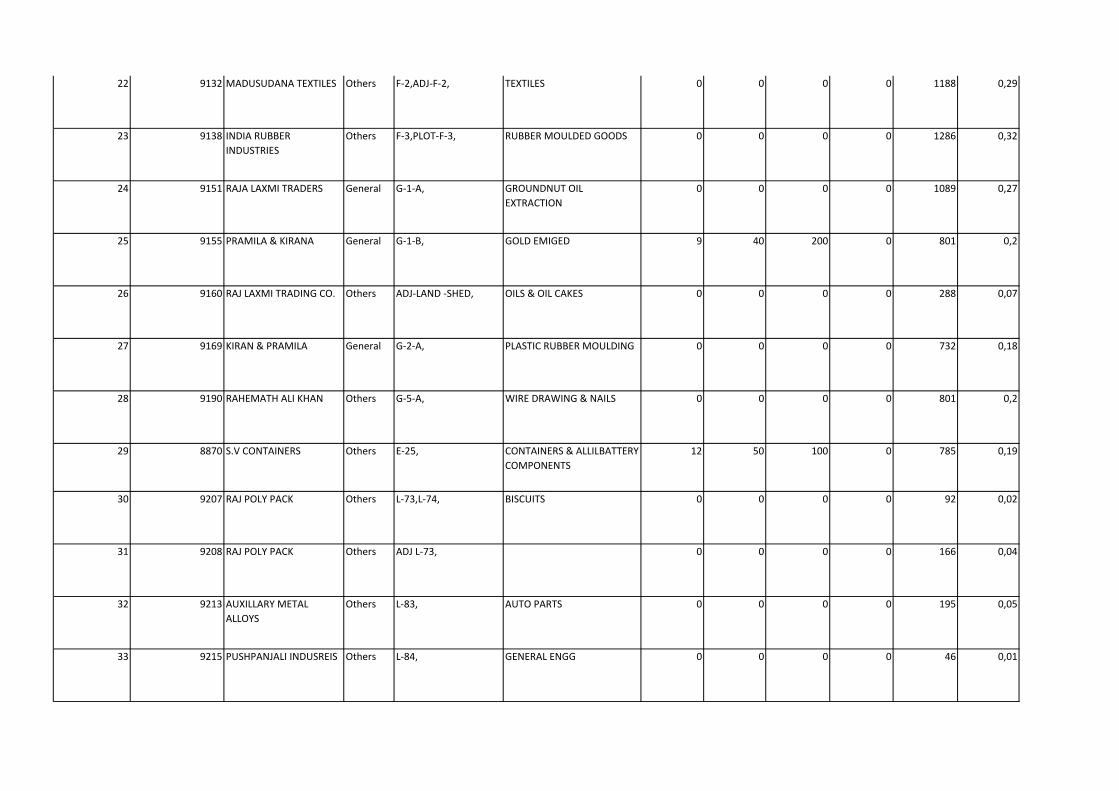
22 9132 MADUSUDANA TEXTILES Others F-2,ADJ-F-2, TEXTILES 0 0 0 0 1188 0,29
23 9138 INDIA RUBBER
INDUSTRIES
Others F-3,PLOT-F-3, RUBBER MOULDED GOODS 0 0 0 0 1286 0,32
24 9151 RAJA LAXMI TRADERS General G-1-A, GROUNDNUT OIL
EXTRACTION
0 0 0 0 1089 0,27
25 9155 PRAMILA & KIRANA General G-1-B, GOLD EMIGED 9 40 200 0 801 0,2
26 9160 RAJ LAXMI TRADING CO. Others ADJ-LAND -SHED, OILS & OIL CAKES 0 0 0 0 288 0,07
27 9169 KIRAN & PRAMILA General G-2-A, PLASTIC RUBBER MOULDING 0 0 0 0 732 0,18
28 9190 RAHEMATH ALI KHAN Others G-5-A, WIRE DRAWING & NAILS 0 0 0 0 801 0,2
29 8870 S.V CONTAINERS Others E-25, CONTAINERS & ALLILBATTERY
COMPONENTS
12 50 100 0 785 0,19
30 9207 RAJ POLY PACK Others L-73,L-74, BISCUITS 0 0 0 0 92 0,02
31 9208 RAJ POLY PACK Others ADJ L-73, 0 0 0 0 166 0,04
32 9213 AUXILLARY METAL
ALLOYS
Others L-83, AUTO PARTS 0 0 0 0 195 0,05
33 9215 PUSHPANJALI INDUSREIS Others L-84, GENERAL ENGG 0 0 0 0 46 0,01
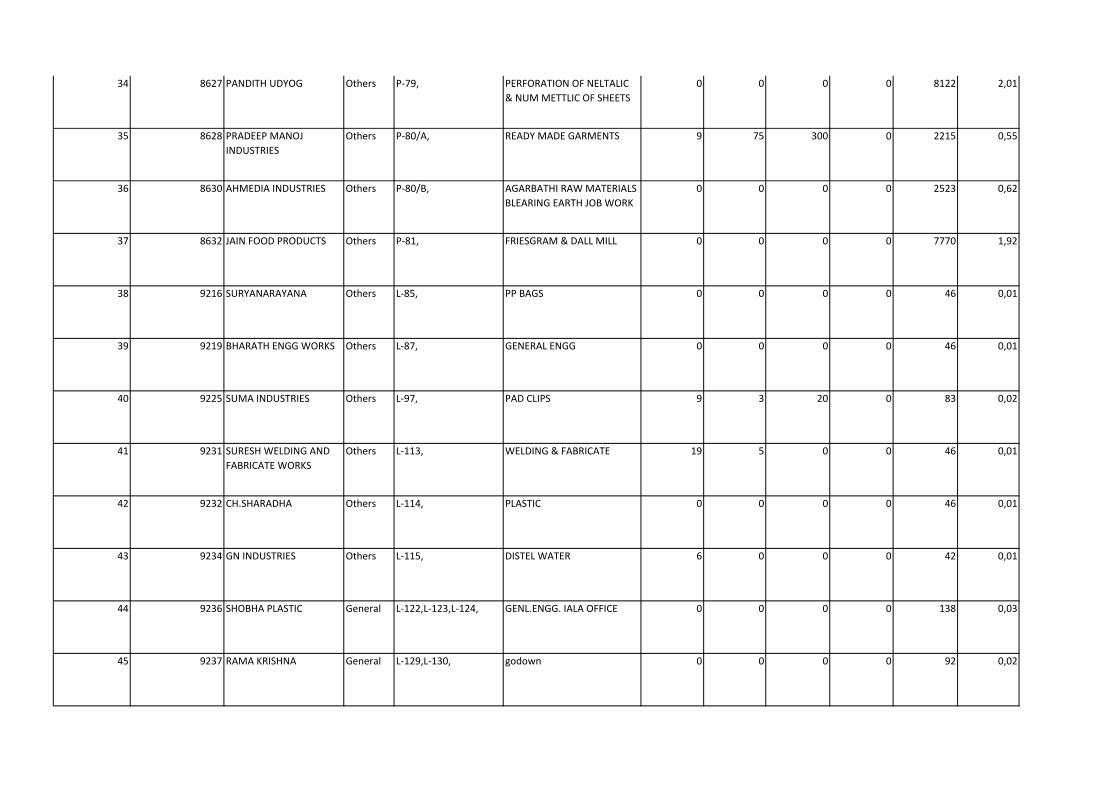
34 8627 PANDITH UDYOG Others P-79, PERFORATION OF NELTALIC
& NUM METTLIC OF SHEETS
0 0 0 0 8122 2,01
35 8628 PRADEEP MANOJ
INDUSTRIES
Others P-80/A, READY MADE GARMENTS 9 75 300 0 2215 0,55
36 8630 AHMEDIA INDUSTRIES Others P-80/B, AGARBATHI RAW MATERIALS
BLEARING EARTH JOB WORK
0 0 0 0 2523 0,62
37 8632 JAIN FOOD PRODUCTS Others P-81, FRIESGRAM & DALL MILL 0 0 0 0 7770 1,92
38 9216 SURYANARAYANA Others L-85, PP BAGS 0 0 0 0 46 0,01
39 9219 BHARATH ENGG WORKS Others L-87, GENERAL ENGG 0 0 0 0 46 0,01
40 9225 SUMA INDUSTRIES Others L-97, PAD CLIPS 9 3 20 0 83 0,02
41 9231 SURESH WELDING AND
FABRICATE WORKS
Others L-113, WELDING & FABRICATE 19 5 0 0 46 0,01
42 9232 CH.SHARADHA Others L-114, PLASTIC 0 0 0 0 46 0,01
43 9234 GN INDUSTRIES Others L-115, DISTEL WATER 6 0 0 0 42 0,01
44 9236 SHOBHA PLASTIC General L-122,L-123,L-124, GENL.ENGG. IALA OFFICE 0 0 0 0 138 0,03
45 9237 RAMA KRISHNA General L-129,L-130, godown 0 0 0 0 92 0,02
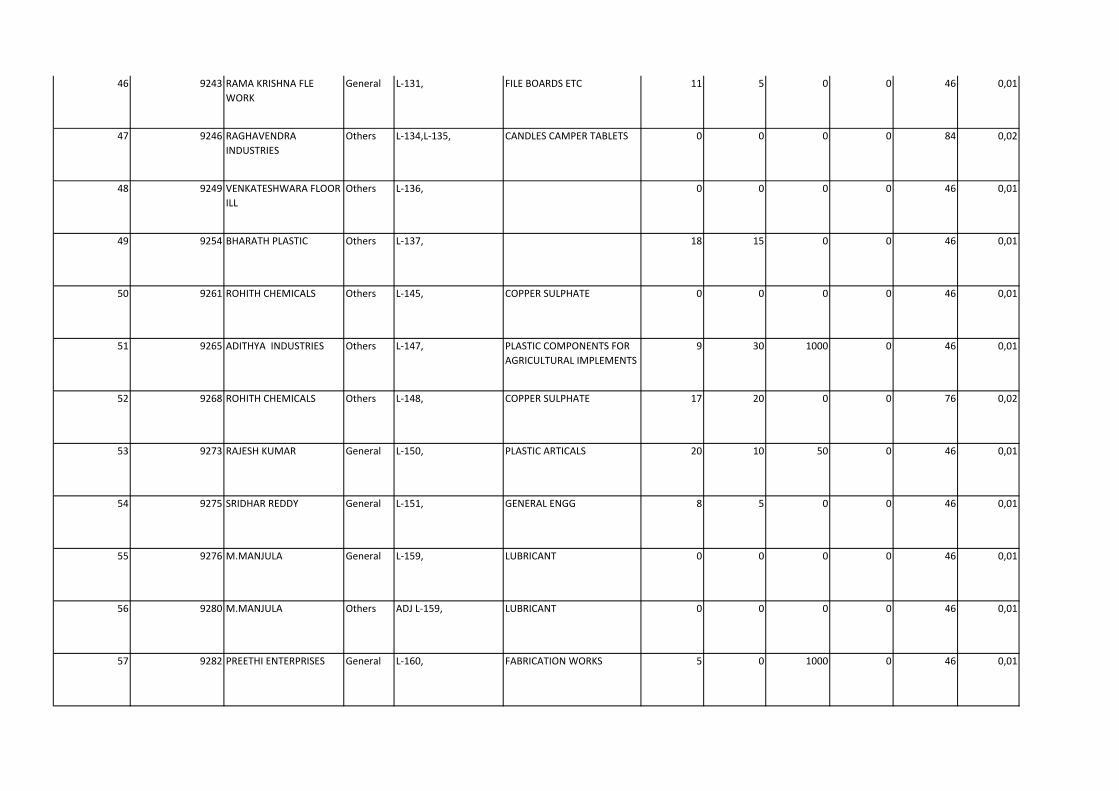
46 9243 RAMA KRISHNA FLE
WORK
General L-131, FILE BOARDS ETC 11 5 0 0 46 0,01
47 9246 RAGHAVENDRA
INDUSTRIES
Others L-134,L-135, CANDLES CAMPER TABLETS 0 0 0 0 84 0,02
48 9249 VENKATESHWARA FLOOR
ILL
Others L-136, 0 0 0 0 46 0,01
49 9254 BHARATH PLASTIC Others L-137, 18 15 0 0 46 0,01
50 9261 ROHITH CHEMICALS Others L-145, COPPER SULPHATE 0 0 0 0 46 0,01
51 9265 ADITHYA INDUSTRIES Others L-147, PLASTIC COMPONENTS FOR
AGRICULTURAL IMPLEMENTS
9 30 1000 0 46 0,01
52 9268 ROHITH CHEMICALS Others L-148, COPPER SULPHATE 17 20 0 0 76 0,02
53 9273 RAJESH KUMAR General L-150, PLASTIC ARTICALS 20 10 50 0 46 0,01
54 9275 SRIDHAR REDDY General L-151, GENERAL ENGG 8 5 0 0 46 0,01
55 9276 M.MANJULA General L-159, LUBRICANT 0 0 0 0 46 0,01
56 9280 M.MANJULA Others ADJ L-159, LUBRICANT 0 0 0 0 46 0,01
57 9282 PREETHI ENTERPRISES General L-160, FABRICATION WORKS 5 0 1000 0 46 0,01
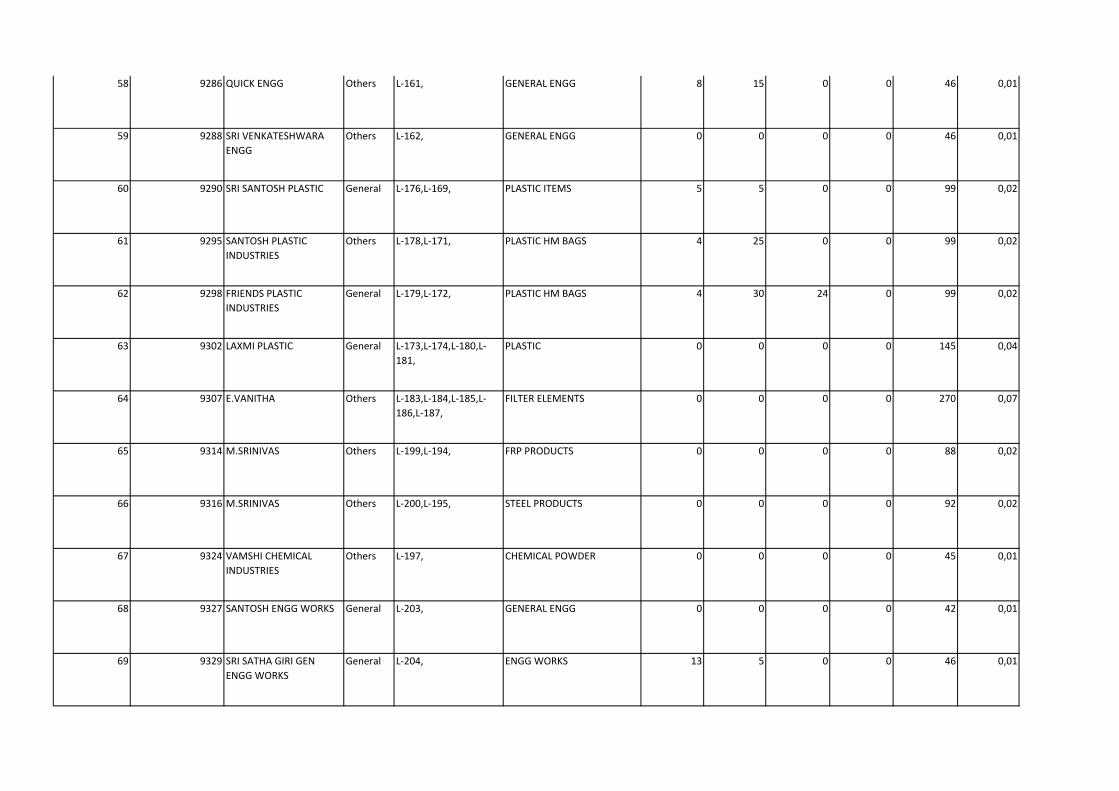
58 9286 QUICK ENGG Others L-161, GENERAL ENGG 8 15 0 0 46 0,01
59 9288 SRI VENKATESHWARA
ENGG
Others L-162, GENERAL ENGG 0 0 0 0 46 0,01
60 9290 SRI SANTOSH PLASTIC General L-176,L-169, PLASTIC ITEMS 5 5 0 0 99 0,02
61 9295 SANTOSH PLASTIC
INDUSTRIES
Others L-178,L-171, PLASTIC HM BAGS 4 25 0 0 99 0,02
62 9298 FRIENDS PLASTIC
INDUSTRIES
General L-179,L-172, PLASTIC HM BAGS 4 30 24 0 99 0,02
63 9302 LAXMI PLASTIC General L-173,L-174,L-180,L-
181,
PLASTIC 0 0 0 0 145 0,04
64 9307 E.VANITHA Others L-183,L-184,L-185,L-
186,L-187,
FILTER ELEMENTS 0 0 0 0 270 0,07
65 9314 M.SRINIVAS Others L-199,L-194, FRP PRODUCTS 0 0 0 0 88 0,02
66 9316 M.SRINIVAS Others L-200,L-195, STEEL PRODUCTS 0 0 0 0 92 0,02
67 9324 VAMSHI CHEMICAL
INDUSTRIES
Others L-197, CHEMICAL POWDER 0 0 0 0 45 0,01
68 9327 SANTOSH ENGG WORKS General L-203, GENERAL ENGG 0 0 0 0 42 0,01
69 9329 SRI SATHA GIRI GEN
ENGG WORKS
General L-204, ENGG WORKS 13 5 0 0 46 0,01
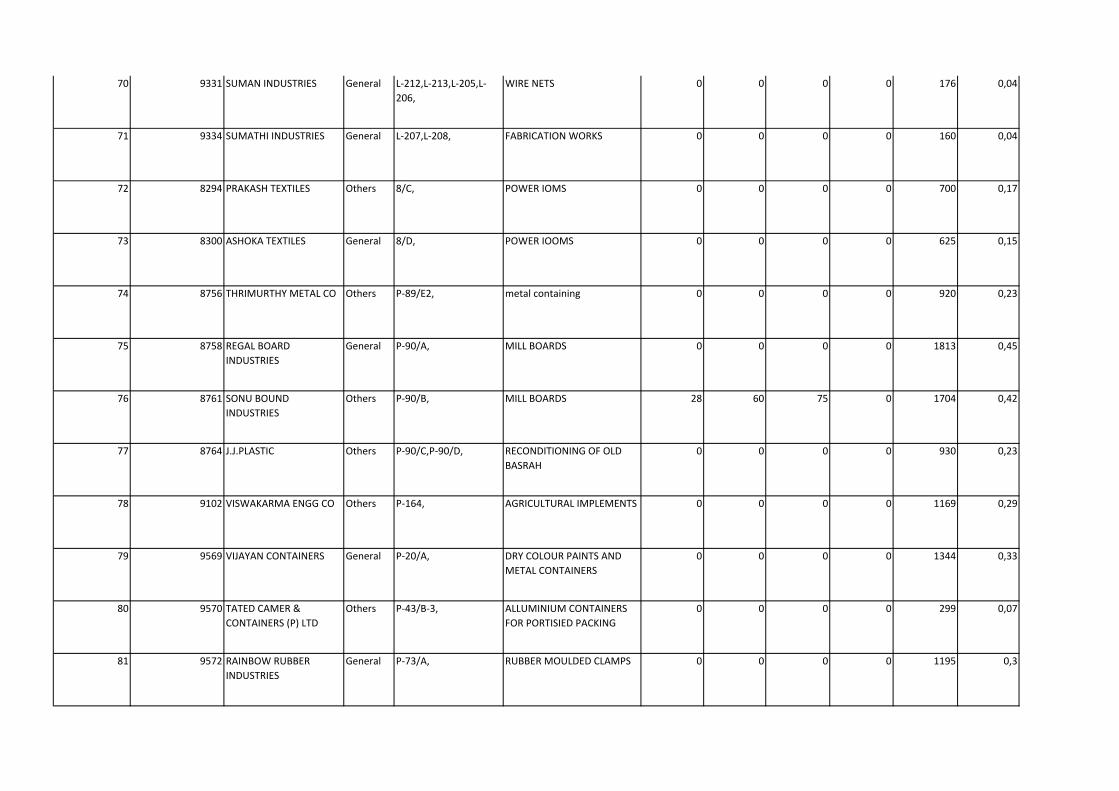
70 9331 SUMAN INDUSTRIES General L-212,L-213,L-205,L-
206,
WIRE NETS 0 0 0 0 176 0,04
71 9334 SUMATHI INDUSTRIES General L-207,L-208, FABRICATION WORKS 0 0 0 0 160 0,04
72 8294 PRAKASH TEXTILES Others 8/C, POWER IOMS 0 0 0 0 700 0,17
73 8300 ASHOKA TEXTILES General 8/D, POWER IOOMS 0 0 0 0 625 0,15
74 8756 THRIMURTHY METAL CO Others P-89/E2, metal containing 0 0 0 0 920 0,23
75 8758 REGAL BOARD
INDUSTRIES
General P-90/A, MILL BOARDS 0 0 0 0 1813 0,45
76 8761 SONU BOUND
INDUSTRIES
Others P-90/B, MILL BOARDS 28 60 75 0 1704 0,42
77 8764 J.J.PLASTIC Others P-90/C,P-90/D, RECONDITIONING OF OLD
BASRAH
0 0 0 0 930 0,23
78 9102 VISWAKARMA ENGG CO Others P-164, AGRICULTURAL IMPLEMENTS 0 0 0 0 1169 0,29
79 9569 VIJAYAN CONTAINERS General P-20/A, DRY COLOUR PAINTS AND
METAL CONTAINERS
0 0 0 0 1344 0,33
80 9570 TATED CAMER &
CONTAINERS (P) LTD
Others P-43/B-3, ALLUMINIUM CONTAINERS
FOR PORTISIED PACKING
0 0 0 0 299 0,07
81 9572 RAINBOW RUBBER
INDUSTRIES
General P-73/A, RUBBER MOULDED CLAMPS 0 0 0 0 1195 0,3
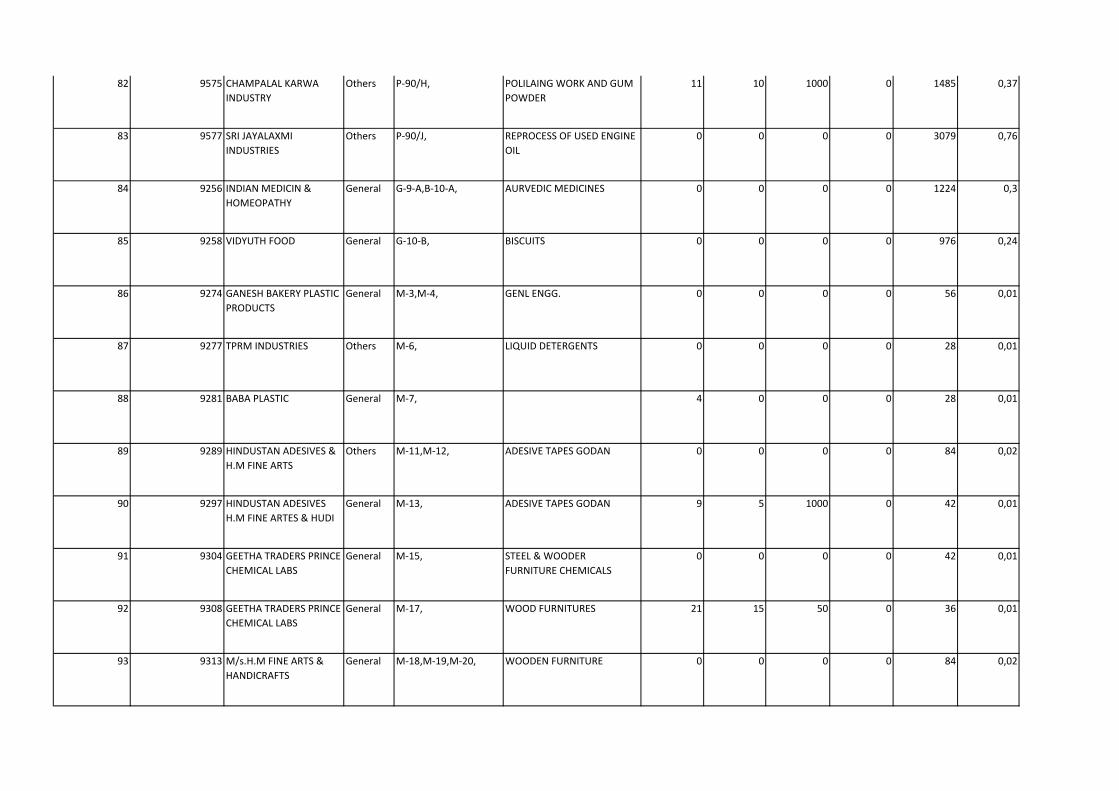
82 9575 CHAMPALAL KARWA
INDUSTRY
Others P-90/H, POLILAING WORK AND GUM
POWDER
11 10 1000 0 1485 0,37
83 9577 SRI JAYALAXMI
INDUSTRIES
Others P-90/J, REPROCESS OF USED ENGINE
OIL
0 0 0 0 3079 0,76
84 9256 INDIAN MEDICIN &
HOMEOPATHY
General G-9-A,B-10-A, AURVEDIC MEDICINES 0 0 0 0 1224 0,3
85 9258 VIDYUTH FOOD General G-10-B, BISCUITS 0 0 0 0 976 0,24
86 9274 GANESH BAKERY PLASTIC
PRODUCTS
General M-3,M-4, GENL ENGG. 0 0 0 0 56 0,01
87 9277 TPRM INDUSTRIES Others M-6, LIQUID DETERGENTS 0 0 0 0 28 0,01
88 9281 BABA PLASTIC General M-7, 4 0 0 0 28 0,01
89 9289 HINDUSTAN ADESIVES &
H.M FINE ARTS
Others M-11,M-12, ADESIVE TAPES GODAN 0 0 0 0 84 0,02
90 9297 HINDUSTAN ADESIVES
H.M FINE ARTES & HUDI
General M-13, ADESIVE TAPES GODAN 9 5 1000 0 42 0,01
91 9304 GEETHA TRADERS PRINCE
CHEMICAL LABS
General M-15, STEEL & WOODER
FURNITURE CHEMICALS
0 0 0 0 42 0,01
92 9308 GEETHA TRADERS PRINCE
CHEMICAL LABS
General M-17, WOOD FURNITURES 21 15 50 0 36 0,01
93 9313 M/s.H.M FINE ARTS &
HANDICRAFTS
General M-18,M-19,M-20, WOODEN FURNITURE 0 0 0 0 84 0,02
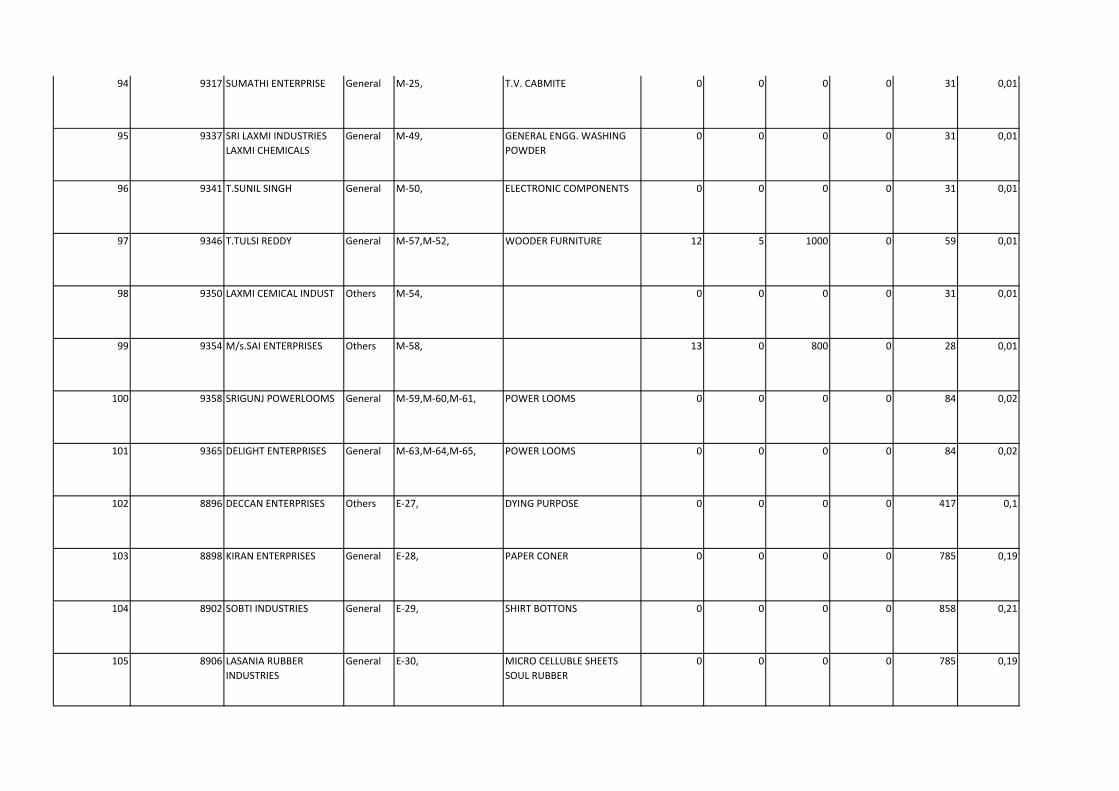
94 9317 SUMATHI ENTERPRISE General M-25, T.V. CABMITE 0 0 0 0 31 0,01
95 9337 SRI LAXMI INDUSTRIES
LAXMI CHEMICALS
General M-49, GENERAL ENGG. WASHING
POWDER
0 0 0 0 31 0,01
96 9341 T.SUNIL SINGH General M-50, ELECTRONIC COMPONENTS 0 0 0 0 31 0,01
97 9346 T.TULSI REDDY General M-57,M-52, WOODER FURNITURE 12 5 1000 0 59 0,01
98 9350 LAXMI CEMICAL INDUST Others M-54, 0 0 0 0 31 0,01
99 9354 M/s.SAI ENTERPRISES Others M-58, 13 0 800 0 28 0,01
100 9358 SRIGUNJ POWERLOOMS General M-59,M-60,M-61, POWER LOOMS 0 0 0 0 84 0,02
101 9365 DELIGHT ENTERPRISES General M-63,M-64,M-65, POWER LOOMS 0 0 0 0 84 0,02
102 8896 DECCAN ENTERPRISES Others E-27, DYING PURPOSE 0 0 0 0 417 0,1
103 8898 KIRAN ENTERPRISES General E-28, PAPER CONER 0 0 0 0 785 0,19
104 8902 SOBTI INDUSTRIES General E-29, SHIRT BOTTONS 0 0 0 0 858 0,21
105 8906 LASANIA RUBBER
INDUSTRIES
General E-30, MICRO CELLUBLE SHEETS
SOUL RUBBER
0 0 0 0 785 0,19

106 8908 MINI METAL BOX
COMPANY
General E-31, METAL CONTAINORS 0 0 0 0 858 0,21
107 8914 BALAJI INDUSTRIES General E-33, GUM TAPE 18 20 0 0 858 0,21
108 8918 G.B. PRODUCTS General E-35, BLEADING & EARLLT &
COMBONS
0 0 0 0 945 0,23
109 8921 CHANDRAKALA
PULVARISING
General E-36, MINERAL POWDER 0 0 0 0 785 0,19
110 8929 ENZED CHOLORO
PRODUCTS (P) LTD
General E-38, CHLORINE TABLETS 0 0 0 0 785 0,19
111 8934 ENZED CHLORO
PRODUCTS
General E-40, PLOY PROPELENE, HDPE 0 0 0 0 785 0,19
112 8939 CHENNURU TEXTILES General CFC-1/A, MFG.OF TEXTILES A POWER
BOOUS
0 0 0 0 919 0,23
113 8943 SRI GANESH SIZING &
PROCESSSING WOOLS
General CFC-2, SIZING OF YARN 0 0 0 0 823 0,2
114 8969 VEEKAY METTALIEYS Others D-5, NM-FERRUS METALY ALLOYS 0 0 0 0 1464 0,36
115 8974 POLE STAR RUBBER General E-1, RUBBER MOULDING GOODS 0 0 0 0 1985 0,49
116 8976 SHIVA KUMAR GUPTA General E-2, RUBBER BANWAR & SHEETS 0 0 0 0 1432 0,35
117 8977 SINGH INDUSTRIES General E-3, PLASTIC GRANATES &
PLASTIC PRODUCTS
0 0 0 0 980 0,24
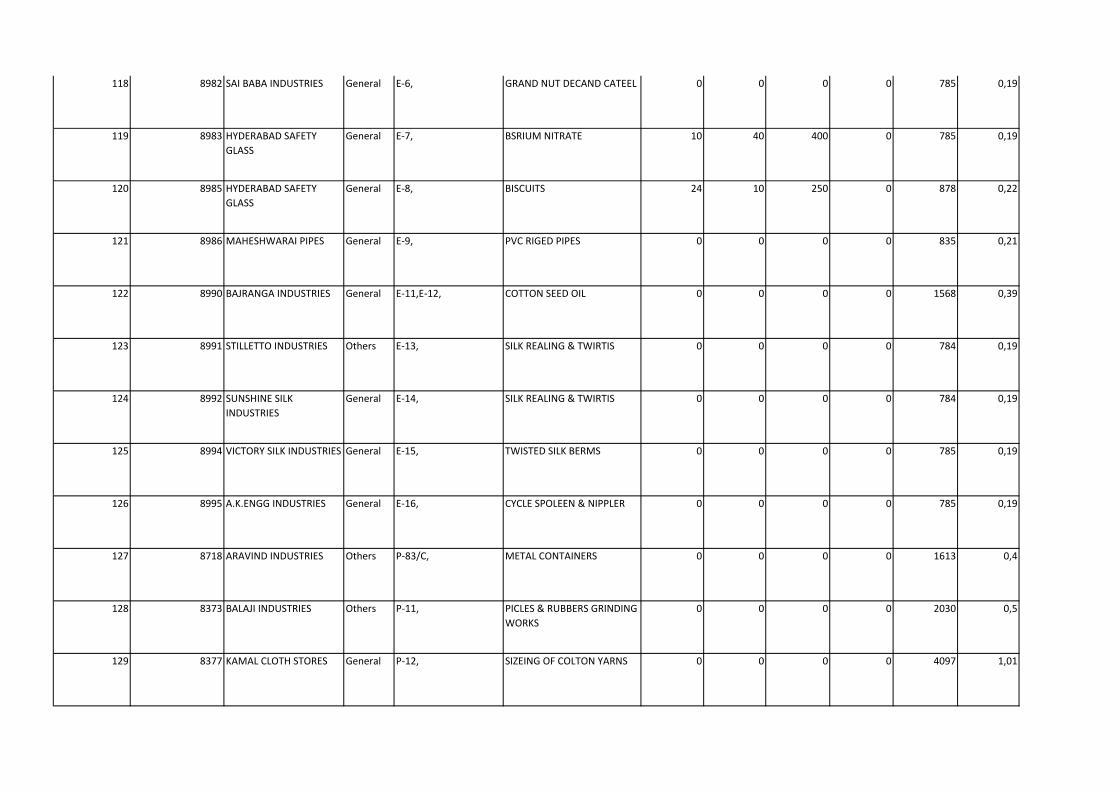
118 8982 SAI BABA INDUSTRIES General E-6, GRAND NUT DECAND CATEEL 0 0 0 0 785 0,19
119 8983 HYDERABAD SAFETY
GLASS
General E-7, BSRIUM NITRATE 10 40 400 0 785 0,19
120 8985 HYDERABAD SAFETY
GLASS
General E-8, BISCUITS 24 10 250 0 878 0,22
121 8986 MAHESHWARAI PIPES General E-9, PVC RIGED PIPES 0 0 0 0 835 0,21
122 8990 BAJRANGA INDUSTRIES General E-11,E-12, COTTON SEED OIL 0 0 0 0 1568 0,39
123 8991 STILLETTO INDUSTRIES Others E-13, SILK REALING & TWIRTIS 0 0 0 0 784 0,19
124 8992 SUNSHINE SILK
INDUSTRIES
General E-14, SILK REALING & TWIRTIS 0 0 0 0 784 0,19
125 8994 VICTORY SILK INDUSTRIES General E-15, TWISTED SILK BERMS 0 0 0 0 785 0,19
126 8995 A.K.ENGG INDUSTRIES General E-16, CYCLE SPOLEEN & NIPPLER 0 0 0 0 785 0,19
127 8718 ARAVIND INDUSTRIES Others P-83/C, METAL CONTAINERS 0 0 0 0 1613 0,4
128 8373 BALAJI INDUSTRIES Others P-11, PICLES & RUBBERS GRINDING
WORKS
0 0 0 0 2030 0,5
129 8377 KAMAL CLOTH STORES General P-12, SIZEING OF COLTON YARNS 0 0 0 0 4097 1,01

130 8385 ANDHRA GLASS &
CHEMICAL INDUSTRIES
General P-14, SODIUM SILICATE 0 0 0 0 2429 0,6
131 8388 SANATHNAGAR
INDUSTRIES
Others P-16/A, POLYTHENE BAGS 0 0 0 0 2024 0,5
132 8391 MEHATH PLASTIC
INDUSTRY
Others P-16/B, PLASTIC MOULDED GOODS 0 0 0 0 1046 0,26
133 8398 GURUREKHA PLASTICS Others P-16/D, REPROCESSING OF PLASTIC
MODELS
0 0 0 0 1741 0,43
134 8400 VISHAL INDUSTRIES Others P-20/A, DRY COLOUR PAINTS 0 0 0 0 1053 0,26
135 8406 KOTHARI RUBBER
INDUSTRY
General P-22, FLOOR MILLS BATTERY
CHARGES
0 0 0 0 7366 1,82
136 8412 NANDU MILK FOOD
PRODUCTS
General P-26, MANUFACTURING OF CREAM
AND KULTHI
0 0 0 0 3504 0,87
137 8415 SRI JAYALAXMI
INDUSTRIES
General P-27/A, TOMANIEL SEED POWDER 0 0 0 0 3400 0,84
138 8417 INDIAN PLASTIC Others P-27/B, REPROCESSING OF PLASTICS
GARMENTS
0 0 0 0 3068 0,76
139 8426 GULAB DEVI DARAK Others P-29, FILE ELEMENTS FOR INDI
FILTERS
0 0 0 0 1348 0,33
140 8429 HARSH VARDHAN & CO General P-30, PLASTIC MOULDED ARTICLES 0 0 0 0 1336 0,33
141 8433 PUSHPA ENTERPRISES General P-31/A, TEXTILES 0 0 0 0 1980 0,49
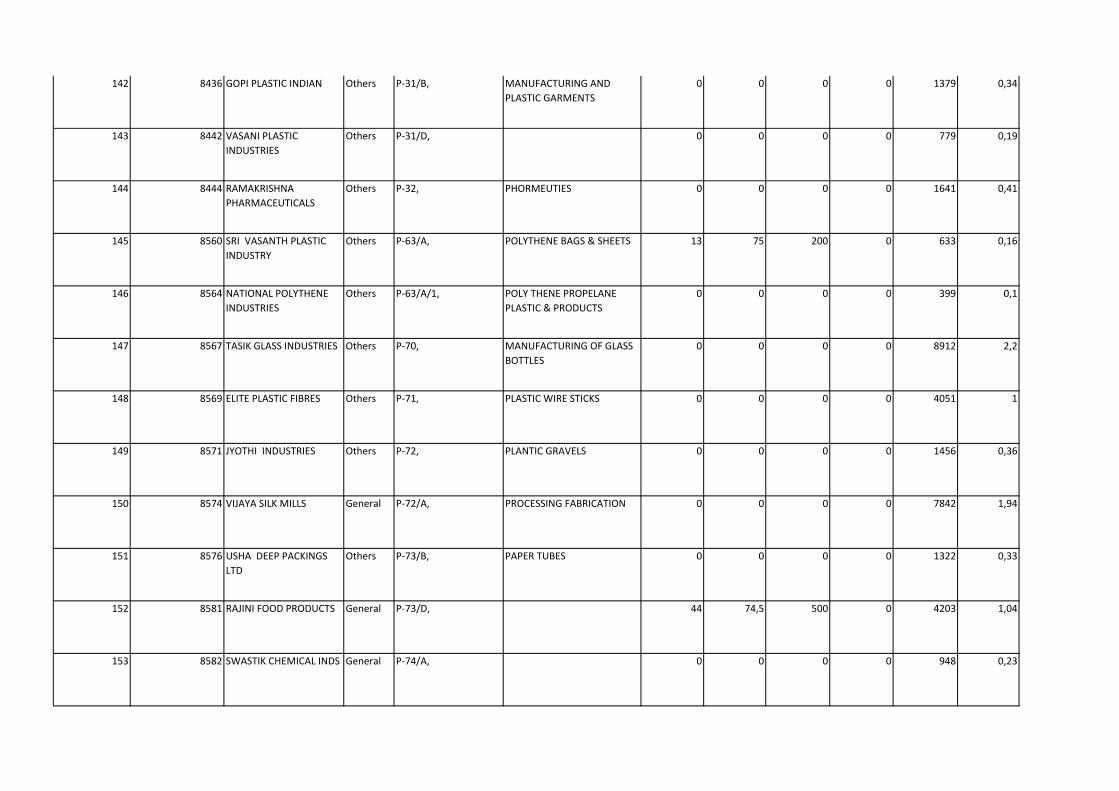
142 8436 GOPI PLASTIC INDIAN Others P-31/B, MANUFACTURING AND
PLASTIC GARMENTS
0 0 0 0 1379 0,34
143 8442 VASANI PLASTIC
INDUSTRIES
Others P-31/D, 0 0 0 0 779 0,19
144 8444 RAMAKRISHNA
PHARMACEUTICALS
Others P-32, PHORMEUTIES 0 0 0 0 1641 0,41
145 8560 SRI VASANTH PLASTIC
INDUSTRY
Others P-63/A, POLYTHENE BAGS & SHEETS 13 75 200 0 633 0,16
146 8564 NATIONAL POLYTHENE
INDUSTRIES
Others P-63/A/1, POLY THENE PROPELANE
PLASTIC & PRODUCTS
0 0 0 0 399 0,1
147 8567 TASIK GLASS INDUSTRIES Others P-70, MANUFACTURING OF GLASS
BOTTLES
0 0 0 0 8912 2,2
148 8569 ELITE PLASTIC FIBRES Others P-71, PLASTIC WIRE STICKS 0 0 0 0 4051 1
149 8571 JYOTHI INDUSTRIES Others P-72, PLANTIC GRAVELS 0 0 0 0 1456 0,36
150 8574 VIJAYA SILK MILLS General P-72/A, PROCESSING FABRICATION 0 0 0 0 7842 1,94
151 8576 USHA DEEP PACKINGS
LTD
Others P-73/B, PAPER TUBES 0 0 0 0 1322 0,33
152 8581 RAJINI FOOD PRODUCTS General P-73/D, 44 74,5 500 0 4203 1,04
153 8582 SWASTIK CHEMICAL INDS General P-74/A, 0 0 0 0 948 0,23
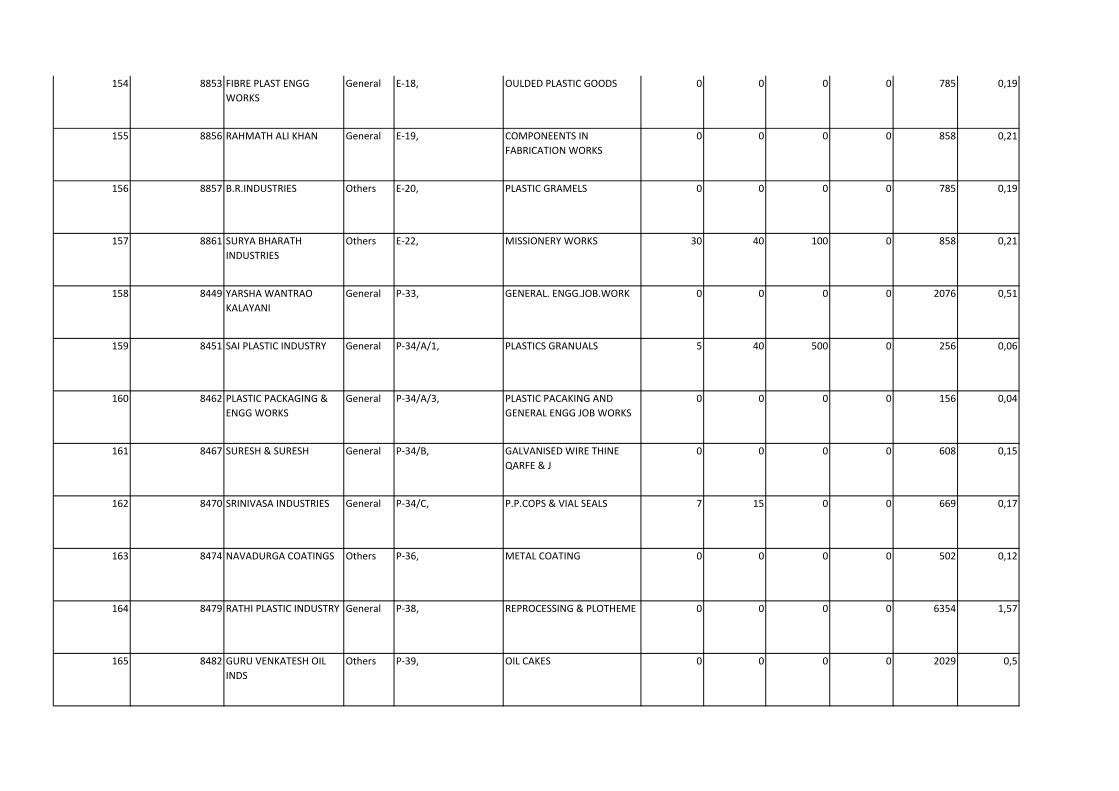
154 8853 FIBRE PLAST ENGG
WORKS
General E-18, OULDED PLASTIC GOODS 0 0 0 0 785 0,19
155 8856 RAHMATH ALI KHAN General E-19, COMPONEENTS IN
FABRICATION WORKS
0 0 0 0 858 0,21
156 8857 B.R.INDUSTRIES Others E-20, PLASTIC GRAMELS 0 0 0 0 785 0,19
157 8861 SURYA BHARATH
INDUSTRIES
Others E-22, MISSIONERY WORKS 30 40 100 0 858 0,21
158 8449 YARSHA WANTRAO
KALAYANI
General P-33, GENERAL. ENGG.JOB.WORK 0 0 0 0 2076 0,51
159 8451 SAI PLASTIC INDUSTRY General P-34/A/1, PLASTICS GRANUALS 5 40 500 0 256 0,06
160 8462 PLASTIC PACKAGING &
ENGG WORKS
General P-34/A/3, PLASTIC PACAKING AND
GENERAL ENGG JOB WORKS
0 0 0 0 156 0,04
161 8467 SURESH & SURESH General P-34/B, GALVANISED WIRE THINE
QARFE & J
0 0 0 0 608 0,15
162 8470 SRINIVASA INDUSTRIES General P-34/C, P.P.COPS & VIAL SEALS 7 15 0 0 669 0,17
163 8474 NAVADURGA COATINGS Others P-36, METAL COATING 0 0 0 0 502 0,12
164 8479 RATHI PLASTIC INDUSTRY General P-38, REPROCESSING & PLOTHEME 0 0 0 0 6354 1,57
165 8482 GURU VENKATESH OIL
INDS
Others P-39, OIL CAKES 0 0 0 0 2029 0,5
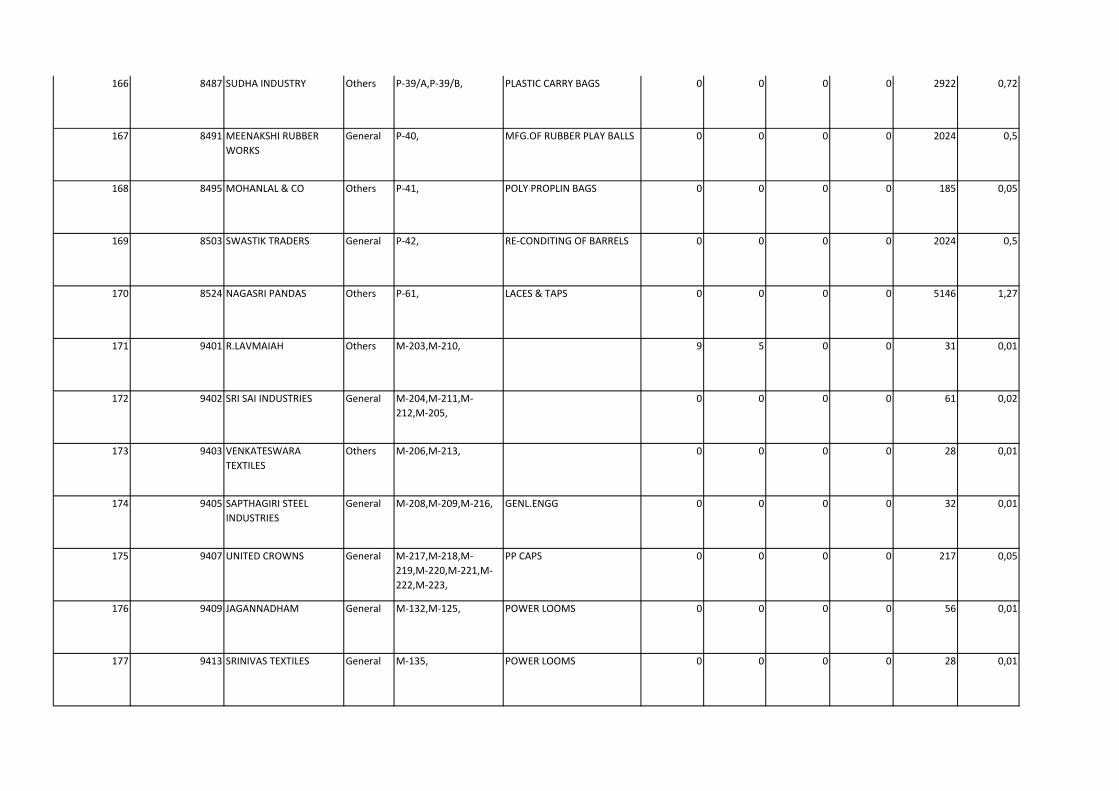
166 8487 SUDHA INDUSTRY Others P-39/A,P-39/B, PLASTIC CARRY BAGS 0 0 0 0 2922 0,72
167 8491 MEENAKSHI RUBBER
WORKS
General P-40, MFG.OF RUBBER PLAY BALLS 0 0 0 0 2024 0,5
168 8495 MOHANLAL & CO Others P-41, POLY PROPLIN BAGS 0 0 0 0 185 0,05
169 8503 SWASTIK TRADERS General P-42, RE-CONDITING OF BARRELS 0 0 0 0 2024 0,5
170 8524 NAGASRI PANDAS Others P-61, LACES & TAPS 0 0 0 0 5146 1,27
171 9401 R.LAVMAIAH Others M-203,M-210, 9 5 0 0 31 0,01
172 9402 SRI SAI INDUSTRIES General M-204,M-211,M-
212,M-205,
0 0 0 0 61 0,02
173 9403 VENKATESWARA
TEXTILES
Others M-206,M-213, 0 0 0 0 28 0,01
174 9405 SAPTHAGIRI STEEL
INDUSTRIES
General M-208,M-209,M-216, GENL.ENGG 0 0 0 0 32 0,01
175 9407 UNITED CROWNS General M-217,M-218,M-
219,M-220,M-221,M-
222,M-223,
PP CAPS 0 0 0 0 217 0,05
176 9409 JAGANNADHAM General M-132,M-125, POWER LOOMS 0 0 0 0 56 0,01
177 9413 SRINIVAS TEXTILES General M-135, POWER LOOMS 0 0 0 0 28 0,01
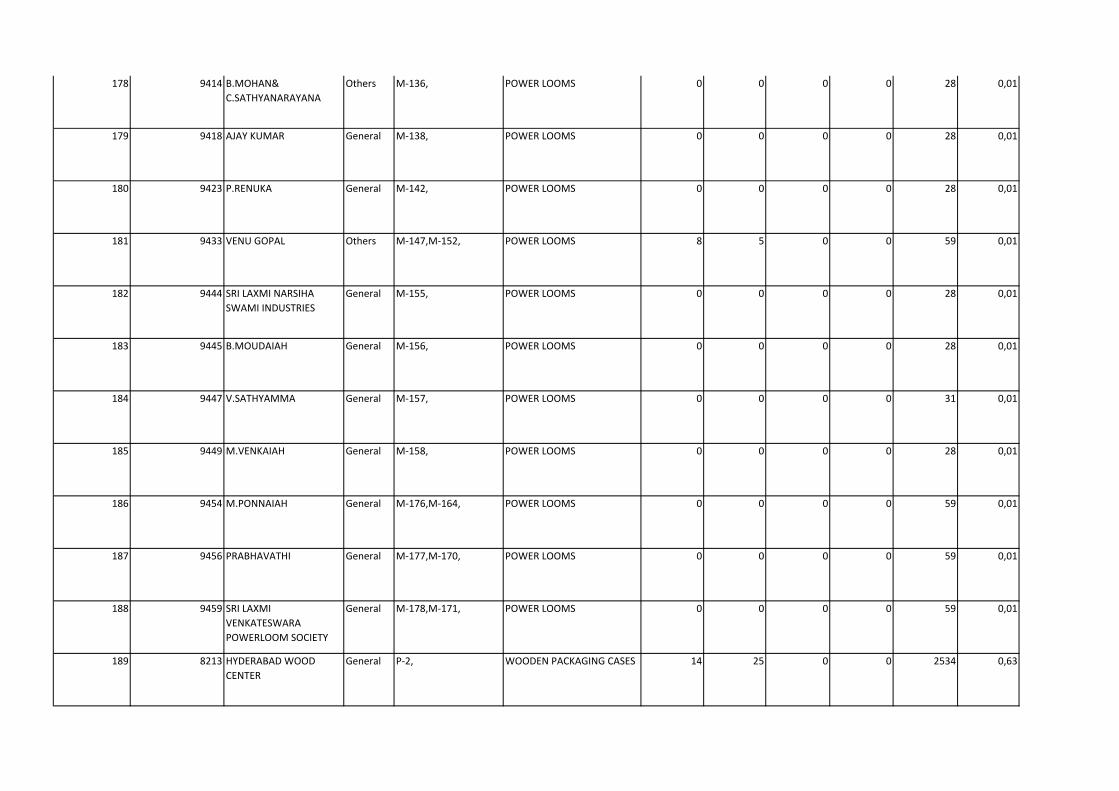
178 9414 B.MOHAN&
C.SATHYANARAYANA
Others M-136, POWER LOOMS 0 0 0 0 28 0,01
179 9418 AJAY KUMAR General M-138, POWER LOOMS 0 0 0 0 28 0,01
180 9423 P.RENUKA General M-142, POWER LOOMS 0 0 0 0 28 0,01
181 9433 VENU GOPAL Others M-147,M-152, POWER LOOMS 8 5 0 0 59 0,01
182 9444 SRI LAXMI NARSIHA
SWAMI INDUSTRIES
General M-155, POWER LOOMS 0 0 0 0 28 0,01
183 9445 B.MOUDAIAH General M-156, POWER LOOMS 0 0 0 0 28 0,01
184 9447 V.SATHYAMMA General M-157, POWER LOOMS 0 0 0 0 31 0,01
185 9449 M.VENKAIAH General M-158, POWER LOOMS 0 0 0 0 28 0,01
186 9454 M.PONNAIAH General M-176,M-164, POWER LOOMS 0 0 0 0 59 0,01
187 9456 PRABHAVATHI General M-177,M-170, POWER LOOMS 0 0 0 0 59 0,01
188 9459 SRI LAXMI
VENKATESWARA
POWERLOOM SOCIETY
General M-178,M-171, POWER LOOMS 0 0 0 0 59 0,01
189 8213 HYDERABAD WOOD
CENTER
General P-2, WOODEN PACKAGING CASES 14 25 0 0 2534 0,63
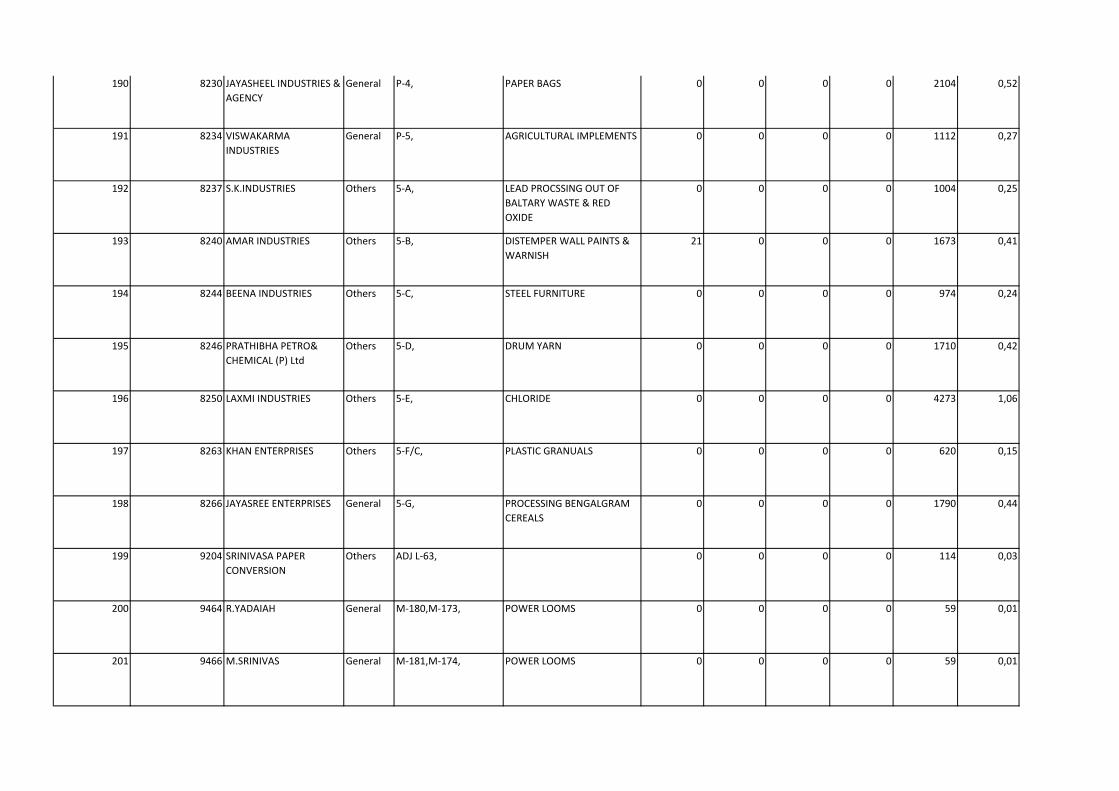
190 8230 JAYASHEEL INDUSTRIES &
AGENCY
General P-4, PAPER BAGS 0 0 0 0 2104 0,52
191 8234 VISWAKARMA
INDUSTRIES
General P-5, AGRICULTURAL IMPLEMENTS 0 0 0 0 1112 0,27
192 8237 S.K.INDUSTRIES Others 5-A, LEAD PROCSSING OUT OF
BALTARY WASTE & RED
OXIDE
0 0 0 0 1004 0,25
193 8240 AMAR INDUSTRIES Others 5-B, DISTEMPER WALL PAINTS &
WARNISH
21 0 0 0 1673 0,41
194 8244 BEENA INDUSTRIES Others 5-C, STEEL FURNITURE 0 0 0 0 974 0,24
195 8246 PRATHIBHA PETRO&
CHEMICAL (P) Ltd
Others 5-D, DRUM YARN 0 0 0 0 1710 0,42
196 8250 LAXMI INDUSTRIES Others 5-E, CHLORIDE 0 0 0 0 4273 1,06
197 8263 KHAN ENTERPRISES Others 5-F/C, PLASTIC GRANUALS 0 0 0 0 620 0,15
198 8266 JAYASREE ENTERPRISES General 5-G, PROCESSING BENGALGRAM
CEREALS
0 0 0 0 1790 0,44
199 9204 SRINIVASA PAPER
CONVERSION
Others ADJ L-63, 0 0 0 0 114 0,03
200 9464 R.YADAIAH General M-180,M-173, POWER LOOMS 0 0 0 0 59 0,01
201 9466 M.SRINIVAS General M-181,M-174, POWER LOOMS 0 0 0 0 59 0,01
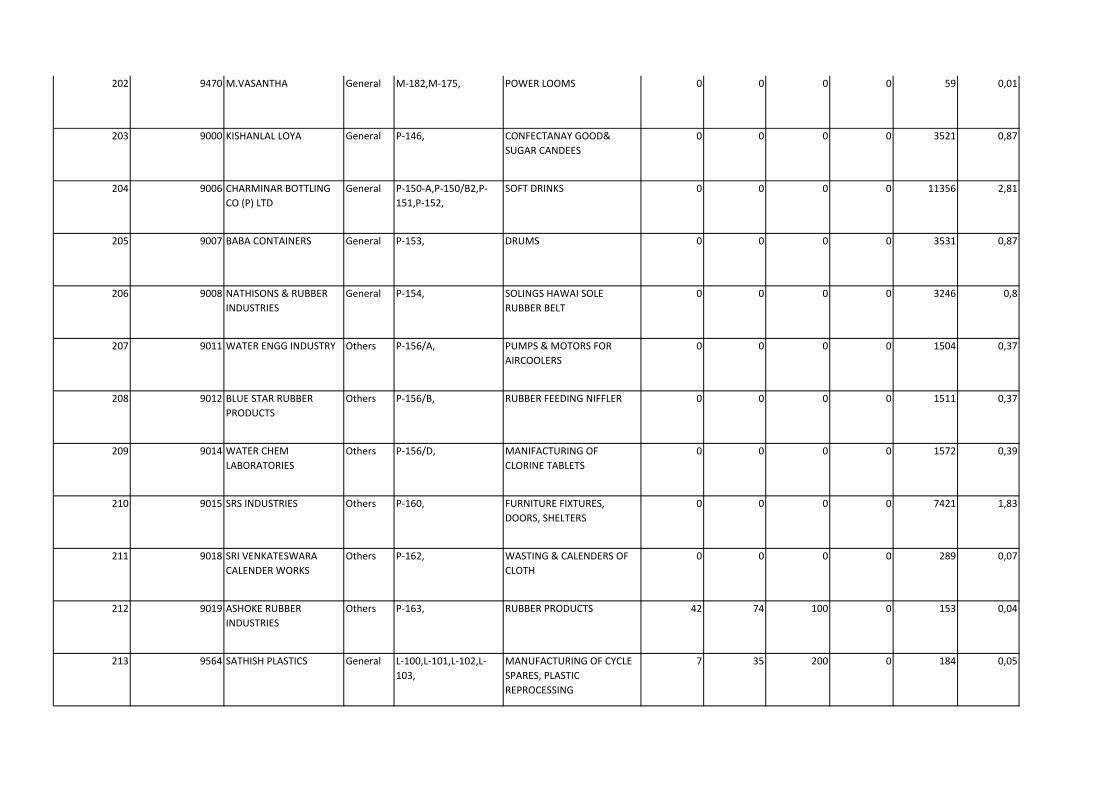
202 9470 M.VASANTHA General M-182,M-175, POWER LOOMS 0 0 0 0 59 0,01
203 9000 KISHANLAL LOYA General P-146, CONFECTANAY GOOD&
SUGAR CANDEES
0 0 0 0 3521 0,87
204 9006 CHARMINAR BOTTLING
CO (P) LTD
General P-150-A,P-150/B2,P-
151,P-152,
SOFT DRINKS 0 0 0 0 11356 2,81
205 9007 BABA CONTAINERS General P-153, DRUMS 0 0 0 0 3531 0,87
206 9008 NATHISONS & RUBBER
INDUSTRIES
General P-154, SOLINGS HAWAI SOLE
RUBBER BELT
0 0 0 0 3246 0,8
207 9011 WATER ENGG INDUSTRY Others P-156/A, PUMPS & MOTORS FOR
AIRCOOLERS
0 0 0 0 1504 0,37
208 9012 BLUE STAR RUBBER
PRODUCTS
Others P-156/B, RUBBER FEEDING NIFFLER 0 0 0 0 1511 0,37
209 9014 WATER CHEM
LABORATORIES
Others P-156/D, MANIFACTURING OF
CLORINE TABLETS
0 0 0 0 1572 0,39
210 9015 SRS INDUSTRIES Others P-160, FURNITURE FIXTURES,
DOORS, SHELTERS
0 0 0 0 7421 1,83
211 9018 SRI VENKATESWARA
CALENDER WORKS
Others P-162, WASTING & CALENDERS OF
CLOTH
0 0 0 0 289 0,07
212 9019 ASHOKE RUBBER
INDUSTRIES
Others P-163, RUBBER PRODUCTS 42 74 100 0 153 0,04
213 9564 SATHISH PLASTICS General L-100,L-101,L-102,L-
103,
MANUFACTURING OF CYCLE
SPARES, PLASTIC
REPROCESSING
7 35 200 0 184 0,05
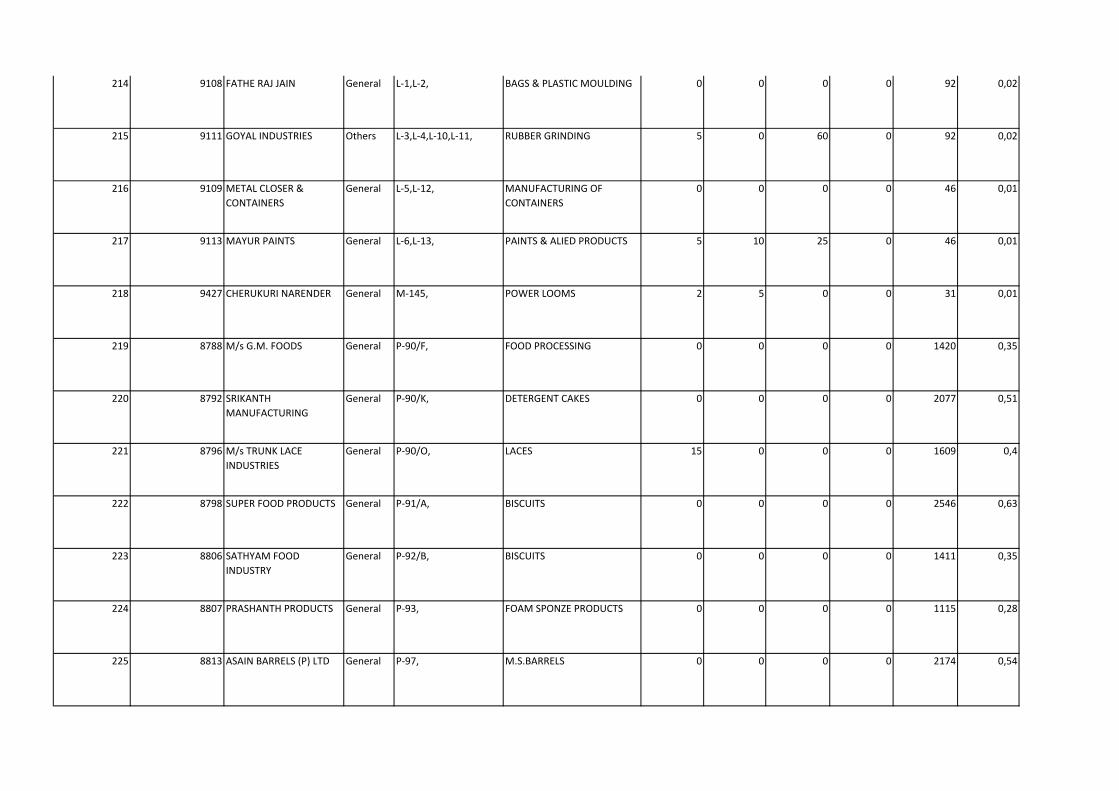
214 9108 FATHE RAJ JAIN General L-1,L-2, BAGS & PLASTIC MOULDING 0 0 0 0 92 0,02
215 9111 GOYAL INDUSTRIES Others L-3,L-4,L-10,L-11, RUBBER GRINDING 5 0 60 0 92 0,02
216 9109 METAL CLOSER &
CONTAINERS
General L-5,L-12, MANUFACTURING OF
CONTAINERS
0 0 0 0 46 0,01
217 9113 MAYUR PAINTS General L-6,L-13, PAINTS & ALIED PRODUCTS 5 10 25 0 46 0,01
218 9427 CHERUKURI NARENDER General M-145, POWER LOOMS 2 5 0 0 31 0,01
219 8788 M/s G.M. FOODS General P-90/F, FOOD PROCESSING 0 0 0 0 1420 0,35
220 8792 SRIKANTH
MANUFACTURING
General P-90/K, DETERGENT CAKES 0 0 0 0 2077 0,51
221 8796 M/s TRUNK LACE
INDUSTRIES
General P-90/O, LACES 15 0 0 0 1609 0,4
222 8798 SUPER FOOD PRODUCTS General P-91/A, BISCUITS 0 0 0 0 2546 0,63
223 8806 SATHYAM FOOD
INDUSTRY
General P-92/B, BISCUITS 0 0 0 0 1411 0,35
224 8807 PRASHANTH PRODUCTS General P-93, FOAM SPONZE PRODUCTS 0 0 0 0 1115 0,28
225 8813 ASAIN BARRELS (P) LTD General P-97, M.S.BARRELS 0 0 0 0 2174 0,54
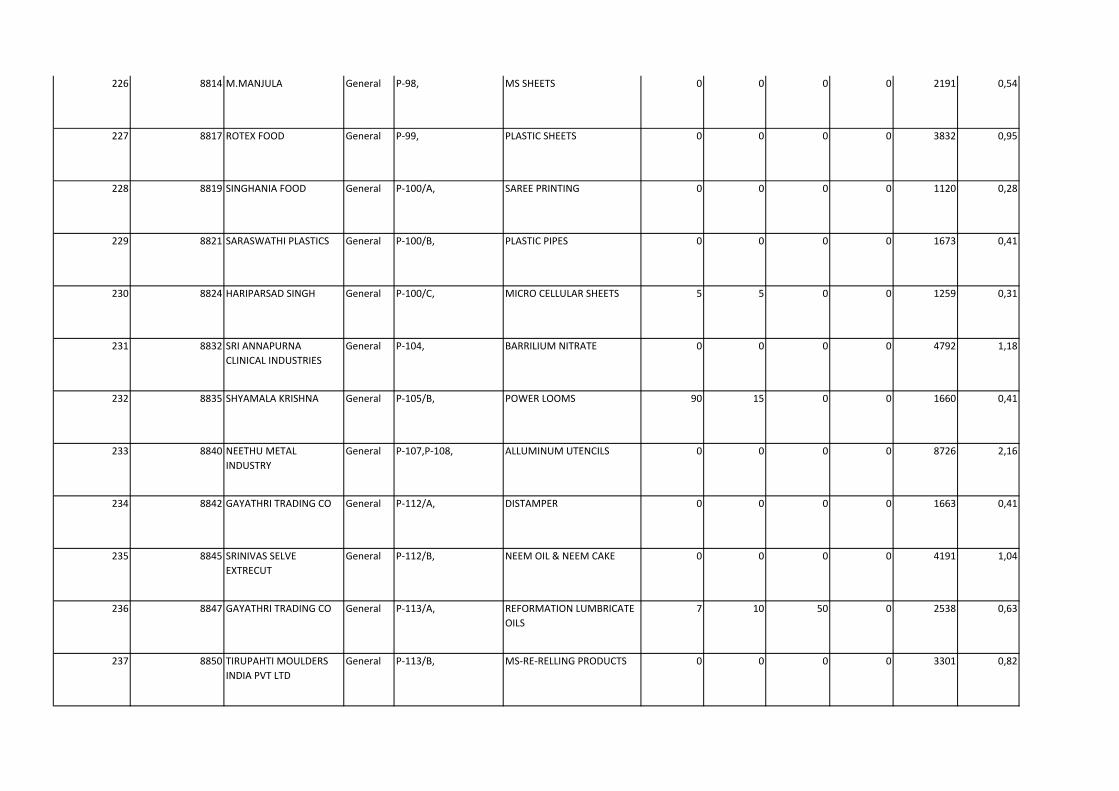
226 8814 M.MANJULA General P-98, MS SHEETS 0 0 0 0 2191 0,54
227 8817 ROTEX FOOD General P-99, PLASTIC SHEETS 0 0 0 0 3832 0,95
228 8819 SINGHANIA FOOD General P-100/A, SAREE PRINTING 0 0 0 0 1120 0,28
229 8821 SARASWATHI PLASTICS General P-100/B, PLASTIC PIPES 0 0 0 0 1673 0,41
230 8824 HARIPARSAD SINGH General P-100/C, MICRO CELLULAR SHEETS 5 5 0 0 1259 0,31
231 8832 SRI ANNAPURNA
CLINICAL INDUSTRIES
General P-104, BARRILIUM NITRATE 0 0 0 0 4792 1,18
232 8835 SHYAMALA KRISHNA General P-105/B, POWER LOOMS 90 15 0 0 1660 0,41
233 8840 NEETHU METAL
INDUSTRY
General P-107,P-108, ALLUMINUM UTENCILS 0 0 0 0 8726 2,16
234 8842 GAYATHRI TRADING CO General P-112/A, DISTAMPER 0 0 0 0 1663 0,41
235 8845 SRINIVAS SELVE
EXTRECUT
General P-112/B, NEEM OIL & NEEM CAKE 0 0 0 0 4191 1,04
236 8847 GAYATHRI TRADING CO General P-113/A, REFORMATION LUMBRICATE
OILS
7 10 50 0 2538 0,63
237 8850 TIRUPAHTI MOULDERS
INDIA PVT LTD
General P-113/B, MS-RE-RELLING PRODUCTS 0 0 0 0 3301 0,82
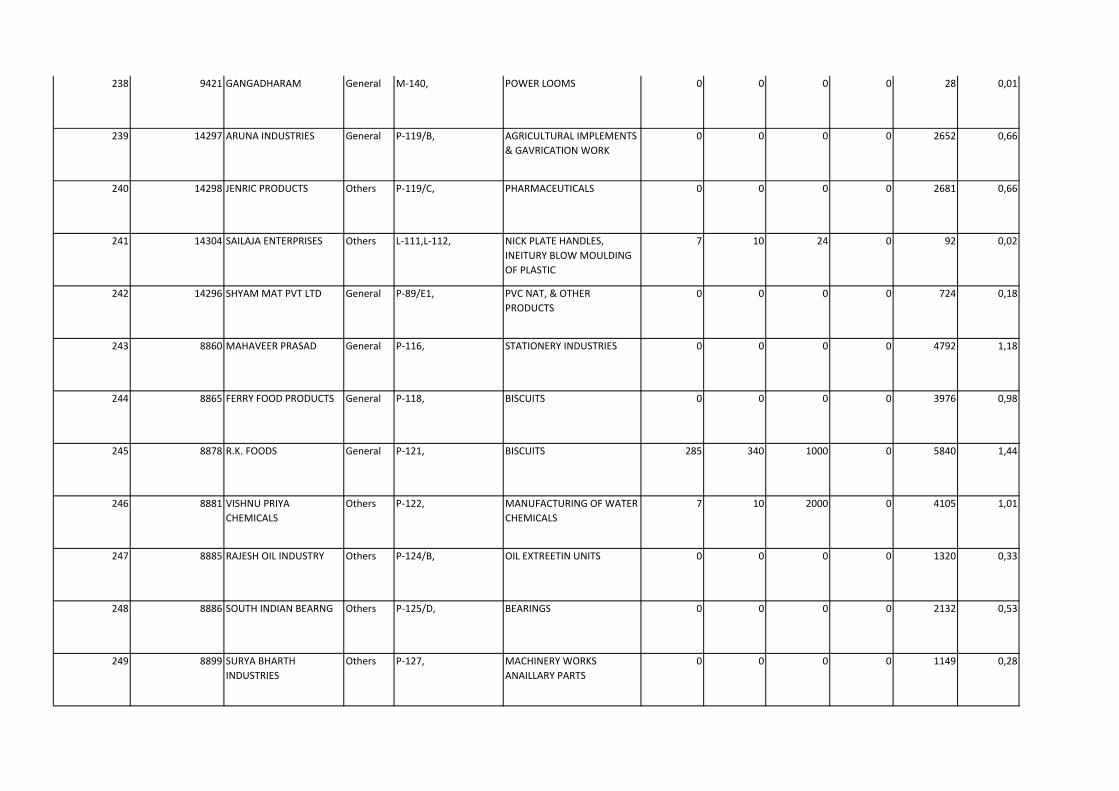
238 9421 GANGADHARAM General M-140, POWER LOOMS 0 0 0 0 28 0,01
239 14297 ARUNA INDUSTRIES General P-119/B, AGRICULTURAL IMPLEMENTS
& GAVRICATION WORK
0 0 0 0 2652 0,66
240 14298 JENRIC PRODUCTS Others P-119/C, PHARMACEUTICALS 0 0 0 0 2681 0,66
241 14304 SAILAJA ENTERPRISES Others L-111,L-112, NICK PLATE HANDLES,
INEITURY BLOW MOULDING
OF PLASTIC
7 10 24 0 92 0,02
242 14296 SHYAM MAT PVT LTD General P-89/E1, PVC NAT, & OTHER
PRODUCTS
0 0 0 0 724 0,18
243 8860 MAHAVEER PRASAD General P-116, STATIONERY INDUSTRIES 0 0 0 0 4792 1,18
244 8865 FERRY FOOD PRODUCTS General P-118, BISCUITS 0 0 0 0 3976 0,98
245 8878 R.K. FOODS General P-121, BISCUITS 285 340 1000 0 5840 1,44
246 8881 VISHNU PRIYA
CHEMICALS
Others P-122, MANUFACTURING OF WATER
CHEMICALS
7 10 2000 0 4105 1,01
247 8885 RAJESH OIL INDUSTRY Others P-124/B, OIL EXTREETIN UNITS 0 0 0 0 1320 0,33
248 8886 SOUTH INDIAN BEARNG Others P-125/D, BEARINGS 0 0 0 0 2132 0,53
249 8899 SURYA BHARTH
INDUSTRIES
Others P-127, MACHINERY WORKS
ANAILLARY PARTS
0 0 0 0 1149 0,28
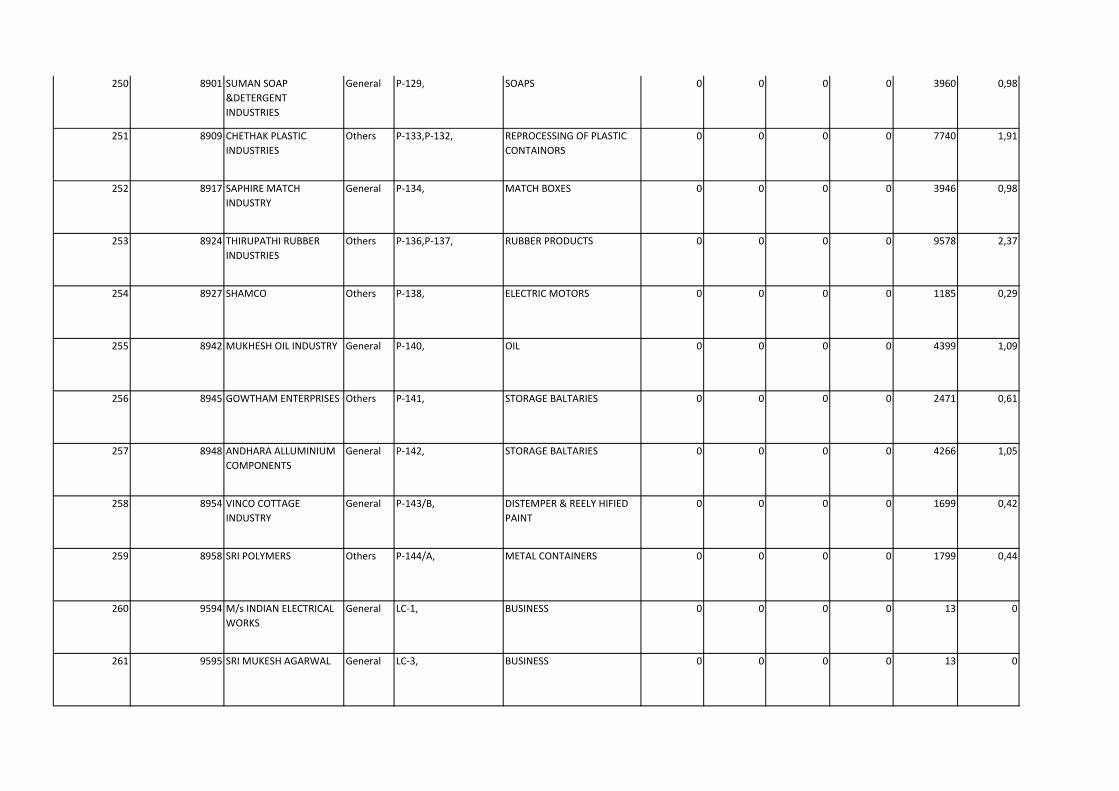
250 8901 SUMAN SOAP
&DETERGENT
INDUSTRIES
General P-129, SOAPS 0 0 0 0 3960 0,98
251 8909 CHETHAK PLASTIC
INDUSTRIES
Others P-133,P-132, REPROCESSING OF PLASTIC
CONTAINORS
0 0 0 0 7740 1,91
252 8917 SAPHIRE MATCH
INDUSTRY
General P-134, MATCH BOXES 0 0 0 0 3946 0,98
253 8924 THIRUPATHI RUBBER
INDUSTRIES
Others P-136,P-137, RUBBER PRODUCTS 0 0 0 0 9578 2,37
254 8927 SHAMCO Others P-138, ELECTRIC MOTORS 0 0 0 0 1185 0,29
255 8942 MUKHESH OIL INDUSTRY General P-140, OIL 0 0 0 0 4399 1,09
256 8945 GOWTHAM ENTERPRISES Others P-141, STORAGE BALTARIES 0 0 0 0 2471 0,61
257 8948 ANDHARA ALLUMINIUM
COMPONENTS
General P-142, STORAGE BALTARIES 0 0 0 0 4266 1,05
258 8954 VINCO COTTAGE
INDUSTRY
General P-143/B, DISTEMPER & REELY HIFIED
PAINT
0 0 0 0 1699 0,42
259 8958 SRI POLYMERS Others P-144/A, METAL CONTAINERS 0 0 0 0 1799 0,44
260 9594 M/s INDIAN ELECTRICAL
WORKS
General LC-1, BUSINESS 0 0 0 0 13 0
261 9595 SRI MUKESH AGARWAL General LC-3, BUSINESS 0 0 0 0 13 0
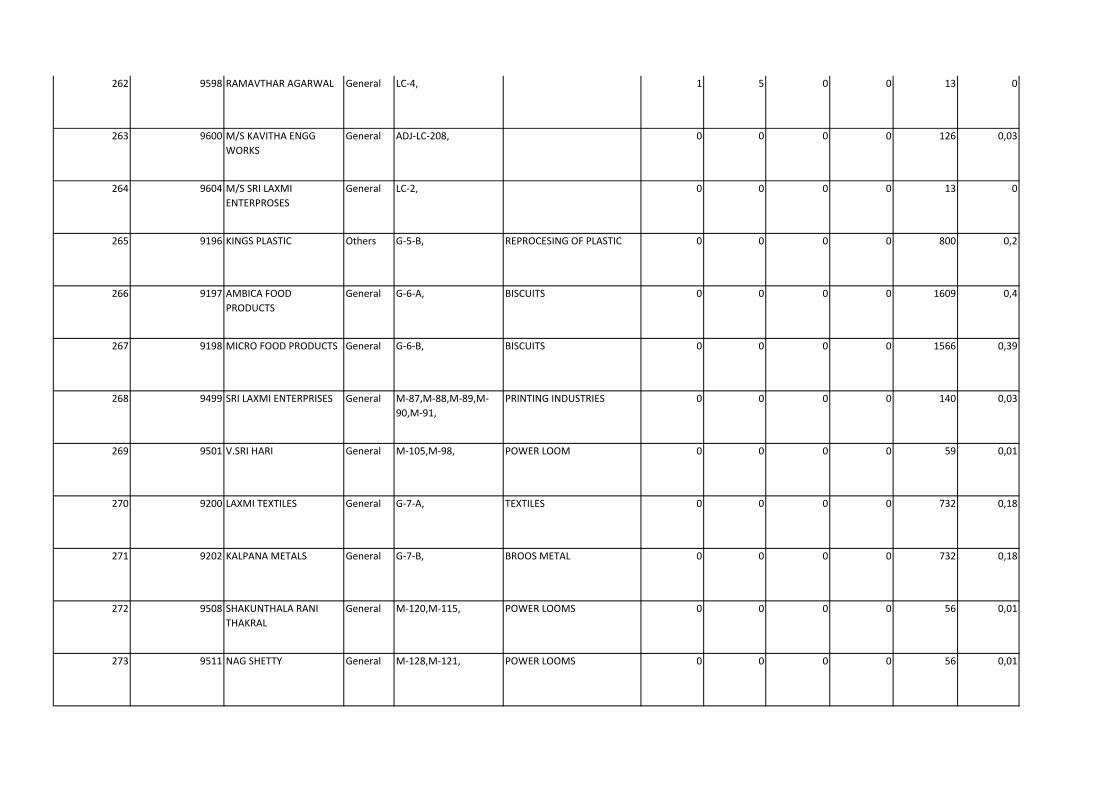
262 9598 RAMAVTHAR AGARWAL General LC-4, 1 5 0 0 13 0
263 9600 M/S KAVITHA ENGG
WORKS
General ADJ-LC-208, 0 0 0 0 126 0,03
264 9604 M/S SRI LAXMI
ENTERPROSES
General LC-2, 0 0 0 0 13 0
265 9196 KINGS PLASTIC Others G-5-B, REPROCESING OF PLASTIC 0 0 0 0 800 0,2
266 9197 AMBICA FOOD
PRODUCTS
General G-6-A, BISCUITS 0 0 0 0 1609 0,4
267 9198 MICRO FOOD PRODUCTS General G-6-B, BISCUITS 0 0 0 0 1566 0,39
268 9499 SRI LAXMI ENTERPRISES General M-87,M-88,M-89,M-
90,M-91,
PRINTING INDUSTRIES 0 0 0 0 140 0,03
269 9501 V.SRI HARI General M-105,M-98, POWER LOOM 0 0 0 0 59 0,01
270 9200 LAXMI TEXTILES General G-7-A, TEXTILES 0 0 0 0 732 0,18
271 9202 KALPANA METALS General G-7-B, BROOS METAL 0 0 0 0 732 0,18
272 9508 SHAKUNTHALA RANI
THAKRAL
General M-120,M-115, POWER LOOMS 0 0 0 0 56 0,01
273 9511 NAG SHETTY General M-128,M-121, POWER LOOMS 0 0 0 0 56 0,01
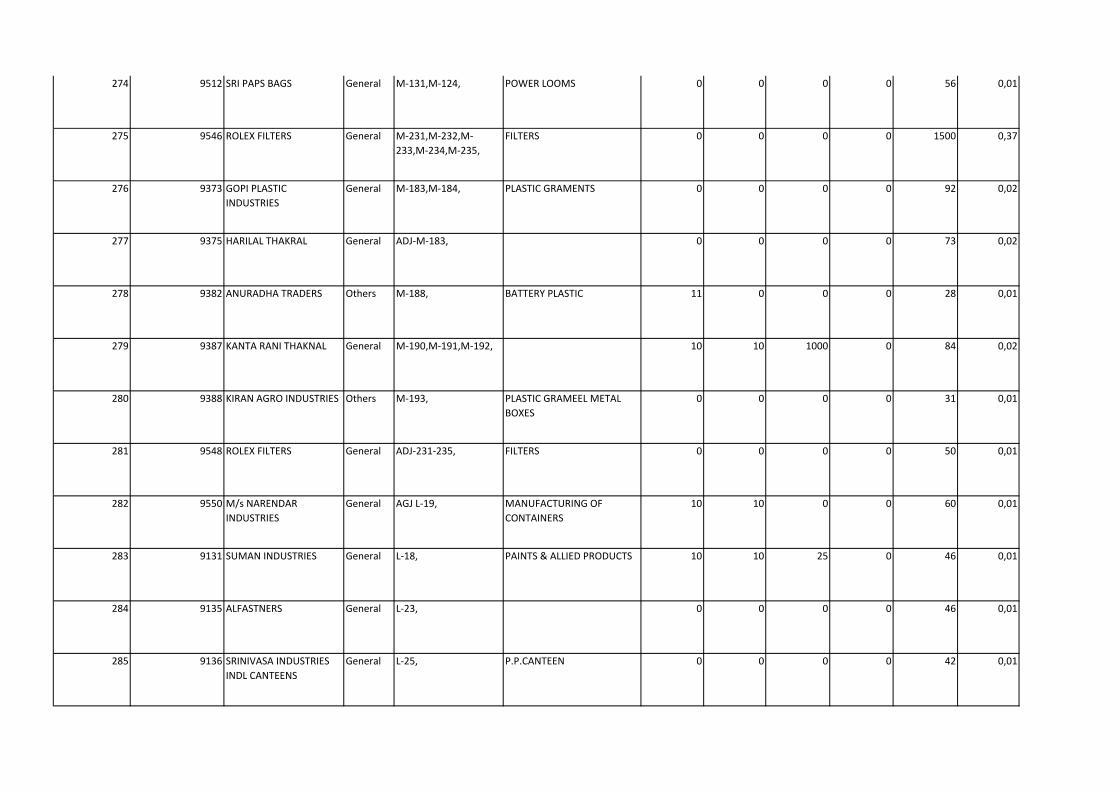
274 9512 SRI PAPS BAGS General M-131,M-124, POWER LOOMS 0 0 0 0 56 0,01
275 9546 ROLEX FILTERS General M-231,M-232,M-
233,M-234,M-235,
FILTERS 0 0 0 0 1500 0,37
276 9373 GOPI PLASTIC
INDUSTRIES
General M-183,M-184, PLASTIC GRAMENTS 0 0 0 0 92 0,02
277 9375 HARILAL THAKRAL General ADJ-M-183, 0 0 0 0 73 0,02
278 9382 ANURADHA TRADERS Others M-188, BATTERY PLASTIC 11 0 0 0 28 0,01
279 9387 KANTA RANI THAKNAL General M-190,M-191,M-192, 10 10 1000 0 84 0,02
280 9388 KIRAN AGRO INDUSTRIES Others M-193, PLASTIC GRAMEEL METAL
BOXES
0 0 0 0 31 0,01
281 9548 ROLEX FILTERS General ADJ-231-235, FILTERS 0 0 0 0 50 0,01
282 9550 M/s NARENDAR
INDUSTRIES
General AGJ L-19, MANUFACTURING OF
CONTAINERS
10 10 0 0 60 0,01
283 9131 SUMAN INDUSTRIES General L-18, PAINTS & ALLIED PRODUCTS 10 10 25 0 46 0,01
284 9135 ALFASTNERS General L-23, 0 0 0 0 46 0,01
285 9136 SRINIVASA INDUSTRIES
INDL CANTEENS
General L-25, P.P.CANTEEN 0 0 0 0 42 0,01
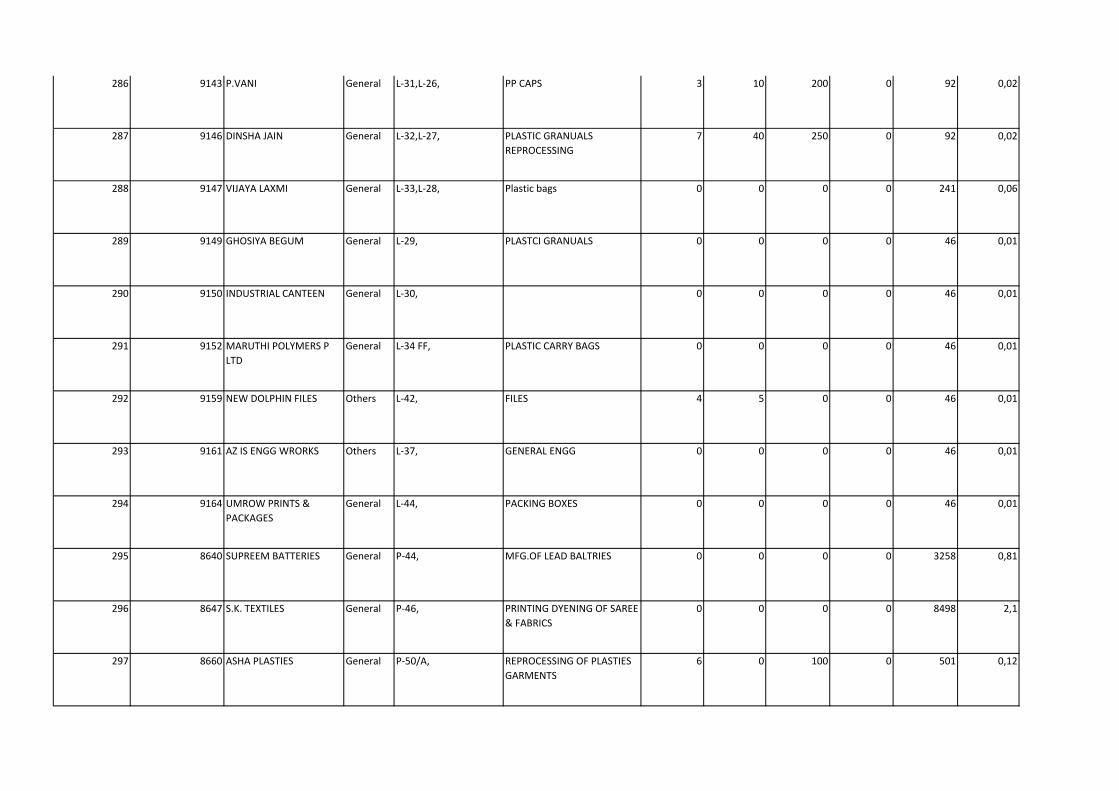
286 9143 P.VANI General L-31,L-26, PP CAPS 3 10 200 0 92 0,02
287 9146 DINSHA JAIN General L-32,L-27, PLASTIC GRANUALS
REPROCESSING
7 40 250 0 92 0,02
288 9147 VIJAYA LAXMI General L-33,L-28, Plastic bags 0 0 0 0 241 0,06
289 9149 GHOSIYA BEGUM General L-29, PLASTCI GRANUALS 0 0 0 0 46 0,01
290 9150 INDUSTRIAL CANTEEN General L-30, 0 0 0 0 46 0,01
291 9152 MARUTHI POLYMERS P
LTD
General L-34 FF, PLASTIC CARRY BAGS 0 0 0 0 46 0,01
292 9159 NEW DOLPHIN FILES Others L-42, FILES 4 5 0 0 46 0,01
293 9161 AZ IS ENGG WRORKS Others L-37, GENERAL ENGG 0 0 0 0 46 0,01
294 9164 UMROW PRINTS &
PACKAGES
General L-44, PACKING BOXES 0 0 0 0 46 0,01
295 8640 SUPREEM BATTERIES General P-44, MFG.OF LEAD BALTRIES 0 0 0 0 3258 0,81
296 8647 S.K. TEXTILES General P-46, PRINTING DYENING OF SAREE
& FABRICS
0 0 0 0 8498 2,1
297 8660 ASHA PLASTIES General P-50/A, REPROCESSING OF PLASTIES
GARMENTS
6 0 100 0 501 0,12
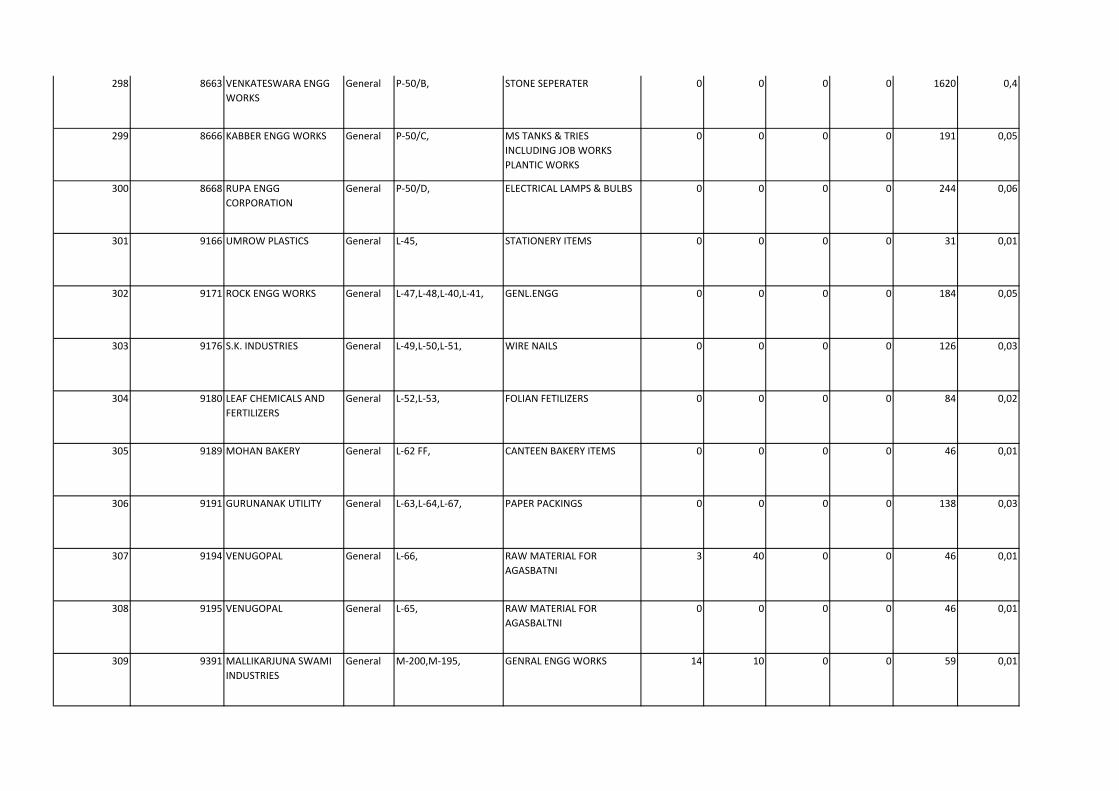
298 8663 VENKATESWARA ENGG
WORKS
General P-50/B, STONE SEPERATER 0 0 0 0 1620 0,4
299 8666 KABBER ENGG WORKS General P-50/C, MS TANKS & TRIES
INCLUDING JOB WORKS
PLANTIC WORKS
0 0 0 0 191 0,05
300 8668 RUPA ENGG
CORPORATION
General P-50/D, ELECTRICAL LAMPS & BULBS 0 0 0 0 244 0,06
301 9166 UMROW PLASTICS General L-45, STATIONERY ITEMS 0 0 0 0 31 0,01
302 9171 ROCK ENGG WORKS General L-47,L-48,L-40,L-41, GENL.ENGG 0 0 0 0 184 0,05
303 9176 S.K. INDUSTRIES General L-49,L-50,L-51, WIRE NAILS 0 0 0 0 126 0,03
304 9180 LEAF CHEMICALS AND
FERTILIZERS
General L-52,L-53, FOLIAN FETILIZERS 0 0 0 0 84 0,02
305 9189 MOHAN BAKERY General L-62 FF, CANTEEN BAKERY ITEMS 0 0 0 0 46 0,01
306 9191 GURUNANAK UTILITY General L-63,L-64,L-67, PAPER PACKINGS 0 0 0 0 138 0,03
307 9194 VENUGOPAL General L-66, RAW MATERIAL FOR
AGASBATNI
3 40 0 0 46 0,01
308 9195 VENUGOPAL General L-65, RAW MATERIAL FOR
AGASBALTNI
0 0 0 0 46 0,01
309 9391 MALLIKARJUNA SWAMI
INDUSTRIES
General M-200,M-195, GENRAL ENGG WORKS 14 10 0 0 59 0,01
310 9396 SHIRIDI METAL General M-198, metal 0 0 0 0 28 0,01
311 14294 REX FOOD General P-58/C, BISCUITS 0 0 0 0 1160 0,29
312 14655 APSEB Others P-70/A, SUBSTATION 0 0 0 0 8781 2,17
313 14661 JAGADISH & SADANA General G-2-B, BISCUITS 0 0 0 0 732 0,18
314 14662 SIRAJ INDUSTRIES
MIZUBA ENTERPRISES
General M-5, RUBBER CRUSHING 0 0 0 0 34 0,01
315 9217 VIJAYA PLASTIC
INDUSTRIES
General L-86, PLASTIC GOODS 0 0 0 0 46 0,01
316 9309 DURGAVATHI DEVI General ADJ L-183, FILTERS 0 0 0 0 79 0,02
317 14975 SUPER RUBBER
INDUSTRIES
General P-90/I, HAWIN RUBBER SHEETS 0 0 0 0 2124 0,52
318 8980 ELECTRO FLO BATTERIES
P LTD
General E-4, STORAGE BATTERIES 0 0 0 0 1004 0,25
319 32131 M/S R.K ENTERPRISES P-159/K, 0 0 0 0 166 0,04
320 24501 KEDARNATH SILK MILLS General P-59,P-60,P-109,P-110, CLOTH DYES & CHEMICALS 0 0 0 0 13840 3,42
321 24537 HARRION METAL TUBES General P-84/C, POLYTHENCE BAGS 0 0 0 0 1433 0,35
322 25893 U.SHANKARAIAH General M-111,M-112,M-116, POWER LOOMS 0 0 0 0 84 0,02
323 8578 SRI VENKATESHWARA
HANDLOOMS CLOTH
DYEING INDUSTRIES
General P-73/C, TEXTILE PROCESSING 0 0 0 0 2209 0,55
324 8742 ANITHA SANGHVI General P-89/A1,P-89/A2, FURNITURE 29 2 250 0 1654 0,41
325 9173 VASUNDARA PLASTIC General G-3-A, MFG.REPROCESSING DELETS
IN ALOL KINDS OF PLASTIC
GOODS
0 0 0 0 732 0,18
326 25888 VANKATESHWARA ENGG General L-163, GENL.ENGG 0 0 0 0 46 0,01
327 9210 NEW HYDERABAD Others L-75,L-76, DISTELLED NALES 5 20 200 0 84 0,02
328 9303 NEW HYDERABAD
AERONAUTICS
General L-182,L-175, REPROCESSING OF PLASTIC 5 240 2000 0 99 0,02
329 9348 K.RAJESHWAR RAO General M-53, OFFSET PLATE MOULDING 0 0 0 0 31 0,01
330 8749 AMAIN PALSTICS General P-89/C, REPROCESSING OF PLASTIC
GARMENTS
0 0 0 0 2109 0,52
331 8947 JAYASREE INDUSTRIES General D-2, 0 0 0 0 2502 0,62
332 9141 NAVEEN INDUSTIES General F-4,F-5, NON EDIBLE OIL 25 50 1000 0 1652 0,41
333 9362 RAM CHANDHER General M-62, RAM CHANDER 0 0 0 0 28 0,01
334 9002 SANTHOSH BHADORI
INDUSTRIES
General P-147, CALENDER OF CLOTH JOB
WORKS
0 0 0 0 3871 0,96
335 8809 RATHAN RUBBER WORKS General P-94, RUBBER PRODUCTS 0 0 0 0 1963 0,49
336 9507 SRI LAXMI TEXTILES General M-119,M-114, POWER LOOMS 0 0 0 0 59 0,01
337 9385 HIRALAL Others M-186, PLASTCI DIPOULDED WIRES &
GLASSES
0 0 0 0 31 0,01
338 8864 BHUTADA INDUSTRIES General E-23, TAPE , PAPER ROLL 0 0 0 0 785 0,19
339 8920 OM DAL MILL INDUSTRY General P-135, PROCESSING OF DALL 0 0 0 0 3602 0,89
340 9419 MANIBHUSHAN KUMAR General M-139, POWER LOOMS 0 0 0 0 31 0,01
341 8951 UNIVERSAL CONSUMRS General P-143/A, POLYTHENE FILAMENT BAGS 0 0 0 0 1729 0,43
342 9404 BHAGYALAXMI ENGG
WORKS
General M-207,M-207, GENERAL ENGG WORKS 0 0 0 0 31 0,01
343 8747 RAJESHWARAI General P-89/B2, GREY OXIDE 0 0 0 0 1423 0,35
344 9145 VISHWAL INDUSTRIES General F-6,F-7,F-8,F-9, DRY COLOUR PAINTS &
METAL CONTAINERS
0 0 0 0 2880 0,71
345 9221 DASMESH ENGG WORKS Others L-88, GENERAL ENGG 0 0 0 0 46 0,01
346 9239 S.SUJATHA Others L-125, GENERAL ENGG WORKS 4 5 0 0 46 0,01
347 9264 ROHITH CHEMICALS Others L-146, COPPER SULPHATE 0 0 0 0 28 0,01
348 9311 M.SRINIVAS General L-198,L-193, FRP PRODUCTS 0 0 0 0 126 0,03
349 9319 M.SRINIVAS Others L-201,L-196, PAINTS 0 10 0 0 92 0,02
350 9262 KRISHNA Others ADJ-M-1, BAKERY ITEMS 6 0 0 0 102 0,03
351 9306 GEETHA TRADERS PRINCE
CHEMICALS LABS
Others M-16, STEEL & WOODEN
FURNITURE CHEMICALS
0 0 0 0 31 0,01
352 9250 SRI SHIRDISAI FOODS Others G-8-B, BISCUITS 0 0 0 0 732 0,18
353 14652 ANAND DOLL MILLS General P-45, PROCESSING OF DAL,
CEAREALS
0 0 0 0 8498 2,1
354 8916 GLAMMA MIRSUM
INDUSTRIES
Others E-34, DECORATINE GLASS &
MIRROR
0 0 0 0 858 0,21
355 8971 HR KANODIA
ENTERPRISES
Others D-6, CLOTH PRINTING & DYING 0 0 0 0 1744 0,43
356 9430 MALAMMA SAM Others M-146, POWER LOOMS 0 0 0 0 28 0,01
357 9016 VASU PLANETIES General P-161, PLASTIC MOULDED ARTICLES 8 25 300 0 248 0,06
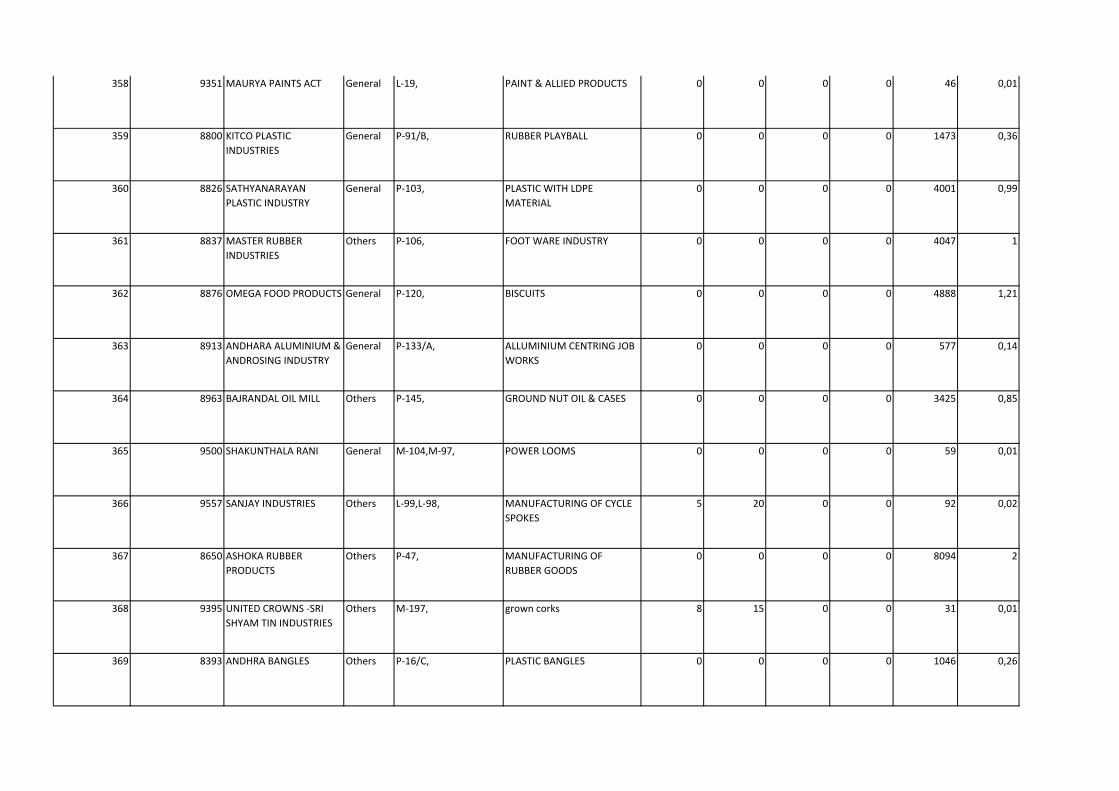
358 9351 MAURYA PAINTS ACT General L-19, PAINT & ALLIED PRODUCTS 0 0 0 0 46 0,01
359 8800 KITCO PLASTIC
INDUSTRIES
General P-91/B, RUBBER PLAYBALL 0 0 0 0 1473 0,36
360 8826 SATHYANARAYAN
PLASTIC INDUSTRY
General P-103, PLASTIC WITH LDPE
MATERIAL
0 0 0 0 4001 0,99
361 8837 MASTER RUBBER
INDUSTRIES
Others P-106, FOOT WARE INDUSTRY 0 0 0 0 4047 1
362 8876 OMEGA FOOD PRODUCTS General P-120, BISCUITS 0 0 0 0 4888 1,21
363 8913 ANDHARA ALUMINIUM &
ANDROSING INDUSTRY
General P-133/A, ALLUMINIUM CENTRING JOB
WORKS
0 0 0 0 577 0,14
364 8963 BAJRANDAL OIL MILL Others P-145, GROUND NUT OIL & CASES 0 0 0 0 3425 0,85
365 9500 SHAKUNTHALA RANI General M-104,M-97, POWER LOOMS 0 0 0 0 59 0,01
366 9557 SANJAY INDUSTRIES Others L-99,L-98, MANUFACTURING OF CYCLE
SPOKES
5 20 0 0 92 0,02
367 8650 ASHOKA RUBBER
PRODUCTS
Others P-47, MANUFACTURING OF
RUBBER GOODS
0 0 0 0 8094 2
368 9395 UNITED CROWNS -SRI
SHYAM TIN INDUSTRIES
Others M-197, grown corks 8 15 0 0 31 0,01
369 8393 ANDHRA BANGLES Others P-16/C, PLASTIC BANGLES 0 0 0 0 1046 0,26
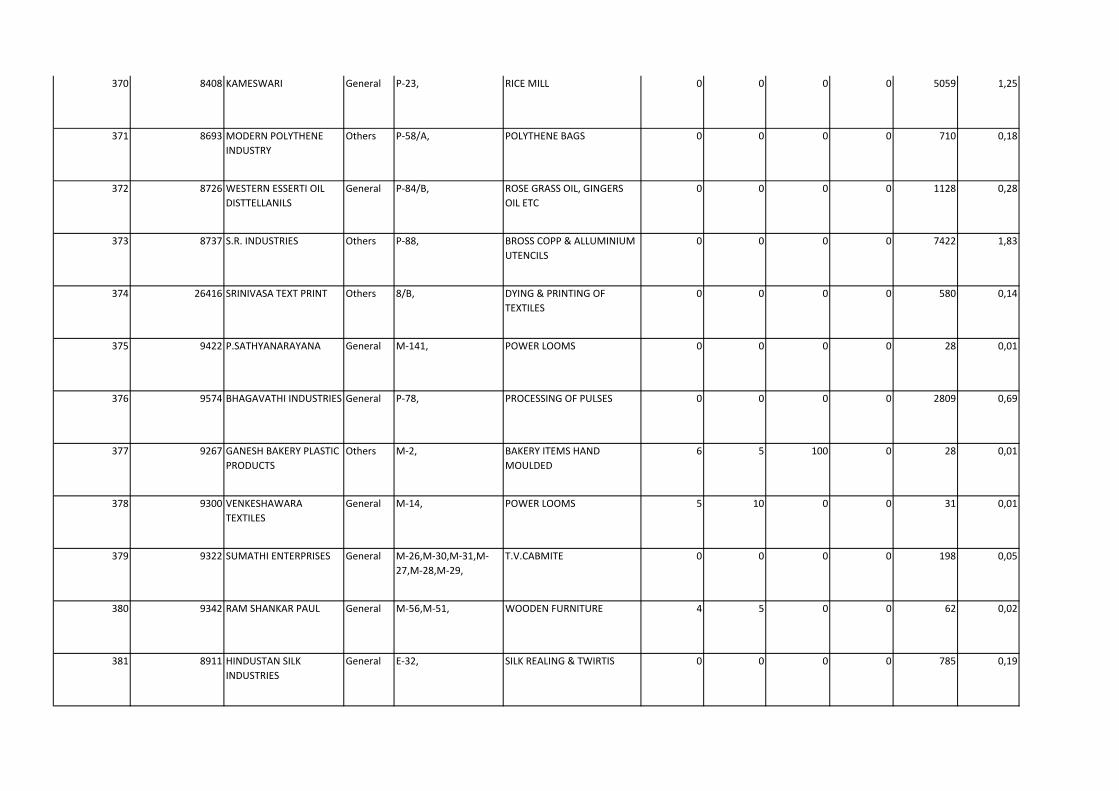
370 8408 KAMESWARI General P-23, RICE MILL 0 0 0 0 5059 1,25
371 8693 MODERN POLYTHENE
INDUSTRY
Others P-58/A, POLYTHENE BAGS 0 0 0 0 710 0,18
372 8726 WESTERN ESSERTI OIL
DISTTELLANILS
General P-84/B, ROSE GRASS OIL, GINGERS
OIL ETC
0 0 0 0 1128 0,28
373 8737 S.R. INDUSTRIES Others P-88, BROSS COPP & ALLUMINIUM
UTENCILS
0 0 0 0 7422 1,83
374 26416 SRINIVASA TEXT PRINT Others 8/B, DYING & PRINTING OF
TEXTILES
0 0 0 0 580 0,14
375 9422 P.SATHYANARAYANA General M-141, POWER LOOMS 0 0 0 0 28 0,01
376 9574 BHAGAVATHI INDUSTRIES General P-78, PROCESSING OF PULSES 0 0 0 0 2809 0,69
377 9267 GANESH BAKERY PLASTIC
PRODUCTS
Others M-2, BAKERY ITEMS HAND
MOULDED
6 5 100 0 28 0,01
378 9300 VENKESHAWARA
TEXTILES
General M-14, POWER LOOMS 5 10 0 0 31 0,01
379 9322 SUMATHI ENTERPRISES General M-26,M-30,M-31,M-
27,M-28,M-29,
T.V.CABMITE 0 0 0 0 198 0,05
380 9342 RAM SHANKAR PAUL General M-56,M-51, WOODEN FURNITURE 4 5 0 0 62 0,02
381 8911 HINDUSTAN SILK
INDUSTRIES
General E-32, SILK REALING & TWIRTIS 0 0 0 0 785 0,19
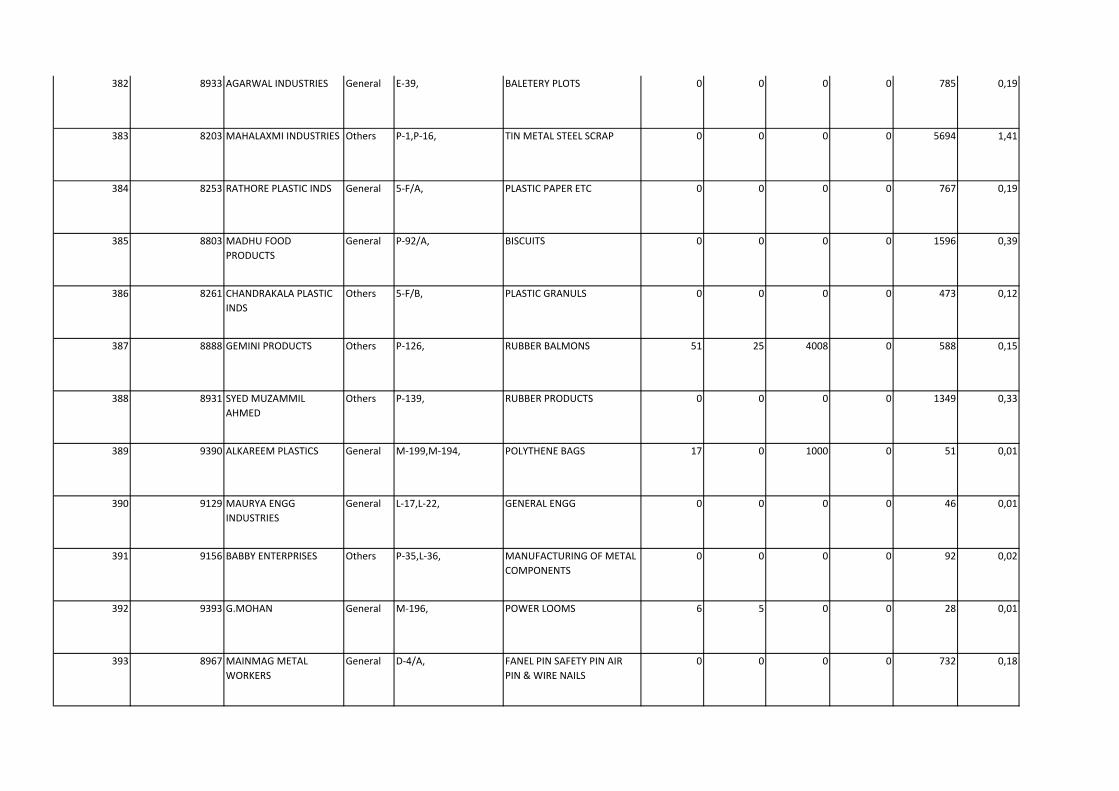
382 8933 AGARWAL INDUSTRIES General E-39, BALETERY PLOTS 0 0 0 0 785 0,19
383 8203 MAHALAXMI INDUSTRIES Others P-1,P-16, TIN METAL STEEL SCRAP 0 0 0 0 5694 1,41
384 8253 RATHORE PLASTIC INDS General 5-F/A, PLASTIC PAPER ETC 0 0 0 0 767 0,19
385 8803 MADHU FOOD
PRODUCTS
General P-92/A, BISCUITS 0 0 0 0 1596 0,39
386 8261 CHANDRAKALA PLASTIC
INDS
Others 5-F/B, PLASTIC GRANULS 0 0 0 0 473 0,12
387 8888 GEMINI PRODUCTS Others P-126, RUBBER BALMONS 51 25 4008 0 588 0,15
388 8931 SYED MUZAMMIL
AHMED
Others P-139, RUBBER PRODUCTS 0 0 0 0 1349 0,33
389 9390 ALKAREEM PLASTICS General M-199,M-194, POLYTHENE BAGS 17 0 1000 0 51 0,01
390 9129 MAURYA ENGG
INDUSTRIES
General L-17,L-22, GENERAL ENGG 0 0 0 0 46 0,01
391 9156 BABBY ENTERPRISES Others P-35,L-36, MANUFACTURING OF METAL
COMPONENTS
0 0 0 0 92 0,02
392 9393 G.MOHAN General M-196, POWER LOOMS 6 5 0 0 28 0,01
393 8967 MAINMAG METAL
WORKERS
General D-4/A, FANEL PIN SAFETY PIN AIR
PIN & WIRE NAILS
0 0 0 0 732 0,18
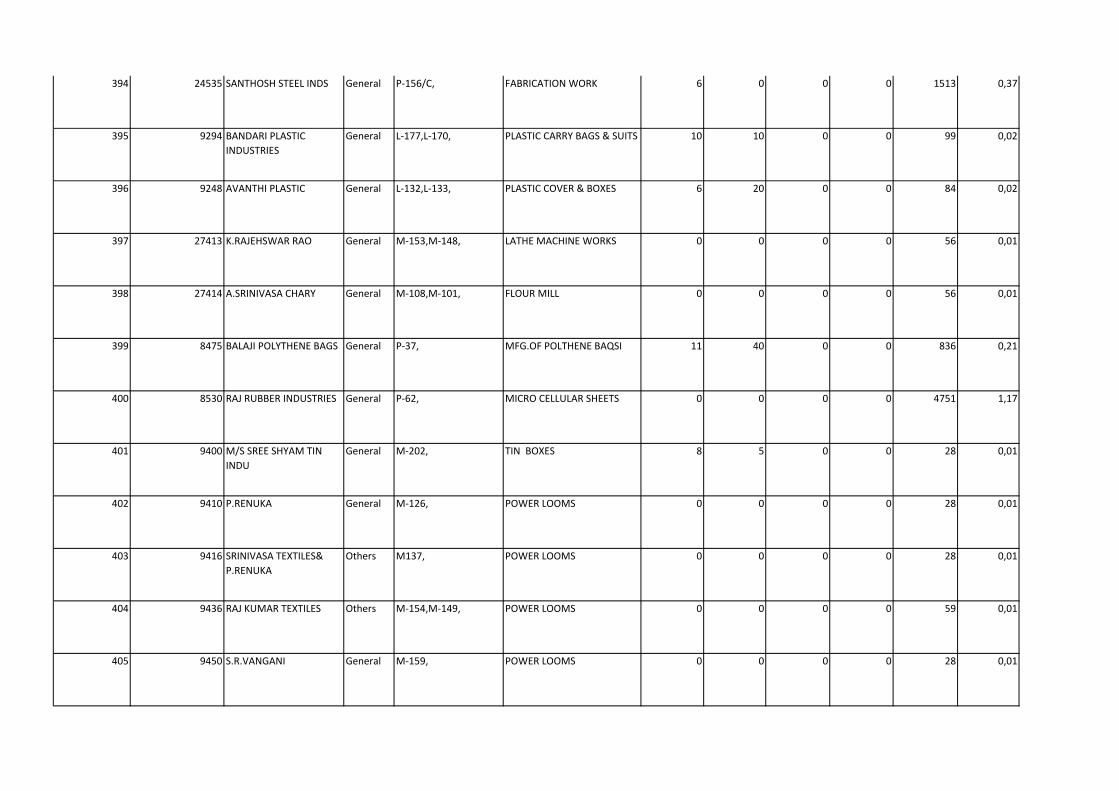
394 24535 SANTHOSH STEEL INDS General P-156/C, FABRICATION WORK 6 0 0 0 1513 0,37
395 9294 BANDARI PLASTIC
INDUSTRIES
General L-177,L-170, PLASTIC CARRY BAGS & SUITS 10 10 0 0 99 0,02
396 9248 AVANTHI PLASTIC General L-132,L-133, PLASTIC COVER & BOXES 6 20 0 0 84 0,02
397 27413 K.RAJEHSWAR RAO General M-153,M-148, LATHE MACHINE WORKS 0 0 0 0 56 0,01
398 27414 A.SRINIVASA CHARY General M-108,M-101, FLOUR MILL 0 0 0 0 56 0,01
399 8475 BALAJI POLYTHENE BAGS General P-37, MFG.OF POLTHENE BAQSI 11 40 0 0 836 0,21
400 8530 RAJ RUBBER INDUSTRIES General P-62, MICRO CELLULAR SHEETS 0 0 0 0 4751 1,17
401 9400 M/S SREE SHYAM TIN
INDU
General M-202, TIN BOXES 8 5 0 0 28 0,01
402 9410 P.RENUKA General M-126, POWER LOOMS 0 0 0 0 28 0,01
403 9416 SRINIVASA TEXTILES&
P.RENUKA
Others M137, POWER LOOMS 0 0 0 0 28 0,01
404 9436 RAJ KUMAR TEXTILES Others M-154,M-149, POWER LOOMS 0 0 0 0 59 0,01
405 9450 S.R.VANGANI General M-159, POWER LOOMS 0 0 0 0 28 0,01
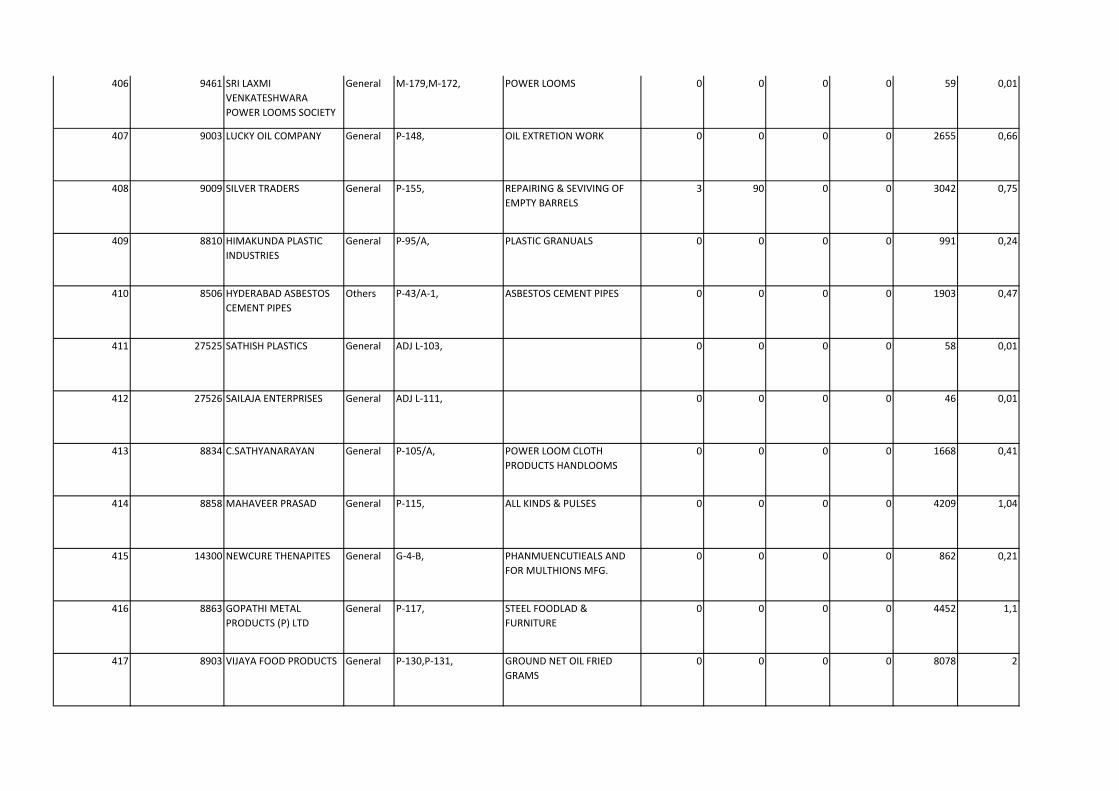
406 9461 SRI LAXMI
VENKATESHWARA
POWER LOOMS SOCIETY
General M-179,M-172, POWER LOOMS 0 0 0 0 59 0,01
407 9003 LUCKY OIL COMPANY General P-148, OIL EXTRETION WORK 0 0 0 0 2655 0,66
408 9009 SILVER TRADERS General P-155, REPAIRING & SEVIVING OF
EMPTY BARRELS
3 90 0 0 3042 0,75
409 8810 HIMAKUNDA PLASTIC
INDUSTRIES
General P-95/A, PLASTIC GRANUALS 0 0 0 0 991 0,24
410 8506 HYDERABAD ASBESTOS
CEMENT PIPES
Others P-43/A-1, ASBESTOS CEMENT PIPES 0 0 0 0 1903 0,47
411 27525 SATHISH PLASTICS General ADJ L-103, 0 0 0 0 58 0,01
412 27526 SAILAJA ENTERPRISES General ADJ L-111, 0 0 0 0 46 0,01
413 8834 C.SATHYANARAYAN General P-105/A, POWER LOOM CLOTH
PRODUCTS HANDLOOMS
0 0 0 0 1668 0,41
414 8858 MAHAVEER PRASAD General P-115, ALL KINDS & PULSES 0 0 0 0 4209 1,04
415 14300 NEWCURE THENAPITES General G-4-B, PHANMUENCUTIEALS AND
FOR MULTHIONS MFG.
0 0 0 0 862 0,21
416 8863 GOPATHI METAL
PRODUCTS (P) LTD
General P-117, STEEL FOODLAD &
FURNITURE
0 0 0 0 4452 1,1
417 8903 VIJAYA FOOD PRODUCTS General P-130,P-131, GROUND NET OIL FRIED
GRAMS
0 0 0 0 8078 2

418 9506 ASHOK KUMAR TEXTILES General M-113, POWER LOOMS 0 0 0 0 31 0,01
419 26965 YADAMMA General M-107, POWER LOOMS 0 0 0 0 28 0,01
420 26966 S.SATYA TEXTILES General M-109, POWER LOOMS 0 0 0 0 28 0,01
421 26967 SHYAMALA KRISHNA General M-110, POWER LOOMS 0 0 0 0 28 0,01
422 27530 NEW ROYAL RUBBER
WALLS
General P-77, Rubber grinding 4 60 0 0 419 0,1
423 26417 SAI CANDLE FANCY MFG.
COMPANY
General 17, REPAIRING OF EMPTY
BARRELS
0 0 0 0 2120 0,52
424 9181 UMMROW PLASTIC Others G-3-B, PLASTIC LIVER CHIPS, PLASTIC
MOULDING GOODS
0 0 0 0 732 0,18
425 8981 SAGAR INDUSTRIES
EVENTORES
General E-5, LEAD ACID STORAGE
BALTERIES
0 0 0 0 785 0,19
426 8397 TATED METAL INDUSTRY General P-18, ALLUMINIUM UTECILS &
CIRCLES
0 0 0 0 3926 0,97
427 8859 RAHAMATH ALI KHAN General E-21, BEARINGS 0 0 0 0 784 0,19
428 9383 GOPI PLASTIC
INDUSTRIES
Others M-189, 0 0 0 0 28 0,01
429 9386 V.RAMULU
KANTARAMAM TEKROL
General M-187, POWER LOOMS 0 0 0 0 28 0,01
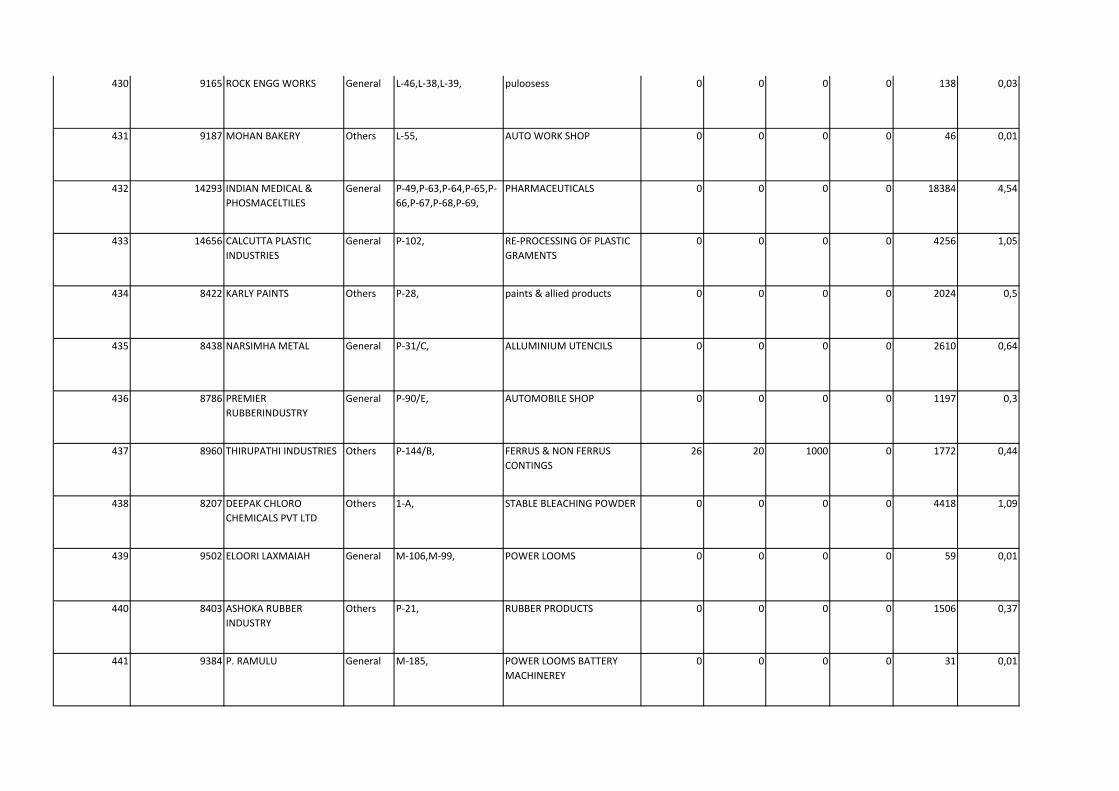
430 9165 ROCK ENGG WORKS General L-46,L-38,L-39, puloosess 0 0 0 0 138 0,03
431 9187 MOHAN BAKERY Others L-55, AUTO WORK SHOP 0 0 0 0 46 0,01
432 14293 INDIAN MEDICAL &
PHOSMACELTILES
General P-49,P-63,P-64,P-65,P-
66,P-67,P-68,P-69,
PHARMACEUTICALS 0 0 0 0 18384 4,54
433 14656 CALCUTTA PLASTIC
INDUSTRIES
General P-102, RE-PROCESSING OF PLASTIC
GRAMENTS
0 0 0 0 4256 1,05
434 8422 KARLY PAINTS Others P-28, paints & allied products 0 0 0 0 2024 0,5
435 8438 NARSIMHA METAL General P-31/C, ALLUMINIUM UTENCILS 0 0 0 0 2610 0,64
436 8786 PREMIER
RUBBERINDUSTRY
General P-90/E, AUTOMOBILE SHOP 0 0 0 0 1197 0,3
437 8960 THIRUPATHI INDUSTRIES Others P-144/B, FERRUS & NON FERRUS
CONTINGS
26 20 1000 0 1772 0,44
438 8207 DEEPAK CHLORO
CHEMICALS PVT LTD
Others 1-A, STABLE BLEACHING POWDER 0 0 0 0 4418 1,09
439 9502 ELOORI LAXMAIAH General M-106,M-99, POWER LOOMS 0 0 0 0 59 0,01
440 8403 ASHOKA RUBBER
INDUSTRY
Others P-21, RUBBER PRODUCTS 0 0 0 0 1506 0,37
441 9384 P. RAMULU General M-185, POWER LOOMS BATTERY
MACHINEREY
0 0 0 0 31 0,01
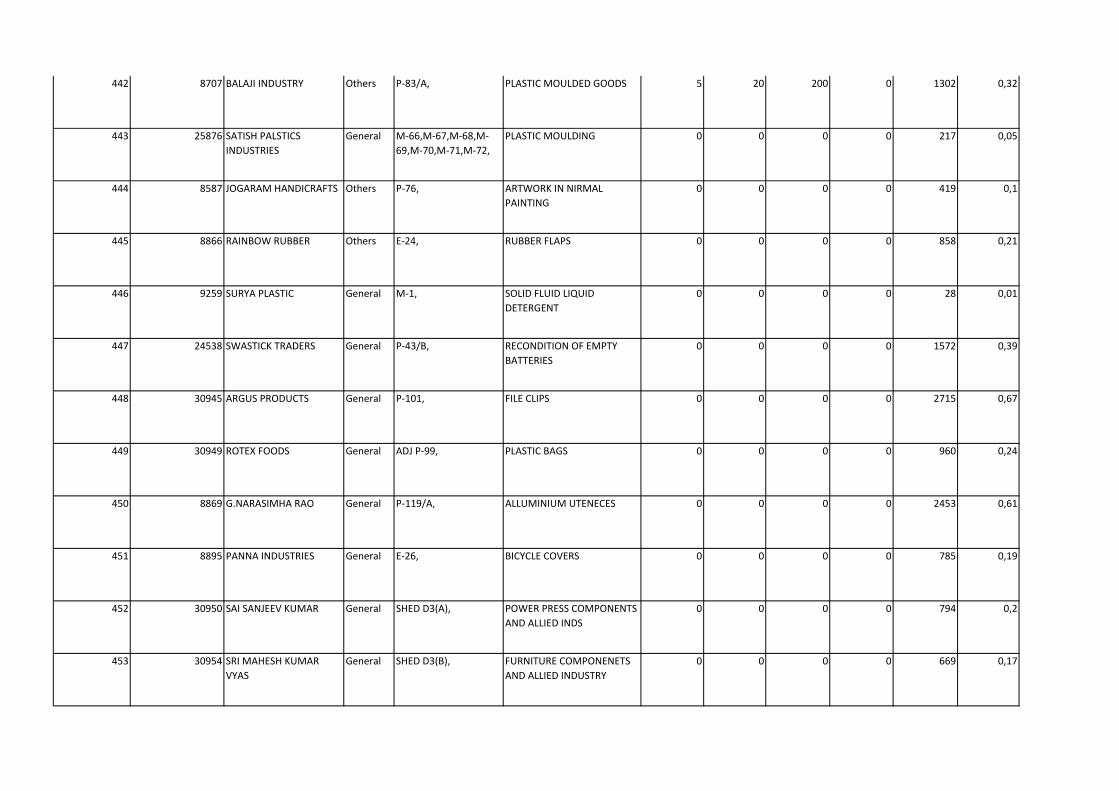
442 8707 BALAJI INDUSTRY Others P-83/A, PLASTIC MOULDED GOODS 5 20 200 0 1302 0,32
443 25876 SATISH PALSTICS
INDUSTRIES
General M-66,M-67,M-68,M-
69,M-70,M-71,M-72,
PLASTIC MOULDING 0 0 0 0 217 0,05
444 8587 JOGARAM HANDICRAFTS Others P-76, ARTWORK IN NIRMAL
PAINTING
0 0 0 0 419 0,1
445 8866 RAINBOW RUBBER Others E-24, RUBBER FLAPS 0 0 0 0 858 0,21
446 9259 SURYA PLASTIC General M-1, SOLID FLUID LIQUID
DETERGENT
0 0 0 0 28 0,01
447 24538 SWASTICK TRADERS General P-43/B, RECONDITION OF EMPTY
BATTERIES
0 0 0 0 1572 0,39
448 30945 ARGUS PRODUCTS General P-101, FILE CLIPS 0 0 0 0 2715 0,67
449 30949 ROTEX FOODS General ADJ P-99, PLASTIC BAGS 0 0 0 0 960 0,24
450 8869 G.NARASIMHA RAO General P-119/A, ALLUMINIUM UTENECES 0 0 0 0 2453 0,61
451 8895 PANNA INDUSTRIES General E-26, BICYCLE COVERS 0 0 0 0 785 0,19
452 30950 SAI SANJEEV KUMAR General SHED D3(A), POWER PRESS COMPONENTS
AND ALLIED INDS
0 0 0 0 794 0,2
453 30954 SRI MAHESH KUMAR
VYAS
General SHED D3(B), FURNITURE COMPONENETS
AND ALLIED INDUSTRY
0 0 0 0 669 0,17
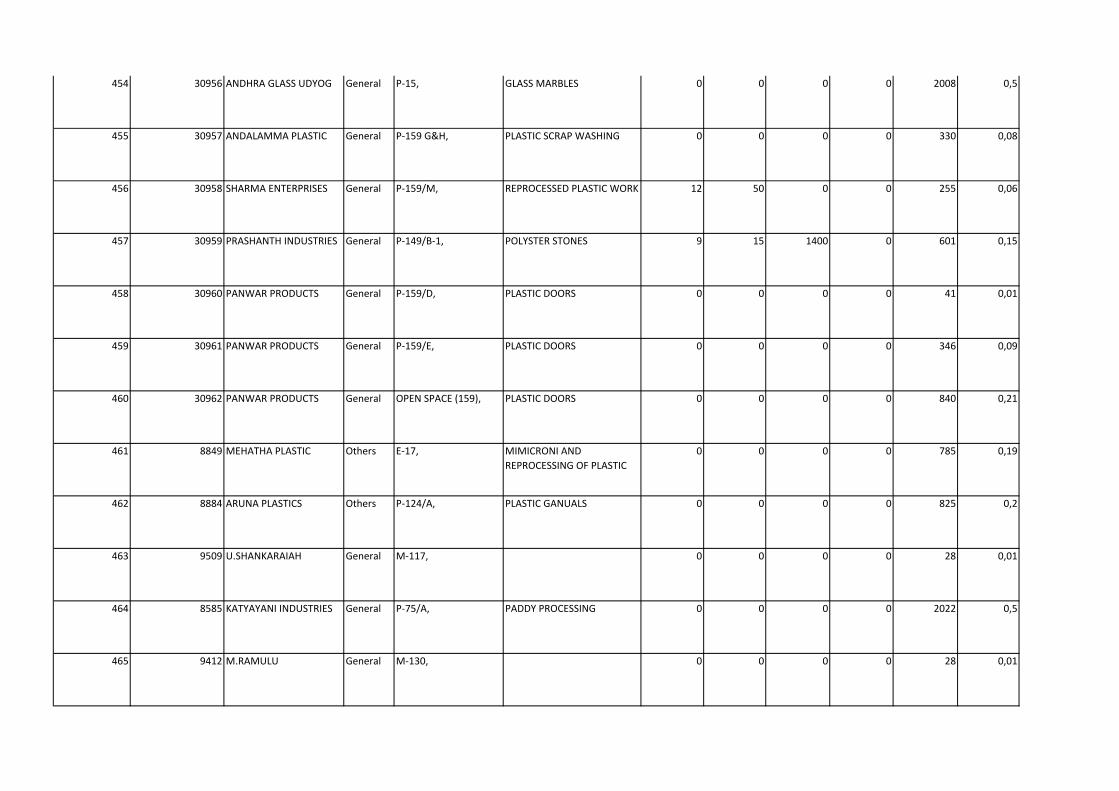
454 30956 ANDHRA GLASS UDYOG General P-15, GLASS MARBLES 0 0 0 0 2008 0,5
455 30957 ANDALAMMA PLASTIC General P-159 G&H, PLASTIC SCRAP WASHING 0 0 0 0 330 0,08
456 30958 SHARMA ENTERPRISES General P-159/M, REPROCESSED PLASTIC WORK 12 50 0 0 255 0,06
457 30959 PRASHANTH INDUSTRIES General P-149/B-1, POLYSTER STONES 9 15 1400 0 601 0,15
458 30960 PANWAR PRODUCTS General P-159/D, PLASTIC DOORS 0 0 0 0 41 0,01
459 30961 PANWAR PRODUCTS General P-159/E, PLASTIC DOORS 0 0 0 0 346 0,09
460 30962 PANWAR PRODUCTS General OPEN SPACE (159), PLASTIC DOORS 0 0 0 0 840 0,21
461 8849 MEHATHA PLASTIC Others E-17, MIMICRONI AND
REPROCESSING OF PLASTIC
0 0 0 0 785 0,19
462 8884 ARUNA PLASTICS Others P-124/A, PLASTIC GANUALS 0 0 0 0 825 0,2
463 9509 U.SHANKARAIAH General M-117, 0 0 0 0 28 0,01
464 8585 KATYAYANI INDUSTRIES General P-75/A, PADDY PROCESSING 0 0 0 0 2022 0,5
465 9412 M.RAMULU General M-130, 0 0 0 0 28 0,01
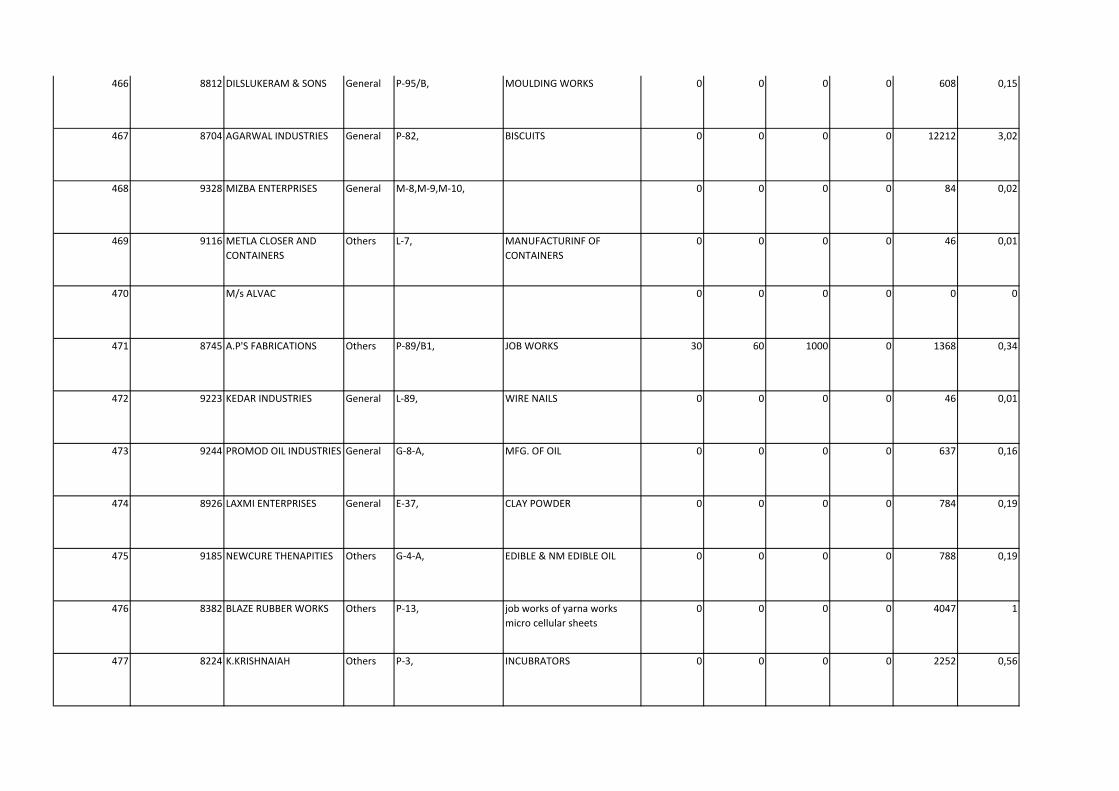
466 8812 DILSLUKERAM & SONS General P-95/B, MOULDING WORKS 0 0 0 0 608 0,15
467 8704 AGARWAL INDUSTRIES General P-82, BISCUITS 0 0 0 0 12212 3,02
468 9328 MIZBA ENTERPRISES General M-8,M-9,M-10, 0 0 0 0 84 0,02
469 9116 METLA CLOSER AND
CONTAINERS
Others L-7, MANUFACTURINF OF
CONTAINERS
0 0 0 0 46 0,01
470 M/s ALVAC 0 0 0 0 0 0
471 8745 A.P'S FABRICATIONS Others P-89/B1, JOB WORKS 30 60 1000 0 1368 0,34
472 9223 KEDAR INDUSTRIES General L-89, WIRE NAILS 0 0 0 0 46 0,01
473 9244 PROMOD OIL INDUSTRIES General G-8-A, MFG. OF OIL 0 0 0 0 637 0,16
474 8926 LAXMI ENTERPRISES General E-37, CLAY POWDER 0 0 0 0 784 0,19
475 9185 NEWCURE THENAPITIES Others G-4-A, EDIBLE & NM EDIBLE OIL 0 0 0 0 788 0,19
476 8382 BLAZE RUBBER WORKS Others P-13, job works of yarna works
micro cellular sheets
0 0 0 0 4047 1
477 8224 K.KRISHNAIAH Others P-3, INCUBRATORS 0 0 0 0 2252 0,56
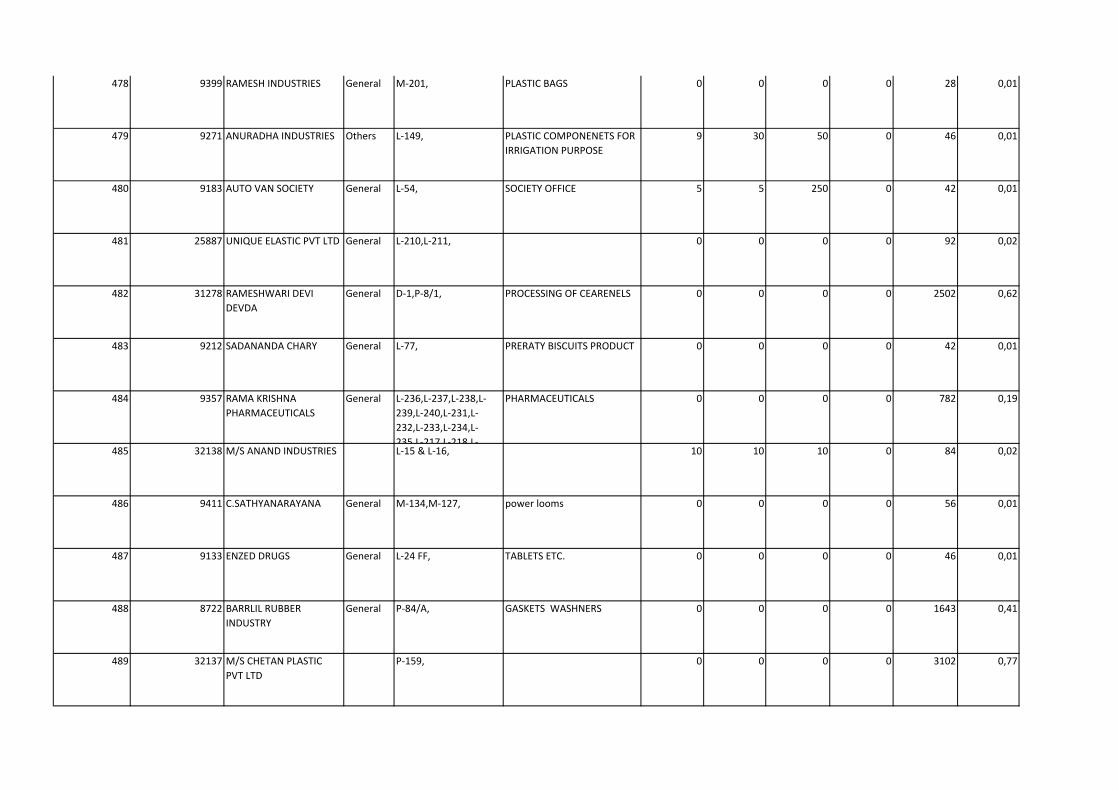
478 9399 RAMESH INDUSTRIES General M-201, PLASTIC BAGS 0 0 0 0 28 0,01
479 9271 ANURADHA INDUSTRIES Others L-149, PLASTIC COMPONENETS FOR
IRRIGATION PURPOSE
9 30 50 0 46 0,01
480 9183 AUTO VAN SOCIETY General L-54, SOCIETY OFFICE 5 5 250 0 42 0,01
481 25887 UNIQUE ELASTIC PVT LTD General L-210,L-211, 0 0 0 0 92 0,02
482 31278 RAMESHWARI DEVI
DEVDA
General D-1,P-8/1, PROCESSING OF CEARENELS 0 0 0 0 2502 0,62
483 9212 SADANANDA CHARY General L-77, PRERATY BISCUITS PRODUCT 0 0 0 0 42 0,01
484 9357 RAMA KRISHNA
PHARMACEUTICALS
General L-236,L-237,L-238,L-
239,L-240,L-231,L-
232,L-233,L-234,L-
235,L-217,L-218,L-
PHARMACEUTICALS 0 0 0 0 782 0,19
485 32138 M/S ANAND INDUSTRIES L-15 & L-16, 10 10 10 0 84 0,02
486 9411 C.SATHYANARAYANA General M-134,M-127, power looms 0 0 0 0 56 0,01
487 9133 ENZED DRUGS General L-24 FF, TABLETS ETC. 0 0 0 0 46 0,01
488 8722 BARRLIL RUBBER
INDUSTRY
General P-84/A, GASKETS WASHNERS 0 0 0 0 1643 0,41
489 32137 M/S CHETAN PLASTIC
PVT LTD
P-159, 0 0 0 0 3102 0,77
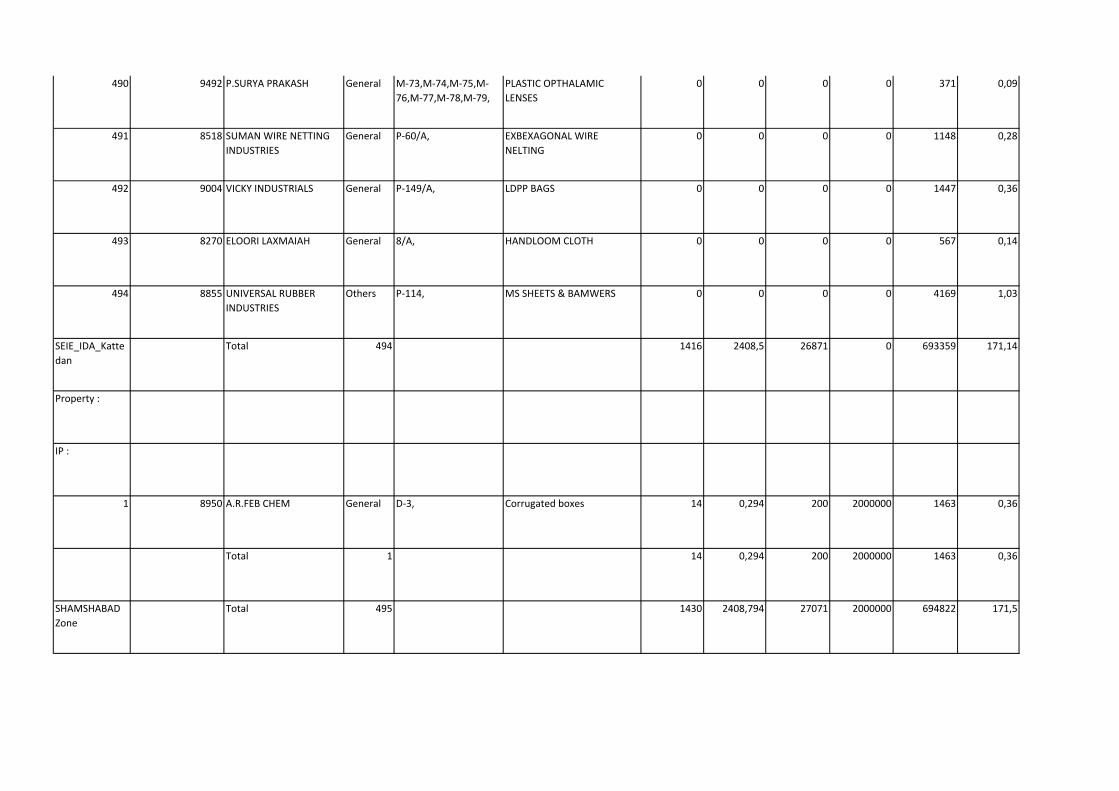
490 9492 P.SURYA PRAKASH General M-73,M-74,M-75,M-
76,M-77,M-78,M-79,
PLASTIC OPTHALAMIC
LENSES
0 0 0 0 371 0,09
491 8518 SUMAN WIRE NETTING
INDUSTRIES
General P-60/A, EXBEXAGONAL WIRE
NELTING
0 0 0 0 1148 0,28
492 9004 VICKY INDUSTRIALS General P-149/A, LDPP BAGS 0 0 0 0 1447 0,36
493 8270 ELOORI LAXMAIAH General 8/A, HANDLOOM CLOTH 0 0 0 0 567 0,14
494 8855 UNIVERSAL RUBBER
INDUSTRIES
Others P-114, MS SHEETS & BAMWERS 0 0 0 0 4169 1,03
SEIE_IDA_Katte
dan
Total 494 1416 2408,5 26871 0 693359 171,14
Property :
IP :
1 8950 A.R.FEB CHEM General D-3, Corrugated boxes 14 0,294 200 2000000 1463 0,36
Total 1 14 0,294 200 2000000 1463 0,36
SHAMSHABAD
Zone
Total 495 1430 2408,794 27071 2000000 694822 171,5
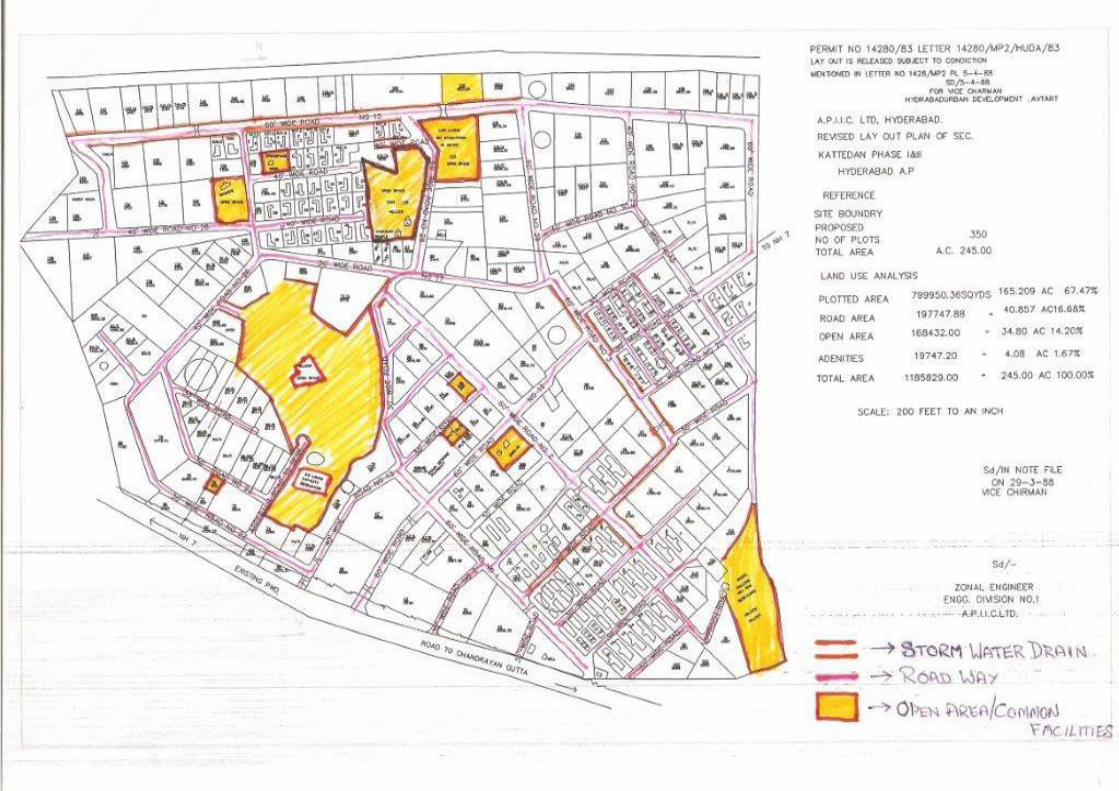


Witteveen+Bos, appendix III belongs to report IND50-2/16-012.096 dated 8 July 2016
APPENDIX III THE USED CATCHMENTS, THEIR SIZE, AND THE INFLOW POINTS

Witteveen+Bos, appendix III belongs to report IND50-2/16-012.096 dated 8 July 2016
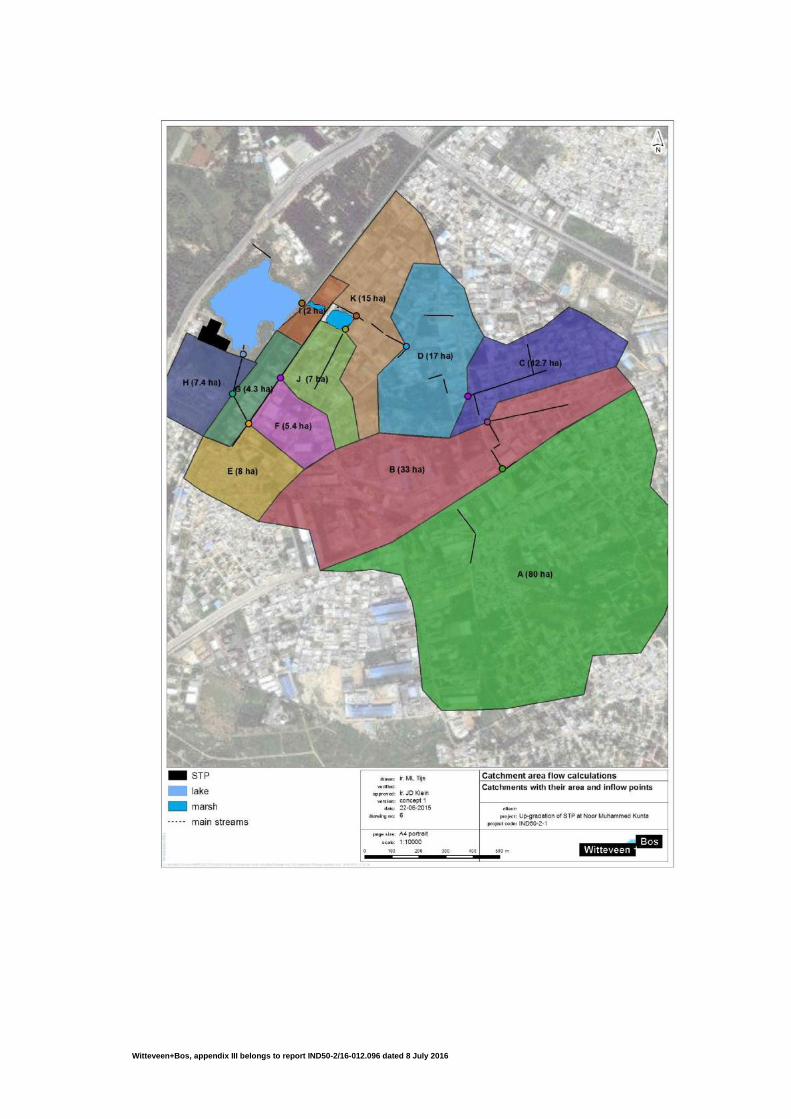
Witteveen+Bos, appendix III belongs to report IND50-2/16-012.096 dated 8 July 2016

Witteveen+Bos, appendix III belongs to report IND50-2/16-012.096 dated 8 July 2016

Witteveen+Bos, appendix IV belongs to report IND50-2/16-012.096 dated 8 July 2016
APPENDIX IV FIELD MEASUREMENTS

Witteveen+Bos, appendix IV belongs to report IND50-2/16-012.096 dated 8 July 2016
memorandum
Witteveen+Bos
Van Twickelostraat 2
P.O. Box 233
7400 AE Deventer
The Netherlands
+31 570 69 79 11
www.witteveenbos.com
subject flow measurements
project NKM STP
client Telangana State Pollution Control Board
project code IND50-2
reference IND50-2/15-016.424
prepared by J.D. Klein MSc
approved by P.G.B. Hermans MSc
date of preparation 7 October 2015
appendices -
to
copy
This appendix gives an overview of the results of flow measurements in June 2015.The
sampling and monitoring of flows in Kattedan is part of the upgrading of the Sewage
treatment plant at Noor Mohammed Kunta (NMK), The sampling and monitoring of flows is
needed to assess the volumes of water flowing to the STP and NMK lake and the quality of
the incoming flows.
During monitoring we also assess the quantities of water flowing towards the Kattedan area
from surrounding areas.
Figure 1 gives an overview of the locations of flow measurements.
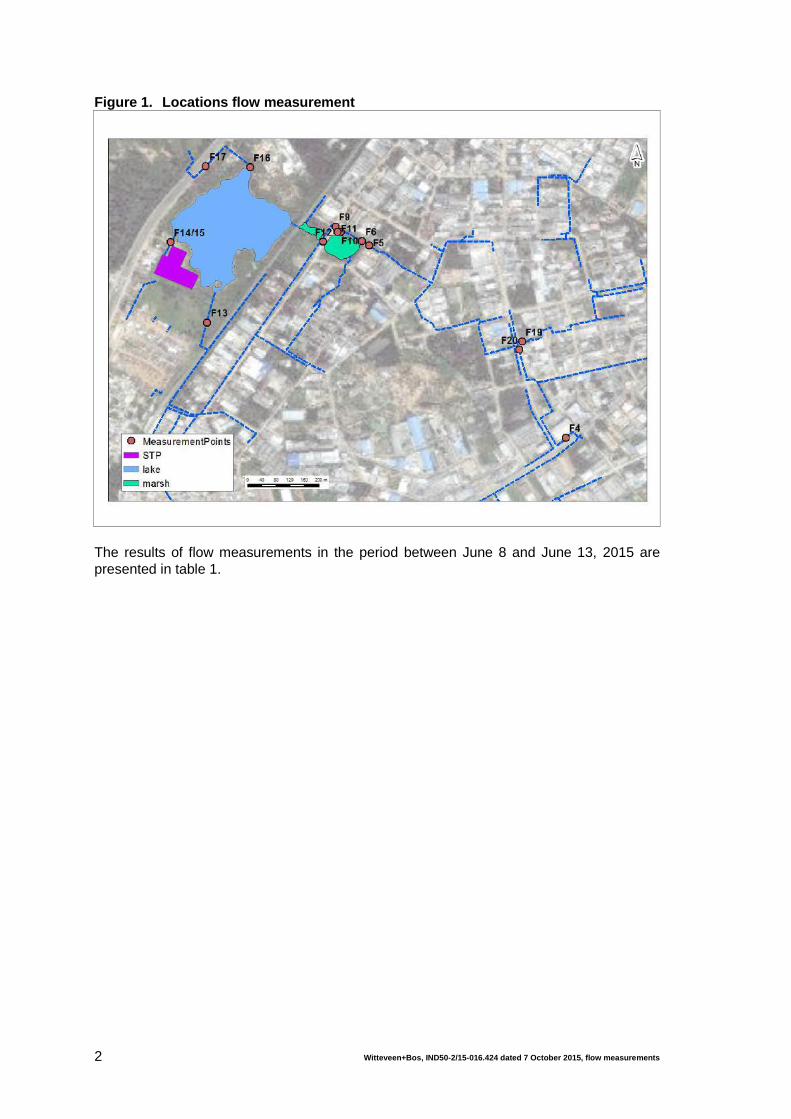
Witteveen+Bos, IND50-2/15-016.424 dated 7 October 2015, flow measurements 2
Figure 1. Locations flow measurement
The results of flow measurements in the period between June 8 and June 13, 2015 are
presented in table 1.
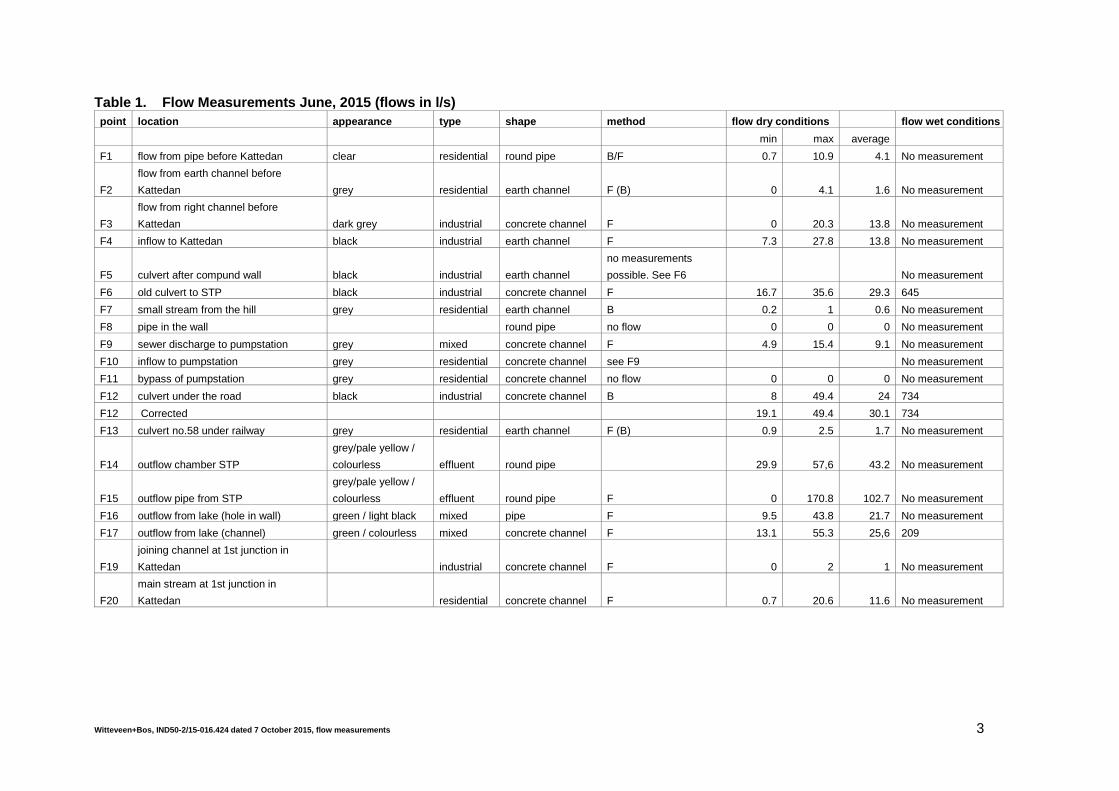
Witteveen+Bos, IND50-2/15-016.424 dated 7 October 2015, flow measurements 3
Table 1. Flow Measurements June, 2015 (flows in l/s)
point location appearance type shape method flow dry conditions flow wet conditions
min max average
F1 flow from pipe before Kattedan clear residential round pipe B/F 0.7 10.9 4.1 No measurement
F2
flow from earth channel before
Kattedan grey residential earth channel F (B) 0 4.1 1.6 No measurement
F3
flow from right channel before
Kattedan dark grey industrial concrete channel F 0 20.3 13.8 No measurement
F4 inflow to Kattedan black industrial earth channel F 7.3 27.8 13.8 No measurement
F5 culvert after compund wall black industrial earth channel
no measurements
possible. See F6 No measurement
F6 old culvert to STP black industrial concrete channel F 16.7 35.6 29.3 645
F7 small stream from the hill grey residential earth channel B 0.2 1 0.6 No measurement
F8 pipe in the wall round pipe no flow 0 0 0 No measurement
F9 sewer discharge to pumpstation grey mixed concrete channel F 4.9 15.4 9.1 No measurement
F10 inflow to pumpstation grey residential concrete channel see F9 No measurement
F11 bypass of pumpstation grey residential concrete channel no flow 0 0 0 No measurement
F12 culvert under the road black industrial concrete channel B 8 49.4 24 734
F12 Corrected 19.1 49.4 30.1 734
F13 culvert no.58 under railway grey residential earth channel F (B) 0.9 2.5 1.7 No measurement
F14 outflow chamber STP
grey/pale yellow /
colourless effluent round pipe 29.9 57,6 43.2 No measurement
F15 outflow pipe from STP
grey/pale yellow /
colourless effluent round pipe F 0 170.8 102.7 No measurement
F16 outflow from lake (hole in wall) green / light black mixed pipe F 9.5 43.8 21.7 No measurement
F17 outflow from lake (channel) green / colourless mixed concrete channel F 13.1 55.3 25,6 209
F19
joining channel at 1st junction in
Kattedan industrial concrete channel F 0 2 1 No measurement
F20
main stream at 1st junction in
Kattedan residential concrete channel F 0.7 20.6 11.6 No measurement
Witteveen+Bos, IND50-2/15-016.424 dated 7 October 2015, flow measurements 4
In July and august monitoring and sampling has taken place. The results will be included in
the final report.
For better understanding of the table:
- In most cases the flows are based on measurement of the flow velocity and cross
section of the channel pipes. At some small flows a bucket is used to determine the
flow.
- Most measurements represent dry conditions. In this period June 13 was a rainy day.
At some locations flow measurements for wet conditions are available (see right
column in table 1).
- The data is used to prepare a water balance (see inception report). It was possible to
calculate a consistent water balance taking into account:
Limited accuracy of flow measurements in general (from our experience an error of
15 % is expected).
The fluctuations in the observed flows during dry conditions (see table 1) are high.
The average flow is based on 4 to 8 individual measurements.
At locations F14 and F15 the flow depends on operation of the STP. If the STP is
operated flow will be measured but afterwards the flow can decrease to 0 l/s.
For location F12 (inflow to NMK lake) to observed flows are low compared to
measurements at other locations. Especially the flows during the first 2 days are
low. This is probably an error in flow measurement of interpretation. If we exclude
these days, the flow at F12 (30.1 l/s) corresponds to the sum of locations F6 and F7
(29.3 + 0.6 l/s).
Measurements at location F20 show a low flow (average 11.6 l/s) compared to the
upstream and downstream location (F4 and F6; average flows 13.8 and 29.3 l/s).
There is no clear explanation for this low flow. We suggest to leave the
measurement for this location (for June 2015) out of the water balance.
- Water flowing in from the truck workshop area west of the STP was not measured in
June 2015. During site visits a small flow was observed. We used data from the GIZ
report in the water balance (average 1.2 l/s).

Witteveen+Bos, appendix V belongs to report IND50-2/16-012.096 dated 8 July 2016
APPENDIX V GENERAL STANDARDS FOR DISCHARGE OF EFFLUENTS

Witteveen+Bos, appendix V belongs to report IND50-2/16-012.096 dated 8 July 2016
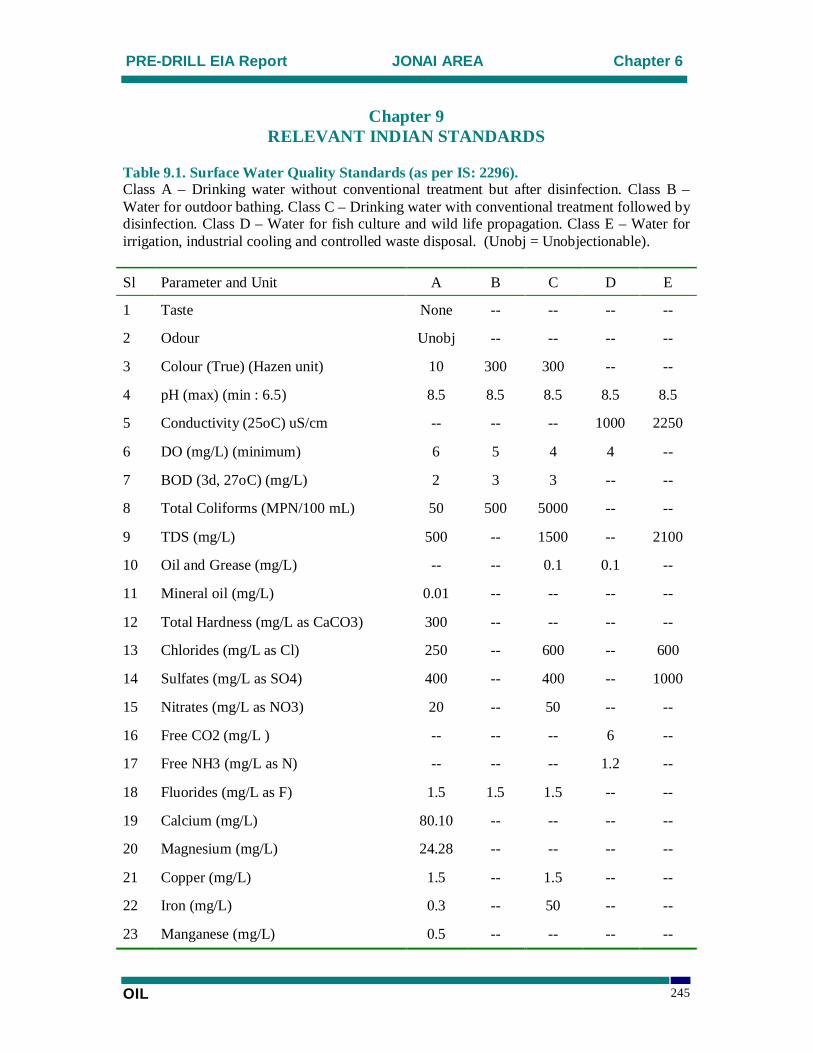
PRE-DRILL EIA Report JONAI AREA Chapter 6
OIL 245
Chapter 9RELEVANT INDIAN STANDARDS
Table 9.1. Surface Water Quality Standards (as per IS: 2296).Class A – Drinking water without conventional treatment but after disinfection. Class B –Water for outdoor bathing. Class C – Drinking water with conventional treatment followed bydisinfection. Class D – Water for fish culture and wild life propagation. Class E – Water forirrigation, industrial cooling and controlled waste disposal. (Unobj = Unobjectionable).
Sl Parameter and Unit A B C D E
1 Taste None -- -- -- --
2 Odour Unobj -- -- -- --
3 Colour (True) (Hazen unit) 10 300 300 -- --
4 pH (max) (min : 6.5) 8.5 8.5 8.5 8.5 8.5
5 Conductivity (25oC) uS/cm -- -- -- 1000 2250
6 DO (mg/L) (minimum) 6 5 4 4 --
7 BOD (3d, 27oC) (mg/L) 2 3 3 -- --
8 Total Coliforms (MPN/100 mL) 50 500 5000 -- --
9 TDS (mg/L) 500 -- 1500 -- 2100
10 Oil and Grease (mg/L) -- -- 0.1 0.1 --
11 Mineral oil (mg/L) 0.01 -- -- -- --
12 Total Hardness (mg/L as CaCO3) 300 -- -- -- --
13 Chlorides (mg/L as Cl) 250 -- 600 -- 600
14 Sulfates (mg/L as SO4) 400 -- 400 -- 1000
15 Nitrates (mg/L as NO3) 20 -- 50 -- --
16 Free CO2 (mg/L ) -- -- -- 6 --
17 Free NH3 (mg/L as N) -- -- -- 1.2 --
18 Fluorides (mg/L as F) 1.5 1.5 1.5 -- --
19 Calcium (mg/L) 80.10 -- -- -- --
20 Magnesium (mg/L) 24.28 -- -- -- --
21 Copper (mg/L) 1.5 -- 1.5 -- --
22 Iron (mg/L) 0.3 -- 50 -- --
23 Manganese (mg/L) 0.5 -- -- -- --

PRE-DRILL EIA Report JONAI AREA Chapter 6
OIL 246
Sl Parameter and Unit A B C D E
24 Zinc (mg/L) 15 -- 15 -- --
25 Boron (mg/L as B) -- -- -- -- 2
26 Barium (mg/L) 1 -- -- -- --
27 Silver (mg/L) 0.05 -- -- -- --
28 Arsenic Total (mg/L) 0.05 0.2 0.2 -- --
29 Mercury (mg/L) 0.001 -- -- -- --
30 Lead (mg/L) 0.1 -- 0.1 -- --
31 Cadmium (mg/L) 0.01 -- 0.01 -- --
32 Chromium (VI) (mg/L) 0.05 0.05 0.05 -- --
33 Selenium (mg/L) 0.01 -- 0.05 -- --
34 Cyanide (mg/L as CN) 0.05 0.05 0.05 -- --
35 Phenols (mg/L) 0.002 0.005 0.005 -- --
36 Anionic detergents (mg/L as MBAS) 0.2 1 1 -- --
37 PAH (mg/L) 0.2 -- -- -- --
38 Pesticides (ug/L) 0 -- -- -- --
39 Insecticides (ug/L) -- -- 0 -- --
40 Alpha emitters (10-6uC/mL) 0.001 0.001 0.001 0.001 0.001
41 Beta emitters (10-6uC/mL) 0.01 0.01 0.01 0.01 0.01
42 Percent Sodium (%) -- -- -- -- 60
43 Sodium Absorption Ratio -- -- -- -- 26
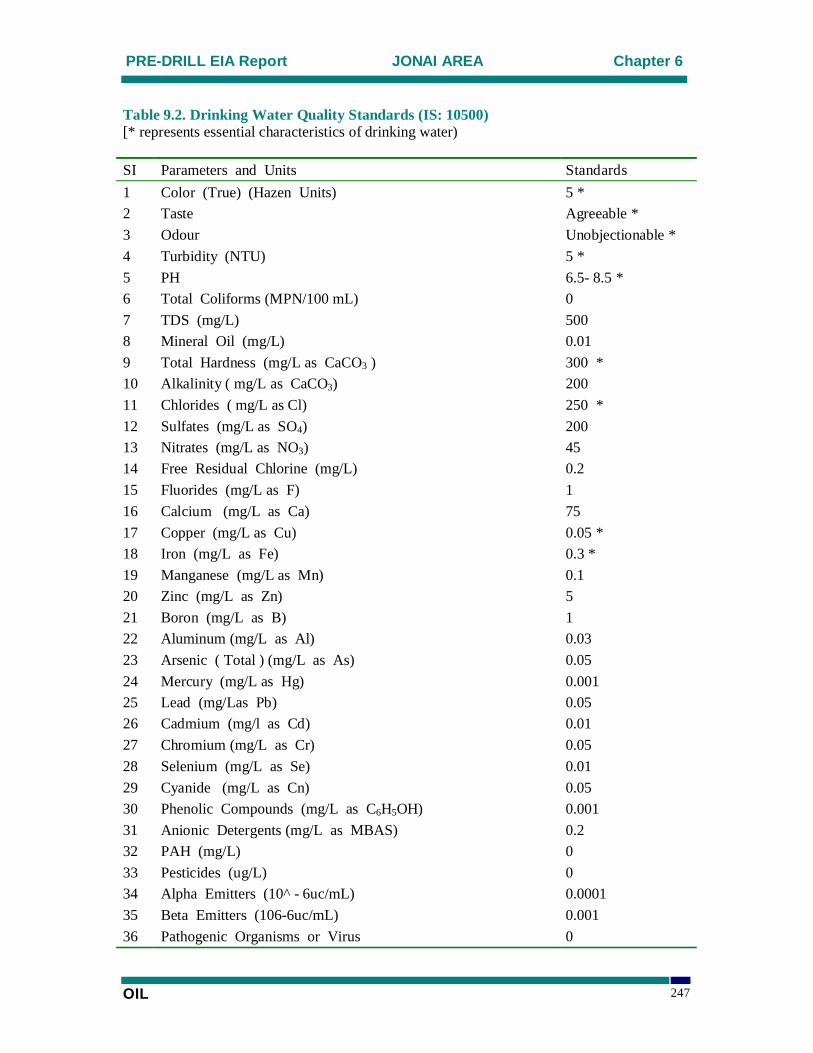
PRE-DRILL EIA Report JONAI AREA Chapter 6
OIL 247
Table 9.2. Drinking Water Quality Standards (IS: 10500)[* represents essential characteristics of drinking water)
SI Parameters and Units Standards1 Color (True) (Hazen Units) 5 *2 Taste Agreeable *3 Odour Unobjectionable *4 Turbidity (NTU) 5 *5 PH 6.5- 8.5 *6 Total Coliforms (MPN/100 mL) 07 TDS (mg/L) 5008 Mineral Oil (mg/L) 0.019 Total Hardness (mg/L as CaCO3 ) 300 *10 Alkalinity ( mg/L as CaCO3) 20011 Chlorides ( mg/L as Cl) 250 *12 Sulfates (mg/L as SO4) 20013 Nitrates (mg/L as NO3) 4514 Free Residual Chlorine (mg/L) 0.215 Fluorides (mg/L as F) 116 Calcium (mg/L as Ca) 7517 Copper (mg/L as Cu) 0.05 *18 Iron (mg/L as Fe) 0.3 *19 Manganese (mg/L as Mn) 0.120 Zinc (mg/L as Zn) 521 Boron (mg/L as B) 122 Aluminum (mg/L as Al) 0.0323 Arsenic ( Total ) (mg/L as As) 0.0524 Mercury (mg/L as Hg) 0.00125 Lead (mg/Las Pb) 0.0526 Cadmium (mg/l as Cd) 0.0127 Chromium (mg/L as Cr) 0.0528 Selenium (mg/L as Se) 0.0129 Cyanide (mg/L as Cn) 0.0530 Phenolic Compounds (mg/L as C6H5OH) 0.00131 Anionic Detergents (mg/L as MBAS) 0.232 PAH (mg/L) 033 Pesticides (ug/L) 034 Alpha Emitters (10^ - 6uc/mL) 0.000135 Beta Emitters (106-6uc/mL) 0.00136 Pathogenic Organisms or Virus 0
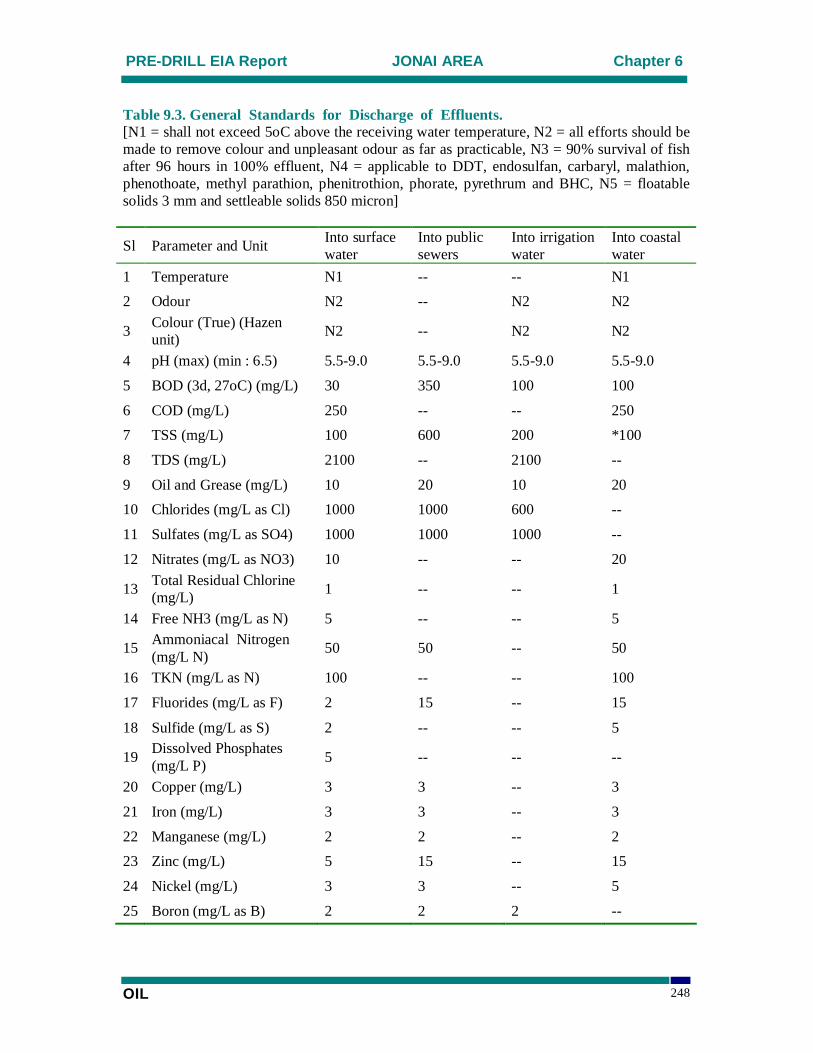
PRE-DRILL EIA Report JONAI AREA Chapter 6
OIL 248
Table 9.3. General Standards for Discharge of Effluents.[N1 = shall not exceed 5oC above the receiving water temperature, N2 = all efforts should bemade to remove colour and unpleasant odour as far as practicable, N3 = 90% survival of fishafter 96 hours in 100% effluent, N4 = applicable to DDT, endosulfan, carbaryl, malathion,phenothoate, methyl parathion, phenitrothion, phorate, pyrethrum and BHC, N5 = floatablesolids 3 mm and settleable solids 850 micron]
Sl Parameter and Unit Into surfacewater
Into publicsewers
Into irrigationwater
Into coastalwater
1 Temperature N1 -- -- N12 Odour N2 -- N2 N2
3 Colour (True) (Hazenunit) N2 -- N2 N2
4 pH (max) (min : 6.5) 5.5-9.0 5.5-9.0 5.5-9.0 5.5-9.0
5 BOD (3d, 27oC) (mg/L) 30 350 100 100
6 COD (mg/L) 250 -- -- 2507 TSS (mg/L) 100 600 200 *100
8 TDS (mg/L) 2100 -- 2100 --
9 Oil and Grease (mg/L) 10 20 10 2010 Chlorides (mg/L as Cl) 1000 1000 600 --
11 Sulfates (mg/L as SO4) 1000 1000 1000 --
12 Nitrates (mg/L as NO3) 10 -- -- 20
13 Total Residual Chlorine(mg/L) 1 -- -- 1
14 Free NH3 (mg/L as N) 5 -- -- 5
15 Ammoniacal Nitrogen(mg/L N) 50 50 -- 50
16 TKN (mg/L as N) 100 -- -- 100
17 Fluorides (mg/L as F) 2 15 -- 15
18 Sulfide (mg/L as S) 2 -- -- 5
19 Dissolved Phosphates(mg/L P) 5 -- -- --
20 Copper (mg/L) 3 3 -- 3
21 Iron (mg/L) 3 3 -- 3
22 Manganese (mg/L) 2 2 -- 223 Zinc (mg/L) 5 15 -- 15
24 Nickel (mg/L) 3 3 -- 5
25 Boron (mg/L as B) 2 2 2 --
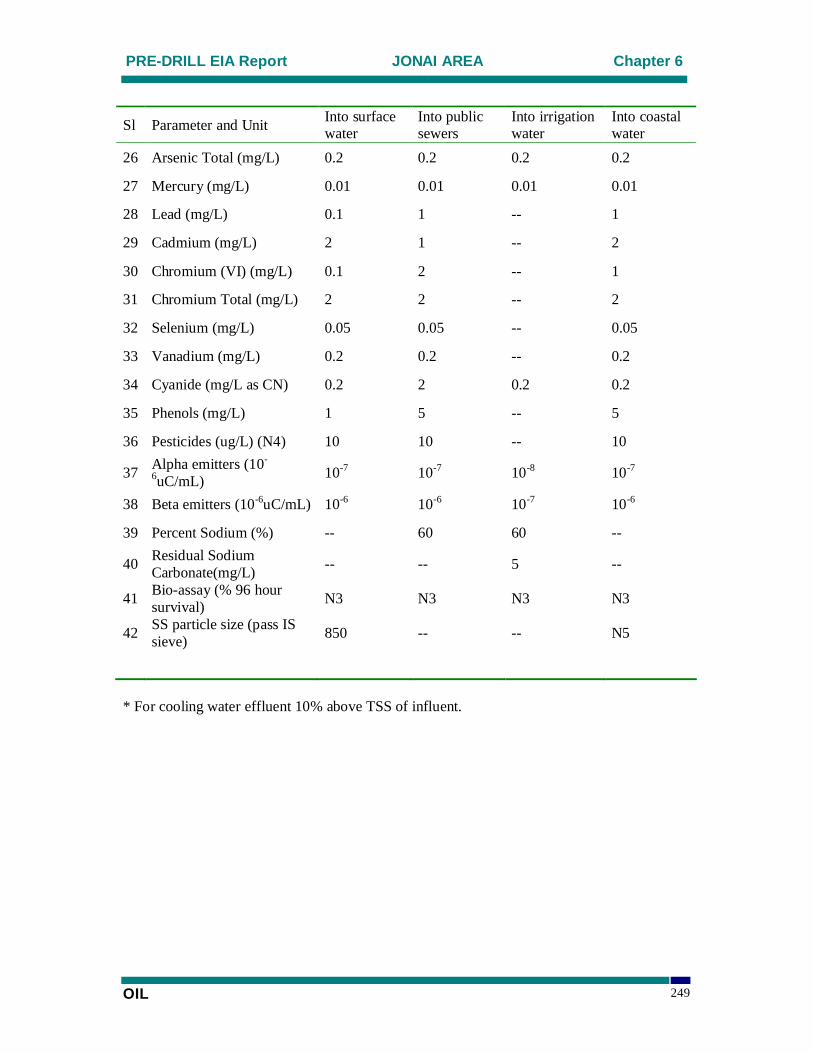
PRE-DRILL EIA Report JONAI AREA Chapter 6
OIL 249
Sl Parameter and Unit Into surfacewater
Into publicsewers
Into irrigationwater
Into coastalwater
26 Arsenic Total (mg/L) 0.2 0.2 0.2 0.2
27 Mercury (mg/L) 0.01 0.01 0.01 0.01
28 Lead (mg/L) 0.1 1 -- 1
29 Cadmium (mg/L) 2 1 -- 2
30 Chromium (VI) (mg/L) 0.1 2 -- 1
31 Chromium Total (mg/L) 2 2 -- 2
32 Selenium (mg/L) 0.05 0.05 -- 0.05
33 Vanadium (mg/L) 0.2 0.2 -- 0.2
34 Cyanide (mg/L as CN) 0.2 2 0.2 0.2
35 Phenols (mg/L) 1 5 -- 5
36 Pesticides (ug/L) (N4) 10 10 -- 10
37 Alpha emitters (10-
6uC/mL) 10-7 10-7 10-8 10-7
38 Beta emitters (10-6uC/mL) 10-6 10-6 10-7 10-6
39 Percent Sodium (%) -- 60 60 --
40 Residual SodiumCarbonate(mg/L) -- -- 5 --
41 Bio-assay (% 96 hoursurvival) N3 N3 N3 N3
42 SS particle size (pass ISsieve) 850 -- -- N5
* For cooling water effluent 10% above TSS of influent.
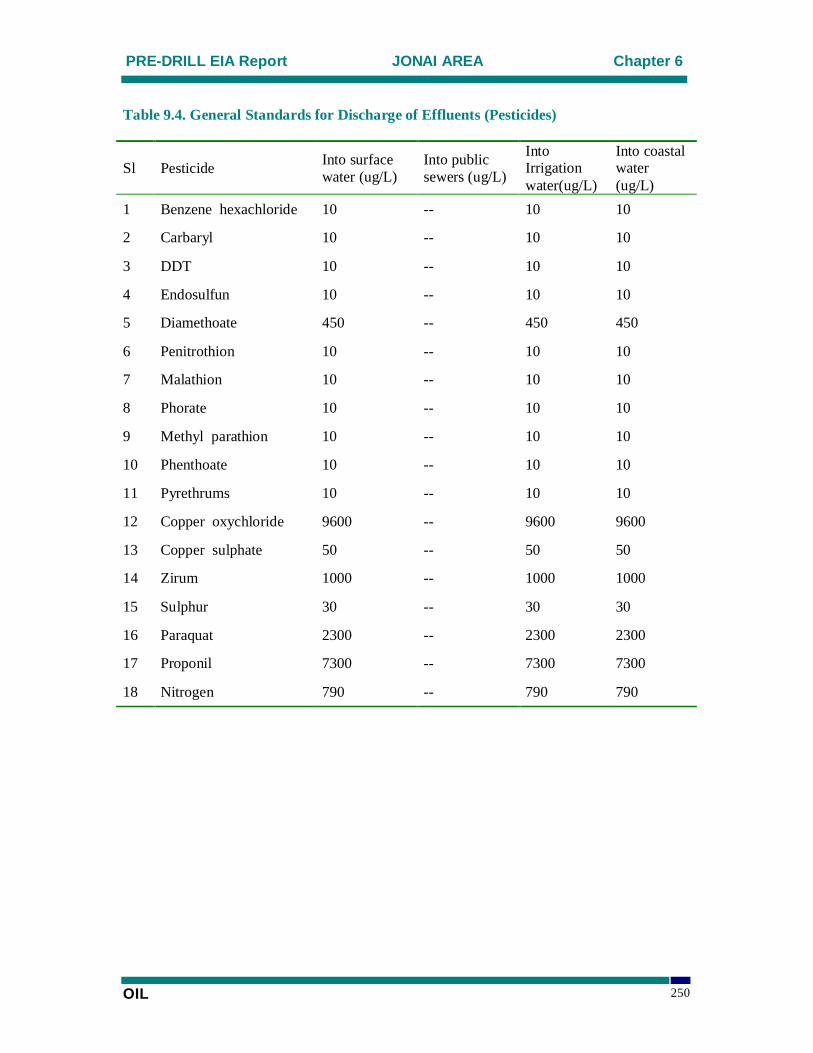
PRE-DRILL EIA Report JONAI AREA Chapter 6
OIL 250
Table 9.4. General Standards for Discharge of Effluents (Pesticides)
Sl Pesticide Into surfacewater (ug/L)
Into publicsewers (ug/L)
IntoIrrigationwater(ug/L)
Into coastalwater(ug/L)
1 Benzene hexachloride 10 -- 10 10
2 Carbaryl 10 -- 10 10
3 DDT 10 -- 10 10
4 Endosulfun 10 -- 10 10
5 Diamethoate 450 -- 450 450
6 Penitrothion 10 -- 10 10
7 Malathion 10 -- 10 10
8 Phorate 10 -- 10 10
9 Methyl parathion 10 -- 10 10
10 Phenthoate 10 -- 10 10
11 Pyrethrums 10 -- 10 10
12 Copper oxychloride 9600 -- 9600 9600
13 Copper sulphate 50 -- 50 50
14 Zirum 1000 -- 1000 1000
15 Sulphur 30 -- 30 30
16 Paraquat 2300 -- 2300 2300
17 Proponil 7300 -- 7300 7300
18 Nitrogen 790 -- 790 790
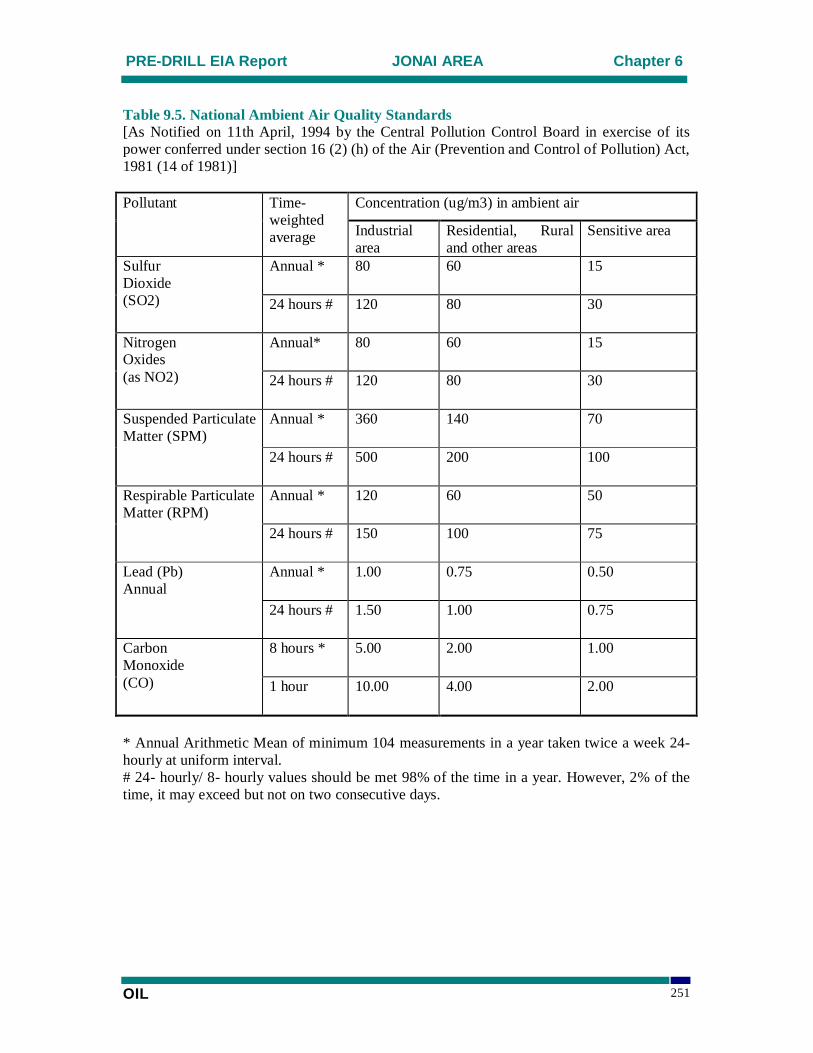
PRE-DRILL EIA Report JONAI AREA Chapter 6
OIL 251
Table 9.5. National Ambient Air Quality Standards[As Notified on 11th April, 1994 by the Central Pollution Control Board in exercise of itspower conferred under section 16 (2) (h) of the Air (Prevention and Control of Pollution) Act,1981 (14 of 1981)]
Concentration (ug/m3) in ambient airPollutant Time-weightedaverage Industrial
areaResidential, Ruraland other areas
Sensitive area
Annual * 80 60 15SulfurDioxide(SO2) 24 hours # 120 80 30
Annual* 80 60 15NitrogenOxides(as NO2) 24 hours # 120 80 30
Annual * 360 140 70Suspended ParticulateMatter (SPM)
24 hours # 500 200 100
Annual * 120 60 50Respirable ParticulateMatter (RPM)
24 hours # 150 100 75
Annual * 1.00 0.75 0.50Lead (Pb)Annual
24 hours # 1.50 1.00 0.75
8 hours * 5.00 2.00 1.00CarbonMonoxide(CO) 1 hour 10.00 4.00 2.00
* Annual Arithmetic Mean of minimum 104 measurements in a year taken twice a week 24-hourly at uniform interval.# 24- hourly/ 8- hourly values should be met 98% of the time in a year. However, 2% of thetime, it may exceed but not on two consecutive days.
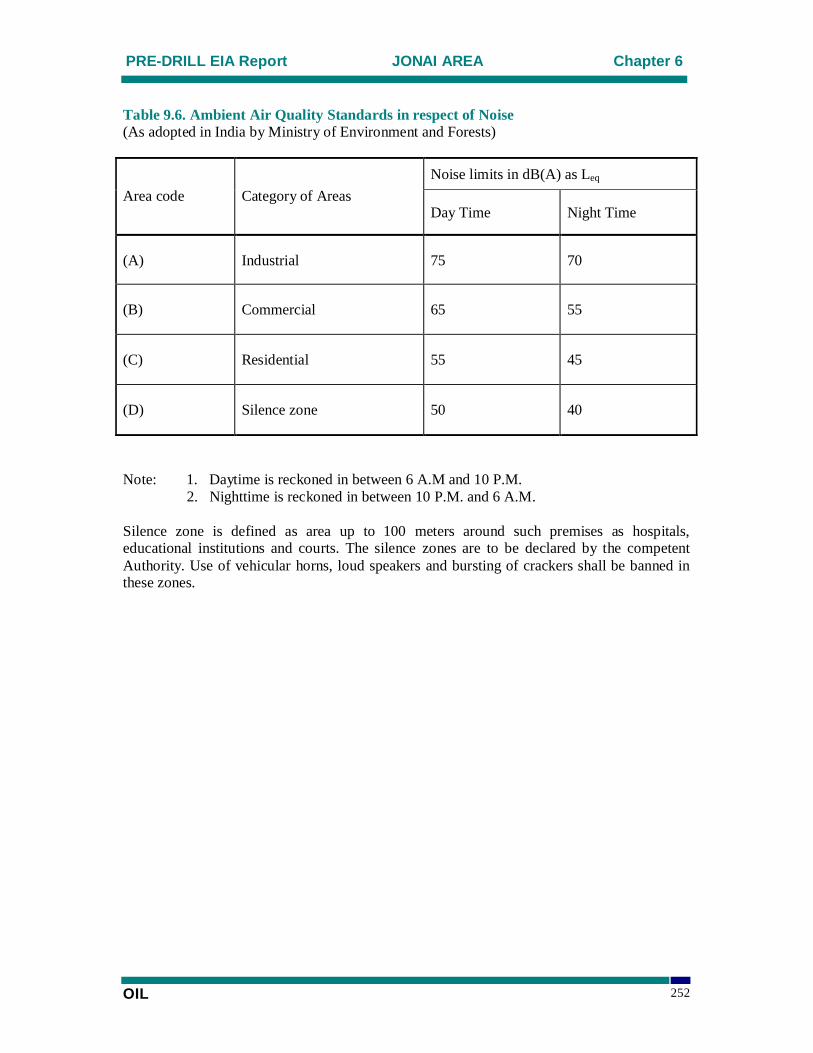
PRE-DRILL EIA Report JONAI AREA Chapter 6
OIL 252
Table 9.6. Ambient Air Quality Standards in respect of Noise(As adopted in India by Ministry of Environment and Forests)
Noise limits in dB(A) as Leq
Area code Category of AreasDay Time Night Time
(A) Industrial 75 70
(B) Commercial 65 55
(C) Residential 55 45
(D) Silence zone 50 40
Note: 1. Daytime is reckoned in between 6 A.M and 10 P.M. 2. Nighttime is reckoned in between 10 P.M. and 6 A.M.
Silence zone is defined as area up to 100 meters around such premises as hospitals,educational institutions and courts. The silence zones are to be declared by the competentAuthority. Use of vehicular horns, loud speakers and bursting of crackers shall be banned inthese zones.

Witteveen+Bos, appendix VI belongs to report IND50-2/16-012.096 dated 8 July 2016
APPENDIX VI WATER QUALITY ASSESSMENT - ANALYSIS RESULTS

Witteveen+Bos, appendix VI belongs to report IND50-2/16-012.096 dated 8 July 2016
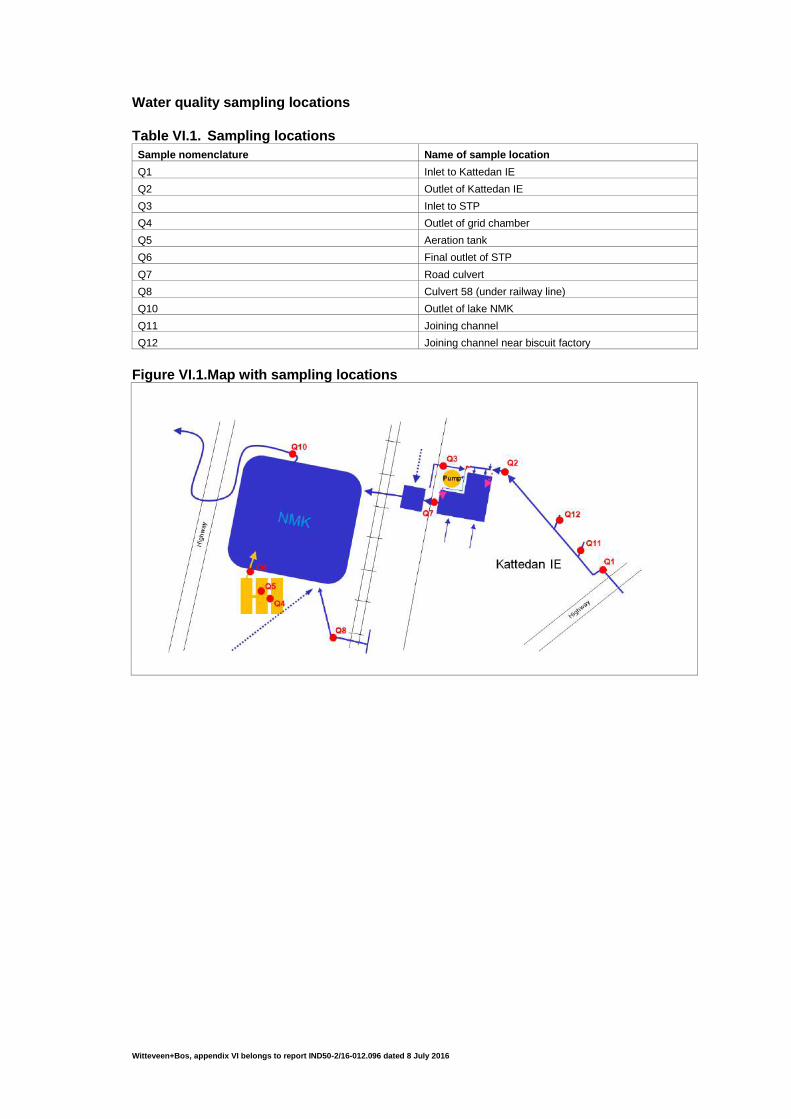
Witteveen+Bos, appendix VI belongs to report IND50-2/16-012.096 dated 8 July 2016
Water quality sampling locations
Table VI.1. Sampling locations
Sample nomenclature Name of sample location
Q1 Inlet to Kattedan IE
Q2 Outlet of Kattedan IE
Q3 Inlet to STP
Q4 Outlet of grid chamber
Q5 Aeration tank
Q6 Final outlet of STP
Q7 Road culvert
Q8 Culvert 58 (under railway line)
Q10 Outlet of lake NMK
Q11 Joining channel
Q12 Joining channel near biscuit factory
Figure VI.1.Map with sampling locations
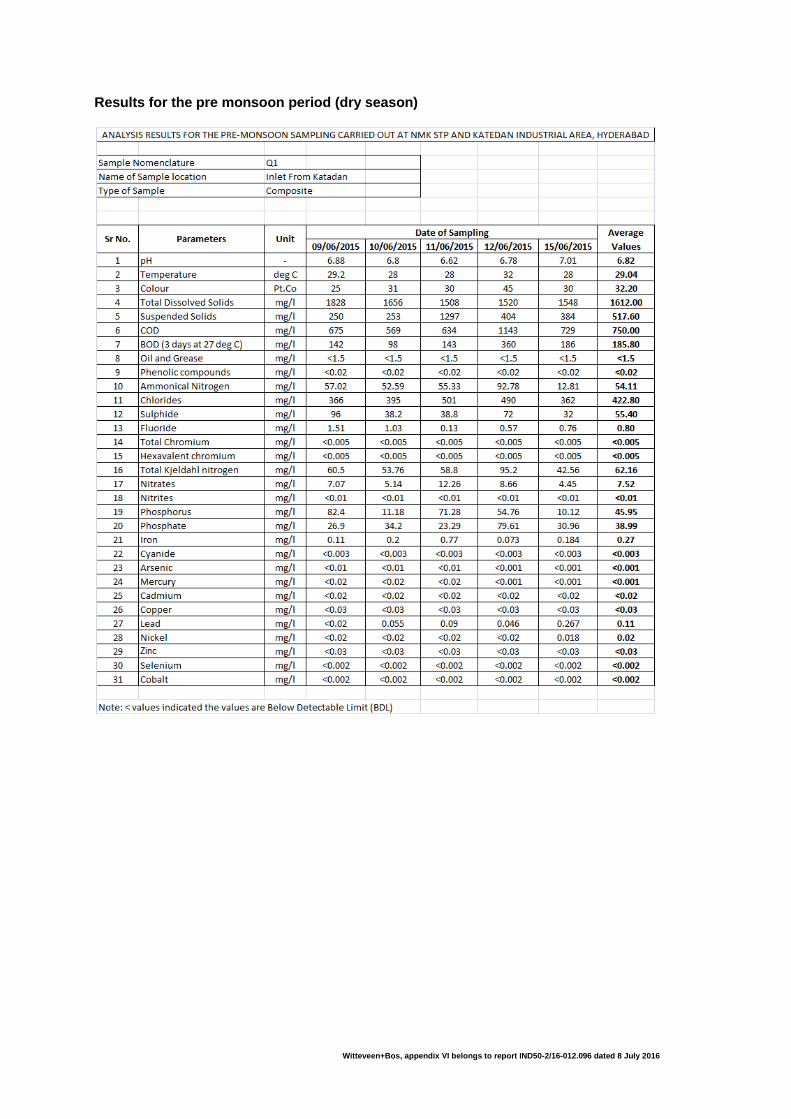
Witteveen+Bos, appendix VI belongs to report IND50-2/16-012.096 dated 8 July 2016
Results for the pre monsoon period (dry season)
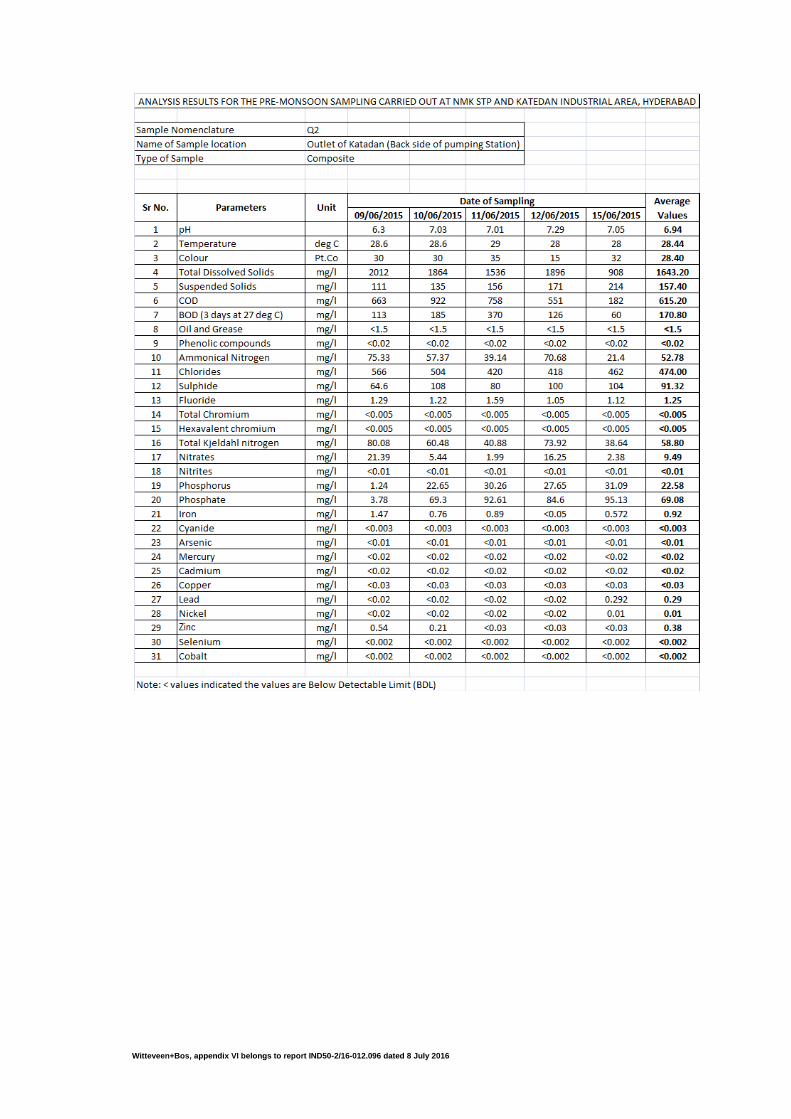
Witteveen+Bos, appendix VI belongs to report IND50-2/16-012.096 dated 8 July 2016
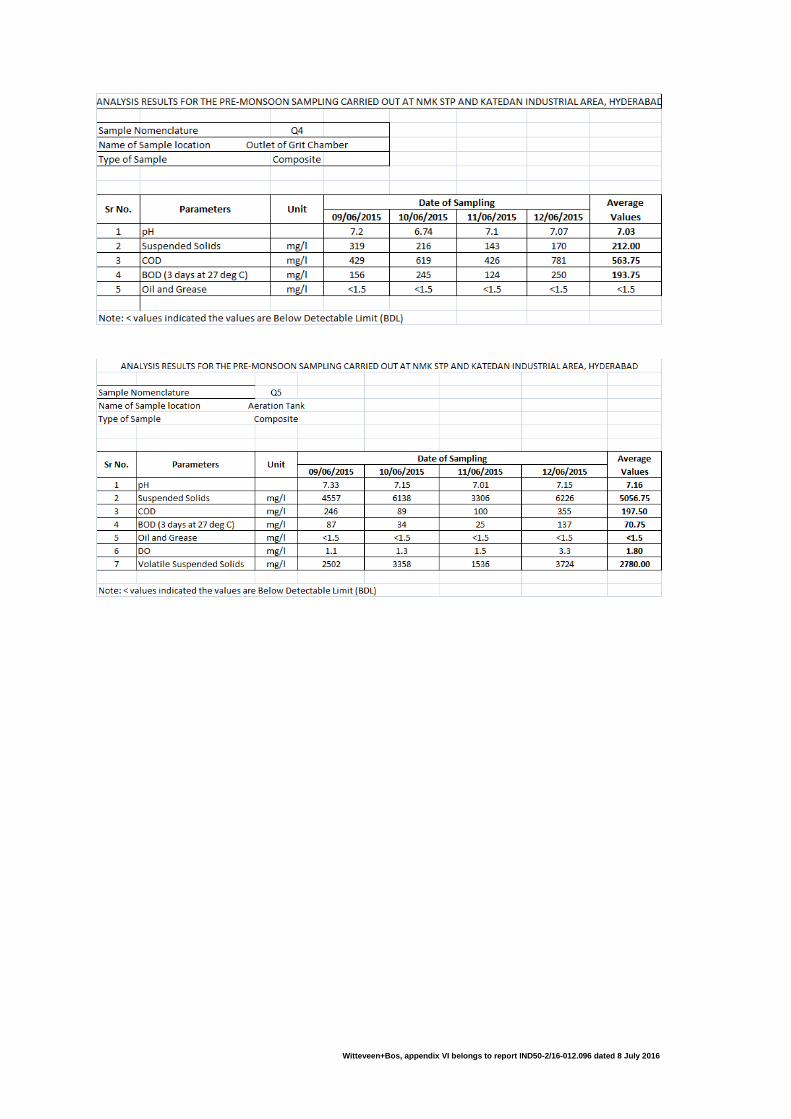
Witteveen+Bos, appendix VI belongs to report IND50-2/16-012.096 dated 8 July 2016
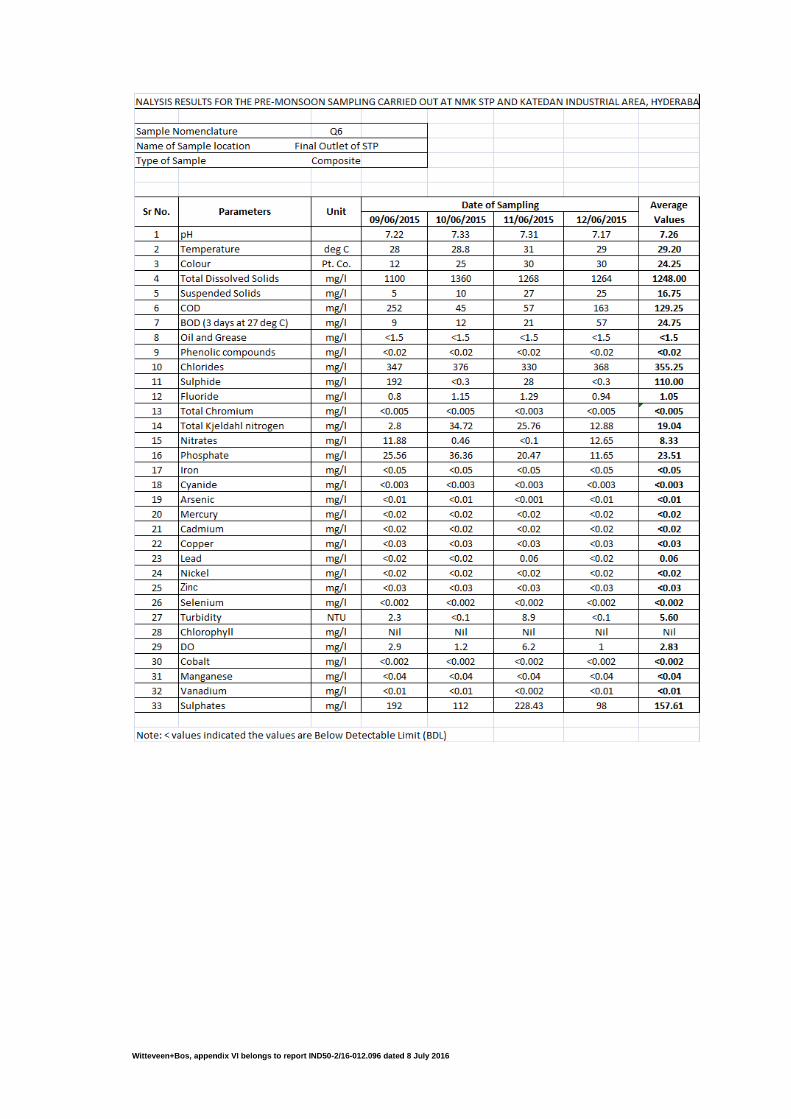
Witteveen+Bos, appendix VI belongs to report IND50-2/16-012.096 dated 8 July 2016
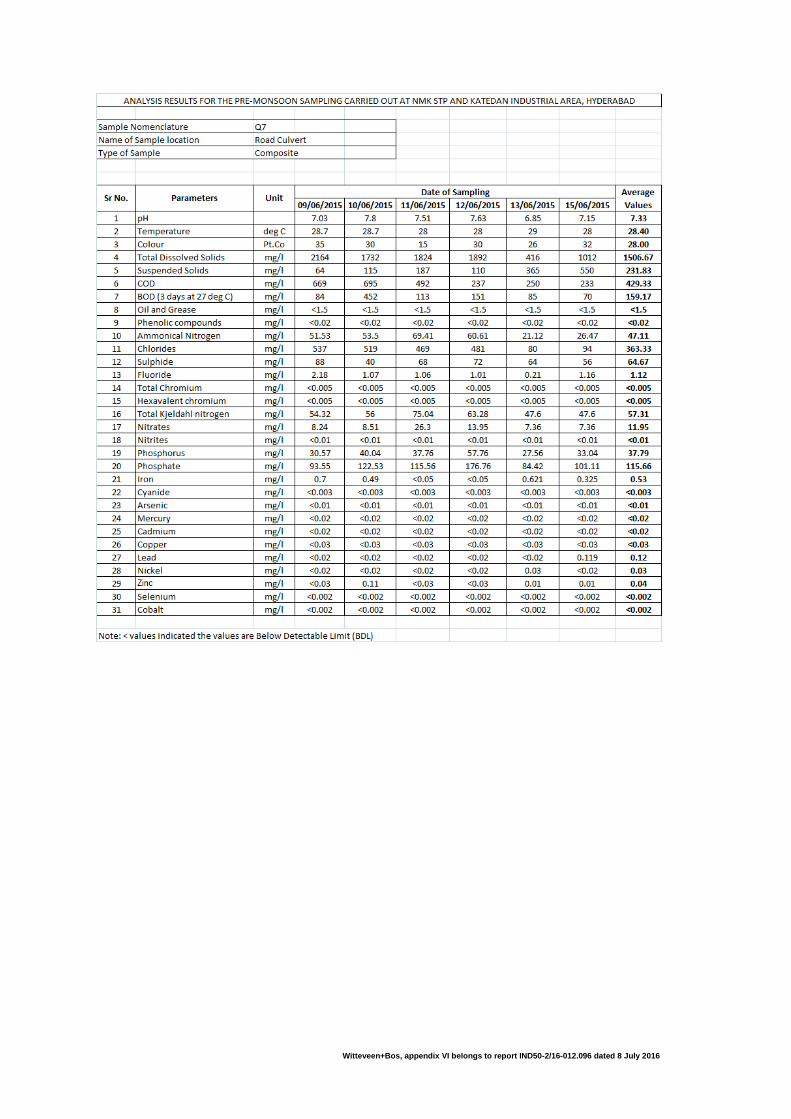
Witteveen+Bos, appendix VI belongs to report IND50-2/16-012.096 dated 8 July 2016
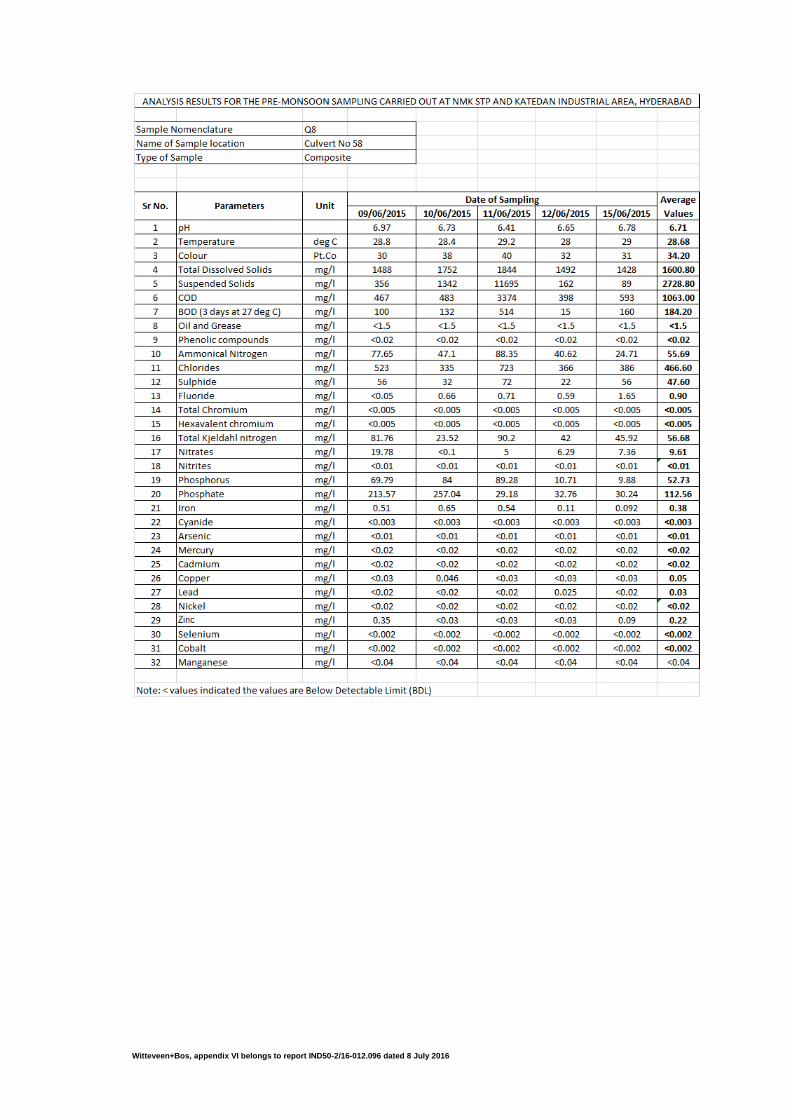
Witteveen+Bos, appendix VI belongs to report IND50-2/16-012.096 dated 8 July 2016
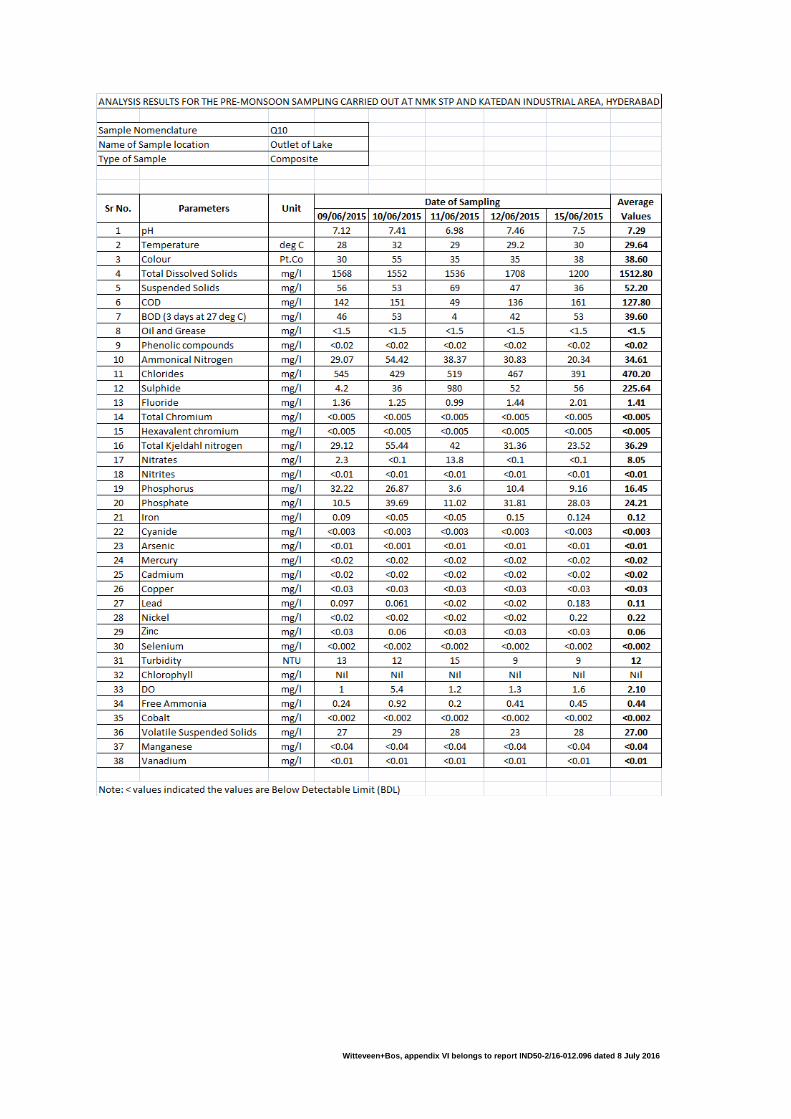
Witteveen+Bos, appendix VI belongs to report IND50-2/16-012.096 dated 8 July 2016
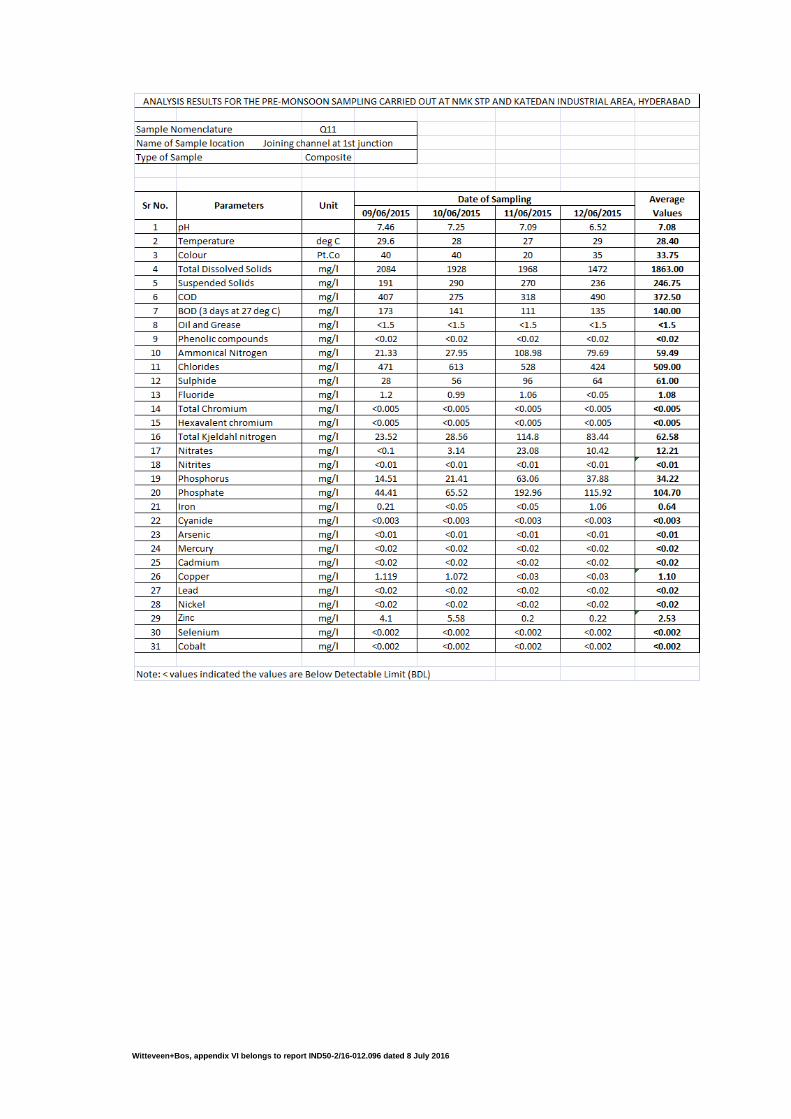
Witteveen+Bos, appendix VI belongs to report IND50-2/16-012.096 dated 8 July 2016
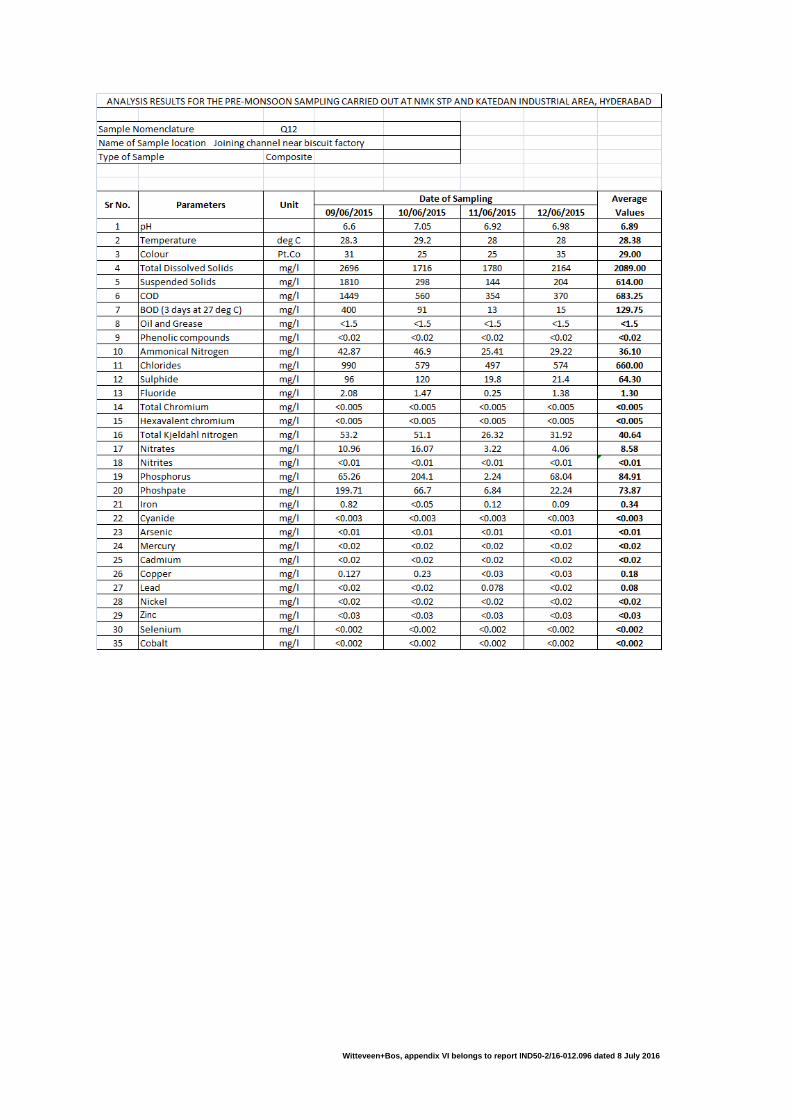
Witteveen+Bos, appendix VI belongs to report IND50-2/16-012.096 dated 8 July 2016
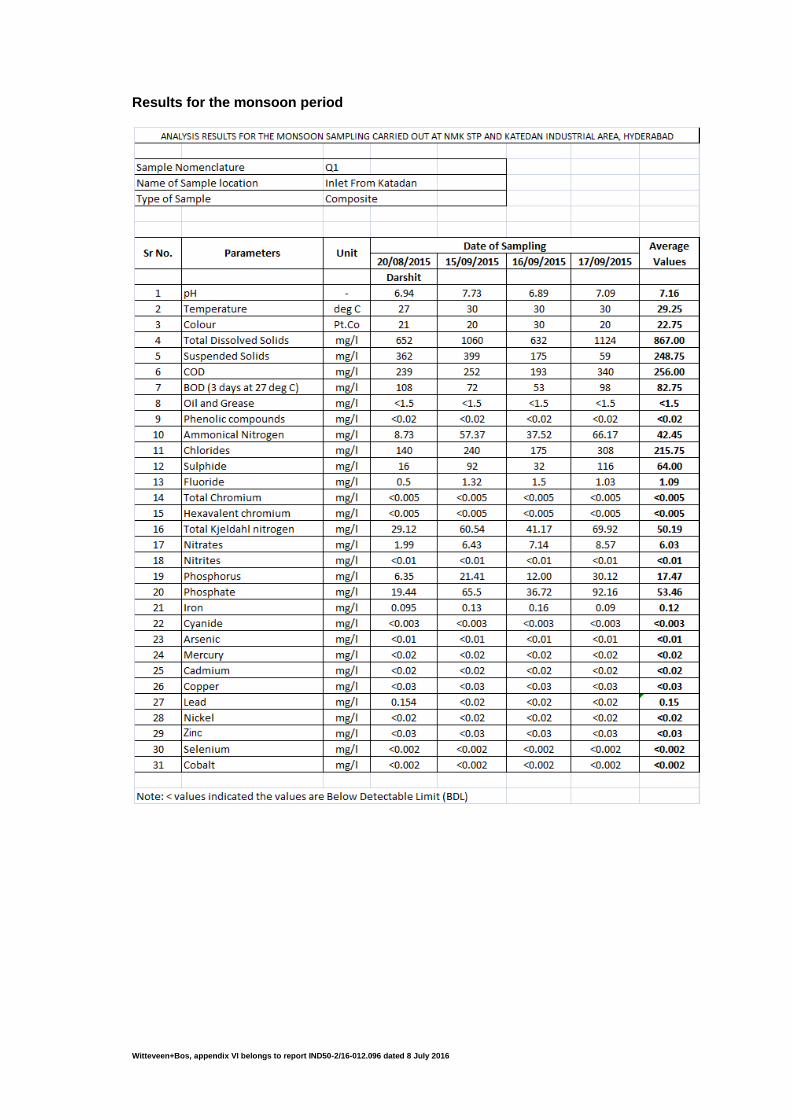
Witteveen+Bos, appendix VI belongs to report IND50-2/16-012.096 dated 8 July 2016
Results for the monsoon period
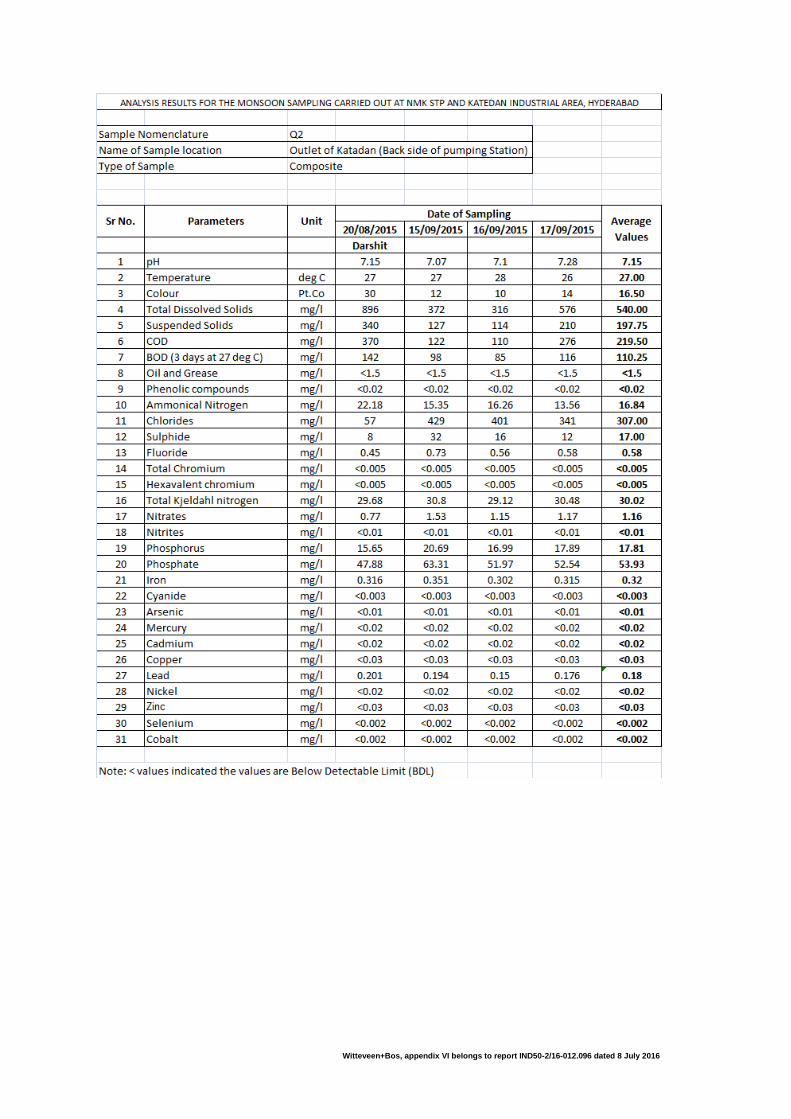
Witteveen+Bos, appendix VI belongs to report IND50-2/16-012.096 dated 8 July 2016
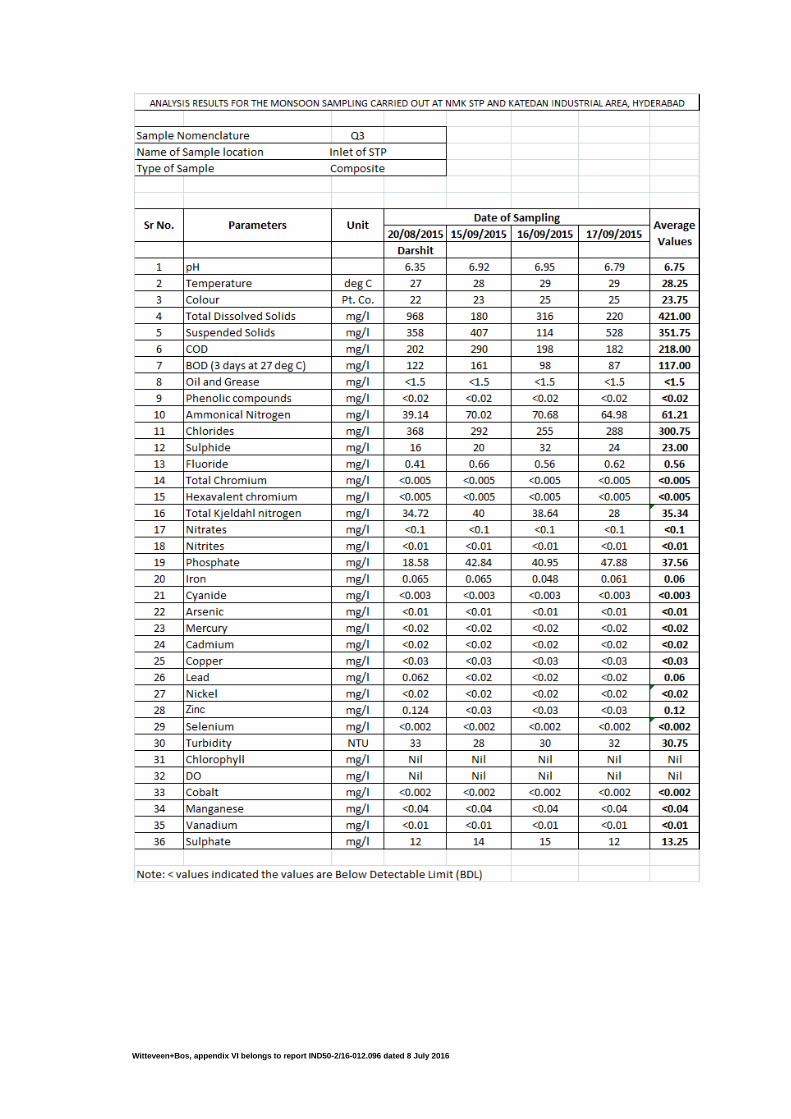
Witteveen+Bos, appendix VI belongs to report IND50-2/16-012.096 dated 8 July 2016
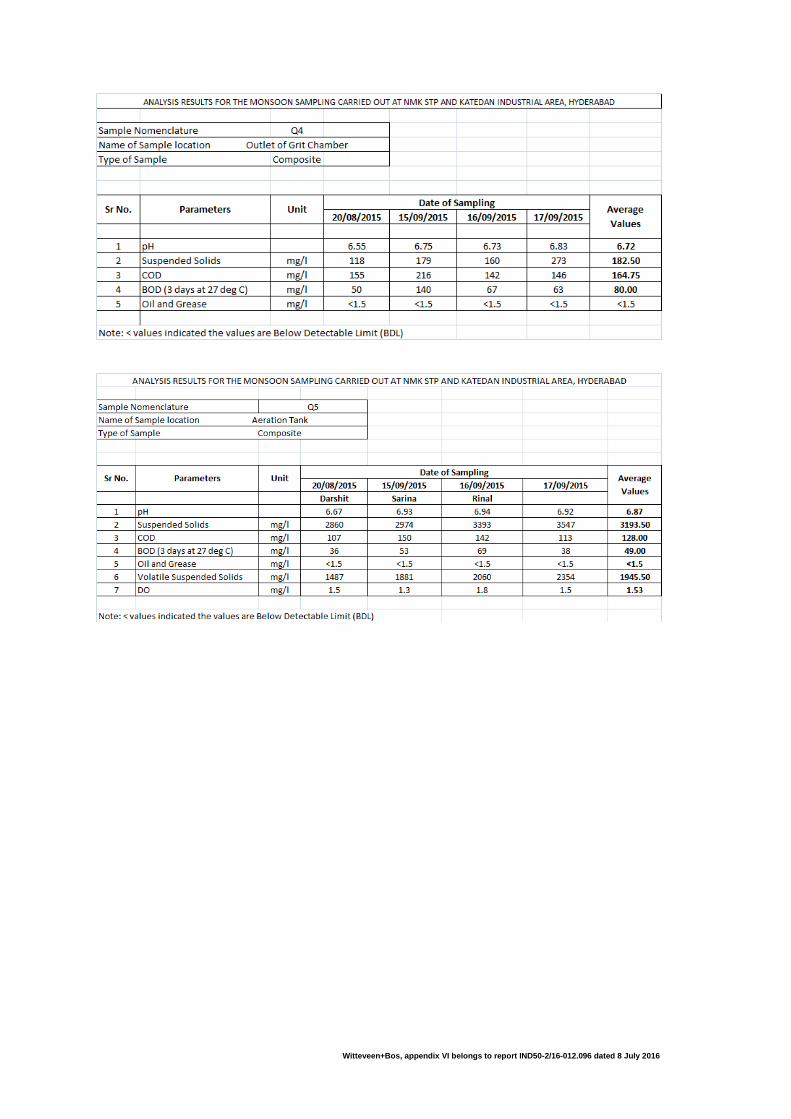
Witteveen+Bos, appendix VI belongs to report IND50-2/16-012.096 dated 8 July 2016
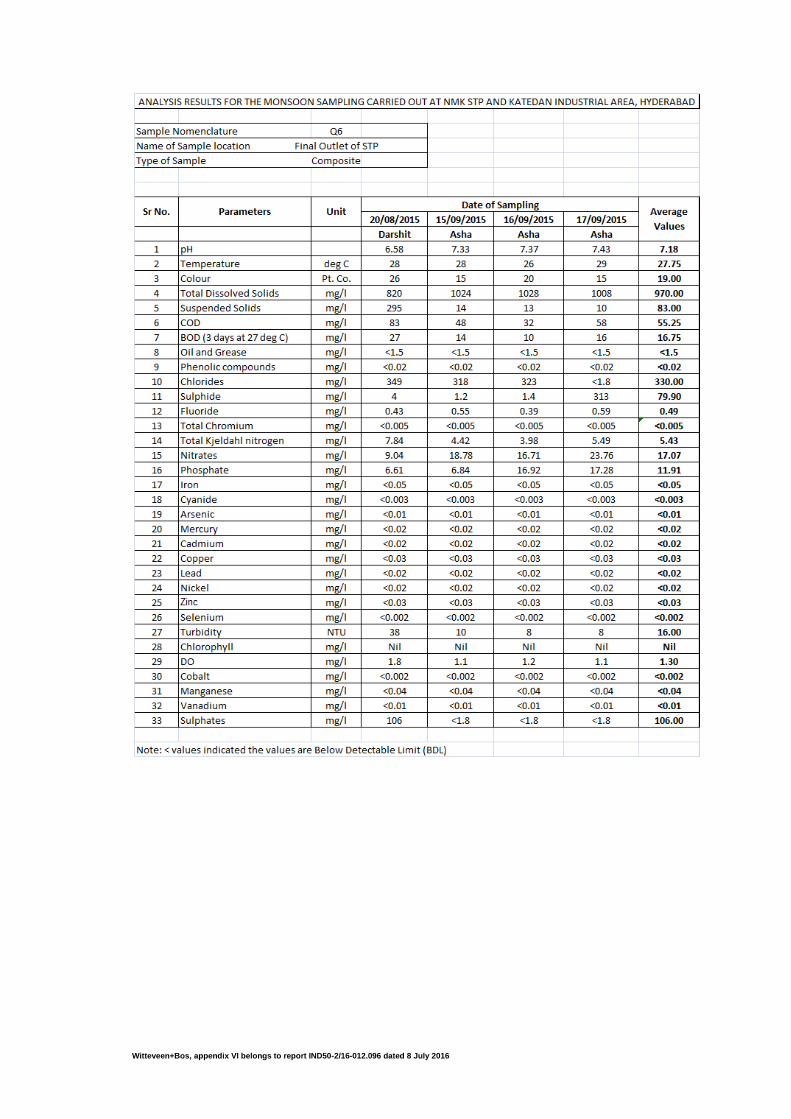
Witteveen+Bos, appendix VI belongs to report IND50-2/16-012.096 dated 8 July 2016
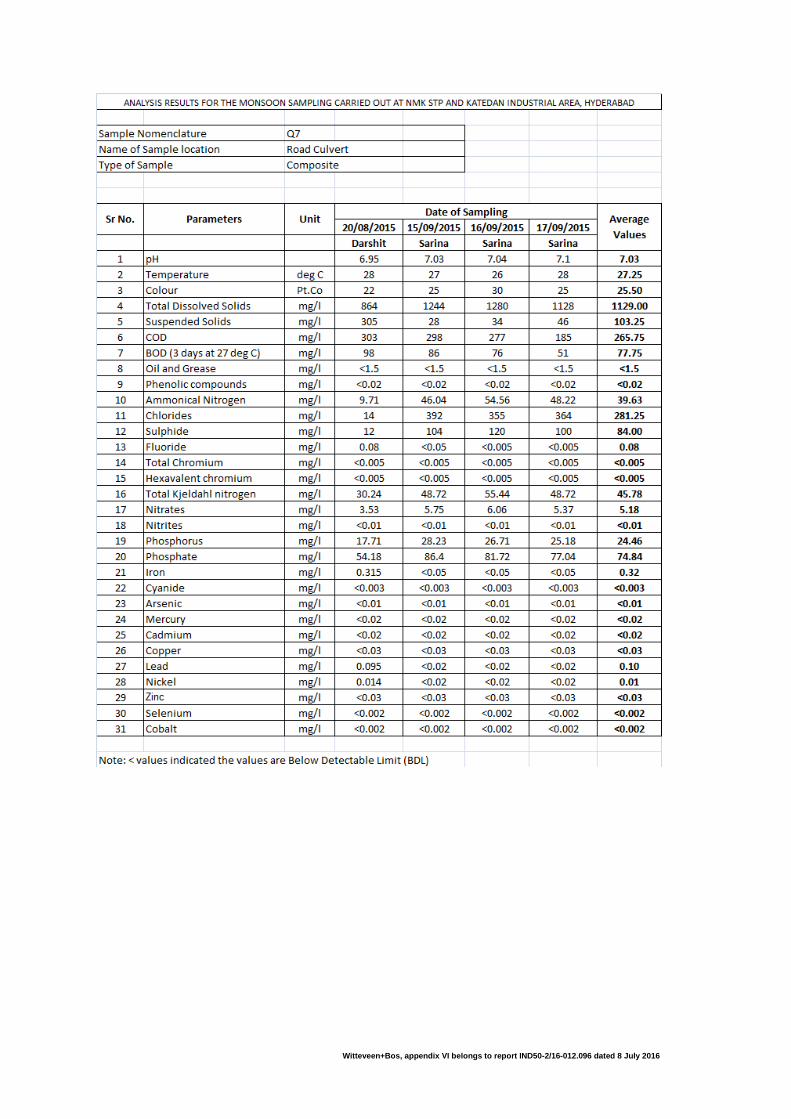
Witteveen+Bos, appendix VI belongs to report IND50-2/16-012.096 dated 8 July 2016
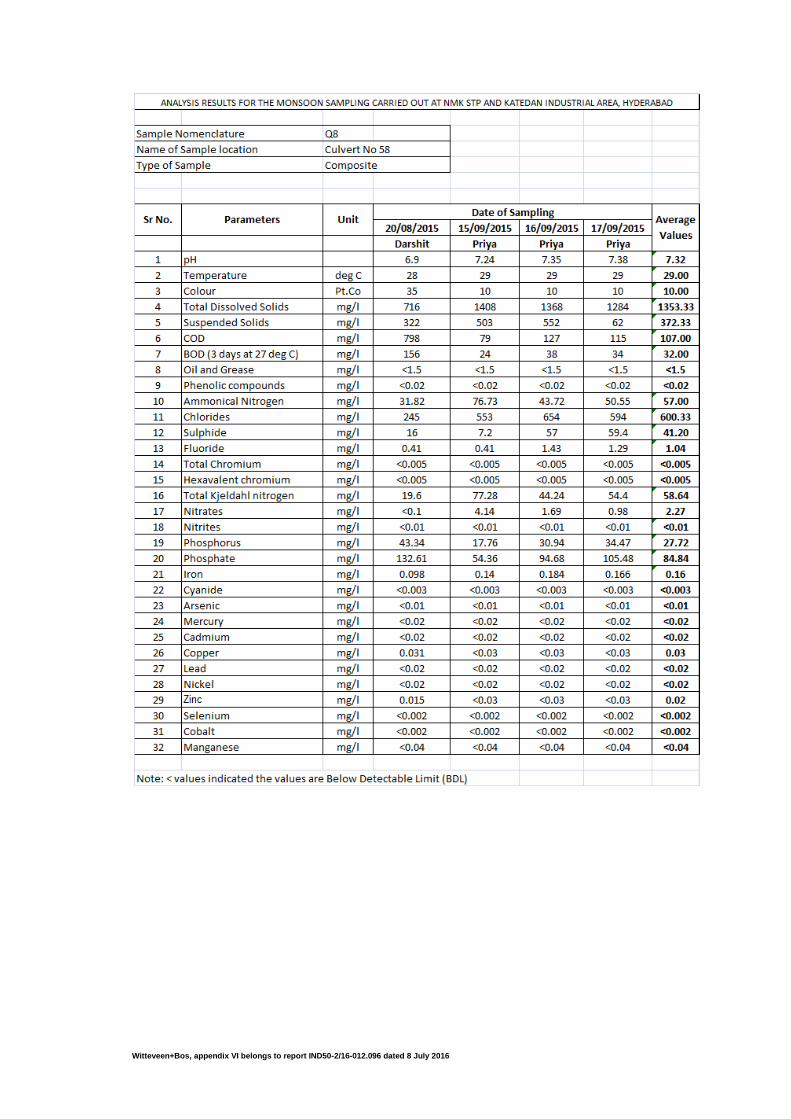
Witteveen+Bos, appendix VI belongs to report IND50-2/16-012.096 dated 8 July 2016
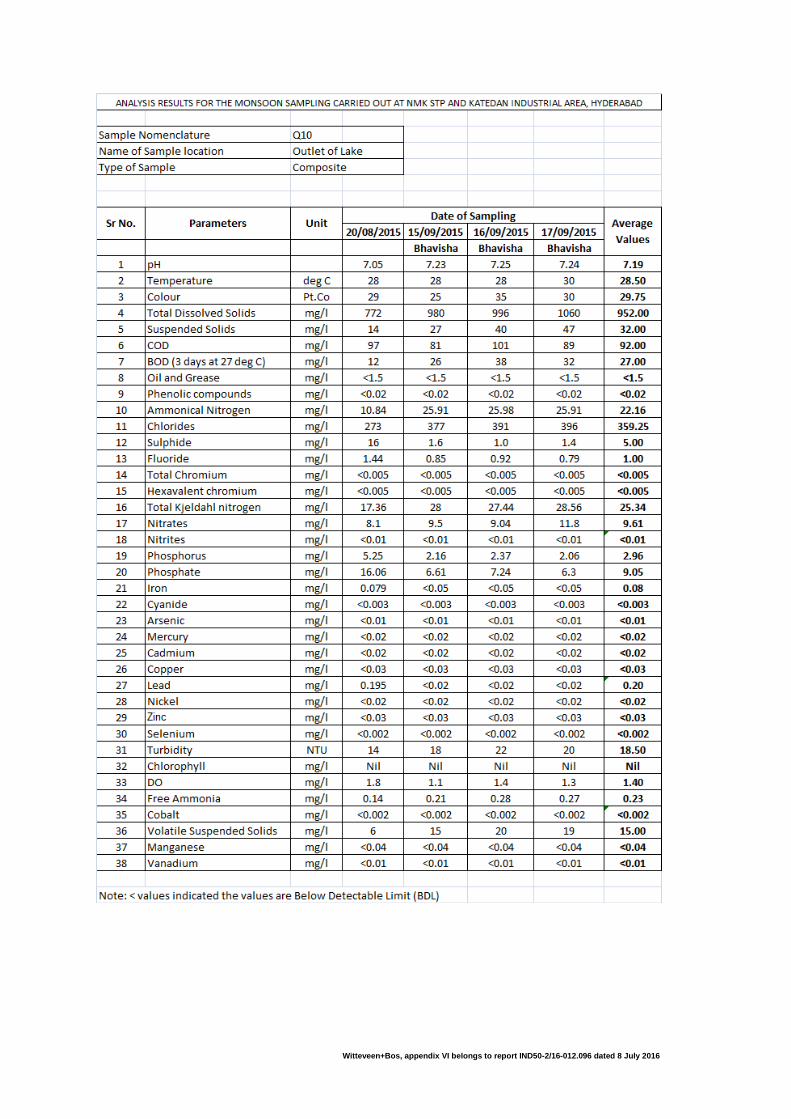
Witteveen+Bos, appendix VI belongs to report IND50-2/16-012.096 dated 8 July 2016
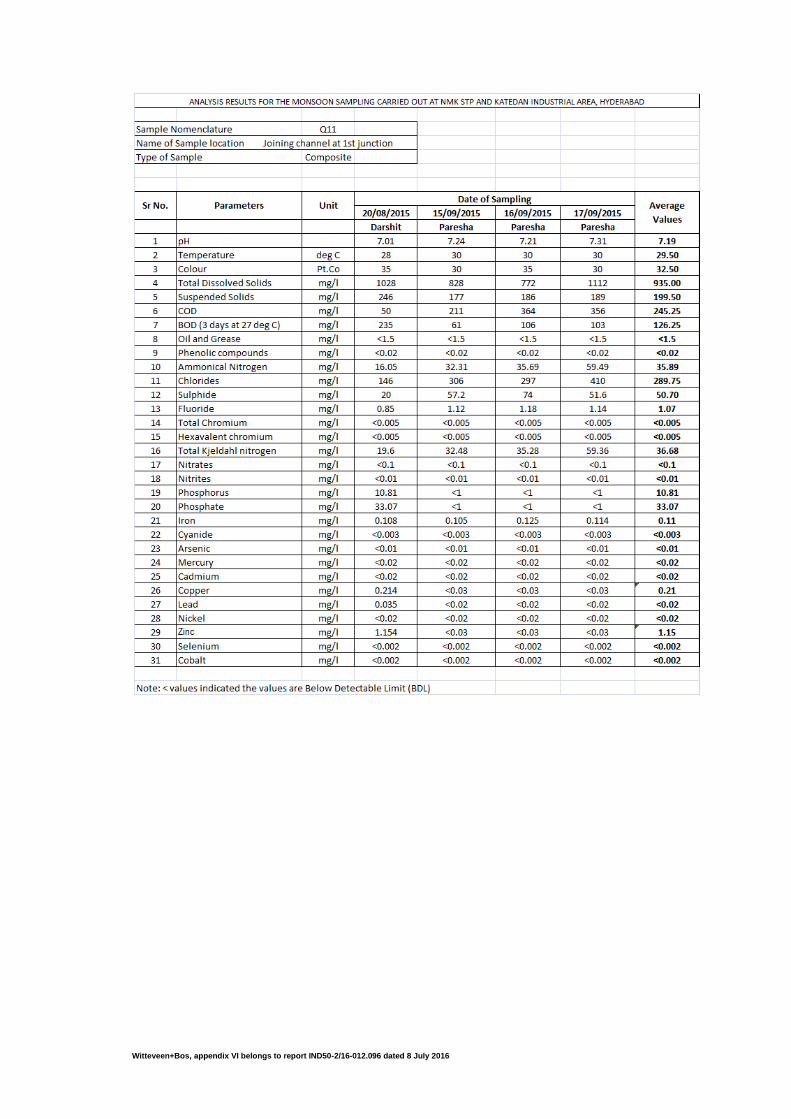
Witteveen+Bos, appendix VI belongs to report IND50-2/16-012.096 dated 8 July 2016
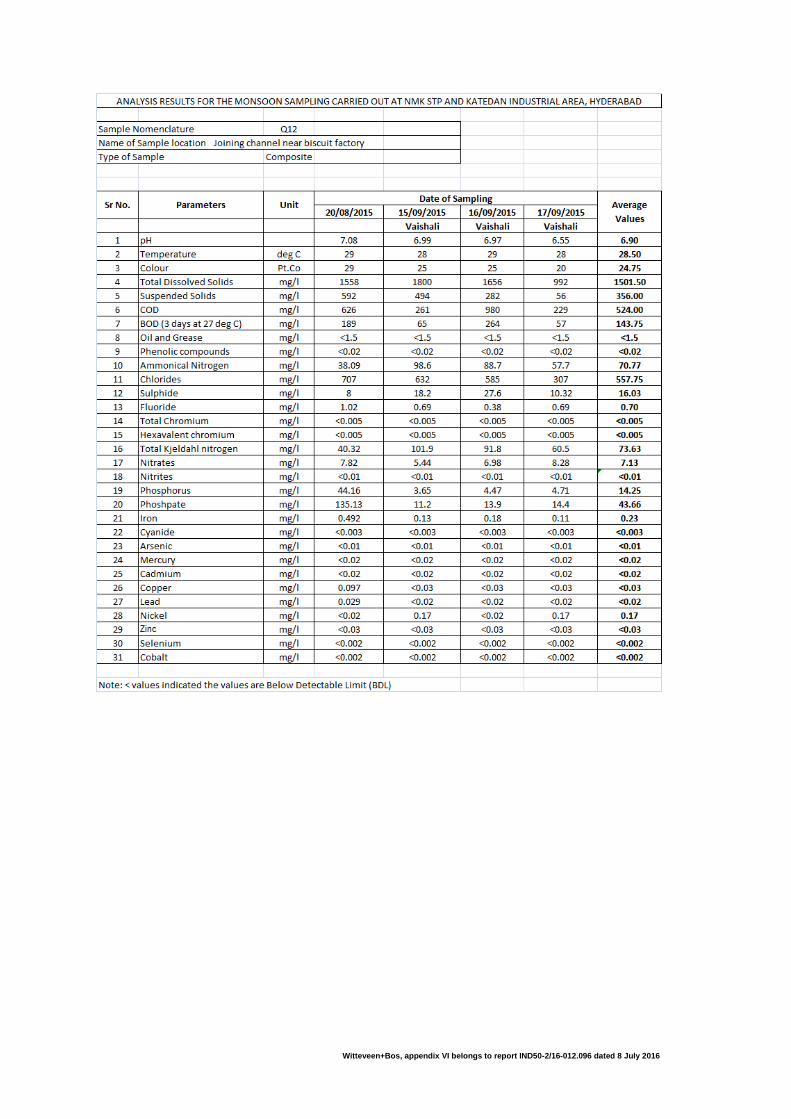
Witteveen+Bos, appendix VI belongs to report IND50-2/16-012.096 dated 8 July 2016