technology, media, and telecommunications update: q1 2019 · technology, media, and...
TRANSCRIPT
Technology, Media, and Telecommunications (TMT) Quarterly updateQ1 2019
Deloitte Corporate Finance LLC | www.investmentbanking.deloitte.com
Quarterly update | Q1 2019 | TMT
www.investmentbanking.deloitte.com | Page 2
• In 2019, blockchain models areexpected to significantlyexpand across a multitude ofsectors that include finance,healthcare, government,manufacturing, etc.
• By 2030, blockchain isexpected to create $3.1 trillionin business value, as it isexpected to help reduce
transaction costs and secure data in the Internet of Things.
Who we are
Deloitte Corporate Finance LLC is a leading global middle market M&A adviser. The firm’s professionals have extensive knowledge in the TMT space and use their experience to help the firm’s clients maximize value.
Contacts
Ron RiveraLead – U.S. [email protected]+1 (404) 631-3710
Byron NelsonManaging [email protected]+1 (469) 417-2462
Michael HakimVice [email protected]+1 (213) 593-4545
TMT M&A trends
Immersive technologies1 Blockchain2
5G technologies3 Everything-as-a-service(XaaS)4
• Immersive technologies andtheir applications are expectedto widely increase in 2019,penetrating industries withroom for disruption such astraining and teaching.
• The market for immersivetechnologies is expected to seesignificant growth within thenext five years, reachingapproximately $55billion by 2021.
• 5G is expected to become thenew standard for wirelesscommunications by extendingthe reach of the internet toalmost any kind of connection,by almost any kind of device,and anywhere a wireless signalcan reach.
• Operators who accumulateusers fastest will likely alsoinnovate quicker, and by theend of 2019, 25 operators areexpected to have launched 5Gservice in their areas.
In this update
• TMT trends• Economic outlook• Industry analysis• Select M&A transactions• Appendix
This update will focus on news and trends in the following areas:
• Immersive technologies• Blockchain• 5G technologies• XaaS• Mergers & Acquisitions
TMT trends
• The demand for XaaS isexpected to expandexponentially, as morebusinesses seek ways toinnovate in order to enhancethe customer experience.
• According to Deloitte’s FlexibleConsumption Survey, XaaScapabilities are increasingconsumers' accessibility tocutting-edge technologies andservices, and many enterprisesare now focusing on acceleratedinnovation as a key initiative.
• The global TMT M&A market has been driven by a wave of megadeals worth in excess of $10 billion, including Fiserv Inc.’sacquisition of First Data Corporation and Hellman & Freidman’sacquisition of The Ultimate Software Group. This 120 percentincrease in deal activity compared to the same period in 2017demonstrates companies’ appetites for large, strategic deals tohelp stay ahead of key market trends. Throughout 2018, M&Atransactions are up in nearly all sectors, totaling over $3.5 trillionacross more than 3,500 deals.5
• Disruptive M&A was a key growth driver in 2018 as companiesspent $217 billion on acquiring disruptive technologies andbusiness models, representing an increase of 28 percent over theprevious year. Since 2015, companies have spent $877 billion onsuch acquisitions. While Digital and Analytics are the largestsegments, there has been a sharp increase in Fintech, Cyber, andHealthtech deals and these are expected to grow in 2019.5
• General market trends are expected to provide tailwinds to TMTM&A deal activity, including low interest rates, ample amounts ofdry powder, aggressive debt markets, and an emerging and hotIPO market for technology. Moreover, massive private equityfundraising is also expected to drive M&A in 2019.5
Quarterly update | Q1 2019 | TMT
www.investmentbanking.deloitte.com | Page 3
65
75
85
95
105
115
125
135
145
48
50
52
54
56
58
60
62
64
Con
sum
er confid
ence
ISM
Non
-man
ufa
ctu
rin
g
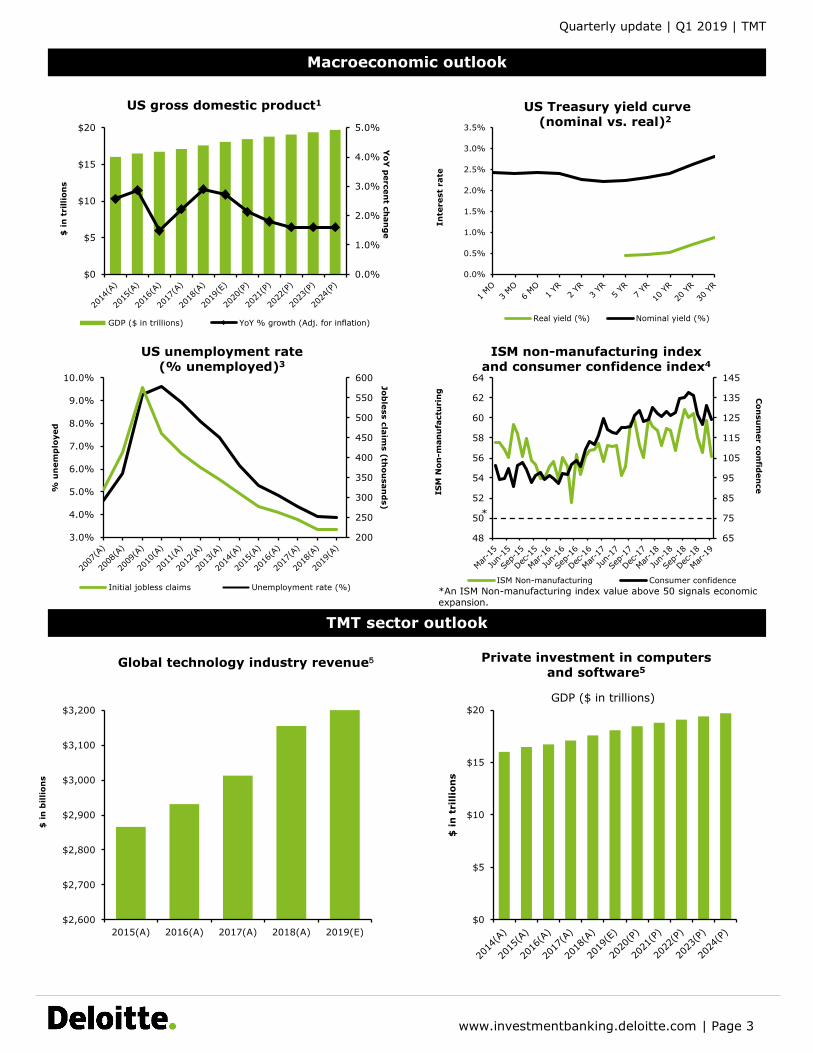
ISM Non-manufacturing Consumer confidence
US Treasury yield curve (nominal vs. real)2
US gross domestic product1
US unemployment rate(% unemployed)3
ISM non-manufacturing indexand consumer confidence index4
Global technology industry revenue5 Private investment in computers and software5
TMT sector outlook
*An ISM Non-manufacturing index value above 50 signals economicexpansion.
Macroeconomic outlook
*
$2,600
$2,700
$2,800
$2,900
$3,000
$3,100
$3,200
2015(A) 2016(A) 2017(A) 2018(A) 2019(E)
$ in
bill
ion
s
$0
$5
$10
$15
$20
0.0%
1.0%
2.0%
3.0%
4.0%
5.0%
$ i
n t
rilli
ons
YoY
percen
t chan
ge
GDP ($ in trillions) YoY % growth (Adj. for inflation)
0.0%
0.5%
1.0%
1.5%
2.0%
2.5%
3.0%
3.5%
Inte
rest
rat
e
Real yield (%) Nominal yield (%)
200
250
300
350
400
450
500
550
600
3.0%
4.0%
5.0%
6.0%
7.0%
8.0%
9.0%
10.0% Job
less claims (th
ou
sand
s)
% u
nem
plo
yed
Initial jobless claims Unemployment rate (%)
$0
$5
$10
$15
$20
$ in
tri
llio
ns
GDP ($ in trillions)
Quarterly update | Q1 2019 | TMT
www.investmentbanking.deloitte.com | Page 4
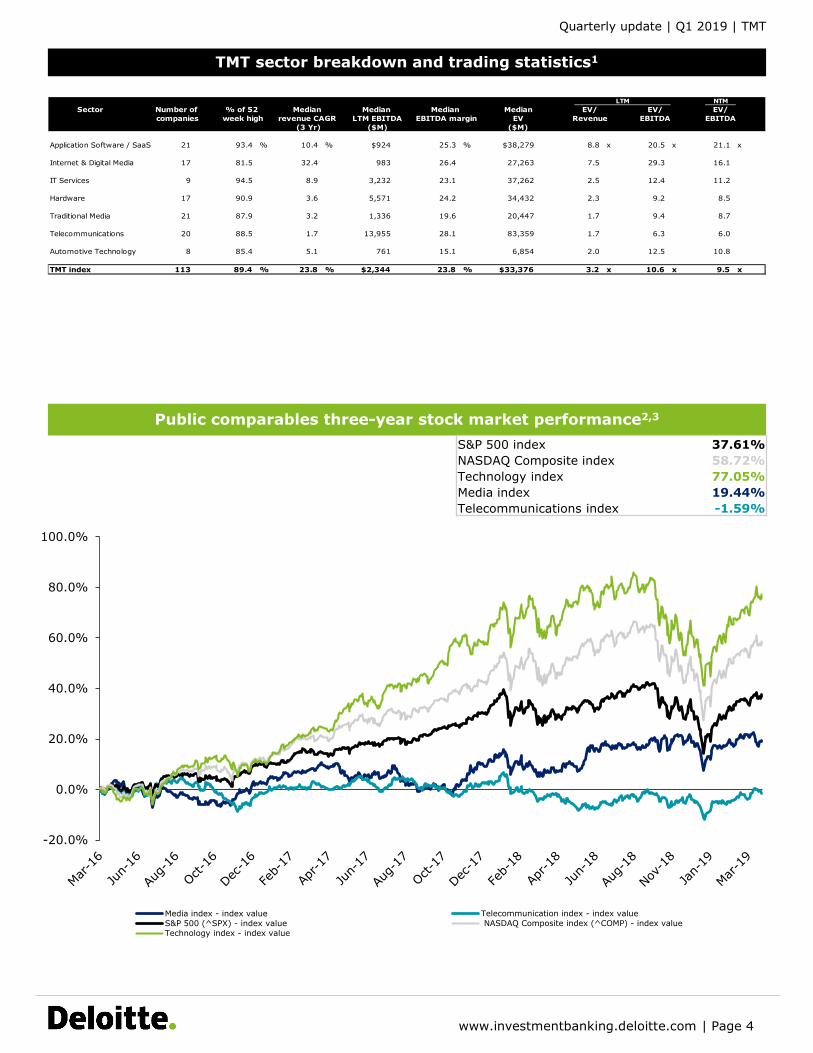
TMT sector breakdown and trading statistics1
($M)
Public comparables three-year stock market performance2,3
37.61%58.72%77.05%19.44%
S&P 500 indexNASDAQ Composite index Technology indexMedia index Telecommunications index -1.59%
-20.0%
0.0%
20.0%
40.0%
60.0%
80.0%
100.0%
Telecommunication index - index value NASDAQ Composite index (^COMP) - index value
Media index - index valueS&P 500 (^SPX) - index value Technology index - index value
LTM NTMSector Number of % of 52 Median Median Median Median EV/ EV/ EV/
companies week high revenue CAGR LTM EBITDA EBITDA margin EV Revenue EBITDA EBITDA(3 Yr) ($M) ($M)
Application Software / SaaS 21 93.4 % 10.4 % $924 25.3 % $38,279 8.8 x 20.5 x 21.1 x
Internet & Digital Media 17 81.5 32.4 983 26.4 27,263 7.5 29.3 16.1
IT Services 9 94.5 8.9 3,232 23.1 37,262 2.5 12.4 11.2
Hardware 17 90.9 3.6 5,571 24.2 34,432 2.3 9.2 8.5
Traditional Media 21 87.9 3.2 1,336 19.6 20,447 1.7 9.4 8.7
Telecommunications 20 88.5 1.7 13,955 28.1 83,359 1.7 6.3 6.0
Automotive Technology 8 85.4 5.1 761 15.1 6,854 2.0 12.5 10.8
TMT index 113 89.4 % 23.8 % $2,344 23.8 % $33,376 3.2 x 10.6 x 9.5 x
Quarterly update | Q1 2019 | TMT
www.investmentbanking.deloitte.com | Page 5
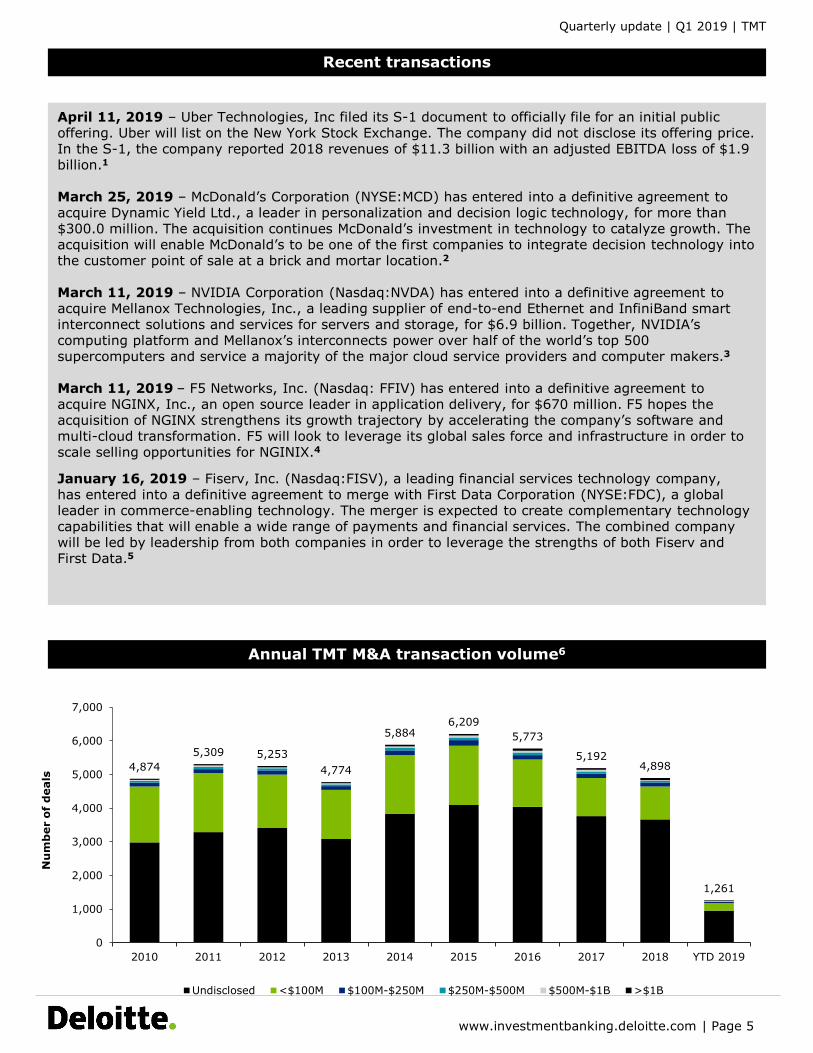
Annual TMT M&A transaction volume6
Recent transactions
April 11, 2019 – Uber Technologies, Inc filed its S-1 document to officially file for an initial public offering. Uber will list on the New York Stock Exchange. The company did not disclose its offering price. In the S-1, the company reported 2018 revenues of $11.3 billion with an adjusted EBITDA loss of $1.9 billion.1
March 25, 2019 – McDonald’s Corporation (NYSE:MCD) has entered into a definitive agreement to acquire Dynamic Yield Ltd., a leader in personalization and decision logic technology, for more than $300.0 million. The acquisition continues McDonald’s investment in technology to catalyze growth. The acquisition will enable McDonald’s to be one of the first companies to integrate decision technology into the customer point of sale at a brick and mortar location.2
March 11, 2019 – NVIDIA Corporation (Nasdaq:NVDA) has entered into a definitive agreement to acquire Mellanox Technologies, Inc., a leading supplier of end-to-end Ethernet and InfiniBand smart interconnect solutions and services for servers and storage, for $6.9 billion. Together, NVIDIA’s computing platform and Mellanox’s interconnects power over half of the world’s top 500 supercomputers and service a majority of the major cloud service providers and computer makers.3
March 11, 2019 – F5 Networks, Inc. (Nasdaq: FFIV) has entered into a definitive agreement to acquire NGINX, Inc., an open source leader in application delivery, for $670 million. F5 hopes the acquisition of NGINX strengthens its growth trajectory by accelerating the company’s software and multi-cloud transformation. F5 will look to leverage its global sales force and infrastructure in order to scale selling opportunities for NGINIX.4
January 16, 2019 – Fiserv, Inc. (Nasdaq:FISV), a leading financial services technology company, has entered into a definitive agreement to merge with First Data Corporation (NYSE:FDC), a global leader in commerce-enabling technology. The merger is expected to create complementary technology capabilities that will enable a wide range of payments and financial services. The combined company will be led by leadership from both companies in order to leverage the strengths of both Fiserv and First Data.5
4,874 5,309 5,253
4,774
5,884 6,209
5,773
5,192 4,898
1,261
0
1,000
2,000
3,000
4,000
5,000
6,000
7,000
2010 2011 2012 2013 2014 2015 2016 2017 2018 YTD 2019
Nu
mb
er o
f d
eals
Undisclosed <$100M $100M-$250M $250M-$500M $500M-$1B >$1B
Quarterly update | Q1 2019 | TMT
www.investmentbanking.deloitte.com | Page 6
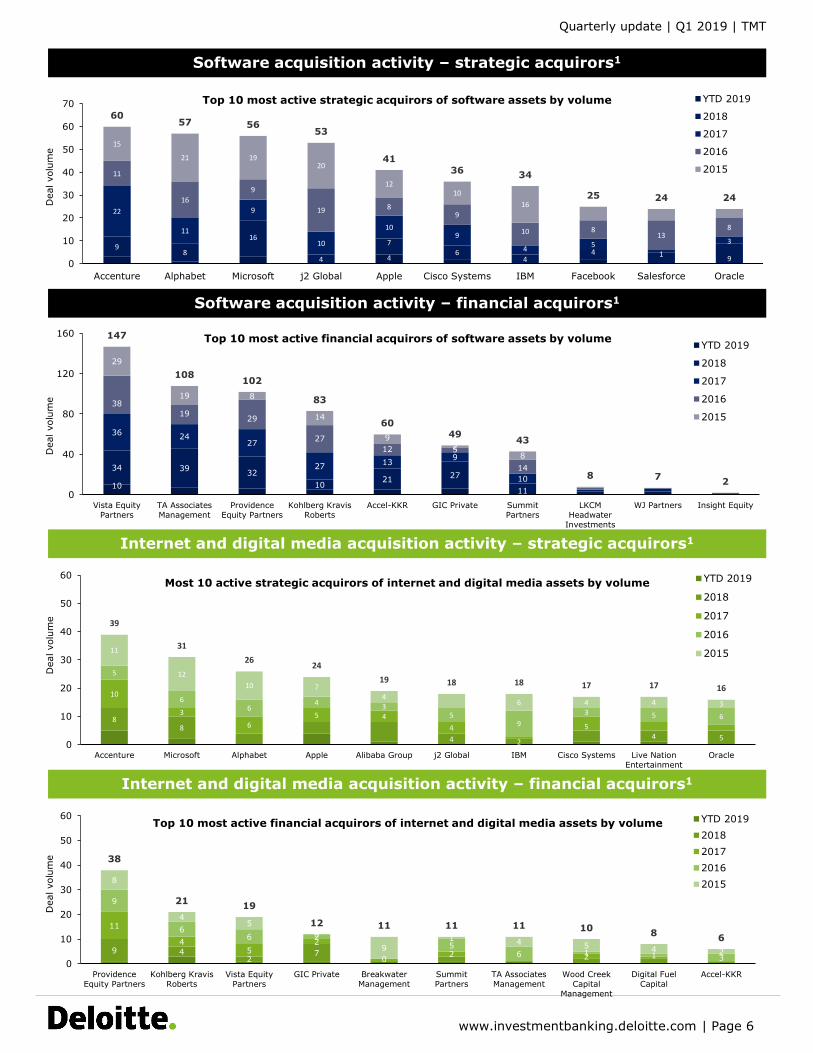
Software acquisition activity – strategic acquirors1
Software acquisition activity – financial acquirors1
Internet and digital media acquisition activity – strategic acquirors1
Internet and digital media acquisition activity – financial acquirors1
Dea
l vol
ume
Dea
l vol
ume
Dea
l vol
ume
Dea
l vol
ume
49
8
16
4
76
44
9
22
11
9
10
109
4 51
3
11
169
19 89
10 813
8
15
21 1920
1210
16
6057 56
53
4136 34
25 24 24
0
10
20
30
40
50
60
70
Accenture Alphabet Microsoft j2 Global Apple Cisco Systems IBM Facebook Salesforce Oracle
Top 10 most active strategic acquirors of software assets by volume YTD 2019
2018
2017
2016
2015
10
0
34 39 3210
21 27
11
36 2427
27 13 9
10
3819 29
2712 5
14
29
19 8
14
92
8
147
108 102
83
6049 43
8 7 20
40
80
120
160
Vista EquityPartners
TA AssociatesManagement
ProvidenceEquity Partners
Kohlberg KravisRoberts
Accel-KKR GIC Private SummitPartners
LKCMHeadwater
Investments
WJ Partners Insight Equity
Top 10 most active financial acquirors of software assets by volume YTD 2019
2018
2017
2016
2015
88
4 24 5
10
3
65 4
4 5
5
66
4 35
93 5 6
11
1210 7
46 4 4 3
39
3126 24
19 18 18 17 17 16
0
10
20
30
40
50
60
Accenture Microsoft Alphabet Apple Alibaba Group j2 Global IBM Cisco Systems Live NationEntertainment
Oracle
Most 10 active strategic acquirors of internet and digital media assets by volume YTD 2019
2018
2017
2016
2015
9 42
7
11
45
22 2
9
66 2
0
56 1 1 3
8
45
0
91 4 5 4 2
38
21 19
12 11 11 11 10 8 6
0
10
20
30
40
50
60
ProvidenceEquity Partners
Kohlberg KravisRoberts
Vista EquityPartners
GIC Private BreakwaterManagement
SummitPartners
TA AssociatesManagement
Wood CreekCapital
Management
Digital FuelCapital
Accel-KKR
Top 10 most active financial acquirors of internet and digital media assets by volume YTD 20192018201720162015
Quarterly update | Q1 2019 | TMT
www.investmentbanking.deloitte.com | Page 7
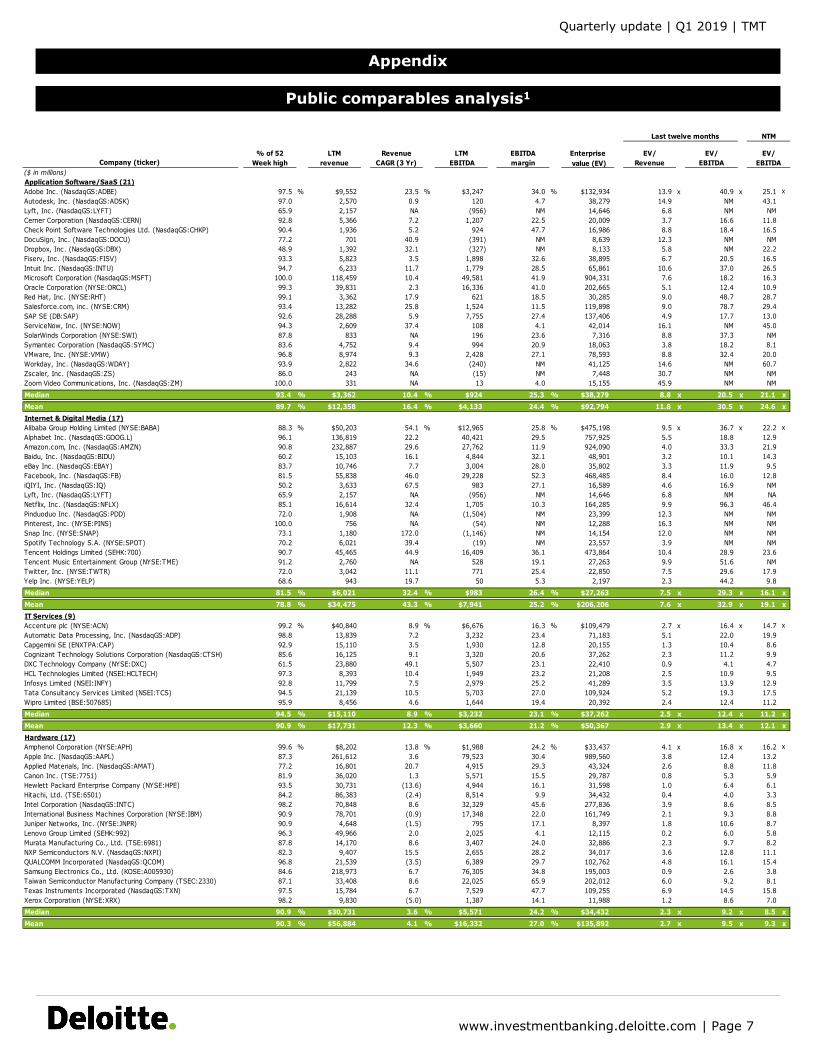
Public comparables analysis1
Appendix
Last twelve months NTM
Company (ticker) % of 52
Week highLTM
revenueRevenue
CAGR (3 Yr)LTM
EBITDAEBITDA margin
Enterprise value (EV)
EV/Revenue
EV/EBITDA
EV/EBITDA
($ in millions)Application Software/SaaS (21)Adobe Inc. (NasdaqGS:ADBE) 97.5 % $9,552 23.5 % $3,247 34.0 % $132,934 13.9 x 40.9 x 25.1 xAutodesk, Inc. (NasdaqGS:ADSK) 97.0 2,570 0.9 120 4.7 38,279 14.9 NM 43.1Lyft, Inc. (NasdaqGS:LYFT) 65.9 2,157 NA (956) NM 14,646 6.8 NM NMCerner Corporation (NasdaqGS:CERN) 92.8 5,366 7.2 1,207 22.5 20,009 3.7 16.6 11.8Check Point Software Technologies Ltd. (NasdaqGS:CHKP) 90.4 1,936 5.2 924 47.7 16,986 8.8 18.4 16.5DocuSign, Inc. (NasdaqGS:DOCU) 77.2 701 40.9 (391) NM 8,639 12.3 NM NMDropbox, Inc. (NasdaqGS:DBX) 48.9 1,392 32.1 (327) NM 8,133 5.8 NM 22.2Fiserv, Inc. (NasdaqGS:FISV) 93.3 5,823 3.5 1,898 32.6 38,895 6.7 20.5 16.5Intuit Inc. (NasdaqGS:INTU) 94.7 6,233 11.7 1,779 28.5 65,861 10.6 37.0 26.5Microsoft Corporation (NasdaqGS:MSFT) 100.0 118,459 10.4 49,581 41.9 904,331 7.6 18.2 16.3Oracle Corporation (NYSE:ORCL) 99.3 39,831 2.3 16,336 41.0 202,665 5.1 12.4 10.9Red Hat, Inc. (NYSE:RHT) 99.1 3,362 17.9 621 18.5 30,285 9.0 48.7 28.7Salesforce.com, inc. (NYSE:CRM) 93.4 13,282 25.8 1,524 11.5 119,898 9.0 78.7 29.4SAP SE (DB:SAP) 92.6 28,288 5.9 7,755 27.4 137,406 4.9 17.7 13.0ServiceNow, Inc. (NYSE:NOW) 94.3 2,609 37.4 108 4.1 42,014 16.1 NM 45.0SolarWinds Corporation (NYSE:SWI) 87.8 833 NA 196 23.6 7,316 8.8 37.3 NMSymantec Corporation (NasdaqGS:SYMC) 83.6 4,752 9.4 994 20.9 18,063 3.8 18.2 8.1VMware, Inc. (NYSE:VMW) 96.8 8,974 9.3 2,428 27.1 78,593 8.8 32.4 20.0Workday, Inc. (NasdaqGS:WDAY) 93.9 2,822 34.6 (240) NM 41,125 14.6 NM 60.7Zscaler, Inc. (NasdaqGS:ZS) 86.0 243 NA (15) NM 7,448 30.7 NM NMZoom Video Communications, Inc. (NasdaqGS:ZM) 100.0 331 NA 13 4.0 15,155 45.9 NM NMMedian 93.4 % $3,362 10.4 % $924 25.3 % $38,279 8.8 x 20.5 x 21.1 xMean 89.7 % $12,358 16.4 % $4,133 24.4 % $92,794 11.8 x 30.5 x 24.6 xInternet & Digital Media (17)Alibaba Group Holding Limited (NYSE:BABA) 88.3 % $50,203 54.1 % $12,965 25.8 % $475,198 9.5 x 36.7 x 22.2 xAlphabet Inc. (NasdaqGS:GOOG.L) 96.1 136,819 22.2 40,421 29.5 757,925 5.5 18.8 12.9Amazon.com, Inc. (NasdaqGS:AMZN) 90.8 232,887 29.6 27,762 11.9 924,090 4.0 33.3 21.9Baidu, Inc. (NasdaqGS:BIDU) 60.2 15,103 16.1 4,844 32.1 48,901 3.2 10.1 14.3eBay Inc. (NasdaqGS:EBAY) 83.7 10,746 7.7 3,004 28.0 35,802 3.3 11.9 9.5Facebook, Inc. (NasdaqGS:FB) 81.5 55,838 46.0 29,228 52.3 468,485 8.4 16.0 12.8iQIYI, Inc. (NasdaqGS:IQ) 50.2 3,633 67.5 983 27.1 16,589 4.6 16.9 NMLyft, Inc. (NasdaqGS:LYFT) 65.9 2,157 NA (956) NM 14,646 6.8 NM NANetflix, Inc. (NasdaqGS:NFLX) 85.1 16,614 32.4 1,705 10.3 164,285 9.9 96.3 46.4Pinduoduo Inc. (NasdaqGS:PDD) 72.0 1,908 NA (1,504) NM 23,399 12.3 NM NMPinterest, Inc. (NYSE:PINS) 100.0 756 NA (54) NM 12,288 16.3 NM NMSnap Inc. (NYSE:SNAP) 73.1 1,180 172.0 (1,146) NM 14,154 12.0 NM NMSpotify Technology S.A. (NYSE:SPOT) 70.2 6,021 39.4 (19) NM 23,557 3.9 NM NMTencent Holdings Limited (SEHK:700) 90.7 45,465 44.9 16,409 36.1 473,864 10.4 28.9 23.6Tencent Music Entertainment Group (NYSE:TME) 91.2 2,760 NA 528 19.1 27,263 9.9 51.6 NMTwitter, Inc. (NYSE:TWTR) 72.0 3,042 11.1 771 25.4 22,850 7.5 29.6 17.9Yelp Inc. (NYSE:YELP) 68.6 943 19.7 50 5.3 2,197 2.3 44.2 9.8Median 81.5 % $6,021 32.4 % $983 26.4 % $27,263 7.5 x 29.3 x 16.1 xMean 78.8 % $34,475 43.3 % $7,941 25.2 % $206,206 7.6 x 32.9 x 19.1 xIT Services (9)Accenture plc (NYSE:ACN) 99.2 % $40,840 8.9 % $6,676 16.3 % $109,479 2.7 x 16.4 x 14.7 xAutomatic Data Processing, Inc. (NasdaqGS:ADP) 98.8 13,839 7.2 3,232 23.4 71,183 5.1 22.0 19.9Capgemini SE (ENXTPA:CAP) 92.9 15,110 3.5 1,930 12.8 20,155 1.3 10.4 8.6Cognizant Technology Solutions Corporation (NasdaqGS:CTSH) 85.6 16,125 9.1 3,320 20.6 37,262 2.3 11.2 9.9DXC Technology Company (NYSE:DXC) 61.5 23,880 49.1 5,507 23.1 22,410 0.9 4.1 4.7HCL Technologies Limited (NSEI:HCLTECH) 97.3 8,393 10.4 1,949 23.2 21,208 2.5 10.9 9.5Infosys Limited (NSEI:INFY) 92.8 11,799 7.5 2,979 25.2 41,289 3.5 13.9 12.9Tata Consultancy Services Limited (NSEI:TCS) 94.5 21,139 10.5 5,703 27.0 109,924 5.2 19.3 17.5Wipro Limited (BSE:507685) 95.9 8,456 4.6 1,644 19.4 20,392 2.4 12.4 11.2Median 94.5 % $15,110 8.9 % $3,232 23.1 % $37,262 2.5 x 12.4 x 11.2 xMean 90.9 % $17,731 12.3 % $3,660 21.2 % $50,367 2.9 x 13.4 x 12.1 xHardware (17)Amphenol Corporation (NYSE:APH) 99.6 % $8,202 13.8 % $1,988 24.2 % $33,437 4.1 x 16.8 x 16.2 xApple Inc. (NasdaqGS:AAPL) 87.3 261,612 3.6 79,523 30.4 989,560 3.8 12.4 13.2Applied Materials, Inc. (NasdaqGS:AMAT) 77.2 16,801 20.7 4,915 29.3 43,324 2.6 8.8 11.8Canon Inc. (TSE:7751) 81.9 36,020 1.3 5,571 15.5 29,787 0.8 5.3 5.9Hewlett Packard Enterprise Company (NYSE:HPE) 93.5 30,731 (13.6) 4,944 16.1 31,598 1.0 6.4 6.1Hitachi, Ltd. (TSE:6501) 84.2 86,383 (2.4) 8,514 9.9 34,432 0.4 4.0 3.3Intel Corporation (NasdaqGS:INTC) 98.2 70,848 8.6 32,329 45.6 277,836 3.9 8.6 8.5International Business Machines Corporation (NYSE:IBM) 90.9 78,701 (0.9) 17,348 22.0 161,749 2.1 9.3 8.8Juniper Networks, Inc. (NYSE:JNPR) 90.9 4,648 (1.5) 795 17.1 8,397 1.8 10.6 8.7Lenovo Group Limited (SEHK:992) 96.3 49,966 2.0 2,025 4.1 12,115 0.2 6.0 5.8Murata Manufacturing Co., Ltd. (TSE:6981) 87.8 14,170 8.6 3,407 24.0 32,886 2.3 9.7 8.2NXP Semiconductors N.V. (NasdaqGS:NXPI) 82.3 9,407 15.5 2,655 28.2 34,017 3.6 12.8 11.1QUALCOMM Incorporated (NasdaqGS:QCOM) 96.8 21,539 (3.5) 6,389 29.7 102,762 4.8 16.1 15.4Samsung Electronics Co., Ltd. (KOSE:A005930) 84.6 218,973 6.7 76,305 34.8 195,003 0.9 2.6 3.8Taiwan Semiconductor Manufacturing Company (TSEC:2330) 87.1 33,408 8.6 22,025 65.9 202,012 6.0 9.2 8.1Texas Instruments Incorporated (NasdaqGS:TXN) 97.5 15,784 6.7 7,529 47.7 109,255 6.9 14.5 15.8Xerox Corporation (NYSE:XRX) 98.2 9,830 (5.0) 1,387 14.1 11,988 1.2 8.6 7.0Median 90.9 % $30,731 3.6 % $5,571 24.2 % $34,432 2.3 x 9.2 x 8.5 xMean 90.3 % $56,884 4.1 % $16,332 27.0 % $135,892 2.7 x 9.5 x 9.3 x
Quarterly update | Q1 2019 | TMT
www.investmentbanking.deloitte.com | Page 8
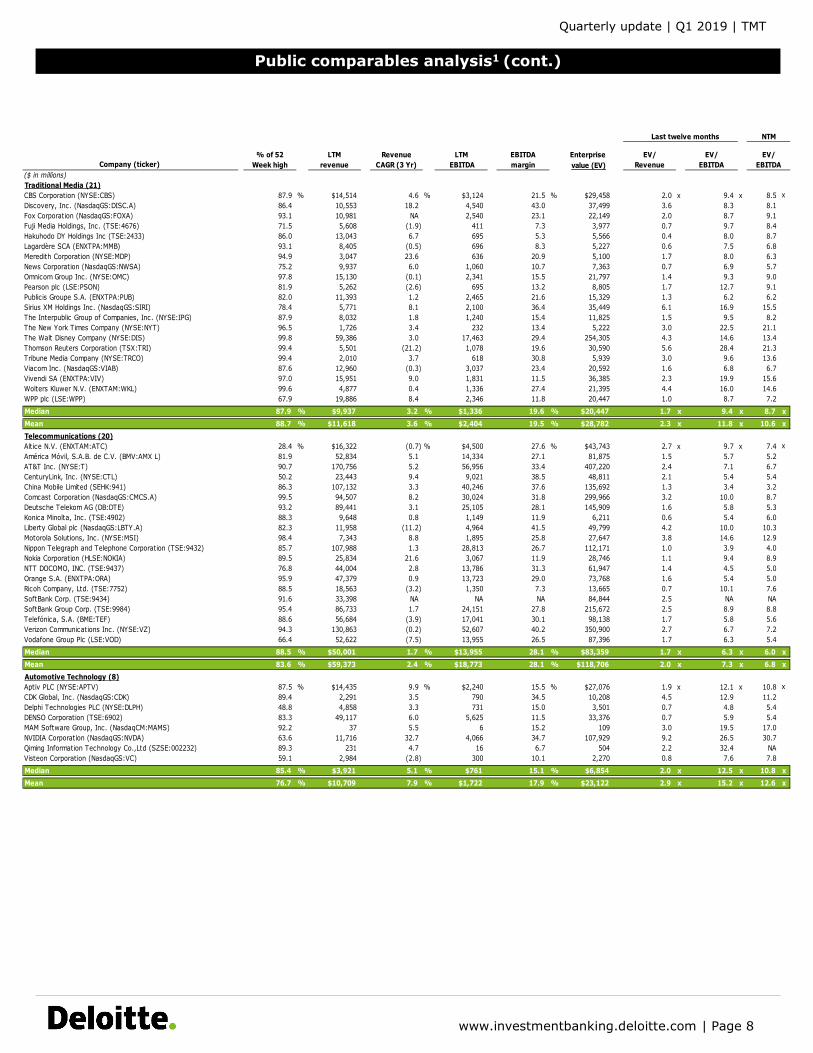
Public comparables analysis1 (cont.)
Last twelve months NTM
Company (ticker) % of 52
Week highLTM
revenueRevenue
CAGR (3 Yr)LTM
EBITDAEBITDA margin
Enterprise value (EV)
EV/Revenue
EV/EBITDA
EV/EBITDA
($ in millions)Traditional Media (21)CBS Corporation (NYSE:CBS) 87.9 % $14,514 4.6 % $3,124 21.5 % $29,458 2.0 x 9.4 x 8.5 xDiscovery, Inc. (NasdaqGS:DISC.A) 86.4 10,553 18.2 4,540 43.0 37,499 3.6 8.3 8.1Fox Corporation (NasdaqGS:FOXA) 93.1 10,981 NA 2,540 23.1 22,149 2.0 8.7 9.1Fuji Media Holdings, Inc. (TSE:4676) 71.5 5,608 (1.9) 411 7.3 3,977 0.7 9.7 8.4Hakuhodo DY Holdings Inc (TSE:2433) 86.0 13,043 6.7 695 5.3 5,566 0.4 8.0 8.7Lagardère SCA (ENXTPA:MMB) 93.1 8,405 (0.5) 696 8.3 5,227 0.6 7.5 6.8Meredith Corporation (NYSE:MDP) 94.9 3,047 23.6 636 20.9 5,100 1.7 8.0 6.3News Corporation (NasdaqGS:NWSA) 75.2 9,937 6.0 1,060 10.7 7,363 0.7 6.9 5.7Omnicom Group Inc. (NYSE:OMC) 97.8 15,130 (0.1) 2,341 15.5 21,797 1.4 9.3 9.0Pearson plc (LSE:PSON) 81.9 5,262 (2.6) 695 13.2 8,805 1.7 12.7 9.1Publicis Groupe S.A. (ENXTPA:PUB) 82.0 11,393 1.2 2,465 21.6 15,329 1.3 6.2 6.2Sirius XM Holdings Inc. (NasdaqGS:SIRI) 78.4 5,771 8.1 2,100 36.4 35,449 6.1 16.9 15.5The Interpublic Group of Companies, Inc. (NYSE:IPG) 87.9 8,032 1.8 1,240 15.4 11,825 1.5 9.5 8.2The New York Times Company (NYSE:NYT) 96.5 1,726 3.4 232 13.4 5,222 3.0 22.5 21.1The Walt Disney Company (NYSE:DIS) 99.8 59,386 3.0 17,463 29.4 254,305 4.3 14.6 13.4Thomson Reuters Corporation (TSX:TRI) 99.4 5,501 (21.2) 1,078 19.6 30,590 5.6 28.4 21.3Tribune Media Company (NYSE:TRCO) 99.4 2,010 3.7 618 30.8 5,939 3.0 9.6 13.6Viacom Inc. (NasdaqGS:VIAB) 87.6 12,960 (0.3) 3,037 23.4 20,592 1.6 6.8 6.7Vivendi SA (ENXTPA:VIV) 97.0 15,951 9.0 1,831 11.5 36,385 2.3 19.9 15.6Wolters Kluwer N.V. (ENXTAM:WKL) 99.6 4,877 0.4 1,336 27.4 21,395 4.4 16.0 14.6WPP plc (LSE:WPP) 67.9 19,886 8.4 2,346 11.8 20,447 1.0 8.7 7.2Median 87.9 % $9,937 3.2 % $1,336 19.6 % $20,447 1.7 x 9.4 x 8.7 xMean 88.7 % $11,618 3.6 % $2,404 19.5 % $28,782 2.3 x 11.8 x 10.6 xTelecommunications (20)Altice N.V. (ENXTAM:ATC) 28.4 % $16,322 (0.7) % $4,500 27.6 % $43,743 2.7 x 9.7 x 7.4 xAmérica Móvil, S.A.B. de C.V. (BMV:AMX L) 81.9 52,834 5.1 14,334 27.1 81,875 1.5 5.7 5.2AT&T Inc. (NYSE:T) 90.7 170,756 5.2 56,956 33.4 407,220 2.4 7.1 6.7CenturyLink, Inc. (NYSE:CTL) 50.2 23,443 9.4 9,021 38.5 48,811 2.1 5.4 5.4China Mobile Limited (SEHK:941) 86.3 107,132 3.3 40,246 37.6 135,692 1.3 3.4 3.2Comcast Corporation (NasdaqGS:CMCS.A) 99.5 94,507 8.2 30,024 31.8 299,966 3.2 10.0 8.7Deutsche Telekom AG (DB:DTE) 93.2 89,441 3.1 25,105 28.1 145,909 1.6 5.8 5.3Konica Minolta, Inc. (TSE:4902) 88.3 9,648 0.8 1,149 11.9 6,211 0.6 5.4 6.0Liberty Global plc (NasdaqGS:LBTY.A) 82.3 11,958 (11.2) 4,964 41.5 49,799 4.2 10.0 10.3Motorola Solutions, Inc. (NYSE:MSI) 98.4 7,343 8.8 1,895 25.8 27,647 3.8 14.6 12.9Nippon Telegraph and Telephone Corporation (TSE:9432) 85.7 107,988 1.3 28,813 26.7 112,171 1.0 3.9 4.0Nokia Corporation (HLSE:NOKIA) 89.5 25,834 21.6 3,067 11.9 28,746 1.1 9.4 8.9NTT DOCOMO, INC. (TSE:9437) 76.8 44,004 2.8 13,786 31.3 61,947 1.4 4.5 5.0Orange S.A. (ENXTPA:ORA) 95.9 47,379 0.9 13,723 29.0 73,768 1.6 5.4 5.0Ricoh Company, Ltd. (TSE:7752) 88.5 18,563 (3.2) 1,350 7.3 13,665 0.7 10.1 7.6SoftBank Corp. (TSE:9434) 91.6 33,398 NA NA NA 84,844 2.5 NA NASoftBank Group Corp. (TSE:9984) 95.4 86,733 1.7 24,151 27.8 215,672 2.5 8.9 8.8Telefónica, S.A. (BME:TEF) 88.6 56,684 (3.9) 17,041 30.1 98,138 1.7 5.8 5.6Verizon Communications Inc. (NYSE:VZ) 94.3 130,863 (0.2) 52,607 40.2 350,900 2.7 6.7 7.2Vodafone Group Plc (LSE:VOD) 66.4 52,622 (7.5) 13,955 26.5 87,396 1.7 6.3 5.4Median 88.5 % $50,001 1.7 % $13,955 28.1 % $83,359 1.7 x 6.3 x 6.0 xMean 83.6 % $59,373 2.4 % $18,773 28.1 % $118,706 2.0 x 7.3 x 6.8 xAutomotive Technology (8)Aptiv PLC (NYSE:APTV) 87.5 % $14,435 9.9 % $2,240 15.5 % $27,076 1.9 x 12.1 x 10.8 xCDK Global, Inc. (NasdaqGS:CDK) 89.4 2,291 3.5 790 34.5 10,208 4.5 12.9 11.2Delphi Technologies PLC (NYSE:DLPH) 48.8 4,858 3.3 731 15.0 3,501 0.7 4.8 5.4DENSO Corporation (TSE:6902) 83.3 49,117 6.0 5,625 11.5 33,376 0.7 5.9 5.4MAM Software Group, Inc. (NasdaqCM:MAMS) 92.2 37 5.5 6 15.2 109 3.0 19.5 17.0NVIDIA Corporation (NasdaqGS:NVDA) 63.6 11,716 32.7 4,066 34.7 107,929 9.2 26.5 30.7Qiming Information Technology Co.,Ltd (SZSE:002232) 89.3 231 4.7 16 6.7 504 2.2 32.4 NAVisteon Corporation (NasdaqGS:VC) 59.1 2,984 (2.8) 300 10.1 2,270 0.8 7.6 7.8Median 85.4 % $3,921 5.1 % $761 15.1 % $6,854 2.0 x 12.5 x 10.8 xMean 76.7 % $10,709 7.9 % $1,722 17.9 % $23,122 2.9 x 15.2 x 12.6 x
Quarterly update | Q1 2019 | TMT
www.investmentbanking.deloitte.com | Page 9
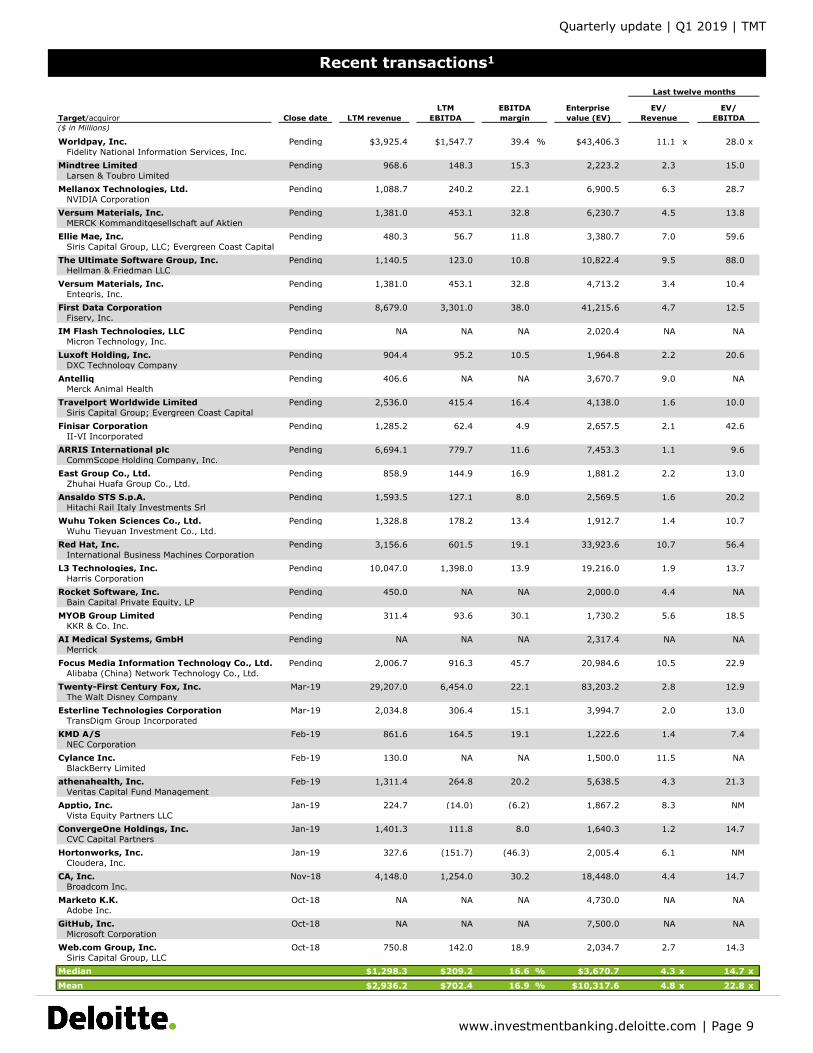
Recent transactions1
Last twelve months
Target/acquiror Close date LTM revenueLTM
EBITDAEBITDA margin
Enterprise value (EV)
EV/Revenue
EV/EBITDA
($ in Millions)
Worldpay, Inc. Pending $3,925.4 $1,547.7 39.4 % $43,406.3 11.1 x 28.0 xFidelity National Information Services, Inc.
Mindtree Limited Pending 968.6 148.3 15.3 2,223.2 2.3 15.0 Larsen & Toubro Limited
Mellanox Technologies, Ltd. Pending 1,088.7 240.2 22.1 6,900.5 6.3 28.7 NVIDIA Corporation
Versum Materials, Inc. Pending 1,381.0 453.1 32.8 6,230.7 4.5 13.8 MERCK Kommanditgesellschaft auf Aktien
Ellie Mae, Inc. Pending 480.3 56.7 11.8 3,380.7 7.0 59.6 Siris Capital Group, LLC; Evergreen Coast Capital
The Ultimate Software Group, Inc. Pending 1,140.5 123.0 10.8 10,822.4 9.5 88.0 Hellman & Friedman LLC
Versum Materials, Inc. Pending 1,381.0 453.1 32.8 4,713.2 3.4 10.4 Entegris, Inc.
First Data Corporation Pending 8,679.0 3,301.0 38.0 41,215.6 4.7 12.5 Fiserv, Inc.
IM Flash Technologies, LLC Pending NA NA NA 2,020.4 NA NAMicron Technology, Inc.
Luxoft Holding, Inc. Pending 904.4 95.2 10.5 1,964.8 2.2 20.6 DXC Technology Company
Antelliq Pending 406.6 NA NA 3,670.7 9.0 NAMerck Animal Health
Travelport Worldwide Limited Pending 2,536.0 415.4 16.4 4,138.0 1.6 10.0 Siris Capital Group; Evergreen Coast Capital
Finisar Corporation Pending 1,285.2 62.4 4.9 2,657.5 2.1 42.6 II-VI Incorporated
ARRIS International plc Pending 6,694.1 779.7 11.6 7,453.3 1.1 9.6 CommScope Holding Company, Inc.
East Group Co., Ltd. Pending 858.9 144.9 16.9 1,881.2 2.2 13.0 Zhuhai Huafa Group Co., Ltd.
Ansaldo STS S.p.A. Pending 1,593.5 127.1 8.0 2,569.5 1.6 20.2 Hitachi Rail Italy Investments Srl
Wuhu Token Sciences Co., Ltd. Pending 1,328.8 178.2 13.4 1,912.7 1.4 10.7Wuhu Tieyuan Investment Co., Ltd.
Red Hat, Inc. Pending 3,156.6 601.5 19.1 33,923.6 10.7 56.4 International Business Machines Corporation
L3 Technologies, Inc. Pending 10,047.0 1,398.0 13.9 19,216.0 1.9 13.7 Harris Corporation
Rocket Software, Inc. Pending 450.0 NA NA 2,000.0 4.4 NABain Capital Private Equity, LP
MYOB Group Limited Pending 311.4 93.6 30.1 1,730.2 5.6 18.5 KKR & Co. Inc.
AI Medical Systems, GmbH Pending NA NA NA 2,317.4 NA NAMerrick
Focus Media Information Technology Co., Ltd. Pending 2,006.7 916.3 45.7 20,984.6 10.5 22.9 Alibaba (China) Network Technology Co., Ltd.
Twenty-First Century Fox, Inc. Mar-19 29,207.0 6,454.0 22.1 83,203.2 2.8 12.9 The Walt Disney Company
Esterline Technologies Corporation Mar-19 2,034.8 306.4 15.1 3,994.7 2.0 13.0 TransDigm Group Incorporated
KMD A/S Feb-19 861.6 164.5 19.1 1,222.6 1.4 7.4 NEC Corporation
Cylance Inc. Feb-19 130.0 NA NA 1,500.0 11.5 NABlackBerry Limited
athenahealth, Inc. Feb-19 1,311.4 264.8 20.2 5,638.5 4.3 21.3 Veritas Capital Fund Management
Apptio, Inc. Jan-19 224.7 (14.0) (6.2) 1,867.2 8.3 NMVista Equity Partners LLC
ConvergeOne Holdings, Inc. Jan-19 1,401.3 111.8 8.0 1,640.3 1.2 14.7 CVC Capital Partners
Hortonworks, Inc. Jan-19 327.6 (151.7) (46.3) 2,005.4 6.1 NMCloudera, Inc.
CA, Inc. Nov-18 4,148.0 1,254.0 30.2 18,448.0 4.4 14.7 Broadcom Inc.
Marketo K.K. Oct-18 NA NA NA 4,730.0 NA NAAdobe Inc.
GitHub, Inc. Oct-18 NA NA NA 7,500.0 NA NAMicrosoft Corporation
Web.com Group, Inc. Oct-18 750.8 142.0 18.9 2,034.7 2.7 14.3 Siris Capital Group, LLC
Median $1,298.3 $209.2 16.6 % $3,670.7 4.3 x 14.7 x
Mean $2,936.2 $702.4 16.9 % $10,317.6 4.8 x 22.8 x
Quarterly update | Q1 2019 | TMT
www.investmentbanking.deloitte.com | Page 10
Select Deloitte Corporate Finance TMT group transactions
NWN Corporation
has been acquired by
New State Capital Partners, LLC
Deloitte Corporate Finance LLC
The undersigned acted as exclusive financial advisor to NWN Corporation.
NTT Communications Corporation
The undersigned acted as financial advisor toNTT Communications.
has acquired 70% of the issued shares of
Frontline System Austalia Pty Ltd
Deloitte Corporate Finance LLC
Information Builders, Inc.
The undersigned acted as exclusive financial advisor to Information Builders, Inc.
has received a minority investment from
Goldman, Sachs & Co.
Deloitte Corporate Finance LLC
has acquired
The undersigned rendered a fairness opinion to Meredith Corporation.
Allrecipes.com, Inc.from
The Reader’s Digest Association, Inc.
Meredith Corporation
Deloitte Corporate Finance LLC
has been acquired by
The undersigned acted as advisor toIPNet Solutions.
a portfolio company of
Golden Gate Capital
IPNet Solutions
Inovis
Deloitte Corporate Finance LLC
Deloitte Corporate Finance LLC Deloitte Corporate Finance LLC Deloitte Corporate Finance LLC
BlackBerry Limited
Volkswagen AG
has acquiredBochum, Germany Research and
Development Center of
The undersigned acted as exclusive advisor to BlackBerry Limited.
Deloitte Corporate Finance LLCDeloitte Tohmatsu Financial Advisory Co., Ltd.
EF Johnson Technologies, Inc.
has acquired
JVCKENWOOD Corporation
The undersigned acted as advisor to JVCKENWOOD Corporation.
Deloitte Corporate Finance LLC
Deloitte Corporate Finance LLC
Wipro Limited
has acquired
NerveWire, Inc.
The undersigned acted as advisor toWipro Limited.
Deloitte Corporate Finance LLC
Thompson Street Capital Partners
Global Software, Inc.has completed a majority
recapitalization with
The undersigned acted as exclusive financial advisor to Global Software, Inc.
Deloitte Corporate Finance LLC
Meritus Payment Solutions
Optimal Payments Plc
has acquired
The undersigned acted as financial advisor to Optimal Payments Plc.
SureID, Inc.
Deloitte Corporate Finance LLC
has completed a unitranche capital raise with
Goldman Sachs Specialty Lending Group
The undersigned acted as exclusive financial advisor to SureID, Inc.
Deloitte Corporate Finance LLC
The undersigned acted as exclusive financial advisor to EPS Financial, LLC and Drake
Enterprises, Ltd.
Meta Financial Group, Inc.
a subsidiary of
has sold its assets to
EPS Financial, LLC
Drake Enterprises, Ltd.
Deloitte Corporate Finance LLC
Deloitte Corporate Finance LLC
Med Management Technology LLC d/b/a
QuickMAR
has been acquired
Deloitte Corporate Finance LLC
The undersigned acted as exclusive financial advisor to Med Management
Technology LLC.
Pillar Technology Group LLChas obtained senior debt
financing from
General Information Services, Inc.
PNC Financial Services
Deloitte Corporate Finance LLC
The undersigned acted as financial advisor to General Information Services, Inc.
Identity Finder, LLC
Deloitte Corporate Finance LLC
has been acquired by
Inverness GrahamInvestments, Inc.
The undersigned acted as exclusive financial advisor to Identity Finder, LLC
has been acquired
Deloitte Corporate Finance LLCDeloitte Corporate Finance LLC
Global Merchant Advisors
Optimal Payments Plc
has acquired
The undersigned acted as financial advisor to Optimal Payments Plc.
The undersigned acted as exclusive financial advisor to Pillar Technology Group LLC.
Pillar Technology Group LLC
has completed arecapitalization with
NewSpring Capital
The undersigned acted as exclusive financial advisor to Pillar Technology Group LLC.
Foxconn Interconnect Technology, Ltd.
a subsidiary of
Hon Hai Precision Industry Co., Ltd.
Belkin International, Inc.
The undersigned acted as exclusivefinancial advisor to Foxconn Interconnect
Technology, Ltd.
The undersigned acted as exclusive financial advisor to Bulk TV & Internet
Deloitte Corporate Finance LLC
has completed a recapitalization with
Bulk TV & Internet
Marlin Equity Partners
Quarterly update | Q1 2019 | TMT
www.investmentbanking.deloitte.com | Page 11
Sources cited
Page 2:1. PR Newswire, Future of Global Digital Reality Market, https://www.prnewswire.com/news-releases/future-of-
global-digital-reality-market-forecast-to-2021---vr-application-in-the-manufacturing-sector-is-projected-to-increase-by-98-9-between-2017-and-2021--300716802.html, accessed April 8, 2019.
2. Gartner, Top 10 Strategic Technology Trends for 2019, https://www.gartner.com/smarterwithgartner/gartner-top-10-strategic-technology-trends-for-2019/, accessed April 8, 2019.
3. Deloitte Insights, Technology, media, and telecommunications predictions 2019, December 2018,https://www2.deloitte.com/content/dam/insights/us/articles/TMT-Predictions_2019/DI_TMT-predictions_2019.pdf, accessed January 10, 2019.
4. Deloitte Insights, 5G:The new network arrives, December 11, 2018,https://www2.deloitte.com/insights/us/en/industry/technology/technology-media-and-telecom-predictions/5g-wireless-technology-market.html, accessed April 8, 2019.
5. Mergermarket, https://www.mergermarket.com, accessed April 2019. Data as of March 31, 2019
Page 3:1. U.S. Bureau of Economic Analysis, accessed April 2019. Data as of March 31, 2019.2. U.S. Department of the Treasury, accessed April 2019. Data as of March 31, 2019.3. Bureau of Labor Statistics, accessed April 2019. Data as of March 31, 2019.4. S&P Capital IQ, https://www.capitaliq.com, accessed April 2019. Data as of March 31, 2019.5. IBISWorld, https://www.ibisworld.com, accessed April 2019. Data as of March 31, 2019.
Page 4:1. S&P Capital IQ, https://www.capitaliq.com, accessed April 2019. Data as of March 31, 2019.2. S&P Capital IQ, https://www.capitaliq.com, accessed April 2019. Data as of March 31, 2019.3. Technology Index comprised of companies within the Application Software/SaaS, IT Services, Hardware,
Automotive Technology, and Internet & Digital Media buckets on pages 7 and 8. Media Index comprised ofcompanies within the Traditional Media bucket on pages 7 and 8. Telecommunications Index comprised ofcompanies within the Telecommunications bucket on pages 7 and 8.
Page 5:1. Megan Rose Dickey, Uber files for IPO, https://techcrunch.com/2019/04/11/uber-files-for-ipo/, accessed April
2019.2. McDonald’s Corporation, McDonald’s to Acquire Dynamic Yield, Will Use Decision Technology to Increase
Personalization and Improve Customer Experience, https://news.mcdonalds.com/news-releases/news-release-details/dynamic-yield-acquisition-release, accessed April 2019.
3. NVIDIA Corporation, NVIDIA to Acquire Mellanox for $6.9 Billion, https://nvidianews.nvidia.com/news/nvidia-to-acquire-mellanox-for-6-9-billion, Accessed April 2019.
4. F5 Networks, Inc., F5 Acquires NGINX to Bridge NetOps & DevOps, Providing Customers with ConsistentApplication Services Across Every Environment, https://www.f5.com/company/news/press-releases/f5-acquires-nginx-to-bridge-netops-devops, accessed April 2019.
5. Fiserv, Fiserv to Combine with First Data Corporation to Create Global Leader in Payments and FinTech,https://newsroom.fiserv.com/index.php/news-releases/news-release-details/fiserv-combine-first-data-corporation-create-global-leader, accessed April 2019.
6. S&P Capital IQ, https://www.capitaliq.com, accessed April 2019. Data as of March 31, 2019.
Page 6:1. PitchBook Data, Inc., https://www.pitchbook.com, accessed April 2019. Data as of March 31, 2019.
Pages 7-9:1. S&P Capital IQ, https://www.capitaliq.com, accessed April 2019. Data as of March 31, 2019.
Quarterly update | Q1 2019 | TMT
www.investmentbanking.deloitte.com | Page 12
Phil Colaco, [email protected]+1 704 333 0533
Jonathan [email protected]+1 214 840 1779
Keith [email protected]+1 404 631 3455
Eric [email protected]+1 704 333 0518
Tony Blanchard [email protected]+1 313 396 3738
Doug [email protected]+1 704 731 7219
Hector [email protected]+1 404 631 3015
Nick [email protected]+1 212 436 3273
John [email protected]+1 704 333 0574
Lorin [email protected]+1 704 333 0591
Will [email protected]+1 312 486 4458
Mike [email protected]+1 213 996 4901
Simon [email protected]+1 212 436 2495
Bill [email protected]+1 980 312 3613
Jamie [email protected]+1 214 840 7057
James [email protected]+1 704 731 8230
Byron [email protected]+1 469 417 2462
Jonathan Ohm [email protected]+1 212 436 2287
Lou [email protected]+1 704 731 7202
Jason [email protected]+1 704 333 0136
Garett [email protected]+1 213 593 4544
Matt [email protected]+1 704 731 7186
Ron [email protected]+1 404 631 3710
Justin [email protected]+1 404 942 6960
Tom [email protected]+1 214 840 7014
Vijay [email protected]+1 212 313 1723
Charlie [email protected]+1 704 731 7201
Deloitte Corporate Finance LLC (DCF)
DCF provides deal execution and lead financial advisory services to large corporate, middle market, private equity and venture capital firms. DCF and its affiliates maintain a presence in key US financial centers. For additional information or to find out more about how DCF can assist the deal initiation and execution process, please contact one of our DCF managing directors:
Brad HestonSenior Vice President [email protected]+1 404 631 3839
Deloitte Corporate Finance Business Development Group:
www.investmentbanking.deloitte.com
John LindseySenior Vice [email protected]+1 469 417 2147
Bill PucciSenior Vice President [email protected]+1 973 602 4542
Quarterly update | Q1 2019 | TMT
www.investmentbanking.deloitte.com | Page 13
This newsletter is a periodic compilation of certain completed and announced merger and acquisition activity. Information contained in this newsletter should not be construed as a recommendation to sell or a recommendation to buy any security. Anyreference to or omission of any reference to any company in this newsletter shall not be construed as a recommendation to sell, buy or take any other action with respect to any security of any such company. We are not soliciting any action with respect to any security or company based on this newsletter. This newsletter is published solely for the general information of clients andfriends of Deloitte Corporate Finance LLC. It does not take into account the particular investment objectives, financial situation, or needs of individual recipients. Certain transactions, including those involving early stage companies, give rise to substantial risk and are not suitable for all investors. This newsletter is based on information that we consider reliable, but we do not represent that it is accurate or complete, and it should not be relied upon as such. Prediction of future events is inherently subject to both known risks, uncertainties and other factors that may cause actual results to vary materially. We are under no obligation to update the information contained in this newsletter. We and our affiliates and related entities, partners, principals, directors, and employees, including persons involved in the preparation or issuance of this newsletter, may from time to time have “long” and “short” positions in, and buy or sell, the securities, or derivatives (including options) thereof, of companies mentioned herein. The companies mentioned in this newsletter may be: (i) investment banking clients of Deloitte Corporate Finance LLC; or (ii) clients of Deloitte Financial Advisory Services LLP and its related entities. The decision to include any company for mention or discussion in this newsletter is wholly unrelated to any audit or other services that Deloitte Corporate Finance LLC may provide or to any audit services or any services that any of its affiliates or related entities may provide to such company. No part of this newsletter may be copied or duplicated in any form by any means, or redistributed without the prior written consent of Deloitte Corporate Finance LLC.
About DeloitteDeloitte Corporate Finance LLC (DCF), a broker-dealer registered with the U.S. Securities and Exchange Commission (SEC) and member of the Financial Industry Regulatory Authority (FINRA) and the Securities Investor Protection Corporation (SIPC), is an indirect wholly-owned subsidiary of Deloitte Financial Advisory Services LLP and affiliate of Deloitte Transactions and BusinessAnalytics LLP. Investment banking or other services that would require registration as a broker-dealer with the SEC and membership in FINRA would be provided exclusively by DCF. For more information, visit www.investmentbanking.deloitte.com. Please see www.deloitte.com/us/about for a detailed description of the legal structure of Deloitte LLP and its subsidiaries. Certain services may not be available to attest clients under the rules and regulations of public accounting.
Copyright © 2019 Deloitte Development LLC. All rights reserved.