technology acceptance among pre-service teachers: does
TRANSCRIPT
Australasian Journal of Educational Technology, 2015, 31(3). Technology acceptance among pre-service teachers: Does gender matter? Timothy Teo, Xitao Fan, Jianxia Du University of Macau
This study examined possible gender differences in pre-service teachers’ perceived acceptance of technology in their professional work under the framework of the technology acceptance model (TAM). Based on a sample of pre-service teachers, a series of progressively more stringent measurement invariance tests (configural, metric, and scalar invariances, as well as latent mean difference) were conducted. Practically, the findings revealed that, while the gender groups showed no statistical difference on perceived usefulness, attitudes toward technology, intention to use technology, female pre-service teachers had lower scores on perceived ease of use, suggesting that technology use is more challenging for female pre-service teachers than for their male counterparts. Technically, the findings provided support for full configural and metric invariance, and for partial scalar invariance. Discussions about the findings and their practical implications concerning teacher training are provided. Future research directions are also suggested.
Introduction In teacher education, the issue of integration of technology in education settings is gaining momentum (Deutsch, 2010), and more research is needed to better understand the extent to which technology integration in the classroom is effective and appropriate for enhancing teaching and learning (Davis & Davis, 2007). Research in this area needs to consider a broad range of factors, including the type of course, technology applications (such as hardware, software, ISP’s, etc.), pedagogical approaches, instructor characteristics, and student characteristics (Diaz & Bontenbal, 2000). One instructor/student characteristic that has received increasing attention is what role gender plays in technology acceptance in the classroom. The issue of gender difference in technology acceptance and use has received the attention of many researchers; as a result, numerous studies have been conducted to study the extent of this difference (Wong & Hanafi, 2007). The debate over the gender difference related to technology acceptance started in the 1980s, and it still persists today. Many researchers have revisited this issue and many are continuing to do so. There is a growing interest on the impact of possible gender differences in technology acceptance, which emphasises the study of gender and new technologies in education as an important research theme. Introduced by Davis, Bagozzi, and Warshaw (1989), the technology acceptance model (TAM) addressed the relevant issue of how users accept and use a technology in business settings. More recently, educational researchers (e.g., Teo, 2011; Teo, 2012; Teo & Wong, 2013) have extended TAM into education settings, investigating the issues in technology acceptance and use among school teachers. However, there remain many issues related to possible gender differences in the broad area of technology integration in the educational context (Ong & Lai, 2006). There have been studies investigating gender differences in technology acceptance and use as perceived by teachers. However, these studies were typically based on very limited or incomplete operationalisation of technology acceptance and/or use, and they usually only considered some limited aspects of technology use and acceptance (e.g., Mahmood & Swanberg, 2001). Consequently, there is a critical need to examine potential gender differences on the major dimensions of technology acceptance and use. By using a multi-group invariance modelling approach involving TAM, this study addresses gender issues of pre-service teachers’ acceptance and use of technology. The remainder of the article is divided into three sections. The first section presents a literature review on issues related possible gender differences in technology acceptance and use in education. The second section reports the empirical findings from a multi-group modelling analysis that examined potential gender difference on the major dimensions of technology acceptance model (TAM): usefulness, easy to use, attitude towards computer use, and behavioral intention to use technology. The third section discusses the implications of the findings with regard to gender groups of pre-service teachers.
235
Australasian Journal of Educational Technology, 2015, 31(3). Background Theoretical perspectives on technology integration in education Technology integration concepts have been discussed at great length in the literature, but gender issues influencing teachers’ technology integration in schools is of current interest to education researchers. As discussed by Earle (2002), wholeness is an important concept and criterion for technology integration. As viewed by Earle, when all of the components of the system are connected together, the system becomes a whole. As an example of this concept of wholeness, content and pedagogy, which are the key elements of teaching and learning, are joined when technology is integrated into an assignment. Simply offering websites or technology tools (e.g., a multimedia presentation) to students to view and learn on their own would not be considered as incorporating technology into an assignment. The teacher would need to use their creative pedagogical skills to integrate technology into the assignment. Similarly, Williams (2003) described the integration of technology as employing technology as an instructional tool to support learning and instruction, and technology integration became a reality when information and communication technology (ICT) have been incorporated into classroom instruction and learning activities. However, multiple factors, such as educational level and experience, school teacher’s gender and age, their experience with technology in educational settings, and their views and attitudes toward computing technology and its use, can influence the integration of technology into the classroom environment (Schiller, 2003). The issue of gender differences in the use of technology in the classroom has emerged in a number of research investigations. Research about teacher gender and technology use has alluded to the fact that female teachers tend to have less use of computers and/or technology in their pedagogy than their male counterparts, because of their more limited access to technology, their interest level, and their skill (Kay, 2006; Volman & van Eck, 2001;Wozney, Venkatesh, & Abrami, 2006). In a research study on technology literacy and technology experience, Markauskaite (2006) examined gender differences, and found noteworthy gender differences (in favour of the male group) in their ability to work with technology in assignments. Jamieson-Proctor, Burnett, Finger, and Watson (2006) revealed that male teachers were integrating technology into their teaching much more than the female teachers. For a better understanding about how gender issues may impact technology integration in schools, there is the need to understand potential gender differences on several important dimensions of technology acceptance: attitude, perceived usefulness, perceived ease of use, and intention for using technology. Attitude toward computing technology To successfully implement and integrate educational technology in school instruction depends, to a great extent, on the teachers’ attitudes (Venkatesh & Bala, 2008). These attitudes, whether positive or negative, can affect how teachers respond to technologies (Teo, Lee, & Chai, 2008). In the earlier years, computer attitude was the most frequently examined construct with respect to gender differences. This issue continues to be a research focus now. The findings in this area, however, have not been very conclusive, with some supporting the existence of gender difference (usually in favour of males), and others suggesting that the evidence for such gender difference was weak. On the one hand, Broos (2005) suggested significant gender differences – favouring males - in terms of attitudes toward new communication technology, and in terms of computer use and self-perceived computer experience. Moreover, as discussed by Colley and Comber (2003), and by Enoch and Soker (2006), gender groups did show some differences in terms of attitudes toward technology and technology use, and such gender difference in attitude about computer technology might be explained as an outcome of the socialisation process. On the other hand, however, Norris, Sullivan, Poirot, and Soloway (2003) discussed that some studies showed that gender had little or no bearing on the integration of technology in teaching and learning. Perceived usefulness Within TAM, perceived usefulness represents the degree to which a user believes that using technology will enhance his/ her work quality and performance (Davis, 1989). As discussed by Davis (1989), perceived usefulness was an important determinant for user acceptance. Together with perceived ease-of-
236
Australasian Journal of Educational Technology, 2015, 31(3). use, these two perceived variables influence attitudes toward using a technology and the intention to use technology. Eventually, intention to use technology would have effect on actual usage of technology (Yoon & Kim, 2007). There has been some research related to gender difference, or lack thereof, on perceived usefulness in different contexts. Venkatesh and Morris (2000) examined gender differences in the relationships among theoretically grounded determinants of technology acceptance and usage, and their findings showed that, in the process of a new technology being introduced in school, male teachers gave more consideration to perceived usefulness than female teachers for making decisions regarding the use of new technology. In a different context, Debrand and Johnson (2008) examined gender differences concerning the perceived usefulness of e-mail and instant messaging for social communications. The findings showed that women perceived e-mail and instant messaging to be more useful, and they spent more time communicating with others via e-mail and instant messaging than men. The limited empirical findings in this area suggest that gender differences, or lack thereof, related to perceived usefulness of technology may depend on the context in which the relevant technology will be used. For our purpose, potential gender difference in perceived usefulness related to technology use in school instructional settings is our focus. Perceived ease of use Perceived ease of use reflects a more widely used concept of computer competence, which could be understood as the ability to handle a wide range of computer applications for various purposes (Schiller, 2003). In the context of the present study, perceived ease of use refers to the degree to which the user expects the target system to be free from effort (Davis, 1989). That is, people tend to use technology more actively when they believe that it is easy to navigate and they are able to manage it. According to Saade and Kira (2007), perceived ease of use influences attitudes towards technology usage in classroom, and it is an important determinant of individuals’ intentions to use the technology. Bordbar (2010) discussed that teachers’ computer competence is a major predictor for integrating technology in teaching. Peralta and Costa (2007) and Buabeng-Andoh (2012) found that technical competence influenced teacher’s use of technology in teaching. Houtz and Gupta (2001) revealed gender differences in the way females and males rated themselves in their ability to master technology skills: even though both genders were positive about their technological ability, males rated themselves higher than females. But Kay (2006) showed that while male teachers had more advanced computer capability before computer implementation, after computer implementation, there was little or no difference between male and female teachers concerning computer capability and ability, leading to the claim that quality teacher preparation on technology could help reduce gender differences on this dimension. Behavioural intention to use technology Behavioural intention is the degree to which a person has formulated conscious plans to perform some specified future behaviour. A teachers’ behavioral intention to use education technology would facilitate his/her adoption and integration of technology into the teaching and learning processes (Teo, 2011). Compared with other aspects discussed above, the research on behavioural intention for using technology in teaching has been scarce, especially in relation to possible gender difference in this regard. The theory of reasoned action (TRA) suggests that attitudes predict intentions that, in turn, predict individual behaviours (Fishbein & Azjen, 1975). Drawing upon the TRA, Ahuja and Thatcher (2005) examined the influence of the work environment and gender on trying to innovate with information technology. However, instead of examining behavioural intentions, they examined how behaviour varied due to environmental or demographic differences by focusing on attitudes that would predict emergent information technology use. In short, the research on potential gender difference in behavioural intention to use technology in education has been scarce and inconclusive. Relationships among the constructs relevant to technology acceptance There have been some limited studies that examined possible gender differences in relation to the different aspects of technology acceptance and use. Macharia and Nyakwende (2011) studied gender differences in internet usage intentions, and their findings indicated that two antecedent constructs, perceived ease of internet and perceived usefulness, have direct influences on internet usage intentions. Yuen and Ma (2002) studied the issue of gender difference in teachers’ computer acceptance as
237
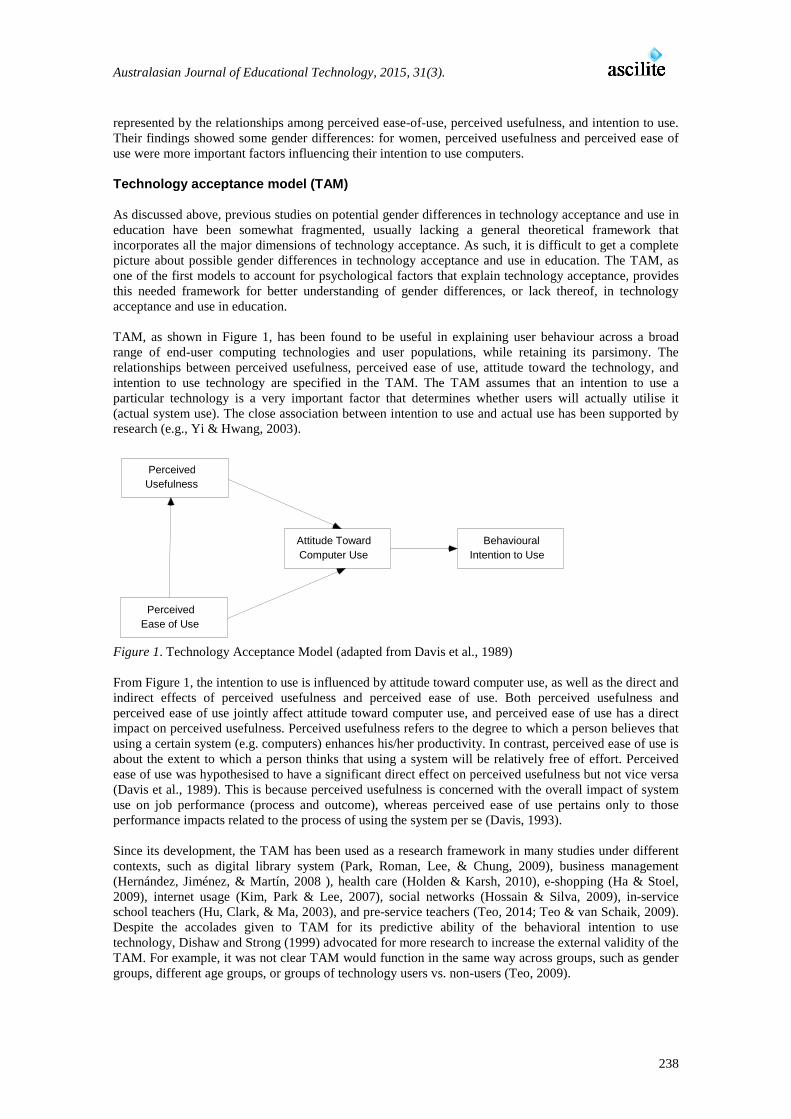
Australasian Journal of Educational Technology, 2015, 31(3). represented by the relationships among perceived ease-of-use, perceived usefulness, and intention to use. Their findings showed some gender differences: for women, perceived usefulness and perceived ease of use were more important factors influencing their intention to use computers. Technology acceptance model (TAM) As discussed above, previous studies on potential gender differences in technology acceptance and use in education have been somewhat fragmented, usually lacking a general theoretical framework that incorporates all the major dimensions of technology acceptance. As such, it is difficult to get a complete picture about possible gender differences in technology acceptance and use in education. The TAM, as one of the first models to account for psychological factors that explain technology acceptance, provides this needed framework for better understanding of gender differences, or lack thereof, in technology acceptance and use in education. TAM, as shown in Figure 1, has been found to be useful in explaining user behaviour across a broad range of end-user computing technologies and user populations, while retaining its parsimony. The relationships between perceived usefulness, perceived ease of use, attitude toward the technology, and intention to use technology are specified in the TAM. The TAM assumes that an intention to use a particular technology is a very important factor that determines whether users will actually utilise it (actual system use). The close association between intention to use and actual use has been supported by research (e.g., Yi & Hwang, 2003).
Figure 1. Technology Acceptance Model (adapted from Davis et al., 1989) From Figure 1, the intention to use is influenced by attitude toward computer use, as well as the direct and indirect effects of perceived usefulness and perceived ease of use. Both perceived usefulness and perceived ease of use jointly affect attitude toward computer use, and perceived ease of use has a direct impact on perceived usefulness. Perceived usefulness refers to the degree to which a person believes that using a certain system (e.g. computers) enhances his/her productivity. In contrast, perceived ease of use is about the extent to which a person thinks that using a system will be relatively free of effort. Perceived ease of use was hypothesised to have a significant direct effect on perceived usefulness but not vice versa (Davis et al., 1989). This is because perceived usefulness is concerned with the overall impact of system use on job performance (process and outcome), whereas perceived ease of use pertains only to those performance impacts related to the process of using the system per se (Davis, 1993). Since its development, the TAM has been used as a research framework in many studies under different contexts, such as digital library system (Park, Roman, Lee, & Chung, 2009), business management (Hernández, Jiménez, & Martín, 2008 ), health care (Holden & Karsh, 2010), e-shopping (Ha & Stoel, 2009), internet usage (Kim, Park & Lee, 2007), social networks (Hossain & Silva, 2009), in-service school teachers (Hu, Clark, & Ma, 2003), and pre-service teachers (Teo, 2014; Teo & van Schaik, 2009). Despite the accolades given to TAM for its predictive ability of the behavioral intention to use technology, Dishaw and Strong (1999) advocated for more research to increase the external validity of the TAM. For example, it was not clear TAM would function in the same way across groups, such as gender groups, different age groups, or groups of technology users vs. non-users (Teo, 2009).
Behavioural Intention to Use
Attitude Toward Computer Use
Perceived Usefulness
Perceived Ease of Use
238
Australasian Journal of Educational Technology, 2015, 31(3). As discussed previously, one major issue concerning technology acceptance research is the potential gender differences. For example, studies have indicated that males and females hold significant differences in their attitudes towards computers. This is a serious concern for modern society in general, because an increasing proportion of workforce will have to involve computing technology of various forms as part of their job or training (Vale & Leder, 2004). However, the use of technology is still portrayed to be more appropriate for males than females (Broos, 2005). Other studies also found that females respond to technology differently from males (e.g., Liaw, 2002). For example, compared to male teachers, female teachers may express less interest in technology and may place lower importance on technology in the teaching and learning process. On the other hand, male teachers tend to demonstrate greater interest in technology and a higher level of confidence in their ability to use technology. Consequently, there is a possibility that females may not enter careers that are related to technology despite no clear evidence to support the lack of opportunities for females in the computing industry (Anderson, Lankhear, Timms, & Courtney, 2008). When reacting to new technologies, Broos (2005) also found that males tend to respond with more enthusiasm and a more positive attitude towards technology than females, who generally are more cautious and take a longer time to warm up to a new technology. Aim of this study Numerous studies on the TAM have been conducted, however few have attempted to model possible gender differences in technology acceptance among prospective school teachers by using multi-group invariance analysis approach. Such an analytical approach has several notable advantages over the fragmented research studies discussed in the early sections of this paper. For example, this multi-group modelling analysis approach will provide the opportunity of examining possible gender differences in technology acceptance and use under a general theoretical framework, thus providing a more comprehensive analyses and insights on all the major dimensions of technology acceptance and use, instead of focusing on one or two dimensions only as in most previous studies. In addition, this multi-group invariance modelling approach will allow us to examine the potential gender differences in the relationship patterns of the constructs (e.g., Yuen & Ma, 2002) on the one hand, and the possible gender differences on each major construct in terms of gender groups’ response levels on the other. Despite the use of TAM to investigate group differences in other contexts, for example, Deng, Doll, Hendrickson, and Scazzera (2005) for software users, and Lai and Li (2005) for subgroups of internet banking users, few studies, if any, have examined the invariance of the TAM as applied to pre-service or in-service school teachers of gender groups. As discussed previously, for technology integration in school settings, such issues of technology acceptance and use are of primary importance. This study was intended to examine the measurement invariance and the latent mean differences of the TAM constructs across gender groups in a sample of educational users (pre-service teachers). Methods Steps in establishing measurement invariance Testing for measurement invariance typically proceeds with varying degrees of stringency. For example, invariance across groups may be tested for the general measurement structure (i.e., the number of factors), for the factor loadings, and for the structural relations among the latent variables, with these tests being progressively more stringent. After an extensive review of the measurement invariance literature, Vandenberg and Lance (2000) proposed a guideline with a more detailed list of increasingly more restrictive stages: configural invariance, metric invariance, and scalar invariance. Configural invariance The configural invariance is satisfied if the basic model structure (i.e., the pattern of fixed and non-fixed parameters) is invariant across groups. This initial baseline model has no between-group invariance constraints on the estimated parameters; hence different parameter values may exist across groups. Because it provides the basis for comparison with all subsequent models in the invariance testing hierarchy, the configural invariance model is of critical importance: if configural invariance is not supported by the data, neither will the data support the more restrictive models (Bollen, 1989).
239
Australasian Journal of Educational Technology, 2015, 31(3). Metric invariance When metric invariance is satisfied, the scores on the items/scales can be meaningfully compared across groups, and the observed group differences on the items/scales indicate group differences in the underlying latent construct (Steenkamp & Baumgartner, 1998). Metric invariance serves the purpose of allowing us to compare item/scale responses from different groups in a meaningful way (Steenkamp & Baumgartner, 1998; Hair, Black, Babin, Anderson, & Tatham, 2006). The model with metric invariance is more restrictive than the baseline model (configural invariance). Operationally, testing metric invariance is conducted by constraining the factor pattern coefficients (loadings) to be equal across groups, and the pattern coefficients contain the information about the relationship between a latent construct and its observed score. Scalar invariance Scalar invariance means that the amounts of a construct (i.e. mean) have the same meaning across the groups being considered. In practical terms, a score of 4.5 in one group would be equivalent as a 4.5 in another group. Statistically, scalar invariance exists when the intercept for each measured variable is invariant across the groups being studied. Operationally, scalar invariance is tested by constraining the intercepts of items/scales to be equal across groups. Failure to satisfy the scalar invariance condition is indicative of potential measurement problems (e.g. bias). Participants Participants were 339 pre-service teachers enrolled at a teacher training institute in a South-East Asian country. They were from different programs: 4 year Bachelor of Arts (with Education) (13.5%), 1 year Post Graduate Diploma in Education (Secondary) (80.5%), and 1 year Post Graduate Diploma in Education (Primary) (5.6%). Among the participants, 170 were females, and the mean age of the participants 28.5 years (SD = 4.23). Procedure Researchers visited various classes that took place in computer laboratories at the scheduled time. In each of these classes, participants were given the URL to access the online survey questionnaire used in this study. Before they began completing the questionnaire in the class, all participants were briefed on the purpose of this study, their rights to choose not to participate in the study, and the option for them to withdraw from the study during or after they had completed the questionnaire. In addition, a verbal reminder was given to emphasise that participants should approach all survey questions in relation to their education (learning). Participation in this study was voluntary and no course credit or financial benefits of any kind were given. On average, each participant took about 20 minutes to complete the questionnaire. Measures A questionnaire containing items for each of the four TAM constructs was used in this study. In addition to questions on demographics, 11 items to measure four TAM constructs were included (see Appendix). They were perceived usefulness (PU) (3items), perceived ease of use (PEU) (3 items), attitude towards computer use (ATCU) (3 items), and behavioral intention to use (BIU) (2 items). Participants responded to each item on a 5-point Likert scale, ranging from 1= strongly disagree to 5 = strongly agree. Model Evaluation Criteria In structural equation modelling (SEM), model fit is assessed by using multiple goodness-of-fit indices. Because the chi-square test is highly sensitive to sample size, a considerable number of descriptive model fit indices have been developed over the years (Fan, Thompson, & Wang, 1999). In this study, multiple fit indices were considered for the assessment of model fit between the hypothetical model and the sample data (Carmines & McIver, 1981). In addition, multiple fit indices were also considered when making comparisons to the baseline model. From the literature (e.g. Hu & Bentler, 1999) 1, values of .95 or higher for the CFI (Comparative Fit Index) and TLI (Tucker-Lewis Index), and values of .08 or less for RMSEA (Root Mean Square Error of Approximation) and SRMR (Standardised Root Mean Residual) are used as the approximate benchmark for good model fit. At each level of invariance test, if the null hypothesis of
1 However, for discussions that question the validity of such recommended values, please see Fan and Sivo (2005), and Marsh, Hau, and Wen (2004).
240
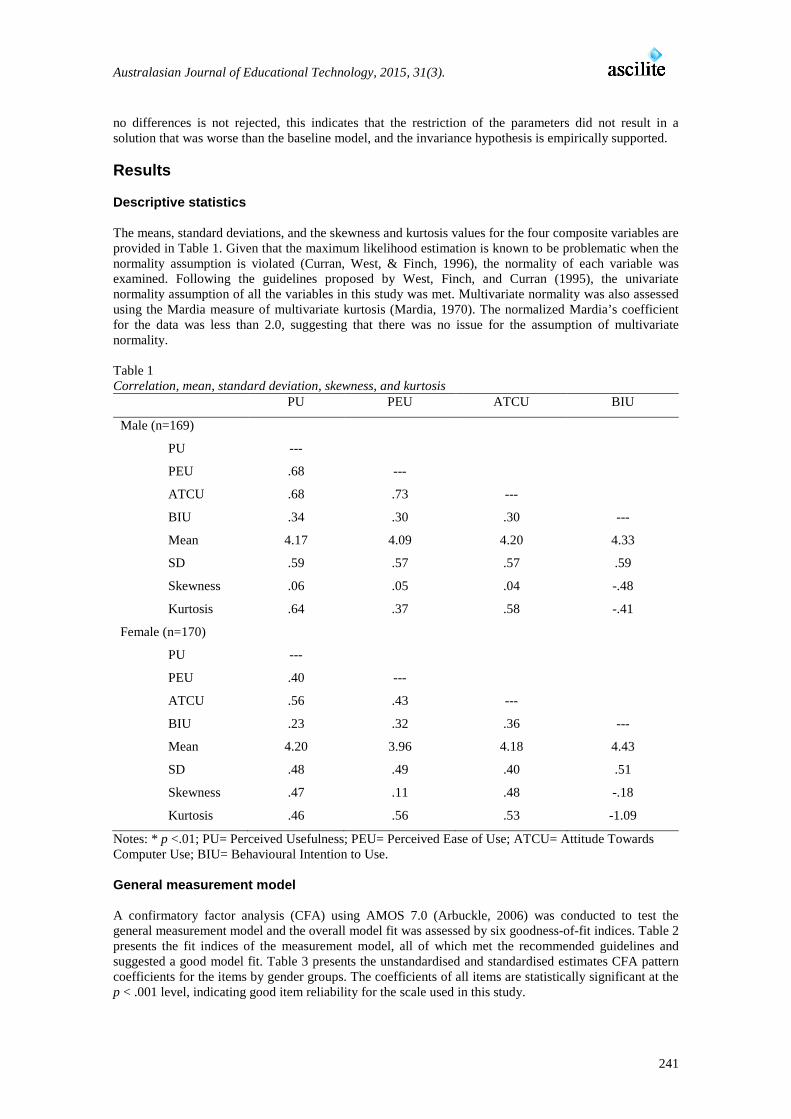
Australasian Journal of Educational Technology, 2015, 31(3). no differences is not rejected, this indicates that the restriction of the parameters did not result in a solution that was worse than the baseline model, and the invariance hypothesis is empirically supported. Results Descriptive statistics The means, standard deviations, and the skewness and kurtosis values for the four composite variables are provided in Table 1. Given that the maximum likelihood estimation is known to be problematic when the normality assumption is violated (Curran, West, & Finch, 1996), the normality of each variable was examined. Following the guidelines proposed by West, Finch, and Curran (1995), the univariate normality assumption of all the variables in this study was met. Multivariate normality was also assessed using the Mardia measure of multivariate kurtosis (Mardia, 1970). The normalized Mardia’s coefficient for the data was less than 2.0, suggesting that there was no issue for the assumption of multivariate normality. Table 1 Correlation, mean, standard deviation, skewness, and kurtosis
PU PEU ATCU BIU
Male (n=169)
PU ---
PEU .68 ---
ATCU .68 .73 ---
BIU .34 .30 .30 ---
Mean 4.17 4.09 4.20 4.33
SD .59 .57 .57 .59
Skewness .06 .05 .04 -.48
Kurtosis .64 .37 .58 -.41
Female (n=170)
PU ---
PEU .40 ---
ATCU .56 .43 ---
BIU .23 .32 .36 ---
Mean 4.20 3.96 4.18 4.43
SD .48 .49 .40 .51
Skewness .47 .11 .48 -.18
Kurtosis .46 .56 .53 -1.09
Notes: * p <.01; PU= Perceived Usefulness; PEU= Perceived Ease of Use; ATCU= Attitude Towards Computer Use; BIU= Behavioural Intention to Use. General measurement model A confirmatory factor analysis (CFA) using AMOS 7.0 (Arbuckle, 2006) was conducted to test the general measurement model and the overall model fit was assessed by six goodness-of-fit indices. Table 2 presents the fit indices of the measurement model, all of which met the recommended guidelines and suggested a good model fit. Table 3 presents the unstandardised and standardised estimates CFA pattern coefficients for the items by gender groups. The coefficients of all items are statistically significant at the p < .001 level, indicating good item reliability for the scale used in this study.
241
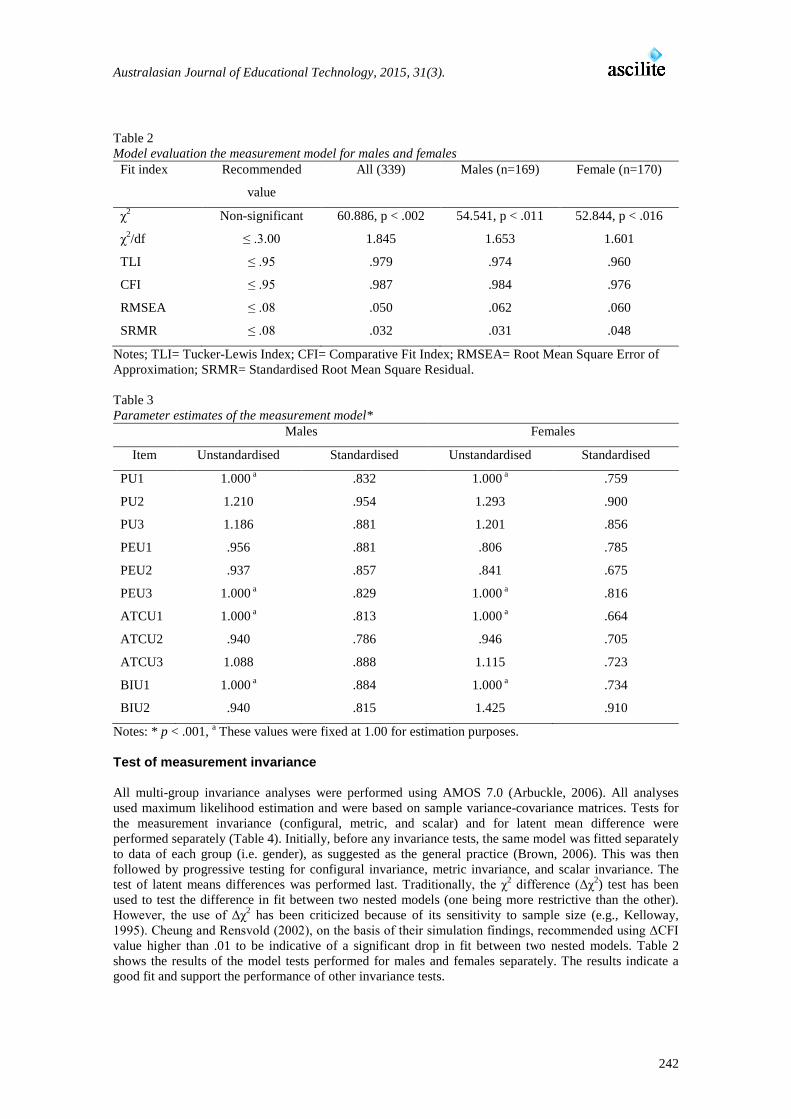
Australasian Journal of Educational Technology, 2015, 31(3). Table 2 Model evaluation the measurement model for males and females
Fit index Recommended
value
All (339) Males (n=169) Female (n=170)
χ2 Non-significant 60.886, p < .002 54.541, p < .011 52.844, p < .016
χ2/df ≤ .3.00 1.845 1.653 1.601
TLI ≤ .95 .979 .974 .960
CFI ≤ .95 .987 .984 .976
RMSEA ≤ .08 .050 .062 .060
SRMR ≤ .08 .032 .031 .048
Notes; TLI= Tucker-Lewis Index; CFI= Comparative Fit Index; RMSEA= Root Mean Square Error of Approximation; SRMR= Standardised Root Mean Square Residual. Table 3 Parameter estimates of the measurement model*
Males Females
Item Unstandardised Standardised Unstandardised Standardised
PU1 1.000 a .832 1.000 a .759
PU2 1.210 .954 1.293 .900
PU3 1.186 .881 1.201 .856
PEU1 .956 .881 .806 .785
PEU2 .937 .857 .841 .675
PEU3 1.000 a .829 1.000 a .816
ATCU1 1.000 a .813 1.000 a .664
ATCU2 .940 .786 .946 .705
ATCU3 1.088 .888 1.115 .723
BIU1 1.000 a .884 1.000 a .734
BIU2 .940 .815 1.425 .910
Notes: * p < .001, a These values were fixed at 1.00 for estimation purposes. Test of measurement invariance All multi-group invariance analyses were performed using AMOS 7.0 (Arbuckle, 2006). All analyses used maximum likelihood estimation and were based on sample variance-covariance matrices. Tests for the measurement invariance (configural, metric, and scalar) and for latent mean difference were performed separately (Table 4). Initially, before any invariance tests, the same model was fitted separately to data of each group (i.e. gender), as suggested as the general practice (Brown, 2006). This was then followed by progressive testing for configural invariance, metric invariance, and scalar invariance. The test of latent means differences was performed last. Traditionally, the χ2 difference (Δχ2) test has been used to test the difference in fit between two nested models (one being more restrictive than the other). However, the use of Δχ2 has been criticized because of its sensitivity to sample size (e.g., Kelloway, 1995). Cheung and Rensvold (2002), on the basis of their simulation findings, recommended using ΔCFI value higher than .01 to be indicative of a significant drop in fit between two nested models. Table 2 shows the results of the model tests performed for males and females separately. The results indicate a good fit and support the performance of other invariance tests.
242
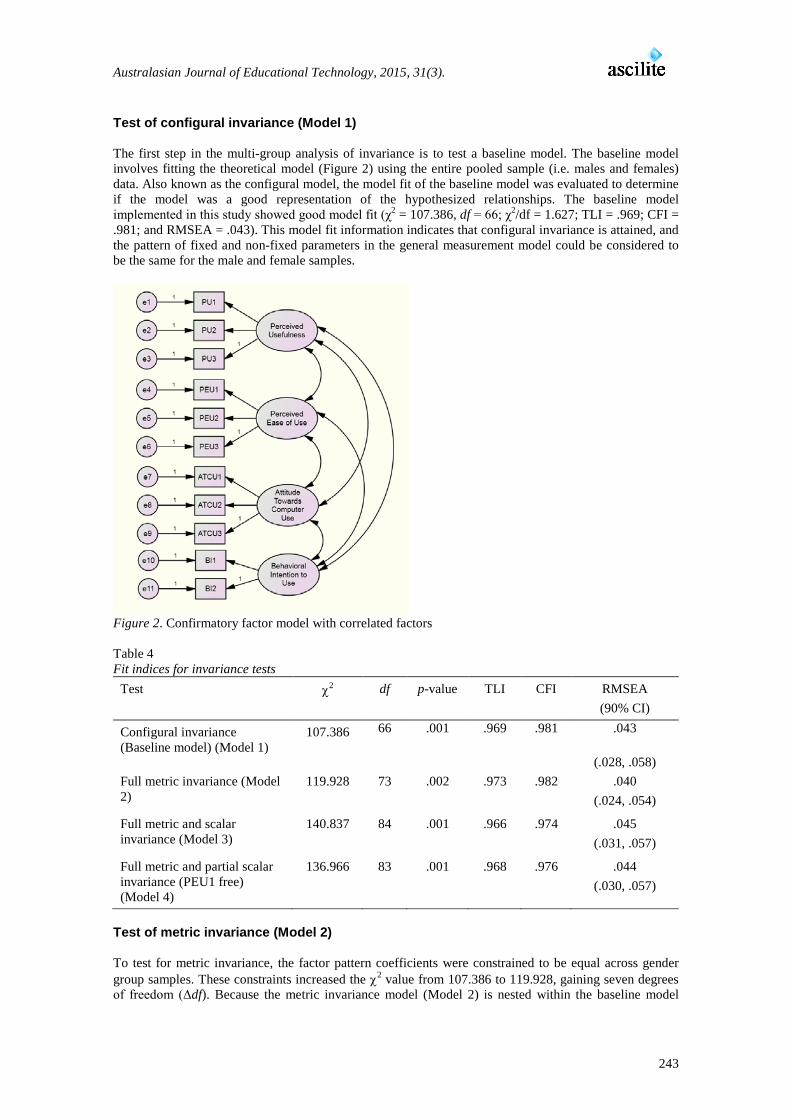
Australasian Journal of Educational Technology, 2015, 31(3). Test of configural invariance (Model 1) The first step in the multi-group analysis of invariance is to test a baseline model. The baseline model involves fitting the theoretical model (Figure 2) using the entire pooled sample (i.e. males and females) data. Also known as the configural model, the model fit of the baseline model was evaluated to determine if the model was a good representation of the hypothesized relationships. The baseline model implemented in this study showed good model fit (χ2 = 107.386, df = 66; χ2/df = 1.627; TLI = .969; CFI = .981; and RMSEA = .043). This model fit information indicates that configural invariance is attained, and the pattern of fixed and non-fixed parameters in the general measurement model could be considered to be the same for the male and female samples.
Figure 2. Confirmatory factor model with correlated factors Table 4 Fit indices for invariance tests
Test χ2 df p-value TLI CFI RMSEA (90% CI)
Configural invariance (Baseline model) (Model 1)
107.386 66 .001 .969 .981 .043
(.028, .058) Full metric invariance (Model 2)
119.928 73 .002 .973 .982 .040 (.024, .054)
Full metric and scalar invariance (Model 3)
140.837 84 .001 .966 .974 .045 (.031, .057)
Full metric and partial scalar invariance (PEU1 free) (Model 4)
136.966 83 .001 .968 .976 .044 (.030, .057)
Test of metric invariance (Model 2) To test for metric invariance, the factor pattern coefficients were constrained to be equal across gender group samples. These constraints increased the χ2 value from 107.386 to 119.928, gaining seven degrees of freedom (Δdf). Because the metric invariance model (Model 2) is nested within the baseline model
243
Australasian Journal of Educational Technology, 2015, 31(3). (Model 1: configural invariance model), a χ2 difference (Δχ2) test was performed. Given that the Δχ2 of 12.54 with Δdf = 7 was not statistically significant at α = .05, metric invariance was empirically supported (see Table 5). In addition to the Δχ2 test, other fit indices (TLI, CFI, and RMSEA) were also considered. With all the available evidence, metric invariance across the male and female samples was confirmed. Test of scalar invariance (Model 3) With the support for metric invariance (Table 5), scalar invariance was tested by constraining the intercepts of the 11 indicators to be the same across the two samples. A Δχ2 test was performed comparing the scalar invariance model (Model 3) against the metric invariance model (Model 2). Because the Δχ2 test (Δχ2 = 20.90, Δdf = 11) was statistically significant at α = .05, scalar invariance was not empirically supported (see Table 5). By constraining all the intercepts to be equal across the gender group samples, other fit indices (NNFI, CFI, and RMSEA) also deteriorated (Table 4). Partial scalar invariance (Model 4) To identify those indicators whose intercepts are not invariant, the strategy suggested by Byrne’s (2001) was followed. This involved testing all the items at the scale level. On finding non-invariance, the items are examined at the subscale level, and where evidence of non-invariance is found, the intercept will be examined at the item level. This process revealed that item PEU1 (first item on Perceived Ease of Use) had contributed to the significant increase in the χ2 value. Relaxing this constraint yielded substantial and statistically significant improvement in fit as compared to the full scalar invariance model. Following a suggestion by Byrne, Shavelson, and Muthen (1989) that there should at least two invariant items (including the item whose loading was fixed at 1.00 to define the scale of each latent construct) for each factor to meet the requirement of partial invariance, the constraint for the intercept of PEU1 was relaxed (Model 4). When Model 4 was evaluated against Model 2, using the χ2 difference test, the χ2 difference (17.04, with 10 degrees of freedom) was not statistically significant at α = .05, supporting the existence of a partial scalar invariance (see Table 5). Partial scalar invariance (Model 4) also yielded a substantial improvement in RMSEA and NNFI as compared to the full scalar invariance model (see Table 4). On the recommendations by Steenkamp and Baumgartner (1998) that full metric/scalar invariance is not necessary for further tests of invariance and substantive analysis (such as comparisons of factor means) could be performed, the test of latent mean differences was conducted on the basis of the partial scalar invariance. Table 5 Result of χ2 difference tests
Model Comparison Δdf Δχ2 p-value ΔCFI Decision
Test of full metric invariance Models 1 and 2
7 12.54 .08 .001 Accept
Test of full scalar invariance Models 2 and 3
11 20.90 .03 .008 Reject
Test of partial scalar invariance Models 2 and 4
10 17.04 .07 .006 Accept
Test of latent mean differences When analysing covariance structures, it is assumed that all observed variables are centered (i.e., variable means are all zero). As such, the intercept terms generally associated with the regression equations are not utilised in the analysis. However, when testing for differences in latent mean structures, the observed means take on non-zero values. In this case, the intercept must be taken into account (Bentler, 1995). In addition, because the observed variable means are functions of the other parameters in the model, the intercept term must be estimated jointly with all other parameters in the model (Byrne, 2001). For the purpose of achieving over identification of the factors (necessary condition for testing model fit), analysis of latent mean differences requires that the factor intercepts for one group be fixed to zero. The group
244
Australasian Journal of Educational Technology, 2015, 31(3). whose mean was constrained to a value of zero serves as the reference group against which the estimated mean of the comparison group will be compared. In the present study, the female group was used as the reference group and, as such, its factor means were constrained to zero. Table 6 shows the results of the test of latent mean differences. Of the four factors, gender difference on the factor of PEU was statistically significant (t=1.996, p <.05). More specifically, a higher mean value for males was reported for the PEU (.128). Although male group also showed higher mean on ATCU (.022), this difference is statistically non-significant. For PU and BIU, no significant mean difference was found for across the gender groups. Overall, latent mean invariance was found for the male and female samples for the PU, ATCU and BIU, but not for PEU. Table 6 Tests of latent means difference
Factor χ2 df TLI CFI RMSEA SRMR Difference
Estimate
t-value
PU 124.724 79 .971 .979 .041 .032 -.027 -.537
PEU .128 1.996*
ATCU .022 .418
BIU -.099 -1.728
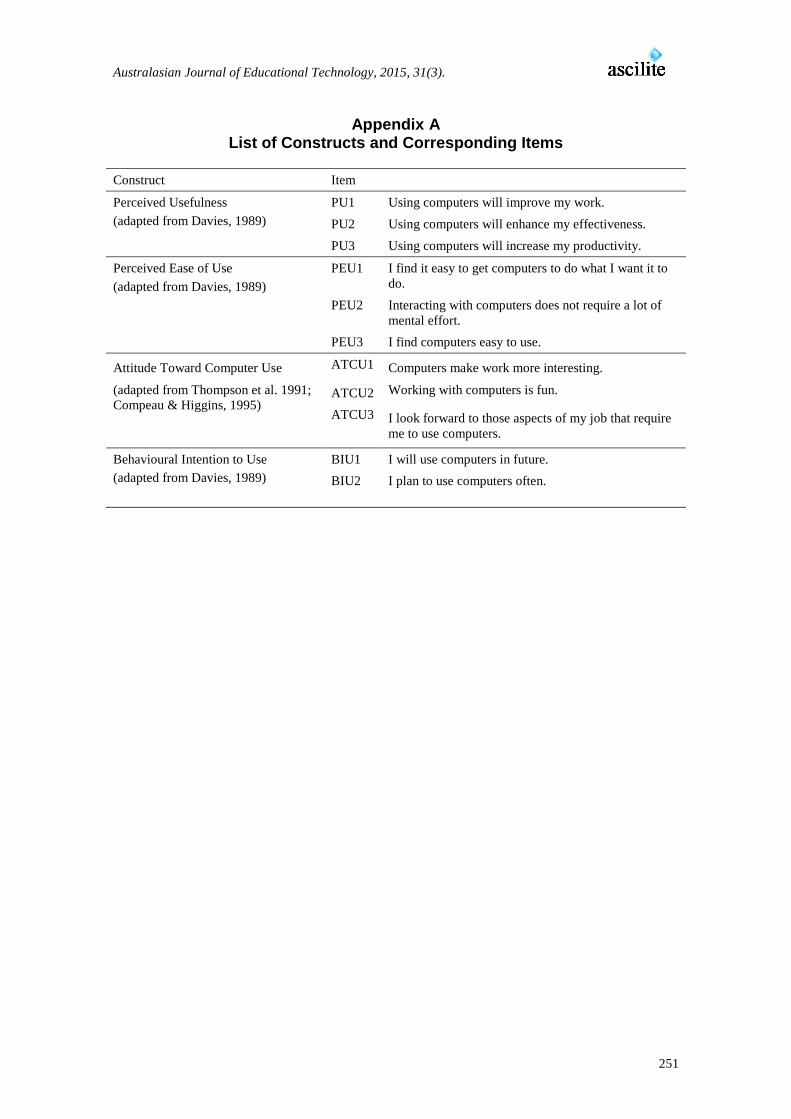
Notes: * p < .05; PU= Perceived Usefulness; PEU= Perceived Ease of Use; ATCU= Attitude Towards Computer Use; BIU= Behavioural Intention to Use Discussion and conclusion The aim of the present study was to examine possible gender group differences related to technology acceptance and use among pre-service teachers. This aim was accomplished by examining two issues: (1) to what degree the measurement aspects of the TAM (i.e. relationships among the constructs of PU, PEU, ATCU, and BIU, and the measurement scale comparability across the gender groups) were consistent across the gender groups; and (2) how the gender groups differed on the four dimensions of technology acceptance (PU, ATCU, BIU, and PEU). For the first issue concerning measurement consistency of TAM for gender groups, the findings first provided support for the most basic consistency condition, that is, the factor structure of the measurement was consistent across gender groups (i.e., configural invariance). The findings further supported that the scores on the items/scales of TAM model were statistically equivalent (i.e., metric invariance), thus making it possible to meaningfully compare the gender group scores on the items/scales of TAM model constructs. For the most stringent condition that a score of 4.5 from one group would be equivalent to the score of 4.5 from another group (i.e., scalar invariance: the amount of a construct as reflected by a score has the same meaning across the groups), the findings provided partial support. More specifically, gender group consistency was supported for all indicators on three constructs of TAM (PU, ATCU, BIU), but suggested that one item (PEU1) on the construct of PEU did not show equality across gender groups. For the second issue concerning gender group differences on the four dimensions (constructs) of the TAM model, the findings revealed that there was no statistical gender group difference on three TAM constructs: PU, ATCU and BIU. In other words, the responses from male and female sample members were statistically equal on these three constructs. This suggests that, male and female pre-service teachers have comparable perceptions about the usefulness of technology in education, hold similar attitude about technology use, and have similar intentions of using technology in education. On one construct of TAM, namely, the factor of PEU, female respondents had statistically lower level responses than their male counterparts, indicating that female pre-service teachers expected more difficulty, or more challenging, in using technology in education than the male pre-service teachers. PEU is fundamentally related to one’s computer competency. For pre-service teachers, this largely represents one’s real or perceived ability to handle computer applications in future instructional settings. As
245
Australasian Journal of Educational Technology, 2015, 31(3). discussed elsewhere (e.g., Buabeng-Andoh, 2012; Peralta & Costa, 2007), teachers’ computer competency could be one major predictor for integrating technology in instructional activities. Here, the findings that female pre-service teachers perceived it more difficult to use computing technology than their male counterparts were aligned with some previous findings in the literature (e.g., Houtz & Gupta, 2001). Computer competency could be an important factor/predictor for technology integration in instructional settings (Buabeng-Andoh, 2012), and consequently, female pre-service teachers’ lower level of such competency could be a hindrance for their enthusiasm for technology acceptance and technology integration in instructional settings. But as Kay (2006) discussed, despite some gender differences related to computer technology, quality teacher preparation on technology integration in education could help reduce gender differences on this dimension. It is thus important that this issue is on the agenda in teacher preparation programs, and measures are taken early in the teacher training programs to address this issue. In conclusion, a series of progressively more stringent multi-sample invariance analysis models (i.e., configural, metric, scalar invariance conditions) showed that the measurement of the constructs of the technology acceptance model (TAM) was largely consistent across the male and female per-service teachers used in this study, with only one minor statistical difference revealed in testing for scalar invariance on one indicator of one construct. These findings suggest that the measurement of TAM model constructs could be considered basically invariant across gender groups. While testing for gender group differences on the TAM model constructs, the male and female pre-service teachers showed no difference on three of the four constructs. However, there was a statistically significant difference in the way male and female pre-service teachers perceived computers to be easy or difficult to use. Since PEU use reflects a more widely used concept of computer competence, this computer competency is an important factor for measuring technology use in classroom. Consequently, compared to their male counterparts, female pre-service teachers have lower level of computer competency which could be a hindrance for their technology acceptance and technology use in teaching.This is a non-negligible gender difference, as this would have implications for technology integration in their future professional teaching career. This issue should be considered in the training provided in teacher preparation programs, so as to help reduce this gender difference. In addition to the substantive implications discussed above, this study may be of general methodological interest to researchers. The study has shown some of the advantages of applying the mean and covariance structure analysis approach to test the equivalence of a technology acceptance model across gender groups, and how these groups can be compared for latent mean scores. The mean and covariance structure analysis approach can also be used to examine other substantive issues in technology acceptance research, such as change in latent mean trait scores across time or settings. Given the methodological superiority of this approach over the more traditional approaches (e.g., exploratory factor analysis, t-test), it is hoped that this approach would become more widely used by researchers investigating substantive educational issues that involve different groups (e.g., gender, ethnic, proficiency levels, etc.). For future research, some other demographic characteristics of pre-service or in-service teachers could be considered in this line of research. Because technology integration in education is a recent phenomenon, and education-related technology also develops fast, it is plausible that technology acceptance and use could be influenced not only by gender, but also by age and educational level of teachers (pre-service and in-service). To aim for greater clarity in the survey questions, it may be useful to include words that serve to contextualise the meaning for the participants. This is despite the verbal and written reminders that would be provided to the participants. Some examples are “Using computers will enhance my effectiveness in learning” and “I will use computers in future for learning”. Future research may include these relevant demographic variables in the design, and may examine how such demographic characteristics could impact teachers’ acceptance of technology. With better understanding about these potentially relevant issues, we could do more in teacher training to overcome any potential hurdles for teacher’s technology acceptance and use. References Ahuja, M. K., & Thatcher, J. B. (2005). Moving beyond intentions and toward the theory of trying:
Effects of work environment and gender on post-adoption information technology use. MIS Quarterly, 29(3), 427–459.
246
Australasian Journal of Educational Technology, 2015, 31(3). Anderson, N., Lankhear, C., Timms, C., & Courtney, L. (2008). Because it’s boring, irrelevant and I don’t
like computers: Why high school girls avoid professionally-oriented ICT subjects. Computers & Education, 50, 1304–1318. doi.org/10.1016/j.compedu.2006.12.003
Arbuckle, J. L. (2006). AMOS (Version 7.0) [Computer Program]. Chicago, IL: SPSS. Bentler, P. M. (1995). EQS structural equations program manual. Encino, CA: Multivariate Software, Inc. Bollen, K. A. (1989). Structural equations with latent variables. New York, NY: John Wiley & Sons. Bordbar, F. (2010). English teachers’ attitudes toward computer-assisted language learning. International
Journal of Language Studies, 4(3), 27–54. Broos, A. (2005). Gender and information and communication technologies (IT) anxiety: Male self-
assurance and female hesitation. CyberPsychology & Behaviour, 8(1), 21–31. doi.org/10.1089/cpb.2005.8.21
Brown, T. (2006). Confirmatory factor analysis for applied research. New York, NY: Guildford Press. Buabeng-Andoh, C. (2012). Factors influencing teachers’ adoption and integration of information and
communication technology into teaching: A review of the literature. International Journal of Education and Development using Information and Communication Technology, 8(1), 136–155.
Byrne, B. M. (2001). Structural equation modeling with Amos: Basic concepts applications, and programming. Mahwah, NJ: Erlbaum.
Byrne, B. M., Shavelson, R. J., & Muthen, B. (1989). Testing for the equivalence of factor covariance and mean structures: The issue of partial measurement invariance. Psychological Bulletin, 105(3), 456–466.
Carmines, E. G., & McIver, J. P. (1981). Analyzing models with unobserved variables. In Bohrnstedt, G. W. & Borgatta, E. F. (Eds.), Social measurement: Current issues. Beverly Hills, CA: Sage.
Cheung, G. W., & Rensvold, R. B. (2002). Evaluating goodness-of-fit indexes for testing MI. Structural Equation Modeling, 9(2), 233–255.
Colley, A., & Comber, C. (2003). Age and gender differences in computer use and attitudes among secondary school students: What has changed? Educational Research, 45(2), 155-165. doi.org/10.1080/0013188032000103235Curran, P. J., West, S. G, & Finch, J. F. (1996). The robustness of test statistics to nonnormality and specification error in confirmatory factor analysis. Psychological Methods, 1(1), 16–29. doi.org/10.1037/1082-989X.1.1.16
Davis, F. D. (1989). Perceived usefulness, perceived ease of use, and user acceptance of information technology. MIS Quarterly, 13(3), 319–340. doi.org/10.2307/249008
Davis, F. D. (1993). User acceptance of information technology: System characteristics, user perceptions and behavioral impacts. International Journal of Man-Machine Studies, 38(3), 475–487. doi.org/10.1006/imms.1993.1022
Davis, F. D., Bagozzi, R. P., & Warshaw, P. R. (1989). User acceptance of computer technology: A comparison of two theoretical models. Management Science, 35(8), 982–1003. doi.org/10.1287/mnsc.35.8.982
Davis, J. L., & Davis, H. (2007). Perceptions of career and technology and training and development students regarding basic personal computer knowledge and skills. College Student Journal, 41(1), 69–79.
Debrand, C. C., & Johnson, J. J. (2008). Gender differences in email and instant messaging: A study of undergraduate business information systems students. Journal of Computer Information Systems, 48(3), 20–30.
Deng, X., Doll, W., Hendrickson, A., & Scazzero, J. (2005). A multi-group analysis of structural invariance: An illustration using the technology acceptance model. Information & Management, 42(5), 745–759. doi.org/10.1016/j.im.2004.08.001
Deutsch, N. (2010). Instructor experiences with implementing technology in blended learning courses in higher education. Seattle, WA: Createspace.
Diaz, D. P., & Bontenbal, K. F. (2000). Pedagogy-based technology training. In P. Hoffman, and D. Lemke (Eds.), Teaching and Learning in a Network World (pp. 50-54). Amsterdam, Netherlands: IOS Press.
Dishaw, M. T., & Strong, D. M. (1999). Extending the technology acceptance model with task-technology fit constructs. Information & Management, 36(1), 9–21. doi.org/10.1016/S0378-7206(98)00101-3
Earle, R.S. (2002). The integration of instructional technology into public education: Promises and challenges. ET Magazine, 42(1), 5–13.
Enoch, Y., & Soker, Z. (2006). Age, gender, ethnicity and the digital divide: University students’ use of web-based instruction. Open Learning, 21(2), 99–110. doi.org/10.1080/02680510600713045
247
Australasian Journal of Educational Technology, 2015, 31(3). Fan, X., & Sivo, S. A. (2005). Sensitivity of fit indices to misspecified structural or measurement model
components: Rationale of two-index strategy revisited. Structural Equation Modeling, 12(3), 343–367. doi.org/10.1207/s15328007sem1203_1
Fan, X., Thompson, B, & Wang, L. (1999). The effects of sample size, estimation methods, and model specification on SEM fit indices. Structural Equation Modeling, 6(1), 56–83. doi.org/10.1080/10705519909540119
Fishbein, M., & Ajzen, I. (1975). Belief, attitude, intention, and behavior: An introduction to theory and research. Reading, MA: Addison-Wesley.
Ha, S., & Stoel, L. (2009). Consumer e-shopping acceptance: Antecedents in a Technology Acceptance Model. Journal of Business Research, 62(5), 565–571. doi.org/10.1016/j.jbusres.2008.06.016
Hair, J. F. Jr., Black, W. C., Babin, B. J., Anderson, R. E., & Tatham, R. L. (2006). Multivariate data analysis (6th ed.). New Jersey, NJ: Prentice-Hall International.
Hernández, B., Jiménez, J., & Martín, M. J. (2008). Extending the Technology Acceptance Model to include the IT decision-maker: A study of business management software. Technovation, 28(3), 112–121.
Holden, R. J., & Karsh, B. (2010). The Technology Acceptance Model: Its past and its future in health care. Journal of Biomedical Informatics, 43(1), 159–172. doi.org/10.1016/j.jbi.2009.07.002
Hossain, L., & Silva, A. (2009). Exploring user acceptance of technology using social networks. The Journal of High Technology Management Research, 20(1), 1–18. doi.org/10.1016/j.hitech.2009.02.005
Houtz, L. E., & Gupta, U. G. (2001). Nebraska High School students’ computer skills and attitudes. Journal of Research on Computing in Education, 33(3),316–328.
Hu, L., & Bentler, P. M. (1999). Cutoff criteria for fit indexes in covariance structure analysis: Conventional criteria versus new alternatives. Structural Equation Modeling, 6(1), 1–55. doi.org/10.1080/10705519909540118
Hu, P. J., Clark, T. H. K., & Ma, W. W. (2003). Examining technology acceptance by school teachers: A longitudinal study. Information & Management, 41(2), 227–241. doi.org/10.1016/S0378-7206(03)00050-8
Jamieson-Proctor, R. M., Burnett, P. C., Finger, G., & Watson, G. (2006). ICT integration and teachers' confidence in using ICT for teaching and learning in Queensland state schools. Australasian Journal of Educational Technology, 22(), 511–530.
Kay, R. (2006). Addressing gender differences in computer ability, attitudes and use: The laptop effect. Journal of Educational Computing Research, 34(2), 187–211. doi.org/10.2190/9BLQ-883Y-XQMA-FCAH
Kelloway, E. K. (1995). Structural equation modeling in perspective. Journal of Organizational Behavior, 16, 215–24. doi.org/10.1002/job.4030160304
Kim, B. G., Park, S. C., & Lee, K. J. (2007). A structural equation modeling of the Internet acceptance in Korea. Electronic Commerce Research and Applications, 6(4), 425–432. doi.org/10.1016/j.elerap.2006.08.005
Lai, V. S., &Li, H. L. (2005). Technology acceptance model for internet banking: An invariance analysis. Information & Management, 42(2), 373–386. doi.org/10.1016/j.im.2004.01.007
Liaw, S. S. (2002). Understanding user perceptions of world-wide web environments. Journal of Computer Assisted Learning, 18(2), 137–148. doi.org/10.1046/j.0266-4909.2001.00221.x
Macharia, J., & Nyakwende, E. (2011). Gender differences in internet usage intentions for learning in higher education: An empirical study. Journal of Language, Technology Entrepreneurship in Africa, 3(1), 244–254.
Mahmood, M. A., & Swanberg, D. L. (2001). Factors affecting information technology usage: A meta-analysis of the empirical literature. Journal of Organizational Computing, 11(2), 107–130. doi.org/10.1207/S15327744JOCE1102_02
Mardia, K. V. (1970). Measures of multivariate skewness and kurtosis with applications. Biometrika, 57(3), 519–530.
Markauskaite, L. (2006). Gender issues in preservice teachers' training: ICT literacy and online learning. Australasian Journal of Educational Technology, 22(1), 1–20.
Marsh, H. W., Hau, K. T., & Wen, Z. (2004). In search of golden rules: Comment on hypothesis-testing approaches to setting cutoff values for fit indexes and dangers in overgeneralizing Hu and Bentler’s (1999) findings. Structural Equation Modeling, 11(3), 320–341. doi.org/10.1207/s15328007sem1103_2
248

Australasian Journal of Educational Technology, 2015, 31(3). Norris, C., T., Sullivan, J., Poirot., & Soloway, E. (2003). No access, no use, no impact: Snapshot surveys
of educational technology in K-12, Journal of Research on Technology in Education, 36(1), 15–27. doi.org/10.1080/15391523.2003.10782400
Ong, C-S., & Lai, J-Y. (2006). Gender differences in perceptions and relationships among dominants of e-learning acceptance. Computers in Human Behavior, 22(5), 816–829. doi.org/10.1016/j.chb.2004.03.006
Park, N., Roman, R., Lee, S., & Chung, J. E. (2009). User acceptance of a digital library system in developing countries: An application of the technology acceptance model. International Journal of Information Management, 29, 196–209. doi.org/10.1016/j.ijinfomgt.2008.07.001
Peralta, H., & Costa, F.A. (2007). Teachers’ competence and confidence regarding the use of ICT. Educational Sciences Journal, 3, 75–84.
Saade, R., & Kira, D. (2007). Mediating the impact of technology usage on perceived ease of use by anxiety. Computers & Education, 49, 1189–1204.
Schiller, J. (2003). Working with ICT: Perceptions of Australian principals, Journal of Educational Administration, 41, 171–185. doi.org/10.1108/09578230310464675
Steenkamp, J. E., & Baumgartner, H. (1998). Assessing MI in cross-national consumer research. Journal of Consumer Research, 25, 78–90. doi.org/10.1086/209528
Teo, T. (2009). Modelling technology acceptance in education: A study of pre-service teachers. Computers & Education, 52(1), 302–312. doi.org/10.1016/j.compedu.2008.08.006
Teo, T. (2011). Factors influencing teachers' intention to use technology: Model development and test. Computers & Education, 57, 2432–2440.
Teo, T. (2012). Examining the intention to use technology among pre-service teachers: An integration of the Technology Acceptance Model (TAM) and Theory of Planned Behavior (TPB). Interactive Learning Environments, 20(1), 3–18. doi.org/10.1016/j.compedu.2011.06.008
Teo, T. (2014). Unpacking teachers' acceptance of technology: Tests of measurement invariance and latent mean differences. Computers & Education, 75, 127–135. doi.org/10.1016/j.compedu.2014.01.014
Teo, T., & Wong, S. L. (2013). Modeling key drivers of e-learning satisfaction among student teachers. Journal of Educational Computing Research, 48(1), 71–95. doi.org/10.2190/ec.48.1.d
Teo, T., & Schaik, P. van (2009). Understanding technology acceptance among pre-service teachers: a structural-equation modeling approach. Asia-Pacific Education Researcher, 18(1), 47–66. doi.org/10.3860/taper.v18i1.1035
Teo, T., Lee, C. B., & Chai, C. S. (2008). Understanding pre-service teachers' computer attitudes: Applying and extending the Technology Acceptance Model. Journal of Computer Assisted Learning, 24(2), 128–143. doi.org/10.1111/j.1365-2729.2007.00247.x
Vale, C. M., & Leder, G. C. (2004). Students’ views of computer-based Mathematics in the middle years: Does gender make a difference? Education Studies in Mathematics, 56(3), 287–312. doi.org/10.1023/B:EDUC.0000040411.94890.56
Vandenberg, R. J., & Lance, C. E. (2000). A review and synthesis of the MI literature: Suggestions, practices, and recommendations for organizational research. Organizational Research Methods, 3(1), 4–69. doi.org/10.1177/109442810031002
Venkatesh, V., & Bala, H. (2008), Technology acceptance model 3 and a research agenda on interventions. Decision Sciences, 39, 273–315. doi.org/10.1111/j.1540-5915.2008.00192.x
Venkatesh, V., & Morris, M. G. (2000). Why don't men ever stop to ask for directions? Gender, social influence, and their role in technology acceptance and usage behavior. MIS Quarterly, 24, 115–139. doi.org/10.2307/3250981
Volman M., & van Eck, E. (2001). Gender equity and information technology in education: The second decade. Review of Educational Research, 71, 613–634. doi.org/10.3102/00346543071004613
West, S. G., Finch, J. F., & Curran, P. J. (1995). Structural equation models with non-normal variables: Problems and remedies. In R. Hoyle (Ed.), Structural equation modeling: Concepts, issues, and applications (pp. 56–75). Thousand Oaks, CA: Sage.
Williams, M. D. (2003). Technology integration in education. In Tan, S. C. & Wong, F. L. (Eds.), Teaching and Learning with Technology: An Asia-pacific perspective (pp. 17–31). Singapore: Prentice Hall.
Wong, S. L., & Hanafi, A. (2007). Gender differences in attitudes towards information technology among Malaysian student teachers: A case study at Universiti Putra Malaysia. Educational Technology & Society, 10, 158–169.
249
Australasian Journal of Educational Technology, 2015, 31(3). Wozney, L., Venkatesh, V., & Abrami, P. C. (2006). Implementing computer technologies: Teachers'
perceptions and practices. Journal of Technology and Teacher Education, 14, 173–207. Yi, M. Y., & Hwang, Y. (2003). Predicting the use of web-based information systems: Self-efficacy,
enjoyment, learning goal orientation, and the Technology Acceptance Model. International Journal of Human-Computer Studies, 59, 431–449. doi.org/10.1016/S1071-5819(03)00114-9
Yoon, C., & Kim, S. (2007). Convenience and TAM in a ubiquitous computing environment: The case of wireless LAN. Electronic Commerce Research and Applications, 6, 102–112. doi.org/10.1016/j.elerap.2006.06.009
Yuen, A. H. K., & Ma, W. W. K. (2002). Gender differences in teacher computer acceptance. Journal of Technology and Teacher Education, 10, 365–382. Corresponding author: Timothy Teo, [email protected] Australasian Journal of Educational Technology © 2015. Please cite as: Teo, T., Fan, X., & Du, J. (2015). Technology acceptance among pre-service teachers:
Does gender matter? Australasian Journal of Educational Technology, 31(3), 235-251.
250
Australasian Journal of Educational Technology, 2015, 31(3).
Appendix A List of Constructs and Corresponding Items
Construct Item
Perceived Usefulness (adapted from Davies, 1989)
PU1 Using computers will improve my work. PU2 Using computers will enhance my effectiveness. PU3 Using computers will increase my productivity.
Perceived Ease of Use (adapted from Davies, 1989)
PEU1 I find it easy to get computers to do what I want it to do.
PEU2 Interacting with computers does not require a lot of mental effort.
PEU3 I find computers easy to use.
Attitude Toward Computer Use
(adapted from Thompson et al. 1991; Compeau & Higgins, 1995)
ATCU1 Computers make work more interesting.
ATCU2 Working with computers is fun.
ATCU3 I look forward to those aspects of my job that require me to use computers.
Behavioural Intention to Use (adapted from Davies, 1989)
BIU1 I will use computers in future. BIU2 I plan to use computers often.
251