technical seminar series - institute for manufacturing seminar series leila sheldrick loughborough...
TRANSCRIPT
EPSRC Centre for INDUSTRIAL SUSTAINABILITY
Technical Seminar Series
Leila Sheldrick LOUGHBOROUGH UNIVERSITY
Ubiquitous Sustainability: Embedding Sustainability Throughout Product Design Processes
15:00-16:00 17 November 2015

EPSRC Centre for INDUSTRIAL SUSTAINABILITY
Page 2
Today: We will explore the strategic improvement of sustainable design practice, and learn about how a company can tailor their approach towards embedding sustainability within established processes. Next: 16.00 3rd December “Eco-Intelligent process monitoring”, Loughborough University Future months: much more to follow!! … and it could be you… Typically first Thursday of the month
Technical webinar series – schedule 17 NOVEMBER 2015
We will record this webinar and issue the recording afterwards
Slides will also be made available
Please use chat to raise questions throughout the presentations
Questions after this presentation finishes? Please contact:
Leila Sheldrick

EPSRC Centre for INDUSTRIAL SUSTAINABILITY
Page 3
Sharing research results and industrial practice for Centre members
Connecting people within the Centre as well as outside the Centre
Providing feedback, comments, suggestions, refinement, etc to those presenting
Technical webinar series – the aims 8 OCTOBER 2015
If you have interesting content to share from research and development, good practice, valuable results in practice, etc then perhaps you should be scheduled in the series?
Contact Sharon Mey cis-admin@ eng.cam.ac.uk
or Peter Ball, [email protected]
EPSRC Centre for INDUSTRIAL SUSTAINABILITY
Page 4
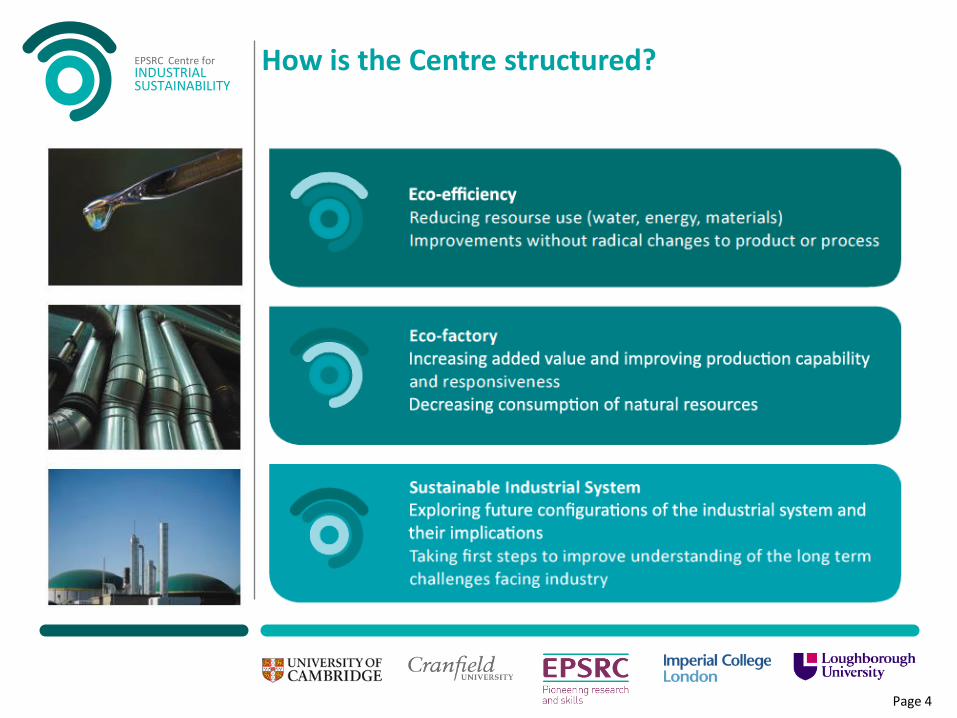
How is the Centre structured?
EPSRC Centre for INDUSTRIAL SUSTAINABILITY
Page 5
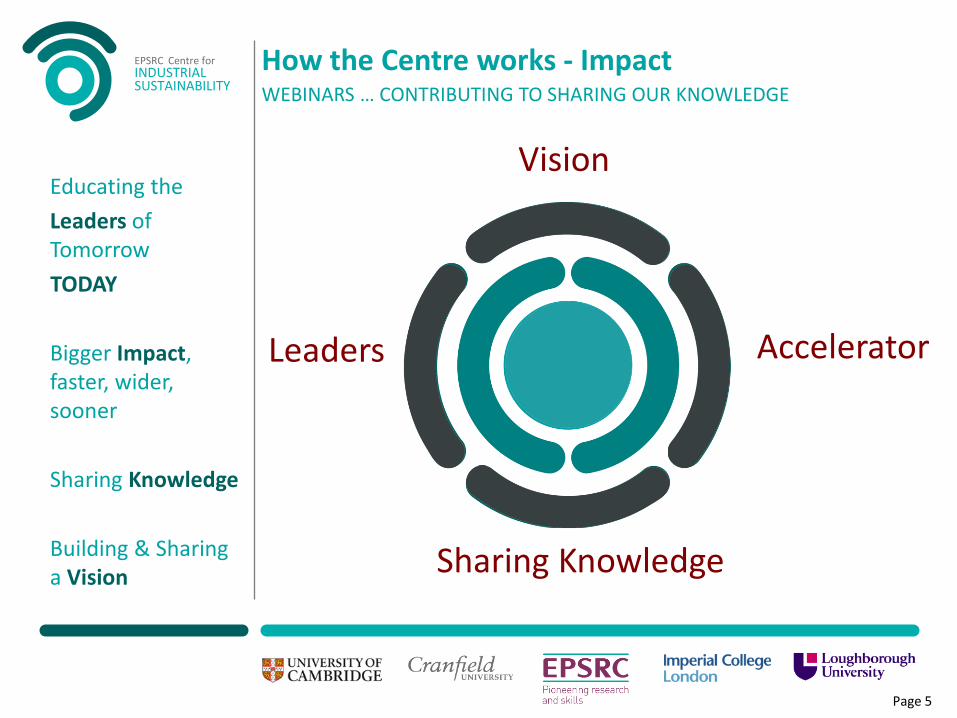
How the Centre works - Impact
Educating the
Leaders of Tomorrow
TODAY
Bigger Impact, faster, wider, sooner
Sharing Knowledge
Building & Sharing a Vision
Vision
Leaders Accelerator
Sharing Knowledge
WEBINARS … CONTRIBUTING TO SHARING OUR KNOWLEDGE

EPSRC Centre for INDUSTRIAL SUSTAINABILITY
Page 6
15.00 Introduction (Peter)
15.10 Ubiquitous Sustainability: Embedding Sustainability Throughout Product Design Processes (Leila)
15.30 Q&A (Leila)
15.40 Wrap up (Peter)
15.45 Close
Eco-Factory Grand Challenge: Improving Design Practice for Manufacturers 17 NOVEMBER 2015
Questions after this presentation finishes? Please contact
Leila Sheldrick

EPSRC Centre for INDUSTRIAL SUSTAINABILITY
Leila Sheldrick Lecturer in Product Design Engineering LOUGHBOROUGH UNIVERSITY (until January 2016) IMPERIAL COLLEGE (from February 2016 onwards)
Ubiquitous Sustainability: Embedding Sustainability Throughout Product Design Processes

EPSRC Centre for INDUSTRIAL SUSTAINABILITY
Page 8
1. Project Background
2. Improving Sustainable Design
3. The DfUS (Design for Ubiquitous Sustainability) Framework
Ubiquitous Sustainability EMBEDDING SUSTAINABILITY THROUGHOUT DESIGN PROCESSES
EPSRC Centre for INDUSTRIAL SUSTAINABILITY
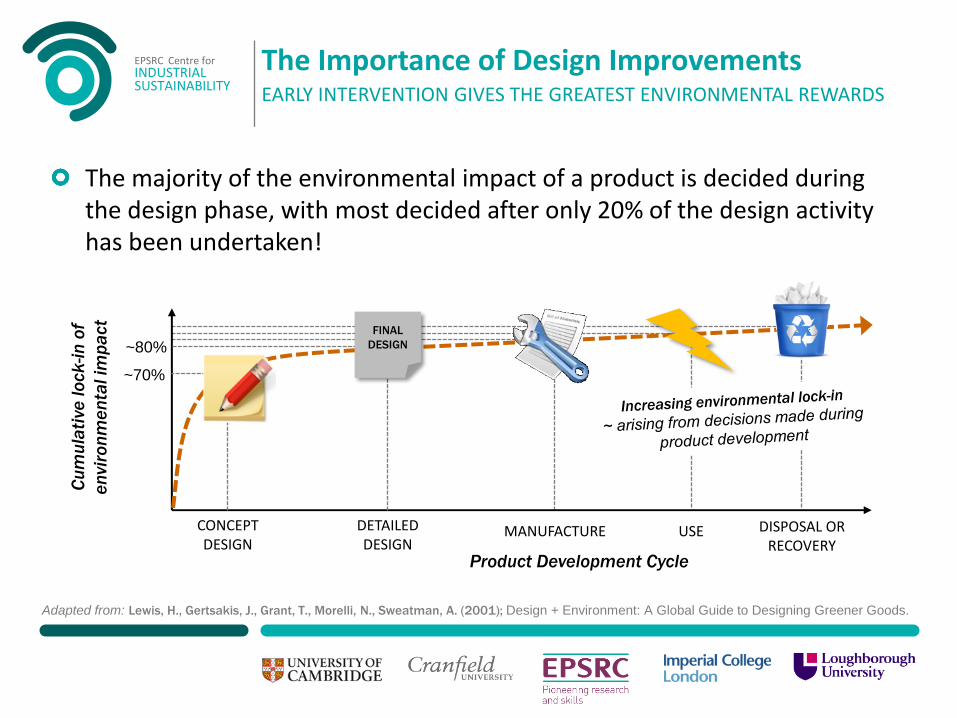
The majority of the environmental impact of a product is decided during the design phase, with most decided after only 20% of the design activity has been undertaken!
The Importance of Design Improvements EARLY INTERVENTION GIVES THE GREATEST ENVIRONMENTAL REWARDS
Product Development Cycle
Cu
mu
lati
ve lo
ck
-in
of
en
vir
on
me
nta
l im
pa
ct
FINAL
DESIGN
MANUFACTURE USE DISPOSAL OR RECOVERY
DETAILED DESIGN
CONCEPT DESIGN
~70%
~80%
Adapted from: Lewis, H., Gertsakis, J., Grant, T., Morelli, N., Sweatman, A. (2001); Design + Environment: A Global Guide to Designing Greener Goods.
EPSRC Centre for INDUSTRIAL SUSTAINABILITY
Page 10
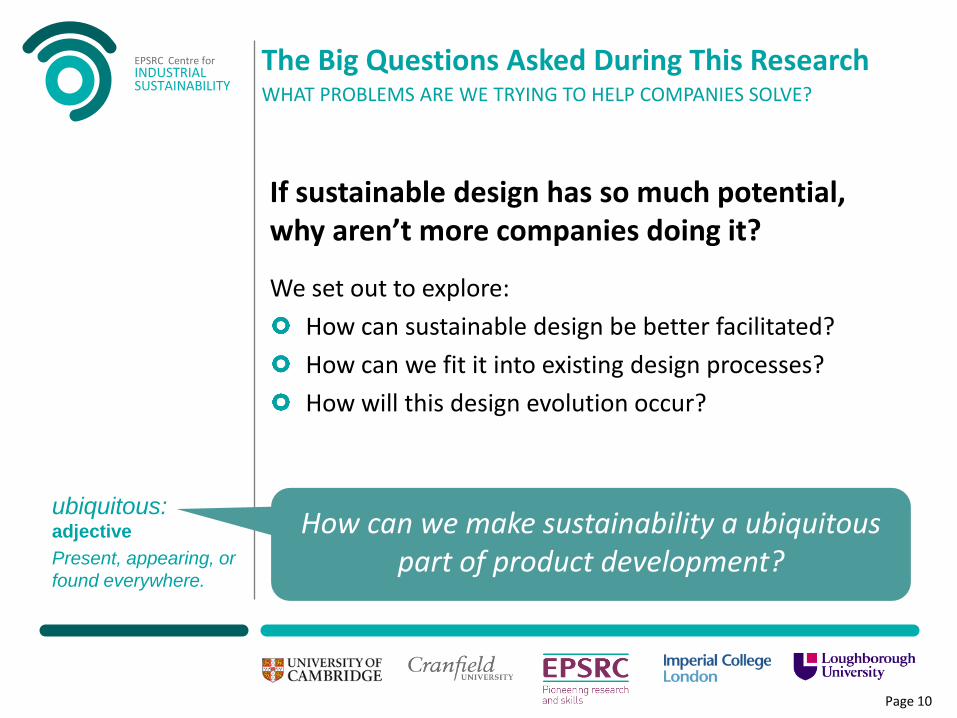
If sustainable design has so much potential, why aren’t more companies doing it?
We set out to explore:
How can sustainable design be better facilitated?
How can we fit it into existing design processes?
How will this design evolution occur?
The Big Questions Asked During This Research WHAT PROBLEMS ARE WE TRYING TO HELP COMPANIES SOLVE?
ubiquitous: adjective
Present, appearing, or
found everywhere.
How can we make sustainability a ubiquitous part of product development?

EPSRC Centre for INDUSTRIAL SUSTAINABILITY
Page 11
They help move beyond incremental changes in
efficiency – towards racial, system level improvements. They are a catalyst for raising awareness of sustainability challenges across the business.
They increase competitiveness in the face of changing markets, and improve customer perception, leading to stronger links with all stakeholders.
They help companies get ahead of new regulations and legislations.
Why are Design Changes so Critical? INCENTIVES AND DRIVERS FOR SUSTAINABLE DESIGN

EPSRC Centre for INDUSTRIAL SUSTAINABILITY
Many sustainable design tools and approaches exist, but have varying success in application:
Success and Failure in Sustainable Design CRITICAL FACTORS INFLUENCING ADOPTION OF SUSTAINABILITY
• Awareness of sustainability
issues within companies is often
limited!
• Organisational complexities, and
challenges with internal
communication and cooperation.
• Regulations restricting
innovation and driving
reactionary solutions.
STUMBLING BLOCKS
SUCCESS FACTORS
• Well established and controlled design processes, and capable designers!
• When the project supports wider business requirements, and is driven by legislation or customer demand.
• When sustainable design tools and methods are customised to the specific needs of the company.

EPSRC Centre for INDUSTRIAL SUSTAINABILITY
Page 13
The improvement of the design process so that SD is not an afterthought, but is incorporated centrally throughout the design process from its outset.
The improvement of SD implementation methods within a company’s product development process, particularly in the case of complex organisations and products.
The linking of SD practices with other relevant activities within a manufacturing company, such as process and plant design.
Considered Improvement of Sustainable Design MAXIMISING THE POTENTIAL OF DESIGN IMPROVEMENTS
DESIGN PROCESS
IMPLEMENTATION METHODS
HOLISTIC APPROACH

EPSRC Centre for INDUSTRIAL SUSTAINABILITY
Page 14
A Strategic Evolution of the Design Process EMBEDDING SUSTAINABILITY INTO ESTABLISHED DESIGN PROCESSES
USER DESIGN ECO
DESIGN PRODUCTION
Ubiquitous Sustainability within design processes
Extended scope of sustainable design
Ecodesign as an afterthought
DESIGN SUSTAINABLE
DESIGN PRODUCTION USER
SUSTAINABLE DESIGN PRODUCTION USER
NOW
NEXT
FUTURE

EPSRC Centre for INDUSTRIAL SUSTAINABILITY
Page 15
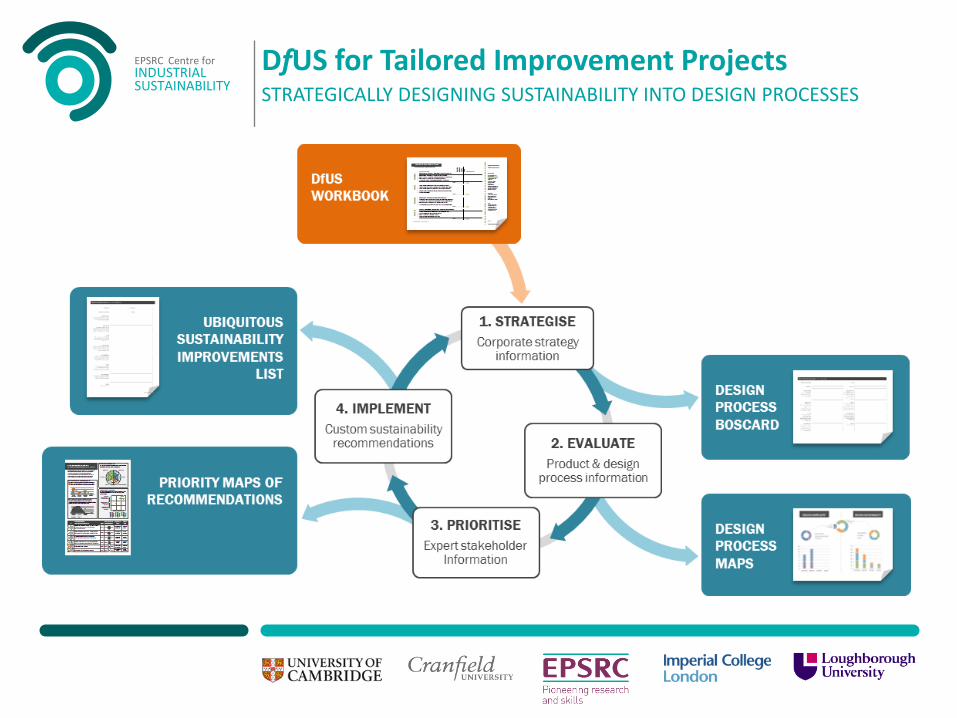
The DfUS Framework ‘DESIGN FOR UBIQUITOUS SUSTAINABILITY’
A systematic
four step
process for
designing
sustainability
into your
design
processes.
Modelled on similar
continuous
improvements
methods such as ISO
14001 and Life Cycle
Assessment.
1. STRATEGISE
Scoping and Definition of
Strategic Requirements
2. EVALUATE
Classification and Evaluation
of Design Processes
3. PRIORITISE
Scoring and Prioritisation of Sustainability Interventions
4. IMPLEMENT
Customisation, Implementation and Continuous
Improvement
EPSRC Centre for INDUSTRIAL SUSTAINABILITY
DfUS for Tailored Improvement Projects STRATEGICALLY DESIGNING SUSTAINABILITY INTO DESIGN PROCESSES

EPSRC Centre for INDUSTRIAL SUSTAINABILITY
Page 17
The strategic requirements for the project are defined from the outset, to ensure the improvements targeted are purposeful and aligned with company needs.
The DfUS BOSCARD is used to help collect information about the improvement project:
Background
Objectives
Scope
Constraints
Assumptions
Risks
Deliverables
Phase 1. Strategise SETTING THE SCOPE AND STRATEGY FOR THE IMPROVEMENT PROJECT

EPSRC Centre for INDUSTRIAL SUSTAINABILITY
DfUS BOSCARD SETTING DIRECTION FOR DESIGN PROCESS IMPROVEMENT

EPSRC Centre for INDUSTRIAL SUSTAINABILITY
Page 19
DfUS tables are used by the company to collect data about the design process.
Phase 2. Evaluate INVESTIGATING AND MODELLING THE DESIGN PROCESS
SUMMARY GRAPHS DESIGN PROCESS MAPS
This data is then compiled, and visualised in maps to show opportunities and targets for the inclusion of sustainability in the design process.
The design process is evaluated and characterised to understand the key features that exist, and what needs to be improved.
DfUS TABLES

EPSRC Centre for INDUSTRIAL SUSTAINABILITY
DfUS Evaluation Tables AIDING AND DIRECTING DESIGN PROCESS INVESTIGATION
DfUS TABLE / WORKSHEET
/ CENTRAL DESIGN CENTRAL CONTROL
PL
AN
NIN
G
CO
NC
EP
T
SY
STE
M
DE
TA
IL
SPECIFY DECISION
EVALUATION CRITERIA
MA
TE
RIA
LS
i Selection of recyclable materials (homogeneous, recyclable, limited variety)
ii Selection of low impact materials (non toxic, responsibly sourced)
iii Material separability (uncoated, limited use of adhesives, dissimilar densities)
iv Material longevity (corrosion resistant, appropriate to use life)
v Efficient use of material (optimised component design, light weighting)
TOTALS
EN
ER
GY i Energy type and source during use (from safe and renewable sources)
ii Energy efficiency during use (efficient mechanisms and operation of product)
iii Energy type and source used in production (safe and renewable sources)
iv Energy efficiency in production processes (efficient machinery and systems)
v Transportation methods
TOTALS
PR
OD
UC
TIO
N
i Selection of low impact processes (energy efficient, zero waste)
ii Economies of scale and standardisation (use of off-the-shelf and standard parts)
iii Part geometry (design for manufacture, near net shape, minimised operations)
iv Geographical location of manufacturing, operations and suppliers
v Efficient packaging (minimised packaging materials and volume of packages)
TOTALS
EN
D O
F L
IFE
i Upgradability and modularity (remanufacturing, maintenance, fewer components)
ii Assembly methods (non permanent, accessible, standard head types)
iii Labelling and Identification of parts to aid recycling
iv Reliability and durability (extended life cycle)
v Take back and collection methods and systems
TOTALS
DIRECTIONS
This table highlights environmental
considerations related to your product and company.
For each criterion, specify the most influential corresponding decision, and indicate the stage in the design process at which this decision is made.
SCORING
Give a score to each identified decision based on its overall effect on
environmental impact.
KEY
0 = Not Applicable 1 = Negligible Effect 2 = Minor Effect 3 = Moderate Effect 4 = Significant Effect 5 = Severe Effect
ENVIRONMENTAL SUSTAINABILITY
Product/Division:
Date:
Author:

EPSRC Centre for INDUSTRIAL SUSTAINABILITY
DfUS Evaluation Factors TARGETING THE TABLES TO PROMOTE UNDERSTANDING
DESIGN CONTROL
Central Design Central Control
Distributed Design Central Control
Distributed Design Distributed Control
DESIGN COMPLEXITY
Product Design Complexity
Knowledge Management Complexity
Regulatory Complexity
DESIGN SUSTAINABILITY
Environmental Sustainability
Economic Sustainability
Social Sustainability
Identify TARGETS for consideration of the key sustainability factors
relevant for the business
Identify OPPORTUNITIES for readily embedding sustainability considerations
within established design process
SUSTAINABILITY TABLES COMPLEXITY TABLES

EPSRC Centre for INDUSTRIAL SUSTAINABILITY
DfUS Summary Graphs DIRECT MAPPING AND VISUALISATION OF THE TABLES

EPSRC Centre for INDUSTRIAL SUSTAINABILITY
These maps give a high level overview of the identified strengths and weaknesses across the existing design process.
They therefore enable patterns to be seen more easily, and opportunities for improvement to be readily identified.
DfUS Design Process Maps SUMMARY MAPS VISUALISING THE WHOLE DESIGN CHAIN

EPSRC Centre for INDUSTRIAL SUSTAINABILITY
Visualising the Design Process using DfUS Maps FACTOR COMPARISON EXAMPLE

EPSRC Centre for INDUSTRIAL SUSTAINABILITY
Page 25
Targeted recommendations for sustainable design improvement are identified using the maps of the design process produced.
Experts across the company score these recommended improvements based on four assessment factors, to give a final ranked list of suggestions.
Phase 3. Prioritise SELECTING THE MOST BENEFICIAL AND FEASIBLE IMPROVEMENTS
Economic Viability
Technological Feasibility
Sustainability Benefits
Strategic Importance
Overall Feasibility Perceived Benefits

EPSRC Centre for INDUSTRIAL SUSTAINABILITY
Recommendations for improvement are put into a form to be ranked by experts, and the findings are calculated and summarised in a final report form.
Ranking the Improvement Recommendations
RANGE DIRECTION
CREATIVE DESIGN
TECHNICAL DESIGN
SIGN-OFF
#
RECOMMENDATIONS for improving Sustainable Design SCORE
Overall Feasibility vs
Perceived Benefits
Sustainability
Target
Process
Stage
Consider environmental factors in ‘Creative Design’
Efficient use of inks, printing efficiency and
construction efficiency
2.75 1.25 1 .50 Environmental
Production Creative Design
Set environmental objectives in ‘Range Direction’
Clear objectives set out and fed into design briefs 2.50 1.25 1 .25
Environmental Life Cycle
Range Direction
Introduce Compliance Strategy Documents
Formal documentation of compliance strategy 2.25 1.00 1 .25
Economic Regulation
Range Direction
Consider Manufacturability in Briefing Documents
Design for manufacture – involve supplier feedback 2.25 1.00 1 .25
Economic Supply
Creative Design
Assess energy use at source 2.00 1.00 1 .00 Social User
Engagement Creative Design
Sustainable design assessment and KPIs 1.25 0.50 0 .75 Environmental
Metrics Range
Direction
The DfUS (Design for Ubiquitous Sustainability) results below are designed to help understand how to incorporate and embed
sustainability considerations into your design processes.
Each of the recommendations included here were scored by a
panel of experts against their technical feasibility, economic
viability, sustainability benefits, and strategic importance.
FEASIBILITY vs BENEFITS
A
Moderate interim benefits within
5-10 years.
Minimal delayed
benefits within
>10 years.
Significant immediate benefits
within <5 years.
OVERALL FEASIBILITY
PE
RC
EIV
ED
BE
NE
FIT
S
Substa
ntial
eff
ort
and
inve
stm
ent
requir
ed.
Modera
te
eff
ort
and
inve
stm
ent
requir
ed.
Min
imal
eff
ort
and
inve
stm
ent
requir
ed.
A
E
D C
F
B
B
C
D
E
F
CURRENT DESIGN PROCESS NEEDS
This map was created from an evaluation of the current design processes. It illustrates where economic, environmental and
social considerations are currently included throughout design.
This shows the recommendations divided by their expert scores for technical and economic feasibility vs sustainability and
strategic benefits.
Supply
SUSTAINABILITY TARGETS
A
F
D
E
B
CProduction
Life Cycle
Metrics
Regulation
User-Engagement
This illustrates the targets of consideration for the six proposed recommendations to improve sustainable design.
DfUS SUSTAINABLE DESIGN PROCESS IMPROVEMENTS / SPORTS EQUIPMENT
PROPOSED PROCESS IMPROVEMENTS This shows the recommendations for sustainable design improvement, identified below, mapped against the design process
and over the current process needs shown above.
RANGE DIRECTION
CREATIVE DESIGN
TECHNICAL DESIGN
SIGN-OFF
AB C D E F
DfUS GRAPHS / SPORTS EQUIPMENT
EXPERT SCORING / SUSTAINABLE DESIGN INTERVENTIONS
CRITERIA for assessing the feasibility and impact of each recommendation
RECOMMENDATIONS for including sustainability in the design process
ECONOMIC
VIABILITY
TECHNICAL
FEASIBILITY
SUSTAINABILITY
BENEFIT
STRATEGIC
IMPORTANCE
1 Consider environmental factors in Creative Design
Efficient use of inks, printing efficiency and construction efficiency
2 Set environmental objectives in range direction
Clear objectives set out and fed into design briefs
3 Introduce Compliance Strategy Documents
Formal documentation of compliance strategy
4 Consider Manufacturability in Briefing Documents
Design for manufacture – involve supplier feedback
5 Assess energy use at source
Tier 1 & 2 energy usage assessments
6 Sustainable design assessment and KPIs
Use of Higg Rapid Design Module etc.
7
8
9
10
WEIGHTING
EXPERT AUTHOR:
DEPARTMENT:
DATE:
DIRECTIONS
This sheet allows experts to score each potential sustainable design intervention.
Each should be given a score between 1-3 for each of the four key criteria, where a higher score indicates a better performance. Further details are provided on the separate scoring sheet.
WEIGHTING
To set the relative importance of each evaluation criteria, give each a value so
that the total of all
four adds up to 1. For example, if they are all of equal importance, each will have a weight of 0.25.

EPSRC Centre for INDUSTRIAL SUSTAINABILITY
Prioritised Process Improvement Mapping EXCERPTS FROM THE FINAL DfUS REPORT FORM
RANGE DIRECTION
CREATIVE DESIGN
TECHNICAL DESIGN
SIGN-OFF
#
RECOMMENDATIONS for improving Sustainable Design SCORE
Overall Feasibility vs
Perceived Benefits
Sustainability
Target
Process
Stage
Consider environmental factors in ‘Creative Design’
Efficient use of inks, printing efficiency and
construction efficiency
2.75 1.25 1 .50 Environmental
Production Creative Design
Set environmental objectives in ‘Range Direction’
Clear objectives set out and fed into design briefs 2.50 1.25 1 .25
Environmental Life Cycle
Range Direction
Introduce Compliance Strategy Documents
Formal documentation of compliance strategy 2.25 1.00 1 .25
Economic Regulation
Range Direction
Consider Manufacturability in Briefing Documents
Design for manufacture – involve supplier feedback 2.25 1.00 1 .25
Economic Supply
Creative Design
Assess energy use at source 2.00 1.00 1 .00 Social User
Engagement Creative Design
Sustainable design assessment and KPIs 1.25 0.50 0 .75 Environmental
Metrics Range
Direction
The DfUS (Design for Ubiquitous Sustainability) results below are designed to help understand how to incorporate and embed
sustainability considerations into your design processes.
Each of the recommendations included here were scored by a
panel of experts against their technical feasibility, economic
viability, sustainability benefits, and strategic importance.
FEASIBILITY vs BENEFITS
A
Moderate interim benefits within
5-10 years.
Minimal delayed
benefits within
>10 years.
Significant immediate benefits
within <5 years.
OVERALL FEASIBILITY
PE
RC
EIV
ED
BE
NE
FIT
S
Substa
ntial
eff
ort
and
inve
stm
ent
requir
ed.
Modera
te
eff
ort
and
inve
stm
ent
requir
ed.
Min
imal
eff
ort
and
inve
stm
ent
requir
ed.
A
E
D C
F
B
B
C
D
E
F
CURRENT DESIGN PROCESS NEEDS
This map was created from an evaluation of the current design processes. It illustrates where economic, environmental and
social considerations are currently included throughout design.
This shows the recommendations divided by their expert scores for technical and economic feasibility vs sustainability and
strategic benefits.
Supply
SUSTAINABILITY TARGETS
A
F
D
E
B
CProduction
Life Cycle
Metrics
Regulation
User-Engagement
This illustrates the targets of consideration for the six proposed recommendations to improve sustainable design.
DfUS SUSTAINABLE DESIGN PROCESS IMPROVEMENTS / SPORTS EQUIPMENT
PROPOSED PROCESS IMPROVEMENTS This shows the recommendations for sustainable design improvement, identified below, mapped against the design process
and over the current process needs shown above.
RANGE DIRECTION
CREATIVE DESIGN
TECHNICAL DESIGN
SIGN-OFF
AB C D E F
RANGE DIRECTION
CREATIVE DESIGN
TECHNICAL DESIGN
SIGN-OFF
#
RECOMMENDATIONS for improving Sustainable Design SCORE
Overall Feasibility vs
Perceived Benefits
Sustainability
Target
Process
Stage
Consider environmental factors in ‘Creative Design’
Efficient use of inks, printing efficiency and
construction efficiency
2.75 1.25 1 .50 Environmental
Production Creative Design
Set environmental objectives in ‘Range Direction’
Clear objectives set out and fed into design briefs 2.50 1.25 1 .25
Environmental Life Cycle
Range Direction
Introduce Compliance Strategy Documents
Formal documentation of compliance strategy 2.25 1.00 1 .25
Economic Regulation
Range Direction
Consider Manufacturability in Briefing Documents
Design for manufacture – involve supplier feedback 2.25 1.00 1 .25
Economic Supply
Creative Design
Assess energy use at source 2.00 1.00 1 .00 Social User
Engagement Creative Design
Sustainable design assessment and KPIs 1.25 0.50 0 .75 Environmental
Metrics Range
Direction
The DfUS (Design for Ubiquitous Sustainability) results below are designed to help understand how to incorporate and embed
sustainability considerations into your design processes.
Each of the recommendations included here were scored by a
panel of experts against their technical feasibility, economic
viability, sustainability benefits, and strategic importance.
FEASIBILITY vs BENEFITS
A
Moderate interim benefits within
5-10 years.
Minimal delayed
benefits within
>10 years.
Significant immediate benefits
within <5 years.
OVERALL FEASIBILITY
PE
RC
EIV
ED
BE
NE
FIT
S
Substa
ntial
eff
ort
and
inve
stm
ent
requir
ed.
Modera
te
eff
ort
and
inve
stm
ent
requir
ed.
Min
imal
eff
ort
and
inve
stm
ent
requir
ed.
A
E
D C
F
B
B
C
D
E
F
CURRENT DESIGN PROCESS NEEDS
This map was created from an evaluation of the current design processes. It illustrates where economic, environmental and
social considerations are currently included throughout design.
This shows the recommendations divided by their expert scores for technical and economic feasibility vs sustainability and
strategic benefits.
Supply
SUSTAINABILITY TARGETS
A
F
D
E
B
CProduction
Life Cycle
Metrics
Regulation
User-Engagement
This illustrates the targets of consideration for the six proposed recommendations to improve sustainable design.
DfUS SUSTAINABLE DESIGN PROCESS IMPROVEMENTS / SPORTS EQUIPMENT
PROPOSED PROCESS IMPROVEMENTS This shows the recommendations for sustainable design improvement, identified below, mapped against the design process
and over the current process needs shown above.
RANGE DIRECTION
CREATIVE DESIGN
TECHNICAL DESIGN
SIGN-OFF
AB C D E F
EPSRC Centre for INDUSTRIAL SUSTAINABILITY
Page 28
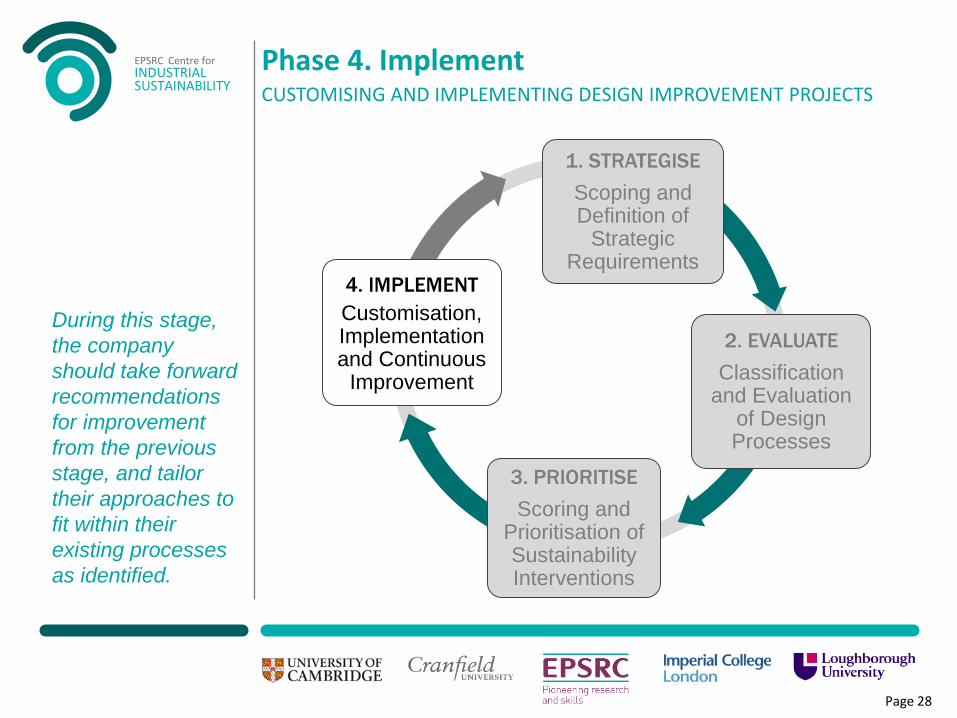
Phase 4. Implement CUSTOMISING AND IMPLEMENTING DESIGN IMPROVEMENT PROJECTS
During this stage,
the company
should take forward
recommendations
for improvement
from the previous
stage, and tailor
their approaches to
fit within their
existing processes
as identified.
1. STRATEGISE
Scoping and Definition of
Strategic Requirements
2. EVALUATE
Classification and Evaluation
of Design Processes
3. PRIORITISE
Scoring and Prioritisation of Sustainability Interventions
4. IMPLEMENT
Customisation, Implementation and Continuous
Improvement
EPSRC Centre for INDUSTRIAL SUSTAINABILITY
Page 29
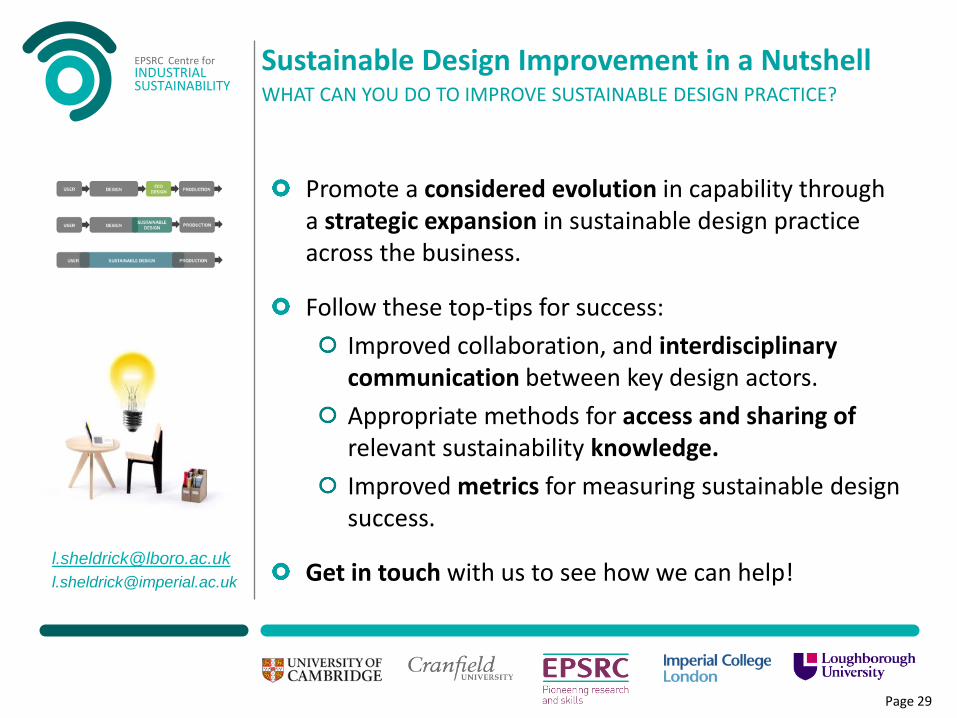
Promote a considered evolution in capability through a strategic expansion in sustainable design practice across the business.
Follow these top-tips for success:
Improved collaboration, and interdisciplinary communication between key design actors.
Appropriate methods for access and sharing of relevant sustainability knowledge.
Improved metrics for measuring sustainable design success.
Get in touch with us to see how we can help!
Sustainable Design Improvement in a Nutshell WHAT CAN YOU DO TO IMPROVE SUSTAINABLE DESIGN PRACTICE?

EPSRC Centre for INDUSTRIAL SUSTAINABILITY
Thank you… Any Questions?
EPSRC Centre for INDUSTRIAL SUSTAINABILITY
Technical Seminar Series 16.00-16.45, 3rd December 2015 Eco-intelligent process monitoring Elliot Woolley, Alessandro Simeone and Nick Goffin Loughborough University This webinar will demonstrate the role that sensing technologies can play in providing real time data to improve environmentally-aware short term decision making. The talk will be in three parts: - A general overview of eco-intelligent manufacturing, and its widespread applicability to industry - The novel use of vision sensors for reducing the duration of clean-in-place processes (relating to the food sector) - The novel use of laser diffraction for ensuring optimised production of thin film solar cells The webinar will therefore cover a mixture of theory and experimental investigation which should be thought provoking and lead to an engaged discussion regarding the role of eco-intelligent manufacturing in modern industry.