technical design report of the inner tracker for the kloe
TRANSCRIPT

arX
iv:1
002.
2572
v1 [
phys
ics.
ins-
det]
12
Feb
2010
LNF - 10/3(P)February 10, 2010
Technical Design Report of the Inner Tracker
for the KLOE-2 experiment
The KLOE-2 Collaboration
G. De Robertis, O. Erriquez, F. Loddo, A. Ranieri,Dipartimento di Fisica, Universita di Bari and INFN sezione di Bari, Bari,
Italy
G. Morello, M. SchioppaDipartimento di Fisica, Universita della Calabria and INFN gruppo
collegato di Cosenza, Cosenza, Italy
E. Czerwinski, P. Moskal, M. Silarski, J. ZdebikInstitute of Physics, Jagellonian University, Cracow, Poland
D. Babusci, G. Bencivenni, C. Bloise, F. Bossi, P. Campana, G. Capon,P. Ciambrone, E. Dane, E. De Lucia, D. Domenici, M. Dreucci, G. Felici,S. Giovannella, F. Happacher, E. Iarocci, M. Jacewicz, J. Lee Franzini,M. Martini, S. Miscetti, L. Quintieri, V. Patera, P. Santangelo, I. Sarra,
B. Sciascia, A. Sciubba, G. Venanzoni, R. VersaciLaboratori Nazionali di Frascati dell’ INFN, Frascati, Italy
S. A. Bulychjev, V. V. Kulikov, M. A. Martemianov, M. A. MatsyukInstitute for Theoretical and Experimental Physics (ITEP), Moscow, Russia
C. Di DonatoDipartimento di Scienze Fisiche, Universita di Napoli “Federico II” and
INFN sezione di Napoli, Napoli, Italy
C. Bini, V. Bocci, A. De Santis, G. De Zorzi, A. Di Domenico, S. Fiore,P. Franzini, P. Gauzzi
Dipartimento di Fisica, “Sapienza” Universita di Roma and INFN sezionedi Roma, Roma, Italy
F. Archilli, D. Badoni, F. Gonnella, R. Messi, D. MoriccianiDipartimento di Fisica, Universita di Roma “Tor Vergata” and INFN
sezione di Roma 2, Roma, Italy
1

P. Branchini, A. Budano, F. Ceradini, B. Di Micco, E. Graziani, F. Nguyen,A. Passeri, C. Taccini, L. Tortora
Dipartimento di Fisica, Universita Roma Tre and INFN sezione di RomaTre, Roma, Italy
L. Kurdadze, D. Mchedlishvili, M. TabidzeNuclear Physics Department and High Energy Physics Institute of Tbilisi
State Univesity, Georgia
B. Hoistad, T. Johansson, A. Kupsc, M. WolkeDepartment of Nuclear and Particle Physics, Uppsala University, Uppsala,
Sweden
W. WislickiA. Soltan Institute for Nuclear Studies, Warsaw, Poland
and
N. Lacalamita, R. Liuzzi, M. Mongelli, V. ValentinoINFN sezione di Bari, Bari, Italy
A. Balla, S. Cerioni, M. Gatta, S. Lauciani, M. PistilliLaboratori Nazionali di Frascati dell’ INFN, Frascati, Italy
A. PelosiINFN sezione di Roma, Roma, Italy
2

Contents
1 Introduction 5
2 Physics issues 72.1 Neutral Kaon Interferometry . . . . . . . . . . . . . . . . . . . 72.2 Rare KS decays . . . . . . . . . . . . . . . . . . . . . . . . . . 92.3 η decays in four charged particles . . . . . . . . . . . . . . . . 102.4 Multi-lepton events . . . . . . . . . . . . . . . . . . . . . . . . 11
3 Detector design requirements. 123.1 Detector layout . . . . . . . . . . . . . . . . . . . . . . . . . . 133.2 Operating principles of a triple-GEM detector. . . . . . . . . . 153.3 Simulation results . . . . . . . . . . . . . . . . . . . . . . . . . 15
4 Prototype studies 184.1 Full-scale CGEM prototype . . . . . . . . . . . . . . . . . . . 18
4.1.1 Construction . . . . . . . . . . . . . . . . . . . . . . . 184.1.2 X-ray test . . . . . . . . . . . . . . . . . . . . . . . . . 224.1.3 CGEM test beam at CERN . . . . . . . . . . . . . . . 24
4.2 Planar GEM for readout studies . . . . . . . . . . . . . . . . . 294.2.1 Operation in magnetic field . . . . . . . . . . . . . . . 304.2.2 Planar GEM test beam at CERN . . . . . . . . . . . . 32
4.3 Large area GEM . . . . . . . . . . . . . . . . . . . . . . . . . 374.3.1 Single-mask procedure . . . . . . . . . . . . . . . . . . 384.3.2 Measurements . . . . . . . . . . . . . . . . . . . . . . . 394.3.3 Large planar prototype . . . . . . . . . . . . . . . . . . 41
5 Mechanics and construction 425.1 Detector components . . . . . . . . . . . . . . . . . . . . . . . 435.2 Construction and tooling . . . . . . . . . . . . . . . . . . . . . 465.3 Material preparation & Quality Controls . . . . . . . . . . . . 48
5.3.1 GEMs . . . . . . . . . . . . . . . . . . . . . . . . . . . 485.3.2 Readout anode circuit . . . . . . . . . . . . . . . . . . 505.3.3 Annular frames . . . . . . . . . . . . . . . . . . . . . . 515.3.4 Final tests on closed chamber . . . . . . . . . . . . . . 51
5.4 Detector integration . . . . . . . . . . . . . . . . . . . . . . . 52
6 Electronics 556.1 On-Detector Electronics . . . . . . . . . . . . . . . . . . . . . 55
6.1.1 The GASTONE ASIC . . . . . . . . . . . . . . . . . . 556.1.2 The Digital section . . . . . . . . . . . . . . . . . . . . 60
3

6.2 The 16 channels chip prototype . . . . . . . . . . . . . . . . . 626.2.1 Lab test result . . . . . . . . . . . . . . . . . . . . . . 63
6.3 Off-Detector electronics . . . . . . . . . . . . . . . . . . . . . . 646.3.1 GEO boards . . . . . . . . . . . . . . . . . . . . . . . . 656.3.2 CONCENTRATOR board . . . . . . . . . . . . . . . . 67
6.4 HV and FEE integration . . . . . . . . . . . . . . . . . . . . . 696.4.1 FEE Integration . . . . . . . . . . . . . . . . . . . . . . 696.4.2 HV Integration . . . . . . . . . . . . . . . . . . . . . . 716.4.3 Assembling test . . . . . . . . . . . . . . . . . . . . . . 72
7 Time schedule and responsibilities sharing 73
4

1 Introduction
The KLOE experiment collected an integrated luminosity∫
Ld t∼2.5 fb−1 atthe Frascati φ–factory DAΦNE, an e+e− collider operated at the energy of1020 MeV, the mass of the φ meson.
The experiment achieved several precision physics results [1] both in
• Kaon physics, thanks to the unique availability of pure KS , KL , K±
beams, with the measurement of all significant branching ratios and theunitarity and universality tests of the weak interactions in the StandardModel, and also with several stringent tests of CPT symmetry andquantum mechanics, and in
• Hadronic physics, with the study of the properties of scalar and pseu-doscalar mesons with unprecedented accuracy and the measurement ofthe e+e− → π+π− cross section representing the main hadronic contri-bution to the muon anomaly.
S.C. coilCryostat
Po
le p
iec
e
6 m
7 m
En
d c
ap
EM
C
Barrel EMC
Yoke
Drift chamber
Po
le p
iec
e
QCal
Figure 1: The KLOE detector
5

The detector (fig. 1) consists of a large volume drift chamber surrounded byan electromagnetic sampling calorimeter and it is entirely immersed in anaxial magnetic field B = 0.52 T. The drift chamber (DC) [2], 3.3 m long and4 m in diameter, has a stereo geometry with 12,582 drift cells arranged in 58layers and operates with a 90% helium-10% isobutane gas mixture. Trackingin the DC provides measurements of the momentum of charged particles withσ(p⊥)/p⊥ ≤ 0.4% for polar angles larger than 45
. The spatial resolution is∼150 µm in the bending plane, ∼2 mm on the z coordinate and ∼3 mm ondecay vertices. The first track hit measured by the KLOE drift chamber is ata radius of 28 cm from the interaction point (IP). After track extrapolation,the vertex of a KS → π+π− decay close to the IP is reconstructed witha resolution of ∼ 1 τS ≃ 6 mm. The electromagnetic calorimeter (EMC)[3] consists of a cylindrical barrel and two endcaps, covering a solid angle of98% of 4π. Particles crossing the lead-scintillator-fiber structure of the EMC,segmented into five planes in depth, are detected as local energy deposits.Deposits close in time and space are grouped into clusters. The energy and
time resolution for electromagnetic showers are σE/E = 5.7%/√
E(GeV)
and σt = 57 ps/√
E(GeV) ⊕ 100 ps, respectively. The trigger [4] requirestwo isolated energy deposits in the EMC with: E > 50 MeV in the barreland E > 150 MeV in the endcaps. Cosmic-ray muons are identified as eventswith two energy deposits with E > 30 MeV in the outermost EMC planesand are vetoed at the trigger level. A software filter, based on the topologyand multiplicity of EMC clusters and DC hits, is applied to reject machinebackground.
After the completion of the KLOE data taking, a proposal [5, 6] has beenpresented for a physics program to be carried out with an upgraded KLOEdetector, KLOE-2 [7, 8, 9], at an upgraded DAΦNE machine, which has beenassumed to deliver an integrated luminosity O(20) fb−1.
The KLOE physics program required a detector capable of reconstructingwith good accuracy a large fraction of KL decays, in a big fiducial volume,and KS decays coming from the interaction region. At KLOE-2 an enhancedinterest will be focused on physics coming from the interaction region: KS
decays, KSKL interference, η, η′ and K± decays, multi-lepton events. There-fore an improvement of the detection performance and capabilities close tothe interaction point (IP) would be extremely beneficial for the KLOE-2physics program.
In this document an upgrade of the KLOE setup with a new detector, theInner Tracker (IT), is discussed. The IT will be placed between the beampipe and the DC inner wall in order to:
• reduce the track extrapolation length and improve the decay vertex
6

reconstruction capability;
• increase the geometrical acceptance for low momentum tracks, presentlylimited by the KLOE magnetic field and by the distance of the DC firstlayer, and optimize their detection;
• improve the track momentum resolution.
2 Physics issues
2.1 Neutral Kaon Interferometry
A φ-factory is a unique place to investigate the evolution of the entangledkaons, and to search for decoherence and CPT violation effects, possiblyinduced by underlying quantum gravitational phenomena.
As discussed in Ref.[5, 10], from the analysis of CP violating decay modeφ → KSKL → π+π−, π+π− several important tests of fundamental physicscan be done. Quantum interference effects in this channel have been observedfor the first time by the KLOE collaboration [11], measuring the distributionI(π+π−, π+π−; |∆t|), with ∆t the time difference of the two π+π− decays.The analysis of the full KLOE data set [12] provided the most stringent lim-its on the γ, ℜω, and ℑω parameters related to possible decoherence andCPT violation effects in the neutral kaon system [13]. Moreover, the mostprecise test of quantum coherence on an entangled two-particle system hasbeen performed, putting very stringent limits on the decoherence parame-ters ζ00 and ζSL [14]. All these measurements are dominated by statisticaluncertainties.
In general, all decoherence effects (including CPT violation effects re-lated to decoherence phenomena) should manifest as a deviation from thequantum mechanical prediction I(π+π−, π+π−; |∆t| = 0) = 0. Hence thereconstruction of events in the region at ∆t ≈ 0, i.e. with two vertices closeto each other and both near the IP, is crucial for a precise determination ofthe parameters related to CPT violation and decoherence. The vertex res-olution, mainly due to track extrapolation, affects the I(π+π−, π+π−; |∆t|)distribution precisely in this region, as shown in fig. 2. The resolution hasbeen taken into account by properly folding and fitting the original distri-bution with the smearing matrix and the efficiency curve obtained with theMonte Carlo simulation used for the KLOE data analysis [11]. The effect ofan improved resolution σ|∆t| ≈ 0.3 τS has simply been obtained by taking intoaccount the corresponding |∆t| scale factor in the smearing matrix and inthe efficiency curve. In this way all the peculiar asymmetries and behaviours
7

Figure 2: The I(π+π−, π+π−; |∆t|) distribution as a function of |∆t| (in τSunits) with the present KLOE resolution σ|∆t| ≈ τS (histogram with widebins), with an improved resolution σ|∆t| ∼ 0.3 τS (histogram with narrowbins), and in the ideal case (solid line). Simulation results.
of the |∆t| resolution around ∆t = 0 are maintained, even though they areshrinked. The impact of the resolution on the decoherence parameter mea-surements has to be carefully evaluated. Indeed, the resolution has two maineffects: (1) it contributes to the statistical sensitivity on the measurement ofthe decoherence (and CPT violation) parameters, which are obtained froma fit to the measured I(π+π−, π+π−; |∆t|) distribution; (2) it introduces asource of systematic uncertainty, due to its folding in the fit procedure. Infig. 3 the statistical uncertainty on several decoherence and CPT -violatingparameters is shown as a function of the integrated luminosity for σ|∆t| ≈ τS(present KLOE resolution) and σ|∆t| ∼ 0.3 τS. As it can be seen in the lastcase an improvement of about a factor two in statistical sensitivity could beachieved. This improvement would be equivalent to an increase in luminosityof a factor of four, and it is necessary, with a target integrated luminosity of L 20 fb-1, to reduce the statistical uncertainties below or approximately atthe same level of the expected systematic ones. Therefore the insertion ofan inner tracker between the spherical beam pipe and the drift chamber ismandatory for a significant improvement of the KLOE results, and in general
8

Figure 3: The statistical sensitivity to the parameters ζSL (top-left), ζ00(top-right), ℜω (bottom-left) and α, β, γ (bottom-right) with the presentKLOE resolution σ|∆t| ≈ τS (open circles), and with an improved resolutionσ|∆t| ∼ 0.3 τS (full circles); solid lines represent 1/sqrt( L) function.
for the neutral kaon interferometry program of KLOE-2.In fact also the ∆t distribution of other decay modes like φ → KSKL →π+ℓ−ν, π−ℓ+ν and φ → KSKL → ππ, πℓν are interesting in the interferenceregion (corresponding to kaon decays close to the IP), being sensitive to CP ,CPT and/or ∆S = ∆Q rule violation effects [10]. In analogy with the mea-surement of the decoherence parameters, the statistical sensitivity and thesystematic uncertainties in the measurement of these parameters could belargely improved with the use of an inner tracker.
2.2 Rare KS decays
Significant results in kaon physics can be obtained at KLOE-2 improving thepresent knowledge on KS rare decays. The measurement of KS decays at theφ-factory has the unique feature to rely on KS pure beams, tagged by thereconstruction of KL decays and KL interactions in the calorimeter. Back-
9

ground sources are limited to the dominant KS decay channels, KS → ππ,well under control using the constraint of the closed kinematics of the decay.In general the insertion of an inner tracker would greatly improve the qualityof tracking and vertexing for all charged KS decay modes; it would also op-timize low momentum tracks detection, which is of fundamental importanceto improve the acceptance for some rare KS decays.
The study of KS → πeν decays is very important to test CPT symmetry,the ∆S = ∆Q rule and to measure Vus. The most precise measurement of thisbranching ratio (BR) has been obtained by KLOE with a total uncertainty of∼1.3% using an integrated luminosity of 410 pb−1 [15]. This accuracy is thecombination of a 1.1% statistical and a 0.7% systematic fractional uncertain-ties, largely dominated by the precision of the knowledge of the distributionsof tracking-related quantities. In fact the systematic uncertainty on the com-bined fit of these distributions, like the difference between missing energy andmomentum, mainly comes from the background of KS → π+π− decays notcorrectly reconstructed, e.g. cases in which one pion decays to a muon beforeentering the DC tracking volume.
With a target integrated luminosity of 10-20 fb−1 and the detector up-graded with an inner tracker, KLOE-2 could measure the BR with a totaluncertainty dominated by systematic effects. These systematic effects couldbe reduced at few per mil level with the IT, thanks to a better quality of thetracking, a more powerful rejection of the background from pion decays closeto the IP, and a larger acceptance for low momentum tracks.
Similar considerations apply to other KS rare decays that can be mea-sured at KLOE-2 as (i) KS → πµν, with similar physics interest as theKS → πeν decay, but with a lower BR and larger background; (ii) KS →π+π−e+e−, important to perform tests of Chiral Perturbation Theory andpossible new CP violation mechanisms; (iii) KS → π0e+e− very importantto assess indirect CP violation contribution in KL decays and to extract thedirect CP violating contribution.
2.3 η decays in four charged particles
The radiative decays of the η meson where the virtual photon converts into alepton pair allow to study the η internal structure, and to search for uncon-ventional possible CP violation mechanisms. The BR of the η → π+π−e+e−
decay has been recently measured at KLOE [16] with a 3.4% statistical uncer-tainty and a 2.6% systematic one. The detection efficiency for these decaysis strongly limited by the minimum detectable transverse momentum ∼ 23MeV/c with the KLOE DC, being the transverse momentum distribution ofthe four tracks peaked at low values, ∼ 10 MeV/c. Moreover the largest con-
10

0
0.02
0.04
0.06
0.08
0.1
0.12
0.14
0.16
0 100 200 300 400 500 600
Arb
. units
Electron pT (MeV)
Electron pT’s in 4-electron dark-sector events (100 MeV A’)
pT(e1)pT(e2)pT(e3)pT(e4)
Figure 4: Transverse momentum distribution of the four electrons producedin events involving a neutral vector boson with a mass of 100 MeV connectedwith a secluded gauge sector. Electrons are sorted by decreasing transversemomentum.
tribution (70%) to systematic uncertainty is due to the cut to reject η → ππγevents with γ conversion on the beam pipe. The insertion of an inner trackerbetween the beam pipe and the KLOE DC is expected to significantly im-prove both the acceptance of low momentum tracks and the vertex and mo-mentum resolution to reject much more efficiently the background. Similarbenefits are expected for the η → e+e−e+e− and η → e+e−µ+µ− decays witha BR in the range 10−5 and 10−7, respectively, well accessible at KLOE-2.
2.4 Multi-lepton events
Several puzzling astrophysical observations (PAMELA, ATIC, INTEGRAL,DAMA) have been recently interpreted by postulating the existence of somesecluded gauge sector weakly coupled with the SM particles. The typicalenergy scale for this new physics is 1 GeV or less, and can therefore induceobservable signals at DAΦNE. One of the possible signatures for the secludedsector is the production of multi-lepton events, whose energy spectrum ishighly dependent on the lepton flavor/multiplicity and on the actual valuesof the parameters of the theory (the mass of the vector boson, for instance).As an example, in fig. 4 the transverse momentum distribution of the four
11

electrons produced in events involving the neutral vector boson mediatingthe new interaction with a mass of 100 MeV, is shown. The low momenta ofthe leptons in this kind of events (about 30% of the events have at least anelectron below 50 MeV/c; this fraction might become larger for a differentchoice of the vector boson’s mass or if muons are present instead of electrons)translates into a low geometrical acceptance due to the KLOE magnetic field.The need to fully reconstruct the event in addition to the necessity to rejectthe background due to γ conversions on the beam pipe makes, in this respect,the insertion of an inner tracker extremely beneficial.
3 Detector design requirements.
The design of the IT is driven by physics requirements and space constraintsdue to limited detector clearance. The inner radius must preserve the KS-KL
quantum interference region (e.g. from KS regeneration) shown in fig. 5 inunits of KS lifetime (τS ≃ 0.6cm at a φ− factory). It follows that the innerradius of the IT should be at least at a distance of ≃ 20τS ≃ 12 cm from theIP. The outer radius of the inner tracker is constrained from the presence ofthe drift chamber inner wall at 25 cm.
Figure 5: (Left) Distribution of the decay time difference |∆t| for KSKL →π+π−, π+π− events (Right) Distribution of the decay time difference ∆t forKSKL → π−l+ν, π+l−ν events
A crucial design parameter is the resolution on the KS decay point, occur-ring within few cm from the IP. An accurate study of quantum interferometryrequires an improvement on this resolution of a factor 3-4 with respect to the
12

present value (≃0.6 cm).In order to reconstruct the decay vertex nearby the IP, the charged decay
tracks must be extrapolated from the hit on the IT innermost layer to thedecay point. This in turn implies that both the spatial resolution of theIT and the multiple scattering contribution must be carefully taken intoaccount in the evaluation of the track momentum resolution. To this extentand in order to minimize photon conversion, the IT should give a maximumcontribution to the overall material budget of ∼ 2%X0.
The event rate from φ−decays at O(1033) cm−2s−1 luminosity is of theorder of 10 KHz. However a critical parameter for the inner tracker designis given by the occupancy due to the machine background events. The com-position (electrons and/or photons), the rate, the spatial and momentumdistribution of these events are difficult to estimate since they are highlydependent on the machine optics, operating conditions, and on the configu-ration of screens and absorbers. A first estimate of the background occupancycan be obtained from the counting rate of the silicon detector of the FINUDAexperiment that collected data at the second DAΦNE interaction region: ata radius of 6 cm from IP this detector collected 7-8 hits/plane in 2µs of in-tegration time at 1032cm−2s−1 luminosity. Scaling with the luminosity anddetector’s geometry, the occupancy for the IT is 10-20 hits /layer, in oneµs of integration time. An alternative estimate can be obtained by properlyscaling the single counting rate of the innermost layer of the KLOE DC po-sitioned at 28 cm from the IP. The result is found to be consistent with theprevious estimate. In order to minimize the possible effect of combinatorialfor an independent pattern recognition based on IT hits, the detector shouldhave the shortest possible integration time. As a reference figure for the in-tegration time of the IT, we have considered 200 ns, equal to the maximumdelay between the e+e− collision and the KLOE trigger signal formation.
Summarizing, the detector requirements for the IT are:
• σrφ ∼ 200µm and σZ ∼ 400µm spatial resolutions, to improve presentresolution on the KS decay point by a factor of ∼3;
• 2% X0 overall material budget;
• 5 kHz/cm2 rate capability.
3.1 Detector layout
The Inner Tracker will be inserted in the available space inside the DriftChamber. The proposed solution consist of five independent tracking layers(L1-L5), each providing a 3-D reconstruction of space points along the track
13

with a 2-D readout. The innermost layer is placed at 12.7 cm from the beamline, corresponding to 20 τS avoiding to spoil the KSKL interference. Theoutermost layer will be placed at 23.0 cm from the beam line, just inside theinternal wall of the Drift Chamber. The active length for all layers is 700mm (fig. 6).
Figure 6: Cross-section of the inner tracker at the interaction point.
We have chosen to realize each layer as a cylindrical-GEM detector (CGEM).The CGEM is a triple-GEM detector composed by concentric cylindrical elec-trodes (fig. 7): from the cathode (the innermost electrode), through the threeGEM foils, to the anode readout (the outermost electrode). The anode read-out of each CGEM is segmented with 650 µm pitch XV patterned strips witha stereo angle of about 40 degrees. The full system consists of about 30,000FEE channels.
Figure 7: Cross-section of the triple GEM detector.
This innovative technology provides us with an ultra-light and fully sen-sitive detector, fulfilling the stringent requirement on the material budget
14

needed to minimize the multiple scattering effect for low-momentum tracks.The detector is composed by thin (50 µm) Copper clad polyimide foils, actingas cathode, readout anode and multiplication stages.
Moreover the high rate capability of the GEM (up to 1 MHz/mm2 mea-sured [17]) makes this detectors suitable to be placed near the interactionpoint of a high-luminosity collider machine.
3.2 Operating principles of a triple-GEM detector.
A GEM (Gas Electron Multiplier) is made by a thin (50 µm) kapton foil,copper clad on each side, with a high surface density of holes [18]. In thestandard technique each hole has a bi-conical structure with external (inter-nal) diameter of 70 µm (50 µm); the hole pitch is 140 µm. The bi-conicalshape of the hole is a consequence of the double mask process used in stan-dard photolitographic technologies. The GEM foils are manufactured bythe CERN EST-DEM [19] workshop. A typical voltage difference of 350 to500 V is applied between the two copper sides, giving fields as high as 100kV/cm into the holes, resulting in an electron multiplication up to a fewthousand. Multiple structures realized by assembling two or more GEMs atclose distance allow high gains to be reached while minimizing the dischargeprobability [20].
The triple GEM detector can effectively be used as tracking detector,with good time and position resolution performance. A cross-section of thedetector is shown in fig. 7 indicating all of the GEM stages: conversion anddrift, transfer and induction.
3.3 Simulation results
Code to simulate the IT detector has been inserted in the official KLOEMonte Carlo program, GEANFI [21]. We used a reference geometry wherethe IT is made of five cylindrical triple-GEM layers, 70 cm long and with theinnermost plane of the triple-GEM positioned at the following radii from theIP (in cm): 12.7, 14.9, 17.1, 19.3 and 21.5.
The simulation accounts for the following materials for each GEM layer:300 µm of kapton, 2 µm of copper, and 8 mm of gas mixture(Ar-CO2). Thegrand total of the material budget for the five layers of the IT is then 1.08 %of X0. Each GEM is simulated as a 2 mm gas stage, in which ionization takesplace, followed by the three multiplication stages simulated as a whole. Thesimulated hits from the particles crossing the IT are then digitized accordingto a two dimensional X-V strip readout for each GEM layer. The X strips
15

Figure 8: (Top) Resolution on the point of closest approach to the decay ver-tex in the transverse plane obtained for reconstructed tracks in KS → π+π−
(BLUE triangle) and KS → π+e−ν events (RED triangle). Empty pointindicates the same quantities without the IT. (Bottom) Vertex resolutionobtained in the transverse plane for KS → π+π− decays using several valuesof the readout pitch.
are parallel to the z beam axis 1, while the V strips have a 40 degree anglewith respect to the beam axis. Both X and V strips have a 650 µm pitch.The Z coordinate is then obtained from the crossing of both X and V stripreadout as Y = tan(50) × X + V/cos(50). The corresponding single hitresolution obtained with digital readout is ≃ 190 µm in the r− φ plane and≃ 400 µm in the z direction.
The digitization procedure takes properly into account the presence ofghost hits due to the X-V projection. To extract the helix parameters of theincoming particle, the digitized hits are grouped first into clusters, then theclusters information is processed by a dedicated tracking code.
We start with the tracks already reconstructed in the KLOE Drift Cham-ber and extrapolated to the IT. The helix parameters obtained from the DCare updated with the Kalman filter by using the information of the IT clus-
1In the following the coordinate system is defined with the z-axis along the bisectorof the e+e− beams, positive along the positron motion, the y-axis vertical and the x-axistoward the center of the collider rings and origin at the collision point.
16

ters. Finally the tracks are extrapolated to the IP and given as input to asimple vertex finder based on minimum helixes distance.
The simulation shows that pions coming from KS → π+π− decays crossnearly orthogonal the GEM layers, due to the typical P-wave angular dis-tribution of kaons produced from φ decays. Fig 8 top shows the resolutionon the point of closest approach to the decay vertex in the transverse planeobtained for reconstructed tracks in KS → π+π− and KS → π+e−ν events.The comparison with the same quantity obtained without the IT shows an
pt (MeV)120 140 160 180 200 220 240 260
sigm
a_pt
/pt
0.002
0.004
0.006
0.008
0.01
0.012
0.014
0.016
Ks decays
Inner Tracker
Drift Chamber
pt (MeV)50 100 150 200 250
sigm
a_pt
/pt
0
0.005
0.01
0.015
0.02
0.025
0.03
0.035
0.04
0.045
0.05
Eta decays
Drift Chamber
Inner Tracker
Figure 9: Resolution σpT /pT on the transverse momentum measurement asa function of pT for KS → π+π− (Left) and η → π+π−e+e− decays (Right)with DC only (circles) and adding the IT information (triangles).
improvement of a factor 3 with a 600 µm pitch, perfectly compatible withthe requirements of KLOE-2, discussed in the previuos section. Fig 8 bottomshows the vertex resolution obtained in the transverse plane for KS → π+π−
decays using several values of the readout pitch.The insertion of the Inner Tracker improves also the resolution on the
measurement of the transverse momentum, pT . The effect has been studiedwith KS → π+π− and η → π+π−e+e− decays, assuming a pitch of 650 µm.Fig.9 shows the behaviour of σpT /pT as a function of pT , obtained usingthe DC only and adding the IT information. As expected, usage of the ITimproves the transverse momentum resolution for low momentum tracks, asmuch as 20% at pT ≃120 MeV for KS → π+π− decays and 50% at pT ≃60MeV for η → π+π−e+e− decays.
17

4 Prototype studies
The idea of a cylindrical GEM detector was tested for the first time witha small prototype (7 cm radius and 24 cm length) [22]. The very positiveresults obtained with this prototype paved the road for the construction of afull-scale prototype for the first layer of the IT. Since then, the R&D activityfor the final detector has been focused on three main items: the realizationand test of a full-scale Cylindrical GEM prototype, the detailed study of theXV readout, performed on dedicated small planar chambers for simplicityand economical reasons, and the realization of very large GEM foils basedon the new single-mask technology. In the following three subsections, thesethree items will be discussed in detail.
4.1 Full-scale CGEM prototype
In 2007 we built a cylindrical GEM prototype with dimensions similar tothose of the first layer of the final IT: it has the same diameter of 300 mmbut a reduced active length, 352 mm instead of 700 mm, due to a limitationin the availability of large area GEM foils. For the same reason a singlecylindrical electrode (352x960 mm) was obtained as a joint of three identicalGEM foils (352x320 mm).
The detector has a geometrical configuration of the gaps of 3/2/2/2 mm,respectively for drift/transfer1/transfer2/induction (fig. 7), with the cathodebeing the innermost electrode.
4.1.1 Construction
A special manufacturing technique has been developed to obtain cylindricalGEM electrodes, as shown in fig. 10 At first three GEM foils are glued to-gether to obtain the single large foil needed to make a cylindrical electrode.We used an epoxy (Araldite), applied on one of the short sides of the GEMfoil, on a 3 mm wide region (fig. 10 top-left). Then the foil is rolled on analuminum mould coated with a very precisely machined 400 µm thick Teflonfilm which provides a non-stick, low friction surface (fig. 10 top-right). Fi-nally the mould is inserted in a vacuum bag where vacuum is made with aVenturi system, resulting in a uniform pressure of 0.8 Kg/cm2 over the wholesurface of the cylinder (fig. 10 bottom-left). At this stage, two fiberglassannular rings are glued on the edges of the electrode, acting as spacers forthe gaps and providing all of the mechanical frames needed to support thedetector. After the curing cycle of the glue, the cylindrical electrode is easily
18

Figure 10: The various steps of the construction of a cylindrical GEM. Seethe text for the description.
extracted from the mould thanks to the Teflon surface (fig. 10 bottom-right).Cathode and anode are obtained with the same procedure as well.
The cylindrical cathode The cathode is realized as a unique polyimidefoil, 100 µm thick, with a copper cladding of 18 µm on the internal surface.All the support mechanics of the chamber is composed by annular flangesmade of Permaglass (G11) placed on the edges of the cylinder. These flangeshouse the gas inlets and outlets and their thickness defines the distance be-tween the various electrodes.
The GEM foils Three 352x320 mm2 foils are spliced together in order torealize one single prototype electrode. For a safe detector operation the foilhas independent high voltage sectors, in order to limit the capacitance andhence the energy released through the GEM hole in case of discharges. Each
19

foil has 20 sectors, with an area of about 56 cm2, corresponding to a widthof 1.6 cm for the single sector.
Figure 11: The GEM obtained as a join of three foils. The dimensions are960x352 mm2.
The anode readout Also the anode is realized as a splicing of three foils(fig. 11), each with the readout copper strips and the ground. The copperstrips surface and the ground surface are placed on the opposite faces of twodifferent polyimide foils, staggered and glued together. This avoids disconti-nuities in the readout strips and preserves the pitch value across the overlapregion. In order to bring out the signals, the strips end-up in polyimideflaps (see fig. 12), each grouping 32 strips, where the FEE is plugged withZIF connectors. The pitch of the strips is 650 µm in the readout zone andprovides a σ ≃ 200 µm spatial resolution,when equipped with a digital read-out, fulfilling the KLOE-2 requirements. In the flaps the pitch is reduced to500 µm in order to match the pitch of the connector.
Assembly of the detector The five electrodes are extracted from themoulds by using a PVC ring, bound with pins to one of the annular flangesof the cylinder, and then are inserted one into the other. To accomplish theinsertion of the electrodes without damaging the GEMs, a dedicated toolhas been realized: the Vertical Insertion System (fig. 13). The electrodes arefixed on two aluminum plates aligned on a vertical axis, and one is pulleddown with a very precise linear bearing equipment.
20

Figure 12: The anode with the strips for the readout and the flaps for thebonding of the FEE.
Figure 13: Two electrodes fixed on the vertical insertion system used toassembly the detector.
21

Figure 14: The chamber mounted on the support system and stretched. Thetension is measured by the load cell on the right end.
After the assembly of all the electrodes, the detector has been sealed onboth sides, mounted on a support system and longitudinally stretched witha tension of 200 g/cm (∼100 kg of overall tension) measured by a load cell(see fig. 14).
4.1.2 X-ray test
The very first test of the CGEM prototype was performed using a X-rayssource. The prototype was flushed with a gas mixture of Ar/iC4H10/CF4 =65/7/28 and tested in current mode with a 6 keV X-ray gun. A 10x10 cm2
planar GEM was placed in the same gas line and irradiated from a sideopening of the gun. It was used as a reference to account for possible gainvariations due to changes in atmospheric variables. We estimate that weoperated the CGEM prototype at gains larger than 104. In order to charac-terize the CGEM detector and to find the optimal operating parameters, therelative gain with respect to the reference was measured as a function of thedifferent electric fields in the GEM. The first two plots of fig. 15 show theelectron transparencies (defined as effective gain normalized on its maximumvalue) as a function of the drift and the transfer fields: this is a measurementof the focusing efficiency of the electrons into the three GEM foils. The thirdplot of fig. 15 shows the charge sharing between the bottom surface of thethird GEM and the anode readout, as a function of the induction field: thisis a measurement of the extraction efficiency from the last GEM foil. Thesum of the two charges is also shown (red and blue triangle on the third plot);no dependence from the induction field is observed. All the measurements
22

Figure 15: Relative gain as a function of drift field (left), transfers fieldsT1 and T2 (center) and induction field (right) of the CGEM with respectto the planar reference chamber. All the electric fields not involved in eachmeasurement are kept at constant values.
have been performed with a CGEM polarization of 375/365/355 V and arein good agreement with previous results found in literature.
floa
t H
V s
ecto
r on
gem
3
floa
t H
V s
ecto
r on
gem
1
gem
joi
nt
gem
joi
nt
gem
joi
nt
position
a.u.
0
0.5
1
1.5
2
2.5
3
2 4 6 8 10 12 14 16 18 20 22 24 26 28 30 32 34 36 38 40 42 44 46 48position
a.u.
0
0.5
1
1.5
2
2.5
3
2 4 6 8 10 12 14 16 18 20 22 24 26 28 30 32 34 36 38 40 42 44 46 48
Figure 16: CGEM gain uniformity (left) and induction gap thickness unifor-mity (right). Excluding sectors with intrincically weaker response (e.g. gemjoints), both measured values have R.M.S. within 9%.
The uniformity of the CGEM has also been measured over the 940 mmof its circumference (fig. 16). The fluctuations (R.M.S.) of the measuredcurrents were within 9%, showing a good uniformity on such a large surface.Since the ratio between the current on the bottom side of the third GEM andthe read-out electrode depends only on the applied induction field, we werealso able to measure the uniformity of the induction gap thickness. The resultindicates that the detector construction was realized with good mechanicalprecision.
23

4.1.3 CGEM test beam at CERN
The CGEM prototype was also extensively tested with the 10 GeV pion beamat the T9 area of CERN PS [23]. Two different read-out devices were used:128 channels were equipped with the GASTONE ASIC, while 96 channelswith the CARIOCA-GEM electronics.
GASTONE is a custom chip, developed to fulfill the low-power consump-tion and high integration requirements of the KLOE-2 experiment. Its firstrelease was tested during the test beam [24]. Results of this test are reportedin sec. 6.1.1.
The CARIOCA-GEM chip, instead, has been developed for the LHCbMuon System GEM detectors. CARIOCA is a very fast chip (10 ns peakingtime) with digital readout and has been used to measure the timing perfor-mance of the detector, coupled to a 100 ps resolution TDC.
The CGEM was flushed with a Ar/CO2 ( 70/30) gas mixture and oper-ated with the following voltages: Vfields = 1.5/2.5/2.5/4 kV/cm and VGEM
= 390/380/370 V (∑
VG = 1140V, corresponding to a gas gain of 2×10⁴).
Figure 17: An event display example illustrating the tracker setup. Two setswith 3 planes of drift tubes (20 channels in total) are placed in front andbehind the CGEM to measure the Y coordinate.
The track position was measured with an external tracker based on AT-LAS drift tubes with 30 mm diameter and 0.4 mm wall thickness. Thesetubes were operated with a 100 µm wire diameter, in streamer mode, usinga gas mixture Ar/C4H10 : 40/60 at STP.
The tracker consisted of two sets of longitudinal stations, each with 8channels arranged on 3 planes, placed in front and behind the CGEM pro-totype and providing a measurement of the Y coordinate (see fig. 17). Only
24

tracks with on-time hits in each of the 6 tracker planes have been used forthe analysis.
The contribution to the spatial resolution due to the external tracker wasmeasured to be σtracker= 140µm. The setup also included a trigger built witha coincidence of three scintillators placed before and after the CGEM.
The reconstruction procedure had to take into account the fact that themeasured particles do not generally cross the detector along the radius ofthe cylinder i.e. along the drift lines inside the gems. This is shown infig. 18. The effect increases moving from the center of the cylinder outwards,and affects both the position resolution and the strip cluster size. For eachreconstructed track an offset is calculated, based on the impact position ofthe track, thus allowing to correct the reconstructed position (see fig. 19 left).
Figure 18: Radial tracks follow drift lines of electrons inside the GEM andpass the readout plane at the same position where the charge collection takesplace. Non-radial tracks do not follow drift lines and the measured positionon the readout plane is shifted with respect to the impinging position ofthe track (offset d). Moreover cluster created in the conversion zone are notdistributed along the drift lines and are collected on several different readoutstrips thus increasing the cluster size.
Ionization clusters created in the conversion zone by non-radial tracksare not distributed along the drift lines and are collected on several different
25

Track impact position [mm]-40 -20 0 20 40
Res
idua
ls
[m
m]
-10
-5
0
5
10
Track impact position [mm]-40 -20 0 20 40
Res
idua
ls
[m
m]
-10
-5
0
5
10
Figure 19: GEM residuals as a function of the track impact point before (top-left) and after (bottom-left) the correction factor for the non-radial tracks.Cluster multiplicity (right) as a function of the track position shows the effectof the offset.
readout strips. This effect leads to an increase of the cluster size as a functionof the track impact point in the Y coordinate (see fig.. 19 right). For radialtracks (i.e. Y=0) an average cluster multiplicity of 1.8 has been measured.
Fig. 20 shows the efficiency of the chamber measured for different posi-tions of the impact track, with the GASTONE chip threshold set at 3.5 fC.The efficiency averaged over the whole equipped region is 97.7%. The lowstatistics points are due to a lack of reconstructed tracks in proximity of thewalls of the drift tubes (30 mm diameter). An efficiency of 99.6% is obtainedwhen rejecting these points.
In order to produce large area GEM foils, one needs to glue togetherdifferent smaller area GEMs (see sec. 4.1.1); this technique may lead to apossible loss of efficency of the detector in the overlapping region, whichneeds to be well studied and understood. In the final detector design, thisregion accounts for less than 0.4% of the total CGEM foil. In order toinvestigate this effect, we studied the time distributions obtained using theCARIOCA-GEM chip, readout by a 100ps resolution TDC and with gasmixture Ar/CO2 (70/30) with drift velocities Vd = 7 cm/µs at 2 kV/cm(approximately 10 clusters in 3 mm). Time distributions in non overlapping(regular) regions and in the joint zone are shown, respectively in fig. 21 leftand right. In the regular region a 13 ns RMS is obtained, in agreement
26

Figure 20: Left top: Distribution of reconstructed (black) and measured (red)impact track position; left bottom: efficiency as a function of the impact trackposition; right: detail of the efficiency in a high statistics region.
Figure 21: Time distributions in regular regions (left) and in the joint zone(right).
with the performance expected for the gas mixture in use. In the jointzone the spectrum is much broader, with a 200 ns RMS. In particular thesignals are delayed up to 800 ns, suggesting that a longer drift path had
27

to be followed to reach the anode. Ionization electrons originating froma track passing through an overlap region, drift along the distorted fieldlines, are then efficiently driven and focused in the multiplication holes ofthe GEM and finally are picked up by the anode with longer collection time.Such hypothesis has been confirmed by simulations studies using ANSYS andGARFIELD, showing a distortion of the field lines in the glueing regions, dueto a space charge effect on the dielectric (fig. 22 left).
Fig. 22 right shows the residuals of the clusters position with respect tothe reconstructed position of the track. If the contribution of the trackerresolution ( σtracker= 140µm) is subtracted, the GEM spatial resolution is
found to be σGEM =√
σ2residuals − σ2
tracker ≃ 200µm. This is in good agree-ment with what expected from a digital readout of 650 µm pitch strips. In
Figure 22: Left: Distortion of the field lines in the gluing region (GARFIELDsimulation). Right: CGEM resolution.
conclusion, the full scale prototype was safely operated at CERN PS with 10GeV pion beam. This test successfully validated the innovative idea of thefully sensitive cylindrical GEM detector, constructed with no support framesinside the active area.
The material budget used in the construction of the CGEM prototypeand the the measured spatial resolution are fulfilling the inner tracker re-quirements.
28

4.2 Planar GEM for readout studies
A typical orthogonal X-Y readout can not be used for the IT, due to its cylin-drical geometry. However, a 2-D readout can still be obtained making use of650 µm pitch XV patterned strips at an angle of 40 (see sec.5.3.2). The X-Yand X-V readouts are shown in figs. 23 and 24. The investigation of possi-
Figure 23: Pictures of the 2D-read-out: (Left) X-Y strips and (Right) X-Vstrips
Figure 24: Picture of assembled triple GEM plane with X-V readout (left),schematic details of X-V readout design (right).
ble problems correlated with this specific arrangement (e.g. charge sharing,grounding, cross-talk) required a dedicated test. Moreover, the effects of theKLOE magnetic field on the cluster formation and electronics readout haveto be studied. During the previous KLOE data taking, the magnetic fieldwas set at 0.52 T. For the future, in order to improve the acceptance for low
29

momentum tracks, the option to run at a reduced magnetic field value, e.g.0.3 T, is also under consideration.
4.2.1 Operation in magnetic field
The presence of a magnetic field affects the drift motion of electrons producedby ionization in the gas, thus influencing the position reconstruction of pri-mary particles. All the charged particles involved in the ionization process ex-perience the Lorentz force and consequently their drift path increases. Sincethe Lorentz force depends on the velocity, the effect is larger for electronsrather than for ions. The Lorentz angle is given by tanαL = |v
(
~E)
|·| ~B|/| ~E|;its knowledge for each GEM gap is used to evaluate the systematic shift ofthe collection area of the electrons from the track of the incoming particle.Because of the non-linear dependence of drift velocity from electric field inmany gas mixtures, a comparison between simulation results and direct mea-surements is needed. The simulation has to take into account all the featuresof the gas mixture, such as the diffusion and Townsend coefficients.
diffxEntries 3389
Mean -695.2
RMS 206.9
/ ndf 2χ 79.49 / 85
Constant 2.3± 105.5
Mean 3.5± -693.1
Sigma 2.6± 200.4
X coordinate (microns) -1600 -1400 -1200 -1000 -800 -600 -400 -200 0
Ent
ries
0
20
40
60
80
100
120
diffxEntries 3389
Mean -695.2
RMS 206.9
/ ndf 2χ 79.49 / 85
Constant 2.3± 105.5
Mean 3.5± -693.1
Sigma 2.6± 200.4
Electrons diffusion along X coordinate on the anode plane
Figure 25: The magnetic field effect in ArCO2 70 : 30 on a single track simu-lated with GARFIELD(left). Position distribution of the collected charge onthe X coordinate with the Lorentz shift simulated with GARFIELD (right).
We use a finite elements method in ANSYS program to simulate the cham-ber, set all the desired voltages and choose a gas mixture. The GARFIELDprogram simulates the electron drift through the chamber in presence ofmagnetic field, according to the transport properties of the gas mixture, as afunction of the electric field computed by MAGBOLTZ. Fig. 25-left shows thedeflection of electrons produced by a minimum ionizing particle in the dif-
30

E field (kV/cm)1 2 3 4 5 6
Ang
le (
degr
ees)
5
6
7
8
9
10
70:302 and E for ArCOdrift
Angle between v
E field (kV/cm)0 1 2 3 4 5 6
s)µD
rift v
eloc
ity (
cm/
1
2
3
4
5
6
7
8
9
70:302
Drift velocity for ArCO
Figure 26: Lorentz angle αL (left) and drift velocity (right) for the ArCO2
70 : 30 mixture as a function of the electric field.
E field (kV/cm)10
Tow
nsen
d co
effic
ient
(1/
cm)
1
10
210
310
70:302Townsend coefficient for ArCO
E field (kV/cm)0 1 2 3 4 5 6
m/c
m)
µD
iffus
ion
coef
ficie
nt (
120
140
160
180
200
220
240
260
70:302
Diffusion along X axis for ArCO
Figure 27: First Townsend coefficient (left) and the diffusion coefficient alongthe electric field for the ArCO2 70 : 30 mixture as a function of the electricfield.
E field (kV/cm)0 1 2 3 4 5 6
m/c
m)
µD
iffus
ion
coef
ficie
nt (
120
140
160
180
200
220
240
260
70:302
Diffusion along Y axis for ArCO
E field (kV/cm)0 1 2 3 4 5 6
m/c
m)
µD
iffus
ion
coef
ficie
nt (
100
120
140
160
180
200
220
70:302
Diffusion along Z axis for ArCO
Figure 28: Diffusion coefficient orthogonal (left) and parallel (right) to themagnetic field for the ArCO2 70 : 30 mixture as a function of the electricfield.
ferent GEM gaps (three dashed lines), obtained with a 0.5 T magnetic fieldorthogonal to the electric fields. The displacement of the collected charge
31

with respect to the entry position of the track can be evaluated using thissimulation. For B=0.5 T and for the standard working point of the chamber,we obtained an offset |∆x| = 0.693 mm, as shown in fig. 25-right.
To study the properties of the gas mixture in the magnetic field we per-formed detailed calculation of its transport properties in the electric fieldrange 102÷105 V/cm and the most relevant parameters are shown in figs. 26,27, 28. In the following section the results of the simulation have been com-pared with our measurements obtained with planar GEMs in a magneticfield.
4.2.2 Planar GEM test beam at CERN
A dedicated test was done at SPS-H4 North Area beam line at CERN [25].The H4 area is equipped with the GOLIATH magnet providing a field ad-justable from 0 to 1.5 T perpendicular to the horizontal beam-plane (X-Z).We used 150 GeV/c π+ beam.
The X-V readout (fig. 24 right) was tested with a tracking telescoperealized with five 10×10 cm2 planar triple-GEMs detectors with 650 µmpitch: four chambers were equipped with standard X-Y readout and thefifth with the X-V readout under investigation. In the following the X-V readout chamber will be referred to as the XV chamber while the X-Yreadout chamber as the XY chambers. The five detectors were equally spacedbetween each other, with the XV chamber placed at the center (see fig. 29).The entire setup was 1 meter long.
Figure 29: Setup of the test beam at CERN with planar chambers with2D-read-out.
The GEMs were partially equipped with 22 digital readout GASTONEboards, 32 channels each, four on each XY chamber and six on the XV cham-ber. This was enough to fully cover the area illuminated by the SPS beam.
32

The coincidence of 6 scintillators (3x3 cm2) read-out by silicon multipliersprovided the trigger signal for the acquisition.
We have used the same working point as for the CGEM prototype (sec.4.1.3):Ar/CO2 ( 70/30) gas mixture and operating voltages Vfields = 1.5/2.5/2.5/4kV/cm and VGEM = 390/380/370 V (
∑
VG = 1140V). The GASTONEthreshold was set at 3.5 fC.
In the presence of a magnetic field a displacement dx on the readout planemust be obserevd, due to the effect of the Lorentz force. The displacementis related to the direction of the electric field and, if the detector is rotated,the displacement also changes direction. We arranged the test-beam setupto be able to measure this effect (fig. 30).
Figure 30: Test beam setup and definition of the measured quantity.
All XY chambers in the tracking telescope were placed with the sameanode-cathode configuration while we reversed the XV chamber to cathode-anode arrangement. We aligned the setup with zero magnetic field (B=0T)to a few micrometer precision. In the presence of a magnetic field we recon-structed the track using only the four XY chambers. Since all four of themare subject to the same Lorentz force in the same direction, the reconstructedtrack will be shifted by the same offset dx with respect to the true track tra-jectory. The XV chamber with the reversed cathode-anode arrangement isaffected by the Lorentz force; since the electric field has opposite direction,the displacement inside this chamber is of the same magnitude (dx) butwith opposite direction. Hence the measurement of the total displacementbetween the track reconstructed by the XY telescope and the value measuredin the XV chamber is D = 2· dx. (See fig. 31).
33

Figure 31: Test beam setup and definition of the measured quantity.
The displacement dx was measured for 5 values of the magnetic fieldand found in good agreement with the value obtained from the GARFIELDsimulation at B=0.5 T (sec.4.2.1). See fig. 32. Such effect will be properlytaken into account in the reconstruction procedure.
Figure 32: Displacement dx as a function of the magnetic field. The bluepoint comes from simulation results with GARFIELD presented in section4.2.1.
To study the XV chamber performance, we measured the position reso-lution defined as the sigma value from the gaussian fit to the residual plot ofthe XV chamber. The resolution obtained as a function of the magnetic fieldis shown in fig. 33 together with examples of residual plots at B=0 T andB=1.35 T. There is a clear effect on the resolution with increased magneticfields, due to the Lorentz force, which on our test-beam setup affects the Xcoordinate only.
The resolution on the X coordinate ranges from 200 µm at B=0 T up to380 µm at B=1.35 T. The Y coordinate is obtained from the crossing of both
34

X and V strip readout as Y = tan(50)×X + V/cos(50) and shows a ∼370µm resolution, in agreement with what expected from the digital readout ofthe two views.
Magnetic field (T)0 0.2 0.4 0.6 0.8 1 1.2 1.4
Res
olut
ion
X
(m
m)
0
0.05
0.1
0.15
0.2
0.25
0.3
0.35
0.4Resolution X vs magnetic field
Entries 19609
Constant 19.8± 2041
Mean 0.00269± -0.03705
Sigma 0.0024± 0.3688
mm-4 -2 0 2 4
0
200
400
600
800
1000
1200
1400
1600
1800
2000
2200Entries 19609
Constant 19.8± 2041
Mean 0.00269± -0.03705
Sigma 0.0024± 0.3688
Y residuals for X-V plane B = 0T
mµ = 370 Yσ
Figure 33: (Top:) Residuals in the X view on the plane with X-V readout,without magnetic field (left) and with 1.35T field (right). (Bottom:) Resolu-tion on the X coordinate as a function of the magnetic field (left). Resolutionon the Y coordinate with indicated the corresponding value on V coordinate(right).
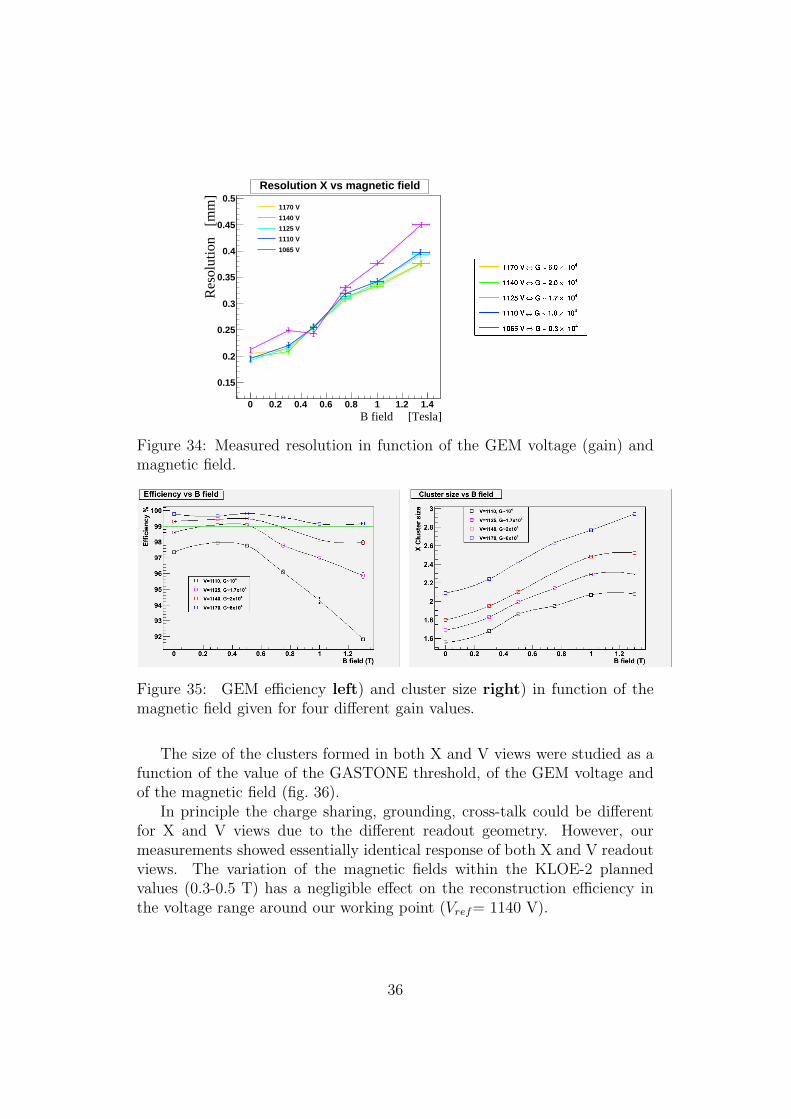
We have also measured the position resolution as a function of the GEMvoltage (gain). (See fig. 34) It is stable in a rather broad range fof the voltagesettings around to the nominal value; an appreciable decrease can actuallybe observed only for values much below the nominal, corresponding to gainsG∼0.3×10⁴.
The performance of the front-end chip GASTONE have been studiedmeasuring the cluster size and the reconstruction efficiency, defined as thepresence of a cluster in the XV chamber when a candidate track was re-constructed using four XY chambers. GEM efficiency and cluster size weremeasured as a function of the magnetic field and of the GEM voltage (fig. 35).The efficiency for the nominal KLOE B field value and voltage settings wasmeasured to exceed 99%, slightly decreasing at higher B fields.
35
B field [Tesla]0 0.2 0.4 0.6 0.8 1 1.2 1.4
Res
olut
ion
[m
m]
0.15
0.2
0.25
0.3
0.35
0.4
0.45
0.5Resolution X vs magnetic field
1170 V
1140 V
1125 V
1110 V
1065 V
Figure 34: Measured resolution in function of the GEM voltage (gain) andmagnetic field.
Figure 35: GEM efficiency left) and cluster size right) in function of themagnetic field given for four different gain values.
The size of the clusters formed in both X and V views were studied as afunction of the value of the GASTONE threshold, of the GEM voltage andof the magnetic field (fig. 36).
In principle the charge sharing, grounding, cross-talk could be differentfor X and V views due to the different readout geometry. However, ourmeasurements showed essentially identical response of both X and V readoutviews. The variation of the magnetic fields within the KLOE-2 plannedvalues (0.3-0.5 T) has a negligible effect on the reconstruction efficiency inthe voltage range around our working point (Vref= 1140 V).
36

Figure 36: (Left) Threshold scan: efficiency (Top) X cluster size (Middle)V cluster size (Bottom); (Right) Voltage and magnetic field scan: efficiency(Top) X cluster size (Middle) V cluster size (Bottom).
4.3 Large area GEM
The GEM technology was born at CERN and CERN is still the main pro-ducer of GEM foils. Presently the size of the foils manufactured at the CERNEST-DEM workshop [19] is limited to 450 × 450 mm2. Such a limitationarises from two different reasons:
1. the raw material presently used for GEM foils is the Novaclad G2300from Sheldahl, a polyimide (kapton) foil with an adhesiveless copper
37

cladding on both sides. This material is normally provided in 457 mmwide rolls. Considering the space needed for the handling of a foil,450 mm is a limit for one dimension. Rolls as large as 514 mm areavailable from the same company, but are non-standard and should beordered in bulk. Anyhow this option could be considered when largeproduction of detectors is foreseen.
2. the manufacturing of GEM foils is based on the photolithographic pro-cess commonly employed in the printed circuit industry: the hole pat-tern is transferred by UV-exposure from transparent masks to photore-sistive layers deposited on both sides of the raw material. The foil isthen etched in an acid bath, which removes copper from the holes leftin the photoresist. Since the hole has a diameter of 70 µm, the twomasks have to be aligned with a precision of few µm, not a trivial goalto meet as the area increases. With the present plastic masks, 450 mmis considered a limit to preserve the homogeneity and the quality of thehole geometry.
4.3.1 Single-mask procedure
In order to overcome the size limitation due to the troublesome alignmentof the two masks, and thus fulfilling the demand of large area foils from aconsistent part of the GEM community, a single-mask procedure has beendeveloped by the CERN EST-DEM workshop together with the Gas DetectorDevelopment (GDD) group of CERN [26]. It is schematically highlighted infig. 37.
a) the raw material is a polyimide foil (kapton) 50 µm thick, with a double-sided 5 µm copper cladding;
b) a photoresist layer is laminated on both surfaces; a lithographic maskwith the pattern of the holes is placed on the top face of the foil andexposed to UV light;
c) the top metal is etched while the bottom metal is protected where thephotoresist layer is still present;
d) the polyimide is etched all through from top;
e) using the polyimide as a mask, the hole is opened by etching the bottommetal; the top metal is actively preserved from etching as it is biased
38

Figure 37: Schematic procedure for fabrication of a single-mask GEM. Seethe text for detailed description.
to a more negative voltage with respect to the chemical bath, workingas the cathode of the electrochemical cell and thus being protected 2.
At the end of this process the shape of the hole is still slightly conicalwith a top diameter of 70 µm and a bottom diameter of 60 µm. This hasto be compared with the usual double-conical shaped hole obtained with thedouble-mask procedure, with diameters of 70-50-70 µm, respectively for top,middle and bottom parts of the hole.
4.3.2 Measurements
To characterize the new foils, two identical 10 × 10 cm2 Single-GEM cham-bers have been assembled: one with single-mask foil and one with the stan-dard foil, used as a reference. The two detectors have been put on the samegas line and flushed with Ar : CO2 = 70 : 30. They have been simultaneouslyirradiated with a 6 keV X-rays gun and tested in current mode.
At first the single-mask foil has been mounted in a bottom-open config-uration, i.e. with the larger section of the holes facing the anode. Then thefoil has been turned , in a top-open configuration, i.e. with the larger sectionof the holes facing the cathode. In the following these two configurations willbe referred to as 60-70 and 70-60, respectively.
Fig. 38-left shows the electron transparency as a function of the driftfield. The single-mask foil exhibits a different behavior depending on the
2This technique, called “Cathodic protection”, is commonly used for example to protectoil pipes from corrosion
39

Edrift (kV/cm)0 1 2 3 4 5
Edrift (kV/cm)0 1 2 3 4 5
Tra
nspa
renc
y
0.55
0.6
0.65
0.7
0.75
0.8
0.85
0.9
0.95
1
GEM 70-50-70
Single-Mask GEM 60-70
Single-Mask GEM 70-60
Einduction (kV/cm)0 1 2 3 4 5 6
Einduction (kV/cm)0 1 2 3 4 5 6
Cha
rge
Sha
ring
0
0.2
0.4
0.6
0.8
1
1.2
1.4
1.6
GEM 70-50-50 AnodeGEM 70-50-50 GDownSingle-Mask GEM 60-70 AnodeSingle-Mask GEM 60-70 GDownSingle-Mask GEM 70-60 AnodeSingle-Mask GEM 70-60 GDown
Figure 38: Left: Electron transparency as a function of the Drift field. Right:Charge sharing between bottom surface of the GEM and anode as a functionof the Induction field. The equal sharing values are 4.6 kV/cm, 5.2 kV/cmand 5.7 kV/cm respectively for 70-60, 70-50-70 and 60-70 hole configurations.
VGEM (V)360 380 400 420 440 460
VGEM (V)360 380 400 420 440 460
Nor
mal
ized
Gai
n
210
310
GEM 70-50-70Single-Mask GEM 60-70
Single-Mask GEM 70-60
Figure 39: Gas gain in Ar : CO2 = 70 : 30.
orientation: in the 60-70 configuration the full focusing efficiency is reachedfor a higher value of the field with respect to the other two configurations.
In fig. 38-right the charge sharing between the bottom surface of theGEM and the anode is plot as a function of the induction field. It is commonpractice to choose the equal sharing point as a reasonable operating value forthe induction field. The equal sharing values are 4.6 kV/cm, 5.2 kV/cm and5.7 kV/cm respectively for 70-60, 70-50-70 and 60-70 hole configurations. Aclear dependency of this parameter from the GEM orientation can be seen.
In fig. 39 the gas gain of the GEM is shown as a function of the voltagedrop between the two faces of the foil. The gain of the new GEM is 20÷30%smaller with respect to the standard one, meaning that additional 10÷20 Vmust be applied in order to operate the new chamber at the same gain of the70-50-70 configuration.
40

4.3.3 Large planar prototype
The CGEM prototype was limited in size since the single-mask technologyfor the manufacturing of the large foils was not yet available at that time.Now that the procedure has been finally established, we are building a largearea planar detector (300 × 700 mm2) to test the gain uniformity of a single-mask GEM over the same surface needed for the construction of the InnerTracker (fig. 40). For this purpose, a dedicated special tensioning tool hasbeen realized (fig. 41). ANSYS simulations indicate that even on such alarge area, with a tension of 1 kg/cm the maximum sag due to combinedgravitational and electrostatic effects is only 20 µm.
Figure 40: The project for the large area planar GEM prototype.
Figure 41: Tensioning tool for large area GEM foils.
41

5 Mechanics and construction
The Inner Tracker will be composed by five concentric layers of CGEM de-tectors (fig. 42), as described in section 3.1. The technology used to buildthe cylindrical electrodes does not require the presence of internal frames asa support and therefore allows us to realize an intrinsically dead-zone-freedetector. Actually, since the shape of the detector is cylindrical, the typicalsag of the electrodes is negligible: < 5 µm for an overall stretching mechan-ical tension of ∼ 50 kg applied at the ends of the detector.
Figure 42: (Left) Inner Tracker Global view
The detector construction will be entirely carried out in a class 1000 cleanroom: it is a clean procedure and protective clothings will be always worn.The clean room will include:
• the storage areas for GEM and readout circuit foils and apart thosededicated to the storage of the fiber-glass components;
• the GEM testing areas, for optical inspection and HV test;
• the cleaning area for fiber-glass components;
• the planar and cylindrical gluing stations;
• the detector assembly area;
• the area for the final detector test: gas leak and HV test.
The closed detector will be then moved to the laboratory where it will betested first with X-rays, in current mode, and then with cosmics, after theinstallation of the front-end electronics.
42

5.1 Detector components
The design of the detector components and construction toolings as well asthe choice of the materials originates both from the experience of the con-struction of the GEM detectors[27] of the LHCb Muon apparatus, and, morespecifically, for the construction of the full scale prototype of the CGEM[28, 29].In particular, the materials used for the CGEM were largely tested and val-idated for high-rate environments [30] and for different gas mixtures (Ar,i-C4H10, CF4, CO2 ) [31]. Such validations were performed with global largearea irradiation tests, with 1.25 MeV γ from a 25 kCi 60Co source at theENEA Casaccia, and with discharge tests performed at PSI with high inten-sity low momentum π-p particles fluxes on reduced beam spot area (∼ 15cm2). The general design and the construction procedure for each CGEM ofthe IT is substantially the same used for the realization of the full scale pro-totype. In fig. 43 is reported the global cross-section of the IT. As shown infig. 44 left the CGEM has the typical triple-structure of such a kind of micro-pattern gas detector. The gaps among the different electrodes of the detector(cathode-G1,G1-G2,G2-G3 and G3-anode) define the various regions of thedetector itself: drift (3 mm wide), transfers (both 2 mm wide) and induc-tion (1-2mm). The gas, supplied in open mode through the six gas inletsrealized on the Permaglass annular frame of the cathode, flows through theholes of the three GEM and then exits from the detector by the six outletsof the anode frame fig. 44 right. Frames are realized in Permaglass, a notstratified homogeneous composite material realized by the Resarm ltd (Bel-gium), that allows very precise and almost fibers- and spikes-free machining:a crucial feature against spurious discharges. The frames, glued at the edgeof the cylindrical electrodes outside their active area, define the various gapsof the detector. As successfully demonstrated by the full scale prototype, nosupport frames inside the active area of the detector are required for a safeoperation of the CGEM.The most relevant modification with respect to the prototype design is repre-sented by the embedded-anode, consisting of a very light honeycombed carbonfiber cylinder (CFC) on which the anode readout circuit is glued. The CFCacts as a rigid support for the whole detector layer.
A complete mechanical model of one of the IT layers has been realizedand includes: a prototype of the CFC with ∼300 mm radius and 360 mmlength; the annular flange (Service Flange-SF) foreseen as a support for theFEE cards, HV connectors and gas piping. The CFC has been realized at theRIBA srl (fig. 45 top-left). The SF prototype (fig. 45 top-right) made by theNuova Saltini srl company, is described in sec.6.4.1. The simulation studies
43

Figure 43: Inner Tracker Global cross section.
of the CFC deformation indicate that for an axial load of 600 kg applied tothe CFC the maximum radial displacement is about 70µm for the prototype
44

Figure 44: (Left) Detail of the CGEM structure. (Right) Detail of the gasinlets.
Figure 45: (Left) Carbon fiber cylinder prototype with the ”embedded-anode”. (Right) The annular frame for FEE support coupled with the carbonfiber cylinder.
dimension and 150 µm for a CGEM with the dimension of the first layer (upto 700 mm length). The applied load is well above the 100 kg overall loadrequired for good detector stiffness and negligible sag (<5µm) [32].
The buckling of the CFC is expected for an axial load of about 9 tons.The load tests have shown that the break-down of the CFC prototype occursat about 8 tons, well above the expected load on the final IT structure.The 700 mm long GEMs will be realized with the new single mask procedure,extensively discussed in sec.4.3, that allows large area foils to be build. Inorder to overcome the limit on the width of the raw material used for theGEM foils (453 mm maximum size), all the large electrodes of each layers ofthe IT will be realized by splicing three smaller foils: the gluing technique isthe same used for the construction of the prototype (planar gluing), exploit-
45

ing the vacuum bag technique for epoxy glue polymerization (sec.4.1.1). Theepoxy used for the foils splicing is the two components Araldite AY103 +Hardener HD991, with a curing and polymerization time, at ambient temper-ature, of about 1 hour and 12 hours respectively. The epoxy, largely tested inharsh radiation environment, is the same used for the assembly of the LHCbGEM chambers. The GEM foils as well as the XV strip-pad patterned anodereadout circuits and the cathode foils will be realized on the typical 50µmpolyimide foils as substrates, on the basis of our design, by the CERN EST-DEM Printed Circuit Board Workshop.In table 1 we summarize the materials used for the construction of the de-tector.Table 2 shows the material budget of a CGEM layer inside the active area.
Table 1: Materials used for the assembly of a CGEMMaterial Details Supplier/
ManufacturerEpoxy glue Araldite AY103 + HD991 Ciba Geigy(2 comp.) Ciba 2012 (for fast applications) Ciba GeigyAnnular frames 3/2/1mm thick Permaglass Resarm ltd (Be)CFC support CF(250µm)-Nomex(3mm)-CF(250µm) Riba srl (It)SF support 8mm thick Permaglass annular-flange Nuova Saltini (It)
for FEE/HV/gas-piping locationGEM foils 50µm thick kapton, 3-5µm Cu; EST-DEM CERN
70µm hole dia., 140µm hole pitch WorkshopCathode 3-5µm Cu on a 50µm thick kapton EST-DEM CERNAnode readout 3-5µm Cu on a 100µm thick kapton EST-DEM CERN
with XV strips-pad patternedGas pipes 4 mm out.-dia. brass tube LNF-workshopGas outlet 6 mm out.-dia. rilsan Pa11 tube Tesfluid srl (Italy)
(not hygroscopic)
5.2 Construction and tooling
The construction strategy and the toolings of the CGEM layers composingthe IT are the same used for the prototype.The main construction steps can be summarized as follows:
1. three GEM, as well as the anode and cathode, foils are preliminaryglued together in order to obtain a single large foil needed to realize
46

Table 2: Material budget for a CGEM layer detector (active area)Component times x material (X0) x quantity % of X0
3 GEMs Copper: 6× 2µm Cu (X0=14.3mm) ×0.8 0.067Kapton: 3× 50µm kapton (X0=286mm) ×0.8 0.042
Total: 0.1091 Cathode Copper: 1× 2µm Cu ×1 0.013
Kapton: 1× 50µm kapton×1 0.017Total: 0.030
1 Readout Copper: 1× 2µm Cu ×0.95 0.013anode Kapton: 2× 50µm kapton×1 0.034
Total: 0.0471 Shielding Aluminum: 1× 10µm Al(X0=89mm)×1 Total: 0.0111 Honeycomb NOMEX: 1× 3mm Nomex(X0=13125mm)×1 Total: 0.0232 CF skins CF: 2× 250µ CF(X0=250mm)×1 Total: 0.160
Total: 0.380
a cylindrical electrode. For this operation we exploit a precise Alcoaplane and the vacuum bag technique.
2. the large foil is then rolled on a very precise aluminum cylindrical mouldcovered with a 0.4 mm machined Teflon film for easy and safe extractionof the cylindrical electrode. The mould is then enveloped with the usualvacuum bag, and vacuum is applied for the glue curing time (about 12hours). In fig. 46 left the technical drawing of one of the 25 cylindricalmoulds needed for the IT construction is shown.
3. the final assembling of a CGEM layer is performed by means of theVertical Insertion System (VIS) fig. 46 right, a tool that allows a smoothand safe insertion of the cylindrical electrodes one after the other. Thesystem is designed to permit a very precise alignment of the cylindricalelectrodes along their vertical axis. The bottom electrode is fixed,while the top one is slowly moved downwards by a manually controlledstep-motor, coupled with a reduction gear system. The operation isperformed with the help of three small web-cameras, placed at 120degrees one to each other around the top cylindrical electrode, thusallowing the monitoring of the radial distance between the electrodes(2-3mm typically). The up-down rotation of the assembly tool allowsan easy sealing of the detector on both sides.
47

Figure 46: (Left) Technical drawing of the cylindrical mould. (Right) Iso-metric view of the Vertical Insertion System.
5.3 Material preparation & Quality Controls
Before the final assembly of the different parts of the detector, each compo-nent follows a well defined preparation procedure that generally includes aglobal optical inspection, a cleaning and an HV test. In particular for GEMsthe HV test is repeated at each construction step, in order to avoid the as-sembly of damaged GEM and to minimize the losses of precious components.
5.3.1 GEMs
GEMs are produced by the EST-DEM Workshop at CERN. A GEM foil real-ized for the construction of the full scale prototype is shown in fig. 47: clearlyvisible is the sectors structure realized on one side of the foil with the aimof reducing the energy stored and then released in case of discharge throughthe GEM hole. The sectors in this case were 1.6-1.8 cm wide and about 36cm long, resulting in a sector area of about 60-65 cm2, to be compared withthose of LHCb and Compass experiments respectively 80 and 90cm2 large.A first quality check is done at CERN by the producer: besides a globaloptical survey each sector is supplied with a voltage up to 500 V and checkedfor leak current that should be less than 5 nA. This test is performed in cleanroom at ambient temperature and relative humidity, that is without puttingthe GEM foil into a nitrogen flushed gas box.
48

GEMs are delivered inside a rigid clean plastic plates, each foil protectedbetween clean soft papers. They are identified with a ID-number: ”Z-type-XX”, ”Z” for the production batch, the ”type” identify the GEM (G1,G2or G3) and ”XX” indicates the progressive number inside the batch. In our
Figure 47: Detail of a large GEM foil.
laboratory they are stored in a dedicated cabinet inside the clean room andalways handled by operators suitable worn with clean clothings, facial mask,gloves and hat.GEMs do not require any special cleaning procedure, because in principlethey are clean: the only allowed cleaning procedure is done with a light ni-trogen flush that is generally used to gently remove possible dusts. Any otherprocedure can instead damage the GEM and then is strongly forbidden.A first optical inspection is done by eye to look for areas with possible de-fects, typically spots with unavoidable inhomogeneity in the material as localabsence of the metal and underlying kapton or lack of holes. A more care-ful optical inspection of these spots is then performed under microscope,equipped with a digital camera in order to evaluate the dimension and typeof the defect. Such defects have generally no consequences in the operatingbehavior of the GEM. For GEMs of the LHCb detector not more than 1defect with an area less than 1mm2 per each GEM sector were accepted.The HV test of a GEM is performed inside a gas tight box flushed withNitrogen, in order to reduce the humidity down to 10% Residual Humidity(time needed about 5 hours). The HV is applied individually to each sectorthrough a 500 MΩ limiting resistor, in order to avoid GEM damages in case
49

of discharges, while the non-sectored side is grounded. The maximum cur-rent in the power supply is set to 100 nA. The HV is slowly increased witheighteen steps up to a maximum of 600 V:
• from 0 to 400 V with 50 V steps of 20 seconds each;
• from 400 V to 500 V with 25 V steps of 60 seconds each;
• from 500 V to 600 V with 10 V steps of 2 minutes each.
The GEM sector pass the HV step if the current is less than 1 nA and no morethan 3 discharges occurred during the test time. In case these acceptancerequirements are not fulfilled the voltage ramp-up on the sector is suspendedand the test is repeated later on. For each sector the test has a duration ofabout 30 minutes. This figure, coming from our previous experience in LHCb,gives an estimate of about 600 hours needed to test (only with HV) the about1200 sectors foreseen for the IT, that become about 850 hours including thetime needed for nitrogen flushing (this must be done only about 50 times,once per GEM foil), corresponding to about 5.5 man-months.
5.3.2 Readout anode circuit
The readout anode circuit is manufactured by EST-DEM CERN Workshop,on the basis of our design, starting from the 5µm copper clad, 50 µm thickpolyimide substrate, the same used for GEM foils. The 650 µm pitch, 300µm wide X strips are parallel to CGEM axis, giving the rφ coordinates; whilethe V strips, realized connecting by vias a suitable pattern of parallelogramshaped pads, and forming an angle of about 40 degrees with respect the X-strips, gives the z coordinate.A first check to look for shorts between both coordinates is performed by theproducer. Connections test between pads and vias is also required.A useful test for anode readout validation consists of measuring the distancebetween first and last strip at different positions for both coordinates, requir-ing a maximum deviation from the nominal not exceeding 100µm.The readout anode circuits, as GEM foils, do not require any special cleaningprocedure: the only allowed cleaning procedure is done with a light nitrogenflush to remove possible dusts. Any other procedure can instead damage thecircuit and then is strongly forbidden. They are stored in a dedicated cabinetin the clean room and always handled by operators suitable worn with cleanclothings, facial mask, gloves and hat.
50

5.3.3 Annular frames
The annular frames, defining the gaps between electrodes, are 3 or 2mm(1mm) thick and 35 mm wide. They are made of Permaglass and they arethe only supports for the cylindrical electrodes. The cathode and anodeframes contain the gas inlets and outlets respectively.The frames delivered by the machine workshop before enter the clean roomare preliminary washed with isopropilic-alcohol and brush. A carefully op-tical inspection to find and eliminate spikes and possible broken fibers, isperformed before and after the final cleaning done in a ultra-sonic bath withdemineralized water for 30 minutes. After the cleaning the permaglass com-ponents are dried in a oven at 40 oC for 1 hours.An HV test to verify its insulating is done placing the frame in between twocopper foils put at 4 kV within a clean box flushed with nitrogen. If sparksoccur, the frame is flushed for a couple of hours and then tested again. Ifsparks still occur frames is inspected with a microscope. Generally if theframe is perfectly clean neither sparks nor dark current is observed.
5.3.4 Final tests on closed chamber
Once the chamber is closed we proceed with gas leakage test. The gas tight-ness is checked with a differential pressure device, a system that allows usto measure the gas leak as the fall of pressure as function of time. Thechamber to be tested and a reference volume (same volume of the chamberwith no leak, e.g. ≪ 1 mbar/day), flushed in parallel with an overpressureof few mbars (typically 5 mbars), are connected to the two sensors of thedevice. The reference volume allows us to take into account for atmosphericand temperature variations during the measurement that can lasts about 1hour. The difference between the two pressure measurements gives the gasleak rate of the chamber. All LHCb chambers [33] exhibit a gas leak of theorder of less than 2 mbar/day, corresponding to not more than 100 ppmV ofresidual humidity with a gas flux of 80 cc/min.The same system is also used to search for large gas leaks. In this case thechamber connected to the sensor is inspected with a gas flow all around thegluing regions: the possible sources of leak are easily detected as a suddenincrease of pressure, since the chamber is flushed through the hole itself. Theholes are then sealed applying locally the same glue used for the assembly ofthe chamber. After glue polymerization the gas leak test is repeated and thechamber is validated.The chamber is then taken out from the clean room and moved to the labo-
51

ratory where it is flushed with the Ar/CO2 (70/30) gas mixture and testedin current mode with X-rays in order to check the gain uniformity. Gainvariations of the order of 5-6% [33] are measured all over the active surfaceof the detector.
5.4 Detector integration
The study of the IT integration around the DAFNE interaction point (IP)must take into account the interferences between the IT and the internaltube of the Drift Chamber and with the CCal and QCal calorimeters thatare placed around the beam pipe [9].As shown in fig. 48, a radial distance of 20mm between the fifth layer of theIT and the internal surface of the DC is foreseen in order to facilitate thecritical insertion inside the DC of the integrated system constituted by thebeam pipe and detectors complex.The interference with CCal mainly concerns the routing of the calorimetercables that in the current design are foreseen to be embedded in the aluminumsupport tubes of the interaction region (IR) fig. 49 left.The isometric view reported in fig. 49 right shows the other critical regionbetween the IT ends and the two QCals surrounding the quadrupoles, wheregas piping, HV and signal cables of the IT (especially for the first layer) mustbe routed out.A very preliminary study of the integration sequence of the IT with the beampipe, CCal and QCal detectors is schematically shown in fig. 50.
52

Figure 48: Technical drawings of the integration of the detectors at theinteraction point.
53

Figure 49: Isometric views of detectors integration (Left) IT and CCal inte-gration (Right) IT and QCal integration.
Figure 50: Preliminary studies of the detector integration sequence.
54

6 Electronics
6.1 On-Detector Electronics
The IT will be readout by means of about 30000 XV strips.Due to the different length of the V strips the parasitic capacitance willrange between about 1 and 50 pF according to the position, making impossi-ble the S/N optimization by capacitive matching. Moreover, because of theGEM moderate gas gain (e.g. with respect to Wire Chambers), the front-endelectronics must be installed on the detector itself to maximize S/N ratio.Therefore both power consumption and I/O connections must be kept as lowas possible.
A further constraint concerns the KLOE DAQ timing: since the Level 1trigger is delayed of about 200 ns with respect to the Bunch Crossing (BX),the IT discriminated signals must be properly stretched to be acquired.
To fulfill the mentioned requirements a novel 16-channels front-end ASICprototype, named GASTONE (Gem Amplifier Shaper Tracking ON Events),has been developed. The sixteen channels ASICs have been used to readoutthe Cylindrical-GEM prototype in a test beam at CERN (sec 4.1.3).
As the chip prototype fulfilled the IT readout requirements, a second re-lease, including a robust protection circuit to prevent damages caused bydischarge effects in the detector [20], has been implemented. This featuresimplify significantly the layout of the front-end electronic boards, avoidingthe use of the classical, space-consuming, external protection network madeof resistors, diode and capacitors. The new chips have been used to instru-ment the Planar GEM detectors for the readout studies in a magnetic fieldperformed in the testbeam at CERN (sec. 4.2.2).
Finally a 64 channels prototype (fig. 51) has been designed and will be usedto instrument the 350x700 mm2 large planar GEM detector (produced withthe new single-mask technology) as final test of the GASTONE design beforemass production (about 700 chips).
6.1.1 The GASTONE ASIC
The final version of the GASTONE chip is a mixed analog-digital circuit,consisting of 64 analog channels followed by a digital section implementing
55

Figure 51: GASTONE 64 channels layout
the slow control and readout interface, as shown in fig. 52.The main features of GASTONE are the low input equivalent noise (ENC)
Figure 52: Gastone Block Diagram
in the detector capacitance range, the high modularity (to reduce the I/Olines) and the low power consumption. The modularity has been set to 64channels, as a compromise between the reduced number of I/O lines andthe overall system reliability (damaged devices can not be replaced as thedetector will be not accessible without extracting the beam-pipe).
The amplified and shaped signals are digitized and serially readout usingboth edges of a 50 MHz clock, achieving a 100 Mbps transfer rate. To avoidinterference between digital and analog sections, separate analog and digital
56

power supplies have been used and I/O signals have been implemented inthe LVDS standard. The readout clock will be active only in the downloadperiod (i.e. after the arrival of the Level1 trigger).Since the expected integrated radiation dose is quite low, the ASIC has beendesigned in the mature and relatively cheap AMS 0.35 CMOS technology.
Analog section Each channel is made of four blocks: a charge sensitivepreamplifier, an amplifier-shaper, a threshold discriminator and a monosta-ble. The charge sensitive preamplifier converts the input current signal intoa voltage while the amplifier-shaper provides further amplification and noisereduction. The discriminator generates the digital hit information which isthen stretched by the monostable so allowing the output signal to be sampledby the Level1 signal. The total power consumption of the analog channel is1 mW.
Preamplifier features Due to the relatively low charge amplification ofGEM devices [34], the expected input charge will range from few fC to sometenths of fC. The implemented amplifier should therefore combine a highcharge sensitivity with low noise level.The input charge amplifier (fig. 53) consists of a common-source cascadedamplifier with an active feedback network made of a 150 fF capacitor anda PMOS transistor (W/L = 1.5/10). The equivalent resistance is about 5MΩ for a bias current of 300 nA. The main preamplifier characteristics are:gain of ∼ 5 mV/fC @ CIN = 0 pF, non-linearity less than 1% (0÷30 fC)and supply current of about 350 µA. The input impedance is ∼ 120 Ω overa 105 Hz frequency range as shown in fig. 54. Table 3 summarizes the mainfeatures of the GASTONE preamplifier.
Table 3: Charge preamplifier main specifications
Feedback capacitance 150 fFFeedback resistance 5 MΩ @ Ifeedb = 300 nATrasconductance (gm) 6.4 mA/VGain 5mV/fC @ Cin = 0 pFZIN 120 Ω up to 105 HzNon-linearity ≤ 1 % (0÷30 fC)ENC (erms) 800 erms + 40 erms/pFSupply Current ≈ 350µA
57

Figure 53: GASTONE preamplifier
Figure 54: Preamplifier input impedance vs frequency (Ifeedback = 300 nA,IDCPRE = 350µA )
Shaper features The shaper provides semi-gaussian shaping for noise fil-tering and is characterized by a voltage gain of 4. The non-linearity is lessthan 3% with a supply current of about 200 µA. The measured peaking timeis between 90 and 220 ns for a detector capacitance ranging between 1 and50 pF. As shown in fig. 55(a), the overall preamplifier-shaper circuit has a
58
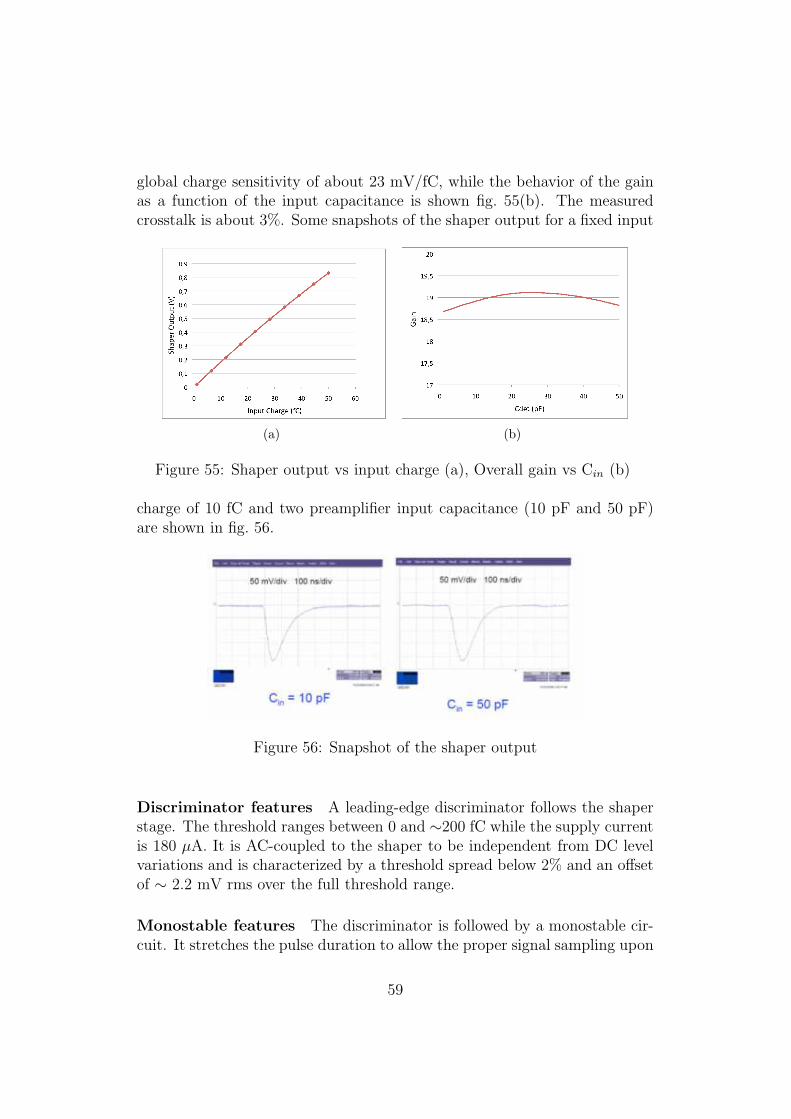
global charge sensitivity of about 23 mV/fC, while the behavior of the gainas a function of the input capacitance is shown fig. 55(b). The measuredcrosstalk is about 3%. Some snapshots of the shaper output for a fixed input
(a) (b)
Figure 55: Shaper output vs input charge (a), Overall gain vs Cin (b)
charge of 10 fC and two preamplifier input capacitance (10 pF and 50 pF)are shown in fig. 56.
Figure 56: Snapshot of the shaper output
Discriminator features A leading-edge discriminator follows the shaperstage. The threshold ranges between 0 and ∼200 fC while the supply currentis 180 µA. It is AC-coupled to the shaper to be independent from DC levelvariations and is characterized by a threshold spread below 2% and an offsetof ∼ 2.2 mV rms over the full threshold range.
Monostable features The discriminator is followed by a monostable cir-cuit. It stretches the pulse duration to allow the proper signal sampling upon
59

the arrival of the Lev1 trigger.The pulse width can be tuned between 200 ns and 1 µs. The range could
Figure 57: Discriminator input and monostable output with a 10 fC, 1 MHzinput signal rate
be modified by choosing different external bias resistors.The fig. 57, shows a snapshot of the monostable output. The maximum
input rate is about 1 MHz, that is about 3 order of magnitude higher thanthe maximum expected rate. The fig. 57 also shows the effects on the dis-criminator input signal level for a 10 fC at 1 MHz input preamplifier signal.The shift, produced by the pile-up effect, is about 10 mV (∼ 0.5 fC).
6.1.2 The Digital section
Readout Interface The digital section manages both the control logic forthreshold sensing/setting and the discriminated signal serialization for datareadout (fig. 58). The 50 MHz readout clock is active only after the arri-ving of Lev 1 trigger signal, then avoiding possible crosstalk with the analogsection. In the 16 channels prototype the digital section has been alreadyimplemented to manage the 64 channels of the final chip.
Upon the arrival of the Lev 1 trigger signal, the discriminated signals arestored into a 96-bits register according to the event frame described in tab. 4.The arrival of 50 MHz readout clock starts the data transmission procedurethat will last 960 ns (the readout circuit uses both edges of the clock signal).
The full digital section power consumption is about 40 mW and is domi-nated by the LVDS output drivers.
60

Figure 58: Digital section block diagram
Table 4: Gastone data transmission frameNumber of bits Name Description
8 Sync 10101010 synchronization receiver pattern2 START 11 (consecutive data precursor bits)5 TRIGGER NUM Trigger number9 CHIP ID chip identification64 CH DATA Transmitted data8 ZERO Ending transmission bits
Slow Control-SPI interface The Slow Control section of the chip is ma-naged by a SPI interface with a clock running at 1 MHz. It consists oftwenty-eight 8-bit registers (listed in tab 5) for configuring the chip function-ality, setting the four DACs threshold and reading back the four ADCs (16channels modularity). A fifth DAC/ADC is devoted to set/read the widthof the monostable output pulse and, finally, a sixth DAC/ADC allows toset/read the amplitude of the internal test pulse. The threshold is set to (∼3 fC) at power-on.An internal pulsing procedure has been implemented to inject a selectablecharge for calibration and test purpose. The chip also generate a global ORsignal that can be used in self-triggering applications.
61

Table 5: List of SPI registers
# BITS Content
8 Mask4 Threshold(1 threshold for 16 channels)1 Pulse amplitude (1 per 64 channels)5 Read back from 5 ADCs1 Test pulse configuration8 Test pulse result1 Control register
6.2 The 16 channels chip prototype
The 16 channels GASTONE prototype layout is shown in fig. 59. The chipoccupies a silicon area of 3.2 x 2.2 mm2 and has a power consumption of 0.6mA/ch. A custom Front-End Board (FEB) has been developed (fig. 60) tohost the chips. The board contains a passive network to protect the chipagainst possible spark events due to gas discharges and hosts two chips, fora total amount of 32 channels.The main features of the FEB (whose dimension are 30x95 mm2) are:
Figure 59: Layout of the 16 channels GASTONE chip
• 2 chips/board (32 channels)
• 2 independent LVDS serial data readout lines
• LVDS I/O for Slow Control/Reset/Trigger
• 16 chs OR output for self-triggering
• HW ID
62

Figure 60: Front-End Board developed to host the first release of the chip.It includes the protection circuit connected to the input pads of the chip.
6.2.1 Lab test result
Twenty-two chips have been produced in the run. All chips have been char-acterized by means of a dedicated test bench based on a custom VME boardimplementing both the SPI control and the readout protocol. An AgilentPulse Generator 81110A has been used to drive the charge injection used totest the devices.
Charge sensitivity and gain measurements The charge sensitivity overthe 16 channels of one chip (chip 0 / Board 0) is shown in fig. 61. A goodlinearity and uniformity over the various channels can be easily inferred.Doing the same measurements over the 22 chips (352 channels), an averagegain of 25mV/fC has been obtained (fig. 62).
ENC measurements The ENC directly measured on a triple-GEM 10×10cm2 prototype (fig. 63) is about 974 erms+ 59 erms/pF. The measured valuecorresponds to ∼ 0.63 fC for the longest strip and sets a minimum level of∼1.5 fC to the discriminator threshold. The difference between measuredand simulated values is due to the PCB lines and protection diodes parasiticcapacitance (between 5 and 10 pF).
Time-Walk The time response of the chip as a function of the input chargehas been measured for different thresholds. As expected, the time responseincreases as the charge approaches the discriminator threshold, because ofthe used leading edge technique. In fig. 64 the results obtained for Cdet = 10pF are shown.
63

Figure 61: Charge sensitivity (threshold vs input charge)
Figure 62: Gain distribution
6.3 Off-Detector electronics
The IT off-detector electronics is made of two sections. The first one (GA-STONE Electronics Off-detector - GEO) will be located just outside KLOEwith the aim of keeping the connections between the boards and the on-detector electronics as short as possible (about 3.5 m have been foreseen inthe final design); the second one (CONCENTRATOR) will be located on
64

Figure 63: Simulated and measured ENC distributions
the platform near the DAQ electronics (about 15 m apart). The connec-tions between the two sections will be implemented by means optical links,thus avoiding any trouble due to ground-loops and/or interference with otherreadout sections of the KLOE apparatus. A block diagram of the system isshown in fig. 65.
6.3.1 GEO boards
These boards, besides supplying low voltage to the on-detector electronics,provide full control over the GASTONE boards. More in detail, with theseboards it is possible to set/read the GASTONE chips internal registers, totest different sections of the chain (then implementing an efficient debugprocedure) and, finally, download the 64 bits data pattern if a Lev1 triggersignal is issued by the KLOE Trigger System. The board is foreseen workingtogether with the CONCENTRATOR board; anyway some local control ca-pability has been foreseen as well (Ethernet and USB) both to simplify thedetector setup procedure and to use the board as stand-alone DAQ system.
Fig. 66 shows the block diagram of the GEO board. The two main cir-cuit sections can be easily identified: the on-detector interface on the leftside and the DAQ interface on the right side.
The first prototype of the board is shown in fig. 67. A Xilinx Virtex4device has been used to manage both the Experiment Control System (ECS)
65

Figure 64: Time walk vs Qin at Cdet = 10 pF
Figure 65: Inner Tracker readout block diagram
path (through the embedded Power PC processor) and the DAQ path. Datatransmission to/from GASTONE boards has been implemented by means ofLVDS connections (on the left-side of the board), while communications withthe experiment DAQ and ECS systems have been implemented through twoseparate optical links (on the right side of the board). LVDS inputs havebeen foreseen to manage (if required) external signals.
66

Figure 66: GEO readout board Readout block diagram
The readout procedure is started as soon as the Lev1 trigger signal is issued.
Figure 67: GEO readout board prototype
As a consequence of the Lev1 signal detection the GEO board internal statemachine takes the following actions:
• propagates the Lev1 signal to the 468 sixty-four channels GASTONEchips to load the internal readout register with the 96 bits data frame;
• start the GASTONE boards readout procedure by delivering a 50 MHzreadout clock (effective data throughput is 100 Mbit/s as both sides ofthe readout clock are used).
Zero suppression on incoming data has been foreseen, as well, to reduce datatransfer size in case of low detector occupancy.
6.3.2 CONCENTRATOR board
As already said, the CONCENTRATOR boards (fig. 69) are located on theplatform, about 15 m far from the detector. All communications (Slow Con-trol, DAQ and Trigger) to/from the GEO boards are managed by theseboards (through optical links).
67
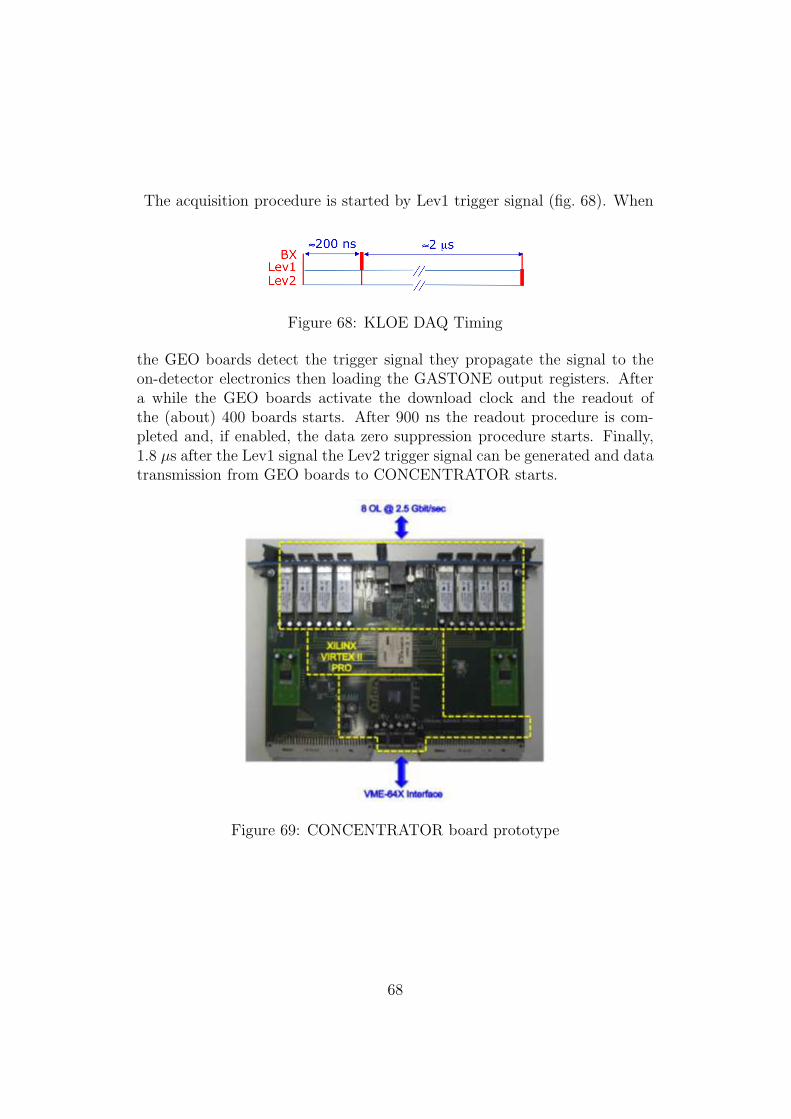
The acquisition procedure is started by Lev1 trigger signal (fig. 68). When
Figure 68: KLOE DAQ Timing
the GEO boards detect the trigger signal they propagate the signal to theon-detector electronics then loading the GASTONE output registers. Aftera while the GEO boards activate the download clock and the readout ofthe (about) 400 boards starts. After 900 ns the readout procedure is com-pleted and, if enabled, the data zero suppression procedure starts. Finally,1.8 µs after the Lev1 signal the Lev2 trigger signal can be generated and datatransmission from GEO boards to CONCENTRATOR starts.
Figure 69: CONCENTRATOR board prototype
68

6.4 HV and FEE integration
6.4.1 FEE Integration
The number of connections between the detector readout plane and the front-end electronics is a function of the layers diameters. As an example, for theinnermost layer there are about 3950 readout strips which are connected tothe same number of electronics readout channels.
The connections density and the cylindrical structure of the readout dic-tates the usage of a 120 pins/0.5 mm pitch connector (fig. 70) positionedparallel with respect to the detector z axis. The connector has two retentionplugs that allow a suitable fixation of the PCB to the mechanical supportand the connection to the electrode ground plane.
To define the front-end board pcb dimension constraints a 3-D mechanical
Figure 70: Front-end board connector
detector model has been implemented (fig. 71(a)). From the 3-D simula-tions a front-end board pcb maximum size of 60x40 mm2 has been inferred(fig. 71(b)).
The readout signals are extracted from both sides of the cylindrical elec-trode in such a way to obtain a symmetrical readout. Finally the electronicschannels have been arranged as described in tab.6 allowing the partition ofthe (cylindrical) readout electrode in three pieces covering 120 degrees each.
In the shaped far-end electrode protruded part ( see fig. 72), FR4 stiffnesssupports will be glued before soldering the front-end board input connectors.The stiffness support will be also used to fix the kapton foil to the cylindricalstructure support .
For each side of the readout electrode a support flange (fig. 73(a)), im-
69

(a) (b)
Figure 71: Detector 3-D model - front-end pcb insertion detail (a), PCB 3-Dmodel (b)
Table 6: Front-End and HV connector per side
Layer Number Radius(mm) FEE Connector per side HV Connector per side
for one 120o sector
1 136 18 42 158 21 73 180 24 74 202 27 75 224 27 7
Figure 72: Stiffness support and connectors glued into the Kapton foil
plemented by an annular cylinder, has been foreseen. The flange will allowto allocate both the stiffness and the nozzles (located on the opposite sideof the connector) used to hold the connector. Also the supports for the HVconnectors (placed at regular angles, taking into account the segmentation ofthe three GEM detector planes) will be glued to the structure. Finally, thetwo flanges will be glued to the layer support structure and to the readout
70

electrode
Once each layer is built and tested, the detector will be assembled by at-
(a) (b)
Figure 73: Front-end electronics support flanges (a), Detector structure (b)
taching layers together through suitable structure that will also allow thedetector placing on the beam-pipe (fig. 73(b)).In fig. 74 some details concerning the placement of HV connectors, front-endboards and gas connections for the 5 layers are shown.
Figure 74: Support structure detail : A - HV connectors, B - front-end boardsnozzles, C - gas connections
6.4.2 HV Integration
Each GEM foil has 20 independent HV sections. The relative connectionsare routed on the same kapton foil into terminal wings coming out from the
71

detector volume. These wings will be positioned on the front-end supportflange, underneath the FEE boards. The HV connectors are soldered andfixed on the same structure, as shown in fig. 75(a) and 75(b).
(a) (b)
Figure 75: HV connection detail (a), HV and front-end board assemblingdetail (b)
6.4.3 Assembling test
In order to test the assembling procedure a detector layer mock-up will bemanufactured, with the same dimensions and the same number of connectionsof the Layer 1, but with flanges on one side only (fig. 76).
Finally a thermal cycle test has been successfully carried out at 120 Cto validate the connector soldering and assembling procedure.
72

Figure 76: Test Layer Assembly
7 Time schedule and responsibilities sharing
The overall work program and schedule is summarized in fig. 77. It is dividedinto two main parts:
1. the finalization of the engineering design of the detector, including ten-ders, orders and materials delivery, that takes about 7.5 months;
2. the construction of the five layers, including QC/QA tests of the detec-tors, and the successive FEE installation, gas piping, HV connections,that will take less than 15 months.
In the schedule we also reported the sharing of responsibilities among theINFN groups historically involved in the R&D phase:
a) the Bari group will have in charge the production and testing procedureto validate FE electronics together with the design and construction ofthe support frames.
b) the Rome 1 group is responsible of the detector assembly system tool;
c) the LNF group, beside the overall supervision of the project, is respon-sible for the construction and QC tools, the GEM foil design, construc-tion and test of the detector.
Following our schedule, the final design of the IT started in September2009 and the detector will be completed and ready for the installation by theend of July 2011.
73

Figure 77: Time schedule
74

References
[1] F. Bossi,E. De Lucia,J. Lee-Franzini, S. Miscetti, M. Palutan and KLOECollaboration,Precision Kaon and Hadron Physics with KLOE,Rivista del Nuovo Cimento Vol.31, N.10 (2008).
[2] KLOE Collaboration, M. Adinolfi et al., Nucl. Instrum. Methods A 488(2002) 51.
[3] KLOE Collaboration, M. Adinolfi et al., Nucl. Instrum. Methods A 482(2002) 364.
[4] KLOE Collaboration, M. Adinolfi et al., Nucl. Instrum. Methods A 492(2002) 134.
[5] R. Beck et al, KLOE-2 collaboration, Expression of interest forthe continuation of the KLOE physics program at DAΦNE up-graded in luminosity and in energy, March 31, 2006, available athttp://www.lnf.infn.it/lnfadmin/direzione/roadmap/LoIKLOE.pdf .
[6] R. Beck et al, KLOE-2 collaboration, A proposal for the roll-in of theKLOE-2 detector, LNF-07/19(IR), INFN-LNF, Frascati, 2007.
[7] D. Babusci et al., Nucl. Instrum. Methods A, accepted for publication,doi:10.1016/j.nima.2009.09.110
[8] F. Archilli et al., Nucl. Instrum. Methods A, accepted for publication,doi:10.1016/j.nima.2009.06.082
[9] M. Cordelli et al., Nucl. Instrum. Methods A, accepted for publication,doi:10.1016/j.nima.2009.09.015
[10] Handbook on neutral kaon interferometry at a φ-factory, A. Di Domenicoed., Frascati Physics Series 43, INFN-LNF, Frascati, 2007.
[11] F. Ambrosino et al., KLOE collaboration, Phys. Lett. B 642 (2006) 315.
[12] A. Di Domenico and KLOE collaboration, Journal of Physics: Conf.Series 171 (2009) 012008.
[13] J. Bernabeu, N. Mavromatos and J. Papavassiliou, Phys. Rev. Lett.92 (2004) 131601. J. Bernabeu, N. Mavromatos, J. Papavassiliou andA. Waldron-Lauda, Nucl. Phys. B 744 (2006) 180.
75

[14] R.A. Bertlmann, W. Grimus and B.C. Hiesmayr, Phys. Rev. D 60 (1999)114032.
[15] F. Ambrosino et al. (KLOE Collab.), Phys. Lett. B 636 (2006) 173.
[16] F. Ambrosino et al. (KLOE Collab.), Phys. Lett. B 675 (2009) 283.
[17] M. Alfonsi et al., Nucl. Instrum. Methods A 50258 (2009) (in press)
[18] F. Sauli, Nucl. Instrum. Methods A 386 (1997) 531.
[19] CERN EST-DEM is the Design and Manufacture of Electronic Modules(DEM) Group of the Engineering Support & Technology Division (EST)http://ts-dep-dem.web.cern.ch/ts-dep-dem/
[20] S Bachmann, et.al., Nucl. Instrum. Methods A 479 (2002) 294
[21] A. Antonelli et al., KLOE notes n. 3 (1991), 23 (1992), 52 (1993).
[22] G. Bencivenni et al., Nucl. Instrum. Methods A 581 (2007) 221.
[23] G.Bencivenni et al., Performance of the cylindrical GEM prototype forthe Inner Tracker of KLOE2, NSS Conference Record 2008 IEEE.
[24] A. Balla et al., Nucl. Inst. & Meth. A 604 (2009) 23.
[25] G.Bencivenni et al., Status of the Cylindrical-GEM Project for theKLOE-2 Inner Tracker, NSS Conference Record 2009 IEEE.
[26] CERN Gas Detector Development (GDD) grouphttp://gdd.web.cern.ch/GDD/
[27] G. Bencivenni et al., Nucl. Instrum. Methods A 494 (2002) 156.
[28] G. Bencivenni et al., Nucl. Instrum. Methods A 581 (2007) 221. G. Ben-civenni et al., Nucl. Instrum. Methods A 572 (2007) 168.
[29] G. Bencivenni et al., NSS Conference Record, 2007 IEEE. Volume 6 pp4666-4670.
[30] P. de Simone et al., IEEE Trans. Nucl. Sci. 52 (2005) 2872.
[31] M. Alfonsi et al., Nucl. Instrum. Methods A 518 (2004) 106.
[32] L. Quintieri et al., Finite Element Model of the Cylindrical GEM Detec-tor as New Inner Tracker of Kloe2 and Mechanical Characterization ofthe Employed Materials, LNF-09/12(IR), INFN-LNF, Frascati, 2009.
76

[33] M. Alfonsi et al., NSS Conference Record, 2007 IEEE. Volume 6 pp4671-4676.
[34] M Benlloch, et.al. Further developments of the gas electron multiplier,CERN-EP-98-050 (1998).
77