tealthwatch system version elease otes issues known to exist in this release. ... notes: l this...
TRANSCRIPT

STEALTHWATCH® SYSTEM VERSION 6.9.0 RELEASE NOTESThis document provides the following information:
l What's New l Fixes for issues reported by customers in previous releases l Issues known to exist in this release.
For additional information about the Stealthwatch System, go to the Lancope's Customer Community web site (https://lancope.force.com/Customer/CustomerCommLogin)
For a list of alarm types and their IDs, refer to the alarms.csv document via the Alarm List topic in the SMC Client Interface Online Help.
Important: l Multiple patches are required after upgrading to 6.9.0. Please review the
Readme document for each patch prior to installing to ensure all pre-requisites have been met. The following is a list of the required patches for 6.9.0:
• patch-fcnf-ROLLUP003-6.9.0-01 or later• patch-smc-ROLLUP001-6.9.0-02 or later• patch-udpd-ROLLUP001-6.9.0-02 or later• patch-common-SWD-8340-6.9.0-virtualonly-04.swu or later• patch-common-SWD-8141-6.9.0-01.swu or later
l If you currently do not have pxGrid configured, then when you update to Stealthwatch v6.9.0 you must reconfigure Cisco ISE. (If you configured pxGrid in StealthWatch 6.8.x, then your configuration will be copied forward to Stealthwatch v6.9.0)
l The ISE "Device Type" field and "Security Group" field that was populated in v6.8.x using syslog is not being mapped properly from pxGrid. See Known Issues for more information.
l The Open Virtualization Format (OVF) file does not have the minimum reserved memory requirements for the SMC and the Flow Collector. You will need to add additional resources to meet the minimum requirements. See Known Issues for more information.
RELEASE NOTES | Stealthwatch System v6.9.0
© 2017 Cisco Systems, Inc. All Rights Reserved. 1

l The Stealthwatch System v6.9.0 includes a service called Directional Policy, which requires an upgrade of the existing policies in order to establish its functionality. When you upgrade to v6.9.0, your existing policies will be upgraded to the new policy format. Consequently, you will not be able to upload and use any policy XML files from any level (domain, role, inside host, outside host) in any version prior to v6.9.0 within the Stealthwatch Management Console (SMC). If you attempt to do so, your new policies in v6.9.0 will be reset to the status of none.
l Due to changes with APIs, customers running the Host Group Automation Service require a service software upgrade. Please contact Stealthwatch technical support for upgrade assistance.
l Before you add a Flow Collector or Flow Sensor in the System Setup Tool, you must have first created a management channel between the Flow Col-lector and/or Flow Sensor and the Stealthwatch Management Console (SMC). If you have not done this, you will receive an error message when you try to add either appliance in the System Setup Tool. The specific instructions are on page 43 in the Stealthwatch Management Console VE and Flow Col-lector VE Installation and Configuration Guide or page 15 in the Hardware Configuration Guide.
l The Stealthwatch System v6.9.0 uses a new openSSL version with only TLS 1.2 available. We recommend updating the IDentity 1000/1100 appliance to v3.3.0 to take advantage of the increased security.
Notes: l This document uses the term "appliance" for any Stealthwatch System product,
including virtual editions (VEs) such as the Flow Collector VE. l The Stealthwatch System supports Internet Explorer v9 and later. l The Stealthwatch System requires Java version 8 (v1.8) or later. l For this release the security category point contributions have been recalibrated.
After updating to v6.9.0, it could take 10 days for the system to re-baseline the secur-ity categories. You may see a decrease in alarms at first and then a gradual increase to a more standard level.
l Where once the setting "disabled" for a security event disabled the event, now dis-abling will disable the alarm.
l Check your Stealthwatch appliance’s NTP settings and remove the 130.126.24.53 NTP server if it is in the list of servers. This server is known to be problematic and it is no longer in Cisco’s default list of NTP servers to use.
RELEASE NOTES | Stealthwatch System v6.9.0
2 © 2017 Cisco Systems, Inc. All Rights Reserved.

What's NewThe Stealthwatch System v6.9.0 introduces new features and capabilities in the SMC Web Application interface.
These are the new features and improvements for the v6.9.0 release:
l Stealthwatch System Security Model and Prioritization of Detected Security Events l Perform an external lookup from more locations l Perform a packet query from more locations l View Cisco ISE devices in the Enterprise tree l Add a Cisco ISE cluster from the SMC client interface l A New Cisco Identity Services Engine (ISE) version l Alarming hosts widgets updated on theSecurity Insight Dashboard l Added Top Alarming Hosts Widget to Security Insight Dashboard l Enhancing Security Event Documentation l New alarms for the Stealthwatch System l Directional policy added to the Host Policy Manager feature l New Host Group Report l New Top Reports l SMC Management of the UDP Director Added l Top Navigation l Flow Search l Flow Results l REST API Authentication
Stealthwatch System Security Model and Prioritization of Detected Security Events
Value Added
l We have created a new scale that scores security events against each other pro-portionately in order to provide Stealthwatch System users a better way to respond to the most important matters first.
l Alarm categories now balance more types of behaviors when prioritizing hosts of interest rather than overly represent a few specific events.
l Stealthwatch System v6.9.0 triggers alarms based on situations that previous releases would not have in order to prioritize hosts of interest using a more complete picture.
RELEASE NOTES | Stealthwatch System v6.9.0
© 2017 Cisco Systems, Inc. All Rights Reserved. 3

l Both the existing Stealthwatch Management Console client interface and the views intro-duced in v6.9.0 highlight this improved prioritization. These changes will help you to determine which hosts to investigate as well as successfully complete those invest-igations.
Potential Impact
l While the 6.9 release does a better job of ordering hosts of interest for the user based on severity, it is important to note that if you are upgrading from v6.8.0, the overall quantity of category alarms may increase.
l During the first ten days after upgrading, you will see alarm categories fluctuate, and point totals will differ dramatically from what you have previously seen. The Stealthwatch Sys-tem will continue to learn and adjust; however, the number of category alarms will better reflect the norm after this initial baselining period.
l Since the entire scale of the category system changed with the 6.9.0 release, some of the settings affecting alarm categories will be modified in existing deployments. Specifically, the minimum, maximum, and tolerance values for each category will be updated. The set-tings that determine whether a category is enabled or is set to alarm will not be changed.
l If you prefer to see either a smaller or a larger number of alarms, you can adjust the volume by modifying the minimum, maximum, and tolerance values for each category. To do this, open the desktop client and navigate to the Category Alarm tab in the Host Policy Man-ager.
Other Resources
You can obtain further information from these sources in this page of Lancope's Customer Community:
l Security Model Introduction Video l An Introduction to the Stealthwatch Security Model and the Prioritization of Security Events
Perform an external lookup from more locationsYou can perform an external lookup from more locations in the SMC client interface and SMC Web App.
In the SMC client interface, right-click the relevant IP address. (There are a few locations where you cannot access the External Lookup option from an IP address.)
In the SMC Web App, click the ellipsis that is displayed beside the relevant IP address. This applies to any place that an IP address appears.
RELEASE NOTES | Stealthwatch System v6.9.0
4 © 2017 Cisco Systems, Inc. All Rights Reserved.

Perform a packet query from more locationsYou can perform a packet query from more locations in the SMC client interface and SMC Web App.
In the SMC Web App, open any page contains the relevant IP address and click the ellipsis that is displayed beside the relevant IP address. This applies to any place that an IP address appears. Click Packet Query from the pop-up menu.
In the SMC client interface, open any page that contains the relevant IP address and right-click the relevant IP address. Click Packet Query from the pop-up menu.
Note: The Packet Query option will be unavailable if the Cisco Security Packet Analyzer appliance has not been configured on the Packet Analyzer Appliance Configuration Setup page.
RELEASE NOTES | Stealthwatch System v6.9.0
© 2017 Cisco Systems, Inc. All Rights Reserved. 5
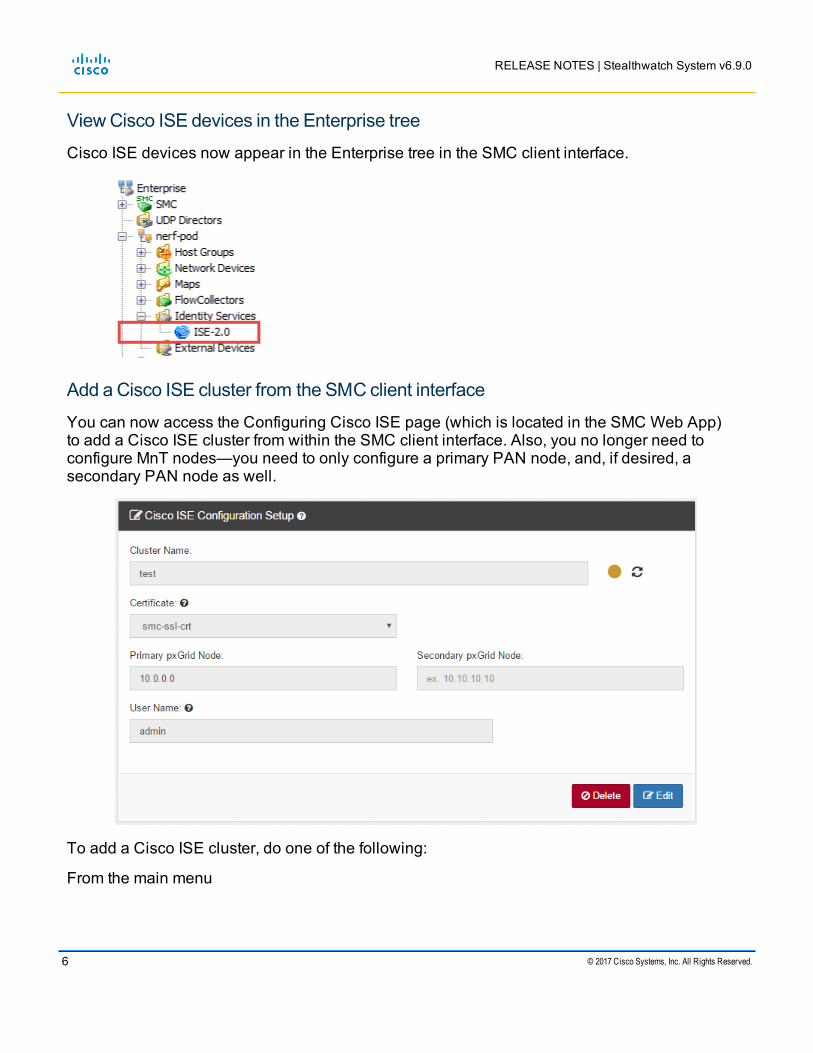
View Cisco ISE devices in the Enterprise treeCisco ISE devices now appear in the Enterprise tree in the SMC client interface.
Add a Cisco ISE cluster from the SMC client interfaceYou can now access the Configuring Cisco ISE page (which is located in the SMC Web App) to add a Cisco ISE cluster from within the SMC client interface. Also, you no longer need to configure MnT nodes—you need to only configure a primary PAN node, and, if desired, a secondary PAN node as well.
To add a Cisco ISE cluster, do one of the following:
From the main menu
RELEASE NOTES | Stealthwatch System v6.9.0
6 © 2017 Cisco Systems, Inc. All Rights Reserved.

1. On the Enterprise tree, select the Identity Services folder. 2. From the SMC main menu, select Configuration > Add Cisco ISE.
From the Enterprise tree
1. On the Enterprise tree, right-click the Identity Services folder. 2. Select Configuration > Add Cisco ISE.
The SMC Web App interface opens and the Configuring Cisco ISE page is displayed. You must use this page to add, configure, and delete Cisco ISE clusters in both the SMC Web App and the SMC client interface. Once you have added a Cisco ISE cluster, it will appear in the Enterprise tree under its associated domain in the SMC client interface.
For more information about using Cisco ISE functionality, refer to the SMC Web App online Help.
A New Cisco Identity Services Engine (ISE) versionThe Steathwatch System now offers Cisco ISE-PIC (Passive Identity Connector) as one of the two different ISE versions that the Stealthwatch System uses. This version enables you to receive passive user and device information from the Cisco ISE cluster. With ISE-PIC, users do not pass through the ISE device.
Cisco ISE (the version that was first offered with the Stealthwatch System v6.8.0) is more robust. With this version all users are routed through the ISE device, and you can do all of the following:
• Receive active user and device information from the Cisco ISE cluster.
• Request ISE to perform a quarantine or unquarantine action on the specified host.
• View the mitigation actions (in the audit log) that have been requested for a host.
Alarming hosts widgets updated on theSecurity Insight DashboardThe alarming hosts widgets (such as Concern Index or Recon) that are displayed across the top of the Security Insight Dashboard now shows the following information for version 6.9:
l The number of hosts receiving alarms (since the last reset hour) for that category. If no hosts are receiving alarms that contribute to the alarm category, the container displays a zero. If you click the number (value cannot be 0), the Host List View page opens, filtered by that category.
l The color represents the current highest severity for an alarm occurring for any host within that category. If the highest severity is major, the color of the corresponding number turns
RELEASE NOTES | Stealthwatch System v6.9.0
© 2017 Cisco Systems, Inc. All Rights Reserved. 7

red; if it is minor, it turns orange. If no alarms are contributing to an alarm category, its num-ber turns gray. (To learn more about alarm severity levels, see About Alarm Severities.)
l The 7-Day Trend chart's color always matches the number's color. For details about a spe-cific day, place your cursor over the graph; a tooltip displays the date and the number of hosts receiving alarms (for a specific day) that contribute to that alarm category.
Notes:
l Although the following "always bad" security events do not contribute index points to an alarm category, any of these immediately increases the alarm count for a host and assigns it a severity level of major (which causes both the number and the alarm trend to turn red).
o Any security events contributing to the C&C alarm
o All custom security events contributing to the Policy Violation alarm
o Host lock Violation (a built-in security event)
o Watch Host Active (a built-in security event)
l Although the Host Lock Violation and Watch Host Active alarms are "always bad" security events, they display as red (instead of black) on the Host List View.
l If you reboot your Flow Collector, it drops all alarm history. Since the alarming host widgets then do not update until the next reset hour, you may see a discrepancy between these values on the Security Insight Dashboard and the Host List View.
l If you disable a custom event that had resulted in any Policy Violation alarms, the Host List View may show fewer alarming hosts. Enabling the custom event may or may not restore the count.
Added Top Alarming Hosts Widget to Security Insight DashboardThe Top Alarming Hosts component has been added to the Security Insight Dashboard. This component displays the top seven hosts, sorted by alarm severity (represented by alarm category containers), that have been active on your network since the last reset hour. If a host
RELEASE NOTES | Stealthwatch System v6.9.0
8 © 2017 Cisco Systems, Inc. All Rights Reserved.

is a member of two or more host groups and receives more than one alarm, the Stealthwatch system displays only one of the host groups of which this host is a member.
You can also view the alarm category name and percentage of threshold (or alarm count for the “always bad” alarms) reached by a host for a particular alarm category by hovering your cursor over the applicable alarm category container.
Notes: l The order of the hosts on this list may vary slightly from that of the Host List View if
the SMC and Flow Collector have not yet synced. l For information about how this list is sorted alarm severity levels, see About Alarm
Severities.
From this component you can access the following information:
l The Host List View, which displays all hosts that have had active alarms since the last reset hour. To view this data, click the View All Hosts link at the bottom of the component. The Host List View opens, sorted by severity.
l The Host Report for the host which you selected. You can view information about a single host’s activity as far back as the last seven days. To view this data, click the applicable host IP address.
l The Alarm Dashboard, which displays all alarms contributing to a specific alarm category for a specific host. To view this data, click the alarm category container for the host you want to investigate.
RELEASE NOTES | Stealthwatch System v6.9.0
© 2017 Cisco Systems, Inc. All Rights Reserved. 9
Enhancing Security Event DocumentationAdditional information has been added to another portion of the security events described in the Security Events List topic. This new format includes information such as what it means when an event is triggered, the steps you should take to investigate further, which policies have an event on or off by default, and much more.
Additional information had previously been added for v6.8 for a select number of security events. This process will continue through future releases until all security events have been converted to the new format.
For more information, see the “Security Event List” topic in either the SMC client interface or SMC Web App online Help.
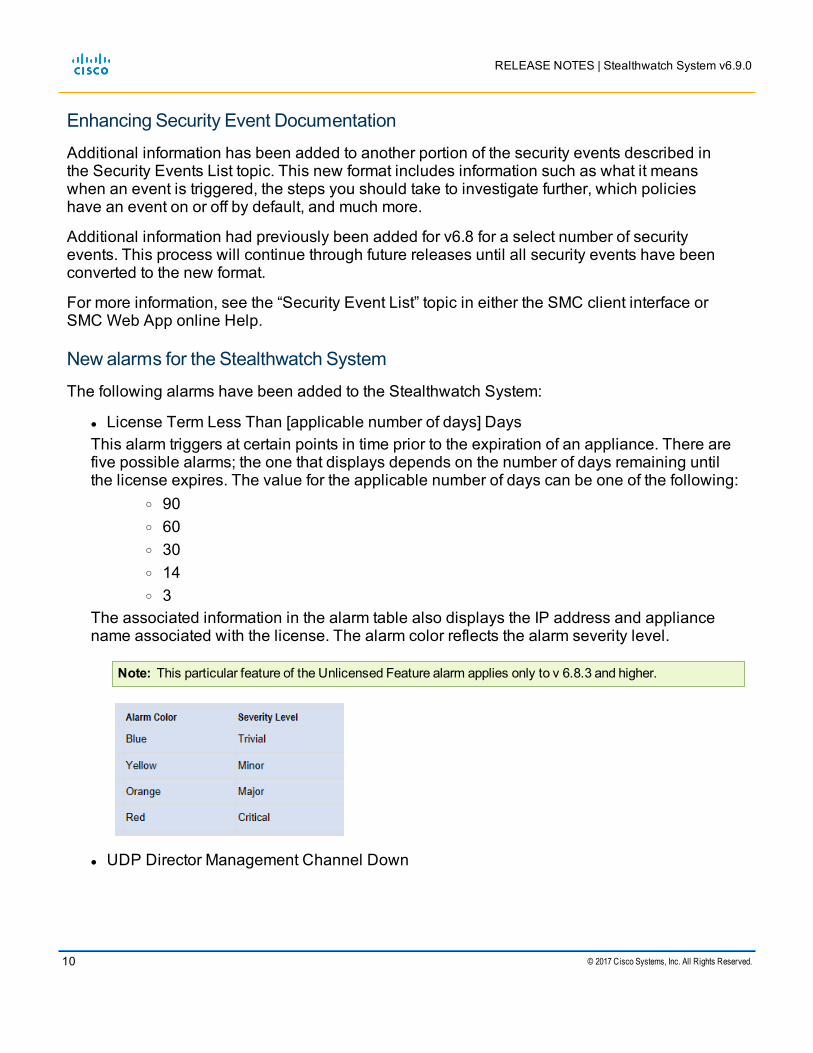
New alarms for the Stealthwatch SystemThe following alarms have been added to the Stealthwatch System:
l License Term Less Than [applicable number of days] DaysThis alarm triggers at certain points in time prior to the expiration of an appliance. There are five possible alarms; the one that displays depends on the number of days remaining until the license expires. The value for the applicable number of days can be one of the following:
o 90 o 60 o 30 o 14 o 3
The associated information in the alarm table also displays the IP address and appliance name associated with the license. The alarm color reflects the alarm severity level.
Note: This particular feature of the Unlicensed Feature alarm applies only to v 6.8.3 and higher.
l UDP Director Management Channel Down
RELEASE NOTES | Stealthwatch System v6.9.0
10 © 2017 Cisco Systems, Inc. All Rights Reserved.

Indicates the management channel between the UDP Directory and the SMC is currently down. This alarms clears when either of the following two conditions is true:
o The management channel becomes active. o The UDP Director is removed as a managed appliance from the SMC.
l UDP Directory HA Service DownIndicates the High Availability service between a primary and secondary UDP Director that are managed by the SMC is currently down. The alarm clears when either of the following two conditions is true:
o The HA service becomes active. o The HA service is turned off on both the primary and secondary UDP Directors.
l Flow Collector Interfaces Count ExceededIndicates that the specified exporter interface cannot be added to the Flow Collector because the limit permitted for this Flow Collector has been reached. The alarm information provided in the Alarm Table includes the exporter IP address for the interface. To resolve this issue, you can move this exporter interface or others to another Flow Collector that has not reached its capacity.
Directional policy added to the Host Policy Manager featureA new directional policy is now used by the Host Policy Manager in the SMC client interface. Because of this, additional columns have been added to the Host Policy Manager dialog.
The following table describes each column:
Select this check box... To do the following...
Impact Source Policy If you want a host policy or role policy to override the source setting
RELEASE NOTES | Stealthwatch System v6.9.0
© 2017 Cisco Systems, Inc. All Rights Reserved. 11

defined in the default policy or the existing effective policy.
Note: This column is available only when you are editing a host policy or role policy
Enable Source If you want a security event that is enabled for the source to contribute points to any applicable alarm categories. You must select the Impact Source Policy check box before you can select the Enable Source check box
Alarm Source If you want a security event that is enabled for the source to also trigger its associated alarm. You must select the Impact Source Policy check box and Enable Source check box before you can select the Alarm Source check box
Impact Source Target If you want a host policy or role policy to override the target setting defined in the default policy or the existing effective policy.
Note: This column is available only when you are editing a host policy or role policy.
Enable Target If you want a security event that is enabled for the target to contribute points to any applicable alarm categories. You must select the Impact Target Policy check box before you can select the Enable Target check box.
Alarm Target If you want a security event that is enabled for the target to also trigger its associated alarm. You must select the Impact Target Policy check box and Enable Target check box before you can select the Alarm Target check box.
The effective host policy is determined differently now. In situations where a host is not assigned to a host policy but is assigned to two or more differently configured role policies, the Stealthwatch System first checks to see if any of the following four columns are de-selected in any of the role policies to which that host is assigned:
l Enable Source l Alarm Source l Enable Target l Alarm Target
If even only one of the four columns named in the previous bulleted list is de-selected in any of the policies, then that column is de-selected in the effective policy. In other words, any column that is de-selected (which equals a “false” setting) overrides the same column in any other role policy to which that host is assigned if that column is selected (which equals a “true” setting); in other words, false settings override true settings.
RELEASE NOTES | Stealthwatch System v6.9.0
12 © 2017 Cisco Systems, Inc. All Rights Reserved.

Any column that is selected in ALL of the assigned role policies remain selected in the effective policy.
Example 1
Example 2
The effective policy for a host will display in the Policy column the names of all effective policies. When both a source policy and a target policy exists for a security event, then the Policy column lists the source policy first and the target policy second.
For further information, see Directional Policy Introduction.
New Host Group ReportThe Host Group Report has been added to the SMC Web App, which you can use to view detailed information about a host group. Following is a description of each component that is
RELEASE NOTES | Stealthwatch System v6.9.0
© 2017 Cisco Systems, Inc. All Rights Reserved. 13
on this page.
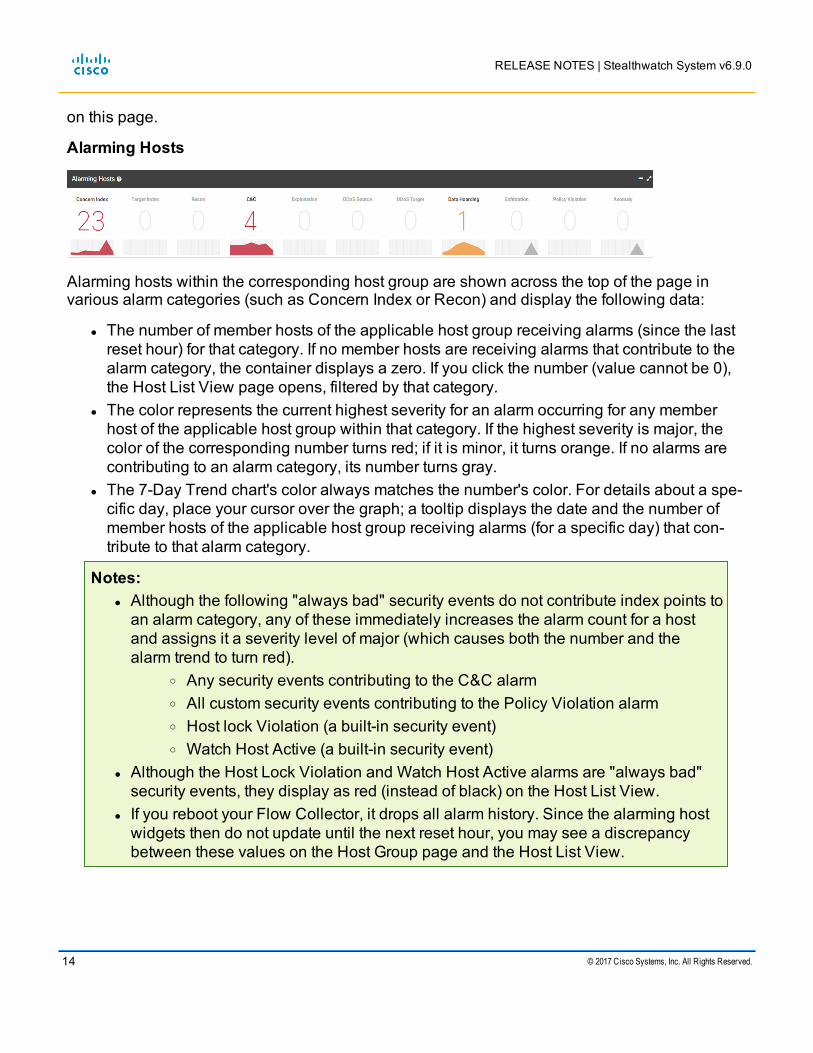
Alarming Hosts
Alarming hosts within the corresponding host group are shown across the top of the page in various alarm categories (such as Concern Index or Recon) and display the following data:
l The number of member hosts of the applicable host group receiving alarms (since the last reset hour) for that category. If no member hosts are receiving alarms that contribute to the alarm category, the container displays a zero. If you click the number (value cannot be 0), the Host List View page opens, filtered by that category.
l The color represents the current highest severity for an alarm occurring for any member host of the applicable host group within that category. If the highest severity is major, the color of the corresponding number turns red; if it is minor, it turns orange. If no alarms are contributing to an alarm category, its number turns gray.
l The 7-Day Trend chart's color always matches the number's color. For details about a spe-cific day, place your cursor over the graph; a tooltip displays the date and the number of member hosts of the applicable host group receiving alarms (for a specific day) that con-tribute to that alarm category.
Notes: l Although the following "always bad" security events do not contribute index points to
an alarm category, any of these immediately increases the alarm count for a host and assigns it a severity level of major (which causes both the number and the alarm trend to turn red).
o Any security events contributing to the C&C alarm o All custom security events contributing to the Policy Violation alarm o Host lock Violation (a built-in security event) o Watch Host Active (a built-in security event)
l Although the Host Lock Violation and Watch Host Active alarms are "always bad" security events, they display as red (instead of black) on the Host List View.
l If you reboot your Flow Collector, it drops all alarm history. Since the alarming host widgets then do not update until the next reset hour, you may see a discrepancy between these values on the Host Group page and the Host List View.
RELEASE NOTES | Stealthwatch System v6.9.0
14 © 2017 Cisco Systems, Inc. All Rights Reserved.
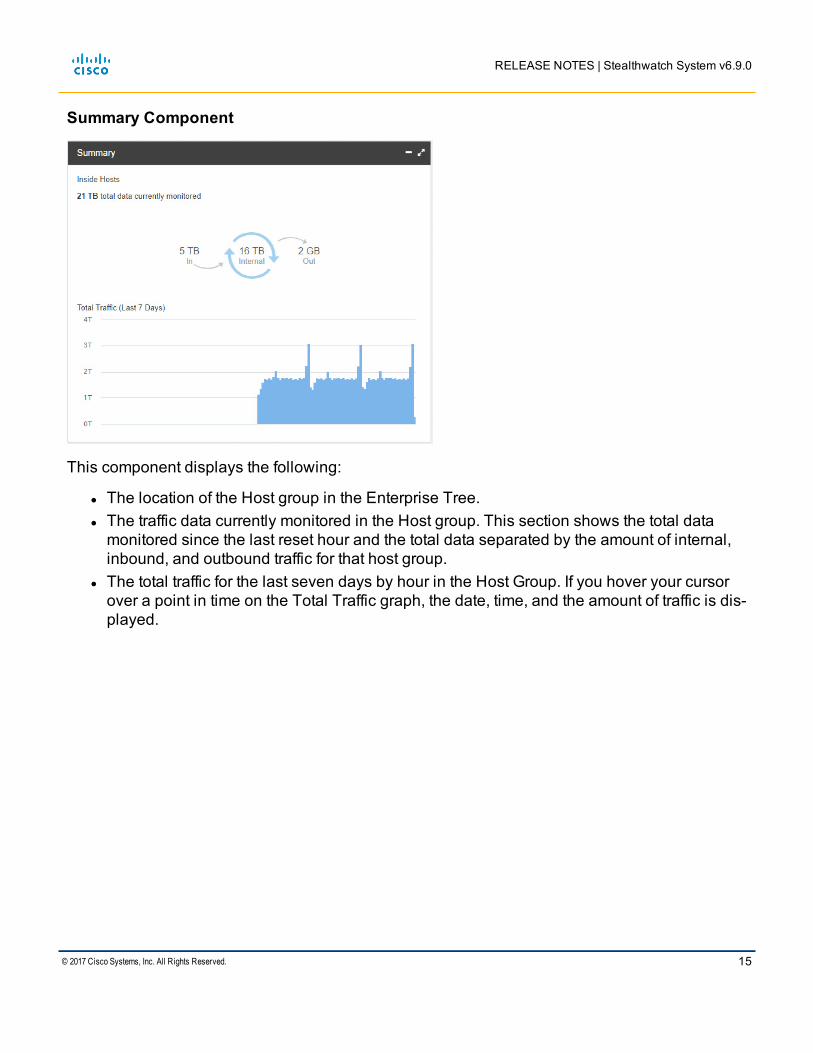
Summary Component
This component displays the following:
l The location of the Host group in the Enterprise Tree. l The traffic data currently monitored in the Host group. This section shows the total data
monitored since the last reset hour and the total data separated by the amount of internal, inbound, and outbound traffic for that host group.
l The total traffic for the last seven days by hour in the Host Group. If you hover your cursor over a point in time on the Total Traffic graph, the date, time, and the amount of traffic is dis-played.
RELEASE NOTES | Stealthwatch System v6.9.0
© 2017 Cisco Systems, Inc. All Rights Reserved. 15

Top Applications
This component displays the top nine applications and the sum of all other applications, displayed under Other, currently monitored in the Host group for the last 12 hours in five-minute intervals. The top application graphs are separated by inbound, outbound, and internal traffic. The legend at the bottom of this component displays the top nine applications. Click an application name to remove the application from displaying on the graphs. If you hover your cursor over a point in time on the Top Applications graph, the application name, start time, traffic bytes, and traffic direction is displayed.
RELEASE NOTES | Stealthwatch System v6.9.0
16 © 2017 Cisco Systems, Inc. All Rights Reserved.
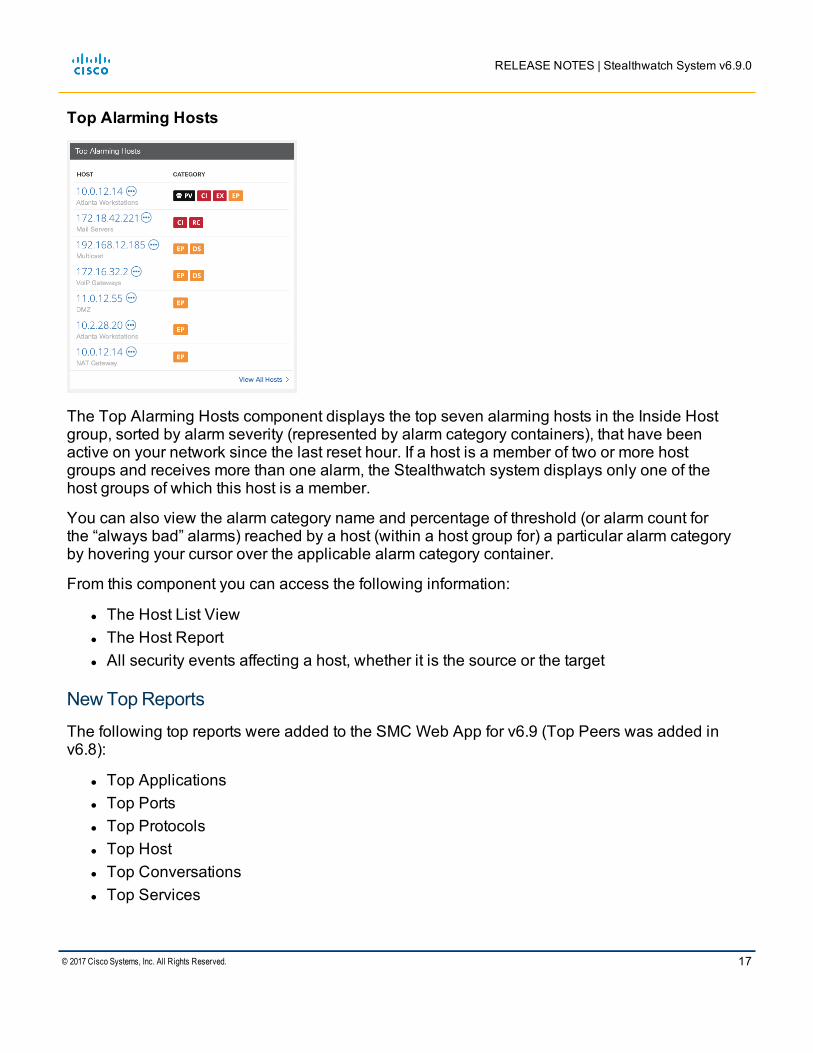
Top Alarming Hosts
The Top Alarming Hosts component displays the top seven alarming hosts in the Inside Host group, sorted by alarm severity (represented by alarm category containers), that have been active on your network since the last reset hour. If a host is a member of two or more host groups and receives more than one alarm, the Stealthwatch system displays only one of the host groups of which this host is a member.
You can also view the alarm category name and percentage of threshold (or alarm count for the “always bad” alarms) reached by a host (within a host group for) a particular alarm category by hovering your cursor over the applicable alarm category container.
From this component you can access the following information:
l The Host List View l The Host Report l All security events affecting a host, whether it is the source or the target
New Top Reports The following top reports were added to the SMC Web App for v6.9 (Top Peers was added in v6.8):
l Top Applications l Top Ports l Top Protocols l Top Host l Top Conversations l Top Services
RELEASE NOTES | Stealthwatch System v6.9.0
© 2017 Cisco Systems, Inc. All Rights Reserved. 17

You can run these top reports to determine various information.
If you have accessed the report from the ...
The report filters on the ...
Alarm Dashboard Source IP, Target IP, and First Active to current time. If the source or target hosts are multiple hosts, then the Source IP and Target IP do not send information to query page. If the alarm is still active, then the report filters on First Active.
Alarm List Source IP, and First Active to current time. If the source or target hosts are multiple hosts, then the Source IP and Target IP do not send information to query page. If the alarm is still active, then the report filters on First Active.
Host Group Report l Top Alarming Hosts - IP address and last five minutes. l Top Applications section - Host group, application, and time
range selected from the graph l Traffic summary section - Host group and time range selec-
ted from the graph
Host List View First Sent to Last Sent and IP address. If First Sent to Last Sent is greater than seven days, then the report filters on the seven days prior to Last Sent.
Host Report IP address and last five minutes
Host Search First Sent to Last Sent and IP address. If First Sent to Last Snet is greater than seven days, then the report filters on the seven days prior to Last Sent.
Security Event Details page Source IP, Target IP, and First Active to Last Active. If the source or target hosts are multiple hosts, then the Source IP and Target IP do not send information to query page. If the event is still active, then the report filters on First Active to current time.
Security Insight Dashboard Top Alarming Hosts section - IP address and last five minutes
You can run this report from the following locations:
l Flow Search page (Analyze > Flow Search)
Note: To choose which type of report to run, click the Search Type drop-down list box.
l Any IP address context menu
RELEASE NOTES | Stealthwatch System v6.9.0
18 © 2017 Cisco Systems, Inc. All Rights Reserved.

l Host Search page (Analyze > Host Search)
SMC Management of the UDP Director AddedWe added the following to the management of the UDP Director from the SMC.
l Forwarding Rules
l UDP Director and its associated inventory information is now in the SMC client interface Inventory Report of the License Manager.
RELEASE NOTES | Stealthwatch System v6.9.0
© 2017 Cisco Systems, Inc. All Rights Reserved. 19
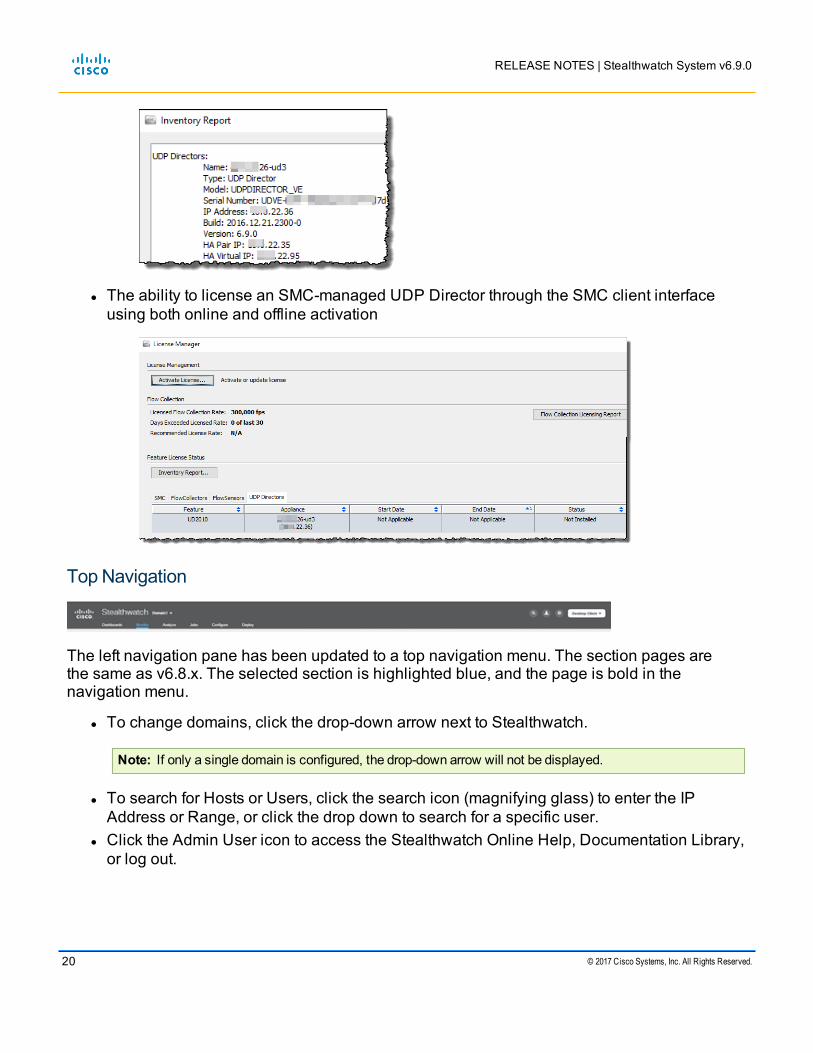
l The ability to license an SMC-managed UDP Director through the SMC client interface using both online and offline activation
Top Navigation
The left navigation pane has been updated to a top navigation menu. The section pages are the same as v6.8.x. The selected section is highlighted blue, and the page is bold in the navigation menu.
l To change domains, click the drop-down arrow next to Stealthwatch.
Note: If only a single domain is configured, the drop-down arrow will not be displayed.
l To search for Hosts or Users, click the search icon (magnifying glass) to enter the IP Address or Range, or click the drop down to search for a specific user.
l Click the Admin User icon to access the Stealthwatch Online Help, Documentation Library, or log out.
RELEASE NOTES | Stealthwatch System v6.9.0
20 © 2017 Cisco Systems, Inc. All Rights Reserved.
l Click the global settings icon (the gear) to access Administer Appliance, Packet Analyzer Configuration, System Management, UDP Director Configuration, and External Lookup Configuration.
l To launch the java client, click Desktop Client.
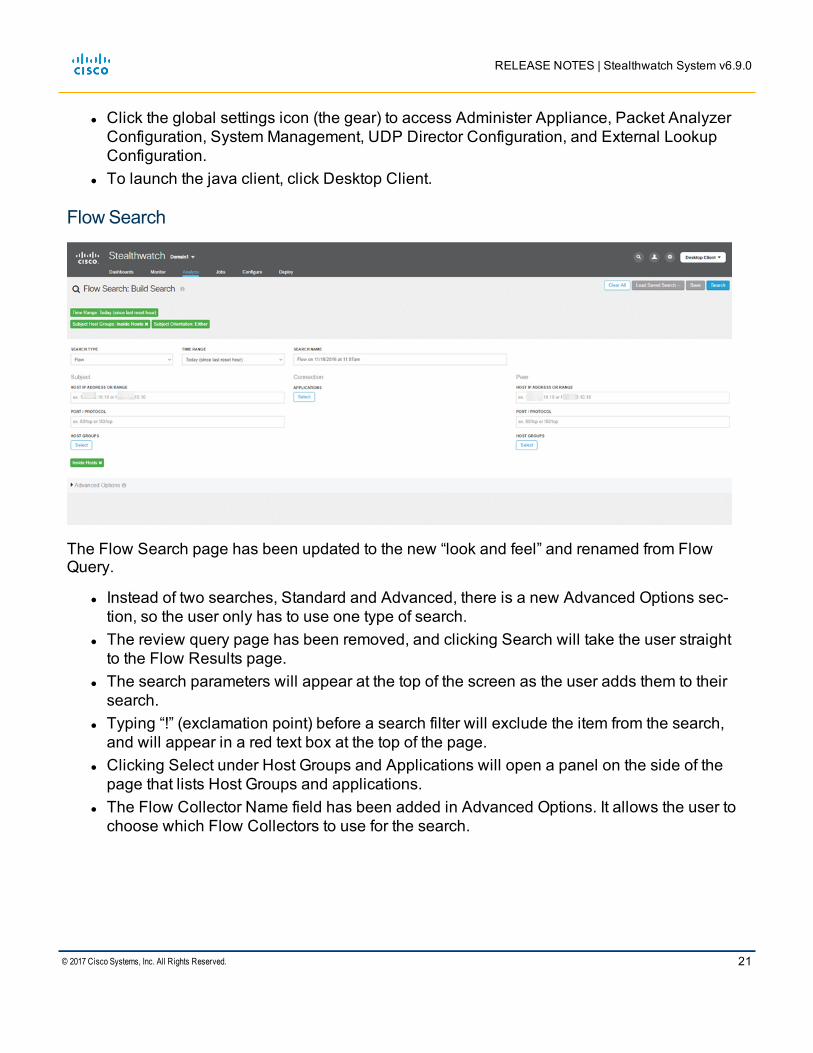
Flow Search
The Flow Search page has been updated to the new “look and feel” and renamed from Flow Query.
l Instead of two searches, Standard and Advanced, there is a new Advanced Options sec-tion, so the user only has to use one type of search.
l The review query page has been removed, and clicking Search will take the user straight to the Flow Results page.
l The search parameters will appear at the top of the screen as the user adds them to their search.
l Typing “!” (exclamation point) before a search filter will exclude the item from the search, and will appear in a red text box at the top of the page.
l Clicking Select under Host Groups and Applications will open a panel on the side of the page that lists Host Groups and applications.
l The Flow Collector Name field has been added in Advanced Options. It allows the user to choose which Flow Collectors to use for the search.
RELEASE NOTES | Stealthwatch System v6.9.0
© 2017 Cisco Systems, Inc. All Rights Reserved. 21
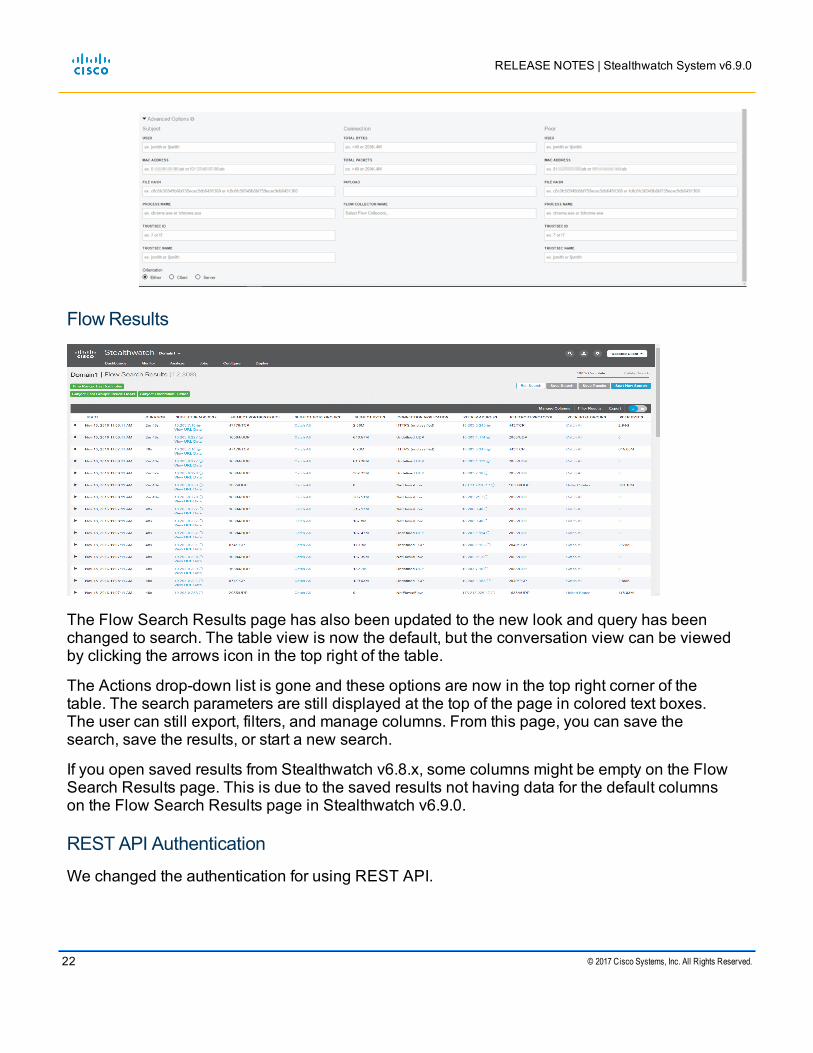
Flow Results
The Flow Search Results page has also been updated to the new look and query has been changed to search. The table view is now the default, but the conversation view can be viewed by clicking the arrows icon in the top right of the table.
The Actions drop-down list is gone and these options are now in the top right corner of the table. The search parameters are still displayed at the top of the page in colored text boxes. The user can still export, filters, and manage columns. From this page, you can save the search, save the results, or start a new search.
If you open saved results from Stealthwatch v6.8.x, some columns might be empty on the Flow Search Results page. This is due to the saved results not having data for the default columns on the Flow Search Results page in Stealthwatch v6.9.0.
REST API AuthenticationWe changed the authentication for using REST API.
RELEASE NOTES | Stealthwatch System v6.9.0
22 © 2017 Cisco Systems, Inc. All Rights Reserved.

l This authentication API attempts to obtain a token for the provided username: o POST /token/v2/authenticate o Examples:
l POST https://<smcaddress>/token/v2/authenticate (with username and password as parameters to a url-encoded form)
l curl –s –k –c cookies.txt –d “username=jim&password=password123” https://<smcaddress>/token/v2/authenticate
Note: For customers that have not yet upgraded to Java 1.8 or later, authentication will be the following:curl –s --verbose --tlsv1 -X POST --insecure -data “username=jim@password=password123” https://<smcaddress>:443/token/v2/authenticate
l This authentication API validates the provided token: o GET /token
l This authentication API renews a valid JWT token: o POST /token
l This authentication API clears the token cookie: o DELETE /token
For more information about the specific coding, please look in the Authentication section of the Stealthwatch System APIs document in Customer Community or of the About the Stealthwatch System APIs page in SMC Web App Help.
RELEASE NOTES | Stealthwatch System v6.9.0
© 2017 Cisco Systems, Inc. All Rights Reserved. 23
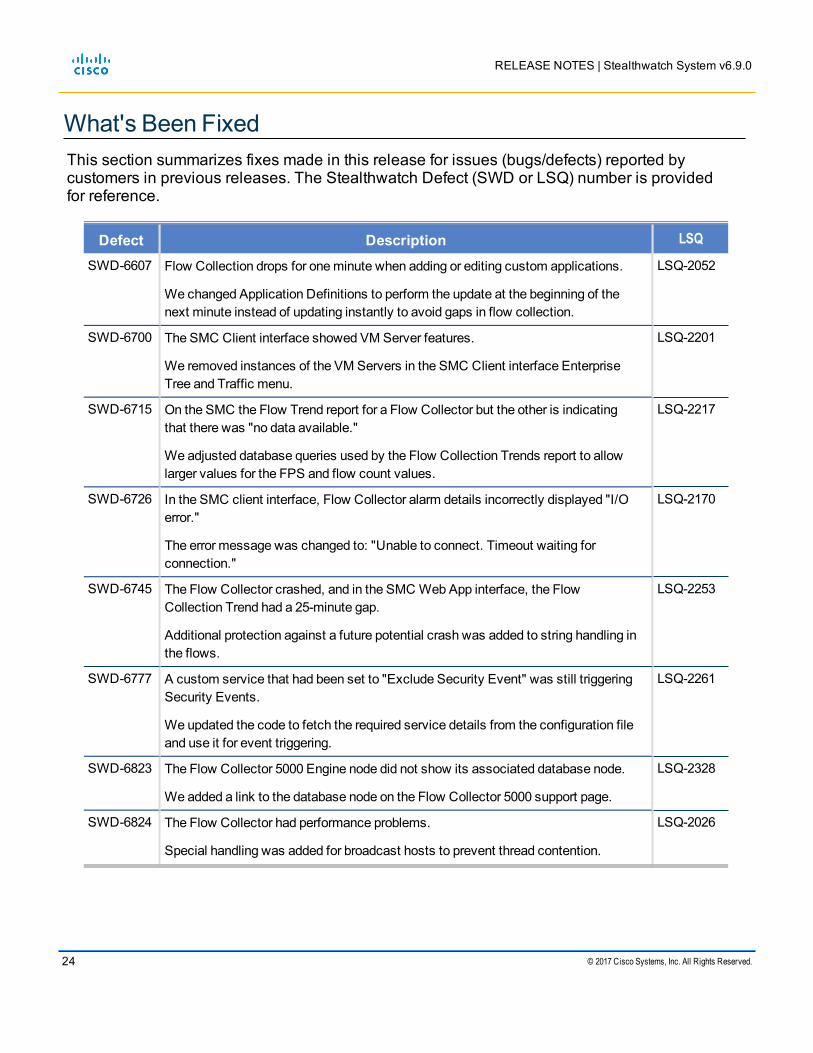
What's Been FixedThis section summarizes fixes made in this release for issues (bugs/defects) reported by customers in previous releases. The Stealthwatch Defect (SWD or LSQ) number is provided for reference.
Defect Description LSQ
SWD-6607 Flow Collection drops for one minute when adding or editing custom applications.
We changed Application Definitions to perform the update at the beginning of the next minute instead of updating instantly to avoid gaps in flow collection.
LSQ-2052
SWD-6700 The SMC Client interface showed VM Server features.
We removed instances of the VM Servers in the SMC Client interface Enterprise Tree and Traffic menu.
LSQ-2201
SWD-6715 On the SMC the Flow Trend report for a Flow Collector but the other is indicating that there was "no data available."
We adjusted database queries used by the Flow Collection Trends report to allow larger values for the FPS and flow count values.
LSQ-2217
SWD-6726 In the SMC client interface, Flow Collector alarm details incorrectly displayed "I/O error."
The error message was changed to: "Unable to connect. Timeout waiting for connection."
LSQ-2170
SWD-6745 The Flow Collector crashed, and in the SMC Web App interface, the Flow Collection Trend had a 25-minute gap.
Additional protection against a future potential crash was added to string handling in the flows.
LSQ-2253
SWD-6777 A custom service that had been set to "Exclude Security Event" was still triggering Security Events.
We updated the code to fetch the required service details from the configuration file and use it for event triggering.
LSQ-2261
SWD-6823 The Flow Collector 5000 Engine node did not show its associated database node.
We added a link to the database node on the Flow Collector 5000 support page.
LSQ-2328
SWD-6824 The Flow Collector had performance problems.
Special handling was added for broadcast hosts to prevent thread contention.
LSQ-2026
RELEASE NOTES | Stealthwatch System v6.9.0
24 © 2017 Cisco Systems, Inc. All Rights Reserved.

Defect Description LSQ
SWD-6839 The Flow Collector Database Storage Statistics showed incorrect capacity when the number of days of "Flow Interface Details" was smaller than those in "Flow Details."
We fixed the code to correctly calculate "Capacity in Days" and "Remaining Days."
LSQ-2238
SWD-6857 The defect was that the SMC was not polling the ifhighspeed value for 10 Gbs interface of an exporter.
We enhanced logging information to aid in determining the solution for the defect.
LSQ-2325
SWD-6858 A segment failure in the Flow Collector occurred when the flow interface buffer size was dynamically increased.
The code was changed to make the buffer reallocation conflict safe.
LSQ-2026
SWD-6869 The SMC was not using the Secondary pxGrid Mitigation ISE Node when the Primary was down.
The code was looking at only the primary host. A Java file was changed so that it would look at the next available host.
LSQ-2367
SWD-6886 The Vertica log file was growing too large.
A log rotate entry in the config file was added so that old logs are purged and the log will not grow out of control.
NA
SWD-6891 The SMC client took about 35 minutes to search a host and open its snapshot.
The locking behavior was adjusted to allow greater concurrency.
SWD-6873
SWD-6901SWD-6904
After the SMC was updated, the Scheduled Documents showed errors and would not display any graphs
The problem for both defects was that an update to Java 8 still required some client groups to have Java 7. The coding was changed so that the SMC will use Java 8 properly.
LSQ-2400
SWD-6922 The FlowSensor was dropping 90% of packets.
We updated the drivers so the network interface card could pass the packets to the engine to process.
LSQ-2410
RELEASE NOTES | Stealthwatch System v6.9.0
© 2017 Cisco Systems, Inc. All Rights Reserved. 25

Defect Description LSQ
SWD-6928 The defect was that the SMC Java client took 10 to 15 minutes to finish loading cache.
We adjusted the lock acquisition behavior of a portion of the SMC Web application so that the loss of communication with Cisco ISE nodes does not cause long delays in the login process through the SMC Java client.
LSQ-2416
SWD-6939 The defect was that the Database Storage Statistics page on the Flow Collector Appliance Admin interface was not loading.
We updated the JavaScript on the Database Storage Statistics page to use a different library function for greater browser support.
LSQ-2238
SWD-6941 The defect is that a UDP Director flowfan.xml modification and flowfan restart resulted in a High Availability (HA) cluster service error.
The error was caused by the HA service detecting that the flowfan process was not running because of a delay during manual restart of the service. The delay has been removed.
LSQ-2442
SWD-6955 A custom service that had been set to "Exclude Security Event" was still triggering Security Events.
We updated the code to fetch the required service details from the configuration file and use it for event triggering.
LSQ-2261
SWD-6960SWD-6967
Customer had an issue with multiple Cisco ASA's reporting longest duration exports of 1,800.
The fix was to ignore the Summary Flows that are sent at the end of each firewall flow.
LSQ-2467
SWD-6976 The defect is that the customer was unable to configure custom certificates for SSL/TLS communications on the Stealthwatch appliances.
The fix provides the ability to install and use certificates with a trust chain longer than 1. The update will restart nginx. The fix is applicable to all appliances.
LSQ-2461
SWD-7061 User received a SMC internal server error.
To avoid this error message, an intermediary was placed between the interface requests that were causing this error and the Mongo database.
LSQ-2576
SWD-7107 The FlowCollector was not processing user name.
The engine now processes Create events that have no bytes or packets so that it can process the AAA user name from the ASA "Flow created" record.
LSQ-2506
RELEASE NOTES | Stealthwatch System v6.9.0
26 © 2017 Cisco Systems, Inc. All Rights Reserved.

Defect Description LSQ
SWD-7131SWD-7132
Some Stealthwatch appliances did not respond to ICMP requests from a Nagios monitoring server.
The default Docker IP address and the netmask for eth2 on the Flow Collector 5000 series database node were changed.
LSQ-2527
SWD-7149 A customer had an Internal Server error.
The fix was to decrease the frequency of certain operations made by the SMC Web interface that can cause increased load on the Mongo database.
LSQ-2545
SWD-7229 The Flow Collector home page would not load in an Internet Explorer browser.
The fix is to change some functions used in loading the Flow Collector home page, which were not supported by IE/Edge browsers.
LSQ-2558
SWD-7322 NetFlow decode was not properly retrieving ICMP type and code.
An initialization problem in the NetFlow decoder was fixed to properly retrieve the ICMP type and code from the first ICMP Netflow record that it decodes.
LSQ-2606
SWD-7324 The Flow Collector engine did not stop inserting data when the disk was 100% full.
Added code to disable the stats the database writes at maximum disk utilization and to trigger the performance degraded alarm.
LSQ-2606
SWD-7621 The Top Conversations Report was not returning all results when a host filter was used.
The fix was to correct the miscalculation while computing the transaction report values in the Top Conversations Report.
LSQ-2593
SWD-7653 IDentity v3.3.0 does not support TLS 1.0 or 1.1.
The SMC Java client was updated so that the customer could use TLS v1.2 for connections back to the SMC.
LSQ-2712
SWD-8136 Cognitive Threat Analytics (CTA) API calls using JWT tokens were not being made correctly.
JWT tokens are now being passed through Authorization headers.
LSQ-2845
LSQ-2876
RELEASE NOTES | Stealthwatch System v6.9.0
© 2017 Cisco Systems, Inc. All Rights Reserved. 27
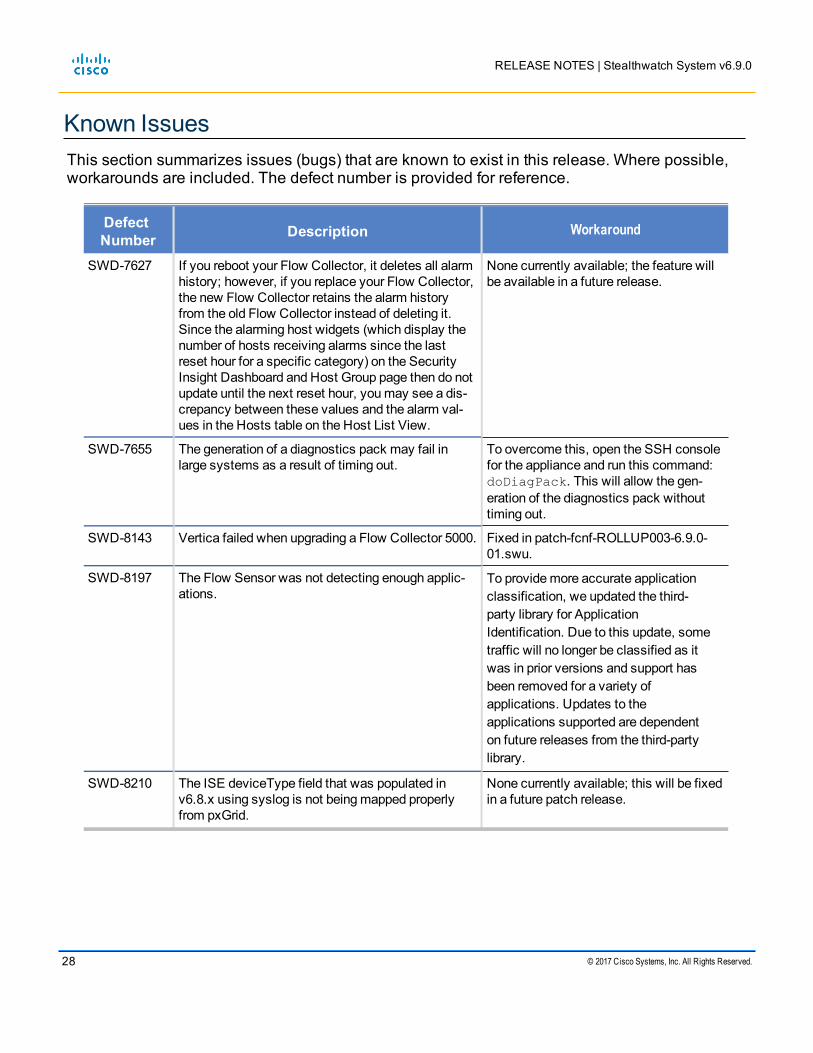
Known IssuesThis section summarizes issues (bugs) that are known to exist in this release. Where possible, workarounds are included. The defect number is provided for reference.
Defect Number Description Workaround
SWD-7627 If you reboot your Flow Collector, it deletes all alarm history; however, if you replace your Flow Collector, the new Flow Collector retains the alarm history from the old Flow Collector instead of deleting it. Since the alarming host widgets (which display the number of hosts receiving alarms since the last reset hour for a specific category) on the Security Insight Dashboard and Host Group page then do not update until the next reset hour, you may see a dis-crepancy between these values and the alarm val-ues in the Hosts table on the Host List View.
None currently available; the feature will be available in a future release.
SWD-7655 The generation of a diagnostics pack may fail in large systems as a result of timing out.
To overcome this, open the SSH console for the appliance and run this command: doDiagPack. This will allow the gen-eration of the diagnostics pack without timing out.
SWD-8143 Vertica failed when upgrading a Flow Collector 5000. Fixed in patch-fcnf-ROLLUP003-6.9.0-01.swu.
SWD-8197 The Flow Sensor was not detecting enough applic-ations.
To provide more accurate application classification, we updated the third-party library for Application Identification. Due to this update, some traffic will no longer be classified as it was in prior versions and support has been removed for a variety of applications. Updates to the applications supported are dependent on future releases from the third-party library.
SWD-8210 The ISE deviceType field that was populated in v6.8.x using syslog is not being mapped properly from pxGrid.
None currently available; this will be fixed in a future patch release.
RELEASE NOTES | Stealthwatch System v6.9.0
28 © 2017 Cisco Systems, Inc. All Rights Reserved.

Defect Number Description Workaround
SWD-8701 OVF resource defaults do not match the minimum reserved memory allocations for the SMC and the Flow Collector.
You will need to add additional resources to meet the minimum requirements stated in the Stealthwatch Management Con-sole VE and Flow Collector VE Install-ation and Configuration Guide; this will be fixed in a future release.
RELEASE NOTES | Stealthwatch System v6.9.0
© 2017 Cisco Systems, Inc. All Rights Reserved. 29

© 2017 Cisco Systems, Inc. All Rights Reserved. SW_6_9_0_Release_Notes_DV_1_6
RELEASE NOTES | Stealthwatch System v6.9.0