teaching positive relationships at work · teaching positive relationships at work annual meeting...
TRANSCRIPT
Teaching Positive Relationships at Work
Annual Meeting of the Academy of Management, 2017, Atlanta
Organizers: Kerry Gibson – Babson College Jason Kanov – Western Washington University
“Blasters”: David Bright – Wright State University
Jody Hoffer Gittell – Brandeis University
Angela Passarelli – College of Charleston
Our Goals+ We will experience high-quality connections+ We will get excited about teaching PRW+ We will discover new possibilities+ We will walk away with actionable ideas+ We will have fun!

+ Pair up with someone you don’t know+ Briefly introduce yourselves+ Share/discuss your answers to this
question
What do you love about teaching?

Our Rationale+ Work relationships really matter!+ Relational quality really matters!+ There’s a burgeoning interest in relationships+ Teaching about PRWs provides insights and
skills that are immediately relevant, useful + Teaching about PRWs can be harder than it
may initially seem

Our Plan+ Three “teaching blasts” (~10 minutes each)
Jody Hoffer Gittell (Relational Mapping)Angela Passarelli (Appreciative Team Huddles)David Bright (Reality Creation Process)
+ Brief Q & A+ Short break/time to mingle+ Create Workgroups based on PRW topic+ Facilitated workgroups will develop teaching tool(s)+ Informal presentations of groups’ tools/ideas

Angela PassarelliAppreciative Team Huddles
Appreciative Team Huddle+ A short exercise for reinforcing best-self image &
leveraging strengths in teams+ Importance:
(1) Emphasizes role of PR’s in teamwork(2) Underscores value of drawing out strengths &
affirming best selves(3) offers positive adjournment of team experience
+ Used with undergraduates at the end of team coaching session after team project

Demonstration

Basic Lesson Plan+ Takes 5-10 minutes, depending on group size+ Team members stand shoulder-to-shoulder in a
circle, then take small step back (physical proximity is important!)
+ Explain instructions and keep time (30-60 seconds per person)
+ Finish with hand-stack (physical touch again!)

Tips and Troubleshooting+ Expect initial skepticism / anxiety+ Consider “priming” students by asking them to
consider others’ contributions in advance+ Select shorter period of time for smaller groups
(30 sec/person) and hold it consistent for all team members
+ Variation includes incrementally joining sub-groups to form one large huddle for cohort


Jody Hoffer GittellRelational Mapping

Relational Mapping+ Mapping is a way to assess the current state of
relational coordination between roles in a work process as a basis for collective sense-making
+ Gives participants a systems perspective of their strengths and opportunities
+ Used in MBA HRM and OB courses, MBA Team Consulting Projects, and in Exec Education
+ Used by consultants for organizational change+ Let’s try it now! See your handout!

u Identify a work process that needs better coordination – maybe “supporting MBA student success”
u Which workgroups are involved? u Draw a circle for each workgroup and lines connecting between
them • WEAK RC = RED• MODERATE RC = BLUE• STRONG RC = GREEN• Color of the circle says how we are doing within each workgroup,
color of the line says how we are doing between the workgroups
Relational mapping

RC = Shared Goals, Shared Knowledge, Mutual Respect, Supported by Frequent, Timely, Accurate, Problem-Solving Communication
Relational mapping of current stateWEAK RC
STRONG RCMODERATE RC
Workgroup1
Workgroup2
Workgroup3Workgroup4
Workgroup5

Basic Lesson Plan+ Create teams of four to six people+ Choose the organizations your teams will assess –
ideally one of their own organizations+ Teams need a table or section of wall, large white
paper, and red, blue, green, & black markers+ 10 min (intro, set up), 40 min (mapping, discussion),
5 min per group (debrief in “Walk Around”)

§ Relational mapping can be sensitive – like "looking into the mirror together" or "putting the elephant on the table"
§ Create a safe space for participants that enables them to share sensitive feedback respectfully, particularly across people with different levels of power and status
§ Mapping is not a report card, rather a starting point for conversation, sense-making, and systems thinking
§ These role relationships are artifacts that we inherited –we didn’t create them but we can change them!
Tips and Troubleshooting


David BrightReality Creation Process

Definitions and AssumptionsReality: A subjectively experienced state of being
Key Idea: We all have the the ability to shape the interpersonal reality we experience with others.
Key Insight: Positive relationships don’t just happen, we must intentionally shape the reality we create with others!

Reality-Creation Processes

The Exercise: ProHealth vs. HealthCore+ Organize the class into groups of 4-6+ Each group receives a case description for one of two
organizations+ The members read their assigned case silently.+ They answer the questions at the end of each case as
a group.+ Each group presents its case to the class.+ Review the handout with the actual cases.

Typical Report for HealthCore+This organization is going downhill – fast!+The leader should be fired.+Layoffs should be carried out ASAP+A successful outcome: the hospital survives and is more cost efficient.+I would NEVER work for this hospital.

Typical Report for ProHealth+This organization has a lot of potential.+The leader is very effective and enjoys huge loyalty from employees – they love him!+Decisions about layoffs should engage employees+A successful outcome: The hospital will thrive –no employee will permanently lose a job.+I would LOVE to work in this hospital.

The Big Reveal+ I read paragraphs from each case.+ The students discover that these
descriptions are nearly identical.+ This is, in fact, a single organization.

Outcomes and Debrief+ We discuss how it is that each group shaped its
assumptions (expected reality) of the organization.+ We explore the many ways in which we shape the
reality we find ourselves in, including in relationships.+ We talk about the importance of intentionality.+ Many students are disoriented – it sometimes takes a
few days to process.

10-Minute Break
Also a chance to mingle and ask more questions

Overview for the Remainder of PDW+ Review & briefly discuss workgroup themes+ Form groups of 4-6 people each+ ~60 minutes to develop a teaching tool and
basic lesson plan pertaining to theme+ Groups will informally present their work+ Audience will ask questions/offer feedback
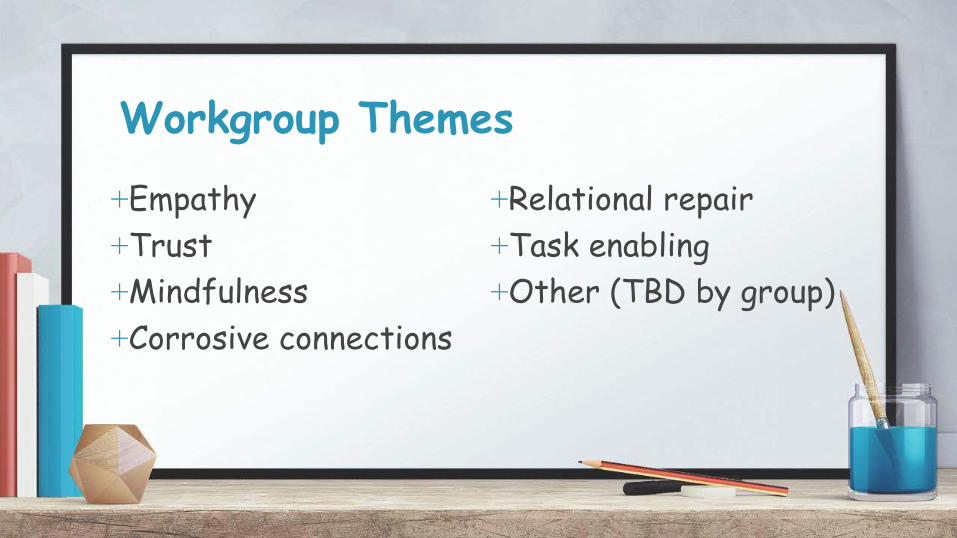
Workgroup Themes
+Empathy+Trust+Mindfulness+Corrosive connections
+Relational repair+Task enabling+Other (TBD by group)

Further GuidanceTeaching “Tool” Ideas+ In-class exercises+ Homework assignments+ Experiential activities+ Long-term projects+ Media-based tasks+ Reflective writing+ Course design elements+ Combinations of ideas+ Other ideas…
“Lesson Plan” Contents+ Who? (UG, MBA, Exec…)+ What? (basic instructions)+ When? (timing in course)+ Where? (space, in/out class)+ Why? (learning goals)+ How? (assumed prior knowl.,
req. resources, discussion ques., eval. methods/rubrics, other supporting stuff…)

CreditsSpecial thanks to all the people who made and released these awesome resources for free:+ Presentation template and icons by SlidesCarnival

Presentation designThis presentation uses the following typographies and colors:
+ Titles: Patrick Hand SC+ Body copy: Sniglet
You can download the fonts on these pages:https://www.fontsquirrel.com/fonts/sniglethttp://www.1001freefonts.com/patrick_hand_sc.font
You don’t need to keep this slide in your presentation. It’s only here to serve you as a design guide if you need to create new slides or download the fonts to edit the presentation in PowerPoint®

“Quotations are commonly printed as a means of inspiration and to invoke philosophical
thoughts from the reader.
Instructions for useEDIT IN GOOGLE SLIDESClick on the button under the presentation preview that says "Use as Google Slides Theme".You will get a copy of this document on your Google Drive and will be able to edit, add or delete slides.You have to be signed in to your Google account.
EDIT IN POWERPOINT®Click on the button under the presentation preview that says "Download as PowerPoint template". You will get a .pptx file that you can edit in PowerPoint.Remember to download and install the fonts used in this presentation (you’ll find the links to the font files needed in the Presentation design slide)
More info on how to use this template at www.slidescarnival.com/help-use-presentation-template
This template is free to use under Creative Commons Attribution license. You can keep the Credits slide or mention SlidesCarnival and other resources used in a slide footer.
This is a slide title+ Here you have a list of items+ And some text+ But remember not to overload your slides with
contentYour audience will listen to you or read the content, but won’t do both.

BIG CONCEPT
Bring the attention of your audience over a key concept using icons or illustrations

In two or three columnsYellowIs the color of gold, butter and ripe lemons. In the spectrum of visible light, yellow is found between green and orange.
BlueIs the colour of the clear sky and the deep sea. It is located between violet and green on the optical spectrum.
RedIs the color of blood, and because of this it has historically been associated with sacrifice, danger and courage.

A picture is worth a thousand wordsA complex idea can be conveyed with just a single still image, namely making it possible to absorb large amounts of data quickly.

Want big impact? Use big image.
Use charts to explain your ideas
GrayWhite Black

And tables to compare data
A B C
Yellow 10 20 7
Blue 30 15 10
Orange 5 24 16

Maps
our office

89,526,124Whoa! That’s a big number, aren’t you proud?
89,526,124$That’s a lot of money
100%Total success!
185,244 usersAnd a lot of users

Our process is easy
first second last

Let’s review some conceptsYellowIs the color of gold, butter and ripe lemons. In the spectrum of visible light, yellow is found between green and orange.
BlueIs the colour of the clear sky and the deep sea. It is located between violet and green on the optical spectrum.
RedIs the color of blood, and because of this it has historically been associated with sacrifice, danger and courage.
YellowIs the color of gold, butter and ripe lemons. In the spectrum of visible light, yellow is found between green and orange.
BlueIs the colour of the clear sky and the deep sea. It is located between violet and green on the optical spectrum.
RedIs the color of blood, and because of this it has historically been associated with sacrifice, danger and courage.

You can insert graphs from Google Sheets
Android projectShow and explain your web, app or software projects using these gadget templates.
Place your screenshot here

iPhone projectShow and explain your web, app or software projects using these gadget templates.
Place your screenshot here

Tablet projectShow and explain your web, app or software projects using these gadget templates.
Place your screenshot here

Desktop projectShow and explain your web, app or software projects using these gadget templates.
Place your screenshot here


SlidesCarnival icons are editable shapes.
This means that you can:● Resize them without losing quality.● Change fill color and opacity.
Isn’t that nice? :)
Examples:
Now you can use any emoji as an icon!And of course it resizes without losing quality and you can change the color.
How? Follow Google instructions https://twitter.com/googledocs/status/730087240156643328
✋👆👉👍👤👦👧👨👩👪💃🏃💑❤😂
😉😋😒😭👶😸🐟🍒🍔💣📌📖🔨🎃🎈
🎨🏈🏰🌏🔌🔑 and many more...
😉