tao fayan_ introduction to weka
TRANSCRIPT

An Introduction to WEKA
Fayan TAO∗
Computer and information science systemMacau University of Science and Technology
ABSTRACT1
WEKA is a data mining software workbench, which haswide applications in machine learning technology. It has anactive community and enjoys widespread acceptance in bothacademia and business. This report provides an introduc-tion to WEKA, and demonstrates how to use each applica-tion, including Explorer, Experimenter, KnowledgeFlow andSimple CLI of WEKA based on version 3.6.13. Two kindof classical data–iris data and weather data are used to doexperiments and related output results are shown and anal-ysed in this report.
KeywordsWEKA; data mining; machine learning
1. INTRODUCTIONThe WEKA[10][5] workbench is a collection of state-of-
the-art machine learning algorithms and data preprocess-ing tools. It was developed at the University of Waikato inNew Zealand; the name stands for Waikato Environment forKnowledge Analysis. (Outside the university, the WEKA,pronounced to rhyme with Mecca, is a flightless bird with aninquisitive nature found only on the islands of New Zealand[8].) The system is written in Java and distributed under theterms of the GNU General Public License. It runs on almostany platform and has been tested under Linux, Windows,and Macintosh operating systems ↪a land even on a personaldigital assistant.
It provides a uniform interface to many different learningalgorithms, along with methods for pre- and post-processingand for evaluating the result of learning schemes on anygiven dataset[6].
It contains several standard data mining techniques, in-cluding data preprocessing, classification, regression, clus-
∗Stu ID:1509853F-II20-00191This report follows ACM TEX format.
ACM ISBN 978-1-4503-2138-9.
DOI: 10.1145/1235
Figure 1: WEKA interface
tering, and association.
2. BACKGROUND AND HISTORYThe WEKA project has been funded by the New Zealand
since 1993[1][7]. The initial goal at this time was as follows:The programme aims to build a state-of-the-art facility for
developing techniques of machine learning and investigat-ing their application in key areas of New Zealand economy.Specifically we will create a workbench for machine learning,determine the factors that contribute towards its successfulapplication in the agriculture industries, and develop newmethods of machine learning and ways of assessing their ef-fectiveness.
In 1996, a mostly C version of WEKA was released, whilein 1999 it was redeveloped and released in Java to supportplatform independence. Today, there are several versions ofWEKA available to the public. The GUI version (6.0) is themost recent release. The developer version (3.5.8) allowsusers to obtain and modify source code to add content or fixbugs. The book version (3.4.14) is as described in the datamining book released by Witten and Frank[9].
3. INTERFACESWEKA has four interfaces, which are started from the
main GUI Chooser window, as shown in figure 1(this dis-cussion is based on WEKA version 3.6.13).They can handledata preprocessing, classification, regression, clustering, andassociation [1][2]. Following shows the specified applicationinterfaces:
• Explorer: An environment for exploring data with WEKA,which contains six main functions, namely Preprocess,Classify, Cluster, Associate, Select attributes and Vi-sualize, respectively.
• Experimenter: An environment for performing exper-iments and conducting statistical tests between learn-

Figure 2: Explorer interface
Figure 3: Preprocess interface
ing schemes.
• KnowledgeFlow: This environment supports essentiallythe same functions as the Explorer but with a drag-and-drop interface. One advantage is that it supportsincremental learning.
• SimpleCLI: An environment providing a simple command-line interface that allows direct execution of WEKAcommands for operating systems that do not providetheir own command line interface.
4. EXPLORERExplorer is the main graphical user interface in WEKA.
It is shown in figure 2.It has six different panels, accessed by the tabs at the top,
that correspond to the various Data Mining tasks supported([8][2]). We will discuss these six functions one by one in thefollowing sections.
• Preprocess: Choose and modify the data being actedon.
• Classify: Train and test learning schemes that classifyor perform regression.
• Cluster: Learn clusters for the data.
• Associate: Learn association rules for the data.
• Select attributes: Select the most relevant attributes inthe data.
• Visualize: View an interactive 2D plot of the data.
4.1 PreprocessThe interface of Preprocess can be seen in the figure 3.The first four buttons at the top of the preprocess section
are used to load data into WEKA[2]:
• Open file. . . Brings up a dialog box allowing us tobrowse for the data file on the local file system.
Figure 4: Left:Weather data (.CSV ); Right: Irisdata (.arff)
Figure 5: Iris data after preprocessing
• Open URL. . . Asks for a Uniform Resource Locatoraddress for where the data is stored.
• Open DB. . . Reads data from a database. (Note thatto make this work we might have to edit the file inWEKA/experiment/DatabaseUtils.props.)
• Generate. . . Enables us to generate artificial datafrom a variety of DataGenerators.
Using the Open file. . . button, we can read files in a vari-ety of formats: WEKA’s ARFF format, CSV format, C4.5format, or serialized Instances format. ARFF files typicallyhave a .arff extension, CSV files a .csv extension, C4.5 files a.data and .names extension, and serialized Instances objectshas a .bsi extension.
Note: This list of formats can be extended by adding cus-tom file converters to the WEKA.core.converters package.
Here, we take weather data and iris data as examples. Fig-ure 4 shows the weather data in the .CSV format and theiris data in the .arff format. figure 2 and figure 5 show theweather data and iris data after preprocessing, respectively.We can see that, preprocess interface demonstrates data in-formation, such as data Relation, Instance and Attributes. Italso shows statistics values, including Minimum, Maximum,Mean and StdDev values. Additional, we can discretize data.As the figure 6 shows, the weather data contains 5 sunnydays, 4 overcast days and 5 rainy days, where all overcastdays have no bad influence in playing, while not all sunnyor rainy days can be regarded as suitable days to play.
4.2 ClassificationThe Classify interface is shown as figure 7. To analyse
the weather data, We have to choose a classifier and testoptions. In our case, we choose trees.J48 as the classifier.As to the Test options box. There are four test modes[2]:
• Use training set: The classifier is evaluated on howwell it predicts the class of the instances it was trainedon.

Figure 6: Discretize weather data
Figure 7: Classify interface
• Supplied test set: The classifier is evaluated on howwell it predicts the class of a set of instances loadedfrom a file. Clicking the Set. . . button brings up adialog allowing us to choose the file to test on.
• Cross-validation: The classifier is evaluated by cross-validation, using the number of folds that are enteredin the Folds text field.
• Percentage split: The classifier is evaluated on howwell it predicts a certain percentage of the data whichis held out for testing. The amount of data held outdepends on the value entered in the % field.
Here, we set Percentage split as 66%, which means that theclassifier will predict 66 percentage of the weather data. Thefigure 8 shows the visualize tree. And the table 1 shows theclassifier output. As we can see, the text in the Classifieroutput area is split into several sections:
• Run information: A list of information giving the learn-ing scheme options, relation name, instances, attributesand test mode that were involved in the process.
• Classifier model (full training set): A textual represen-tation of the classification model that was produced onthe full training data.
• Summary: A list of statistics summarizing how accu-rately the classifier was able to predict the true classof the instances under the chosen test mode.
Figure 8: Classification visualize tree
Figure 9: Visualize cluster assignments (SimpleK-Means)
Figure 10: Visualize cluster assignments (Hierarchi-calClusterer)
• Detailed Accuracy By Class: A more detailed per-classbreak down of the classifier’s prediction accuracy. Here,the true positives (TP)[8] and true negatives (TN) arecorrect classifications. A false positive (FP) is whenthe outcome is incorrectly predicted as yes (or posi-tive) when it is actually no (negative). A false negative(FN) is when the outcome is incorrectly predicted asnegative when it is actually positive. The true positiverate is TP divided by the total number of positives,which is TP +FN (i.e TP
TP+FN); the false positive rate
is FP divided by the total number of negatives, whichis FP + TN (i.e FP
FP+TN). The overall success rate
is the number of correct classifiations divided by thetotal number of classifications (i.e TP+TN
TP+TN+FP+FN).
Finally, the error rate is 1 minus this.
• Confusion Matrix: Shows how many instances havebeen assigned to each class. Elements show the num-ber of test examples whose actual class is the row andwhose predicted class is the column. In the table 1, wecan see that there are 2 no instances are classified toyes, while 1 yes instance is mistaken as no.
4.3 ClusteringWEKA contains clusterer for finding groups of similar in-
stances in a dataset. There are different kind of implementedschemes, such as k-Means, EM, Cobweb, X-means and Far-thestFirst. Besides, clusters can be visualized and comparedto ”true” clusters (if given). If clustering scheme producesa probability distribution, the evaluation will be based onlog-likelihood.
In this report, we choose three different clusters: SimpleK-Means, HierarchicalClusterer and EM to analyse weatherdata.
Figure 9, figure 10 and figure 11 show visualize clusterassignments by the cluster ways of SimpleKMeans, Hierar-chicalClusterer and EM,respectively.
Table 2 shows the cluster output by Kmeans. We can seethat, there are 14 instances in total. They are clustered into

=== Run in format ion ===
Scheme :WEKA. c l a s s i f i e r s . t r e e s . J48 −C 0.25 −M 2Relat ion : weatherDataIn s tance s : 14Att r ibute s : 5
out looktemperaturehumiditywindyplay
Test mode : s p l i t 66.0% tra in , remainder t e s t
=== C l a s s i f i e r model ( f u l l t r a i n i n g s e t ) ===
J48 pruned t r e e−−−−−−−−−−−−−−−−−−
out look = Rainy| humidity = High : No ( 3 . 0 )| humidity = Normal : Yes ( 2 . 0 )out look = Overcast : Yes ( 4 . 0 )out look = Sunny| windy = False : Yes ( 3 . 0 )| windy = True : No ( 2 . 0 )
Number o f Leaves : 5
S i z e o f the t r e e : 8
Time taken to bu i ld model : 0 .03 seconds
=== Evaluat ion on t e s t s p l i t ====== Summary ===
Correc t ly C l a s s i f i e d In s tance s 2 40 %I n c o r r e c t l y C l a s s i f i e d In s tance s 3 60 %Kappa s t a t i s t i c −0.3636Mean abso lu t e e r r o r 0 .6Root mean squared e r r o r 0 .7746Re la t i v e abso lu t e e r r o r 126.9231 %Root r e l a t i v e squared e r r o r 157.6801 %Total Number o f In s tance s 5
=== Deta i l ed Accuracy By Class ===
TP Rate FP Rate P r e c i s i o n Reca l l F−Measure ROC Area Class0 0 .333 0 0 0 0 .333 No0.667 1 0 .5 0 .667 0 .571 0 .333 Yes
Weighted Avg . 0 . 4 0 .733 0 .3 0 .4 0 .343 0 .333
=== Confusion Matrix ===
a b <−− c l a s s i f i e d as0 2 | a = No1 2 | b = Yes
Table 1: Classifier output (J48)

Scheme :WEKA. c l u s t e r e r s . SimpleKMeans −N 2 −A ”WEKA. core . Euc l ideanDistance −R f i r s t −l a s t ” −I 500 −S 10Re lat ion : weather . symbol icIn s tance s : 14Att r ibute s : 5
out looktemperaturehumiditywindy
Ignored :play
Test mode : C la s s e s to c l u s t e r s eva lua t i on on t r a i n i n g data=== Model and eva lua t i on on t r a i n i n g s e t ===
kMeans======
Number o f i t e r a t i o n s : 4Within c l u s t e r sum of squared e r r o r s : 21.000000000000004Miss ing va lue s g l o b a l l y r ep laced with mean/mode
Clus te r c e n t r o i d s :C lus te r#
Attr ibute Fu l l Data 0 1(14) (10) (4 )
==============================================out look sunny sunny ove r ca s ttemperature mild mild coo lhumidity high high normalwindy FALSE FALSE TRUE
Time taken to bu i ld model ( f u l l t r a i n i n g data ) : 0 seconds
=== Model and eva lua t i on on t r a i n i n g s e t ===
Clustered In s tance s
0 10 ( 71%)1 4 ( 29%)
Class a t t r i b u t e : playC la s s e s to C lu s t e r s :
0 1 <−− as s i gned to c l u s t e r6 3 | yes4 1 | no
Clus te r 0 <−− yesClus te r 1 <−− no
I n c o r r e c t l y c l u s t e r e d i n s t a n c e s : 7 . 0 50 %
Table 2: Cluster output (Kmeans)

=== Run in format ion ===
Scheme : WEKA. a s s o c i a t i o n s . Apr i o r i −N 10 −T 0 −C 0.9 −D 0.05 −U 1.0 −M 0.1 −S −1.0 −c −1Re lat ion : weatherDataIn s tance s : 14Att r ibute s : 5
out looktemperaturehumiditywindyplay
=== Assoc i a to r model ( f u l l t r a i n i n g s e t ) ===
Apr io r i=======
Minimum support : 0 .15 (2 i n s t a n c e s )Minimum metr ic <conf idence >: 0 . 9Number o f c y c l e s performed : 17
Generated s e t s o f l a r g e i t emse t s :
S i z e o f s e t o f l a r g e i t emse t s L ( 1 ) : 12
S i z e o f s e t o f l a r g e i t emse t s L ( 2 ) : 47
S i z e o f s e t o f l a r g e i t emse t s L ( 3 ) : 39
S i z e o f s e t o f l a r g e i t emse t s L ( 4 ) : 6
Best r u l e s found :
1 . out look=Overcast 4 ==> play=Yes 4 conf : ( 1 )2 . temperature=Cool 4 ==> humidity=Normal 4 conf : ( 1 )3 . humidity=Normal windy=False 4 ==> play=Yes 4 conf : ( 1 )4 . out look=Rainy play=No 3 ==> humidity=High 3 conf : ( 1 )5 . out look=Rainy humidity=High 3 ==> play=No 3 conf : ( 1 )6 . out look=Sunny play=Yes 3 ==> windy=False 3 conf : ( 1 )7 . out look=Sunny windy=False 3 ==> play=Yes 3 conf : ( 1 )8 . temperature=Cool play=Yes 3 ==> humidity=Normal 3 conf : ( 1 )9 . out look=Rainy temperature=Hot 2 ==> humidity=High 2 conf : ( 1 )
10 . temperature=Hot play=No 2 ==> out look=Rainy 2 conf : ( 1 )
Table 3: Associator output (Apriori)
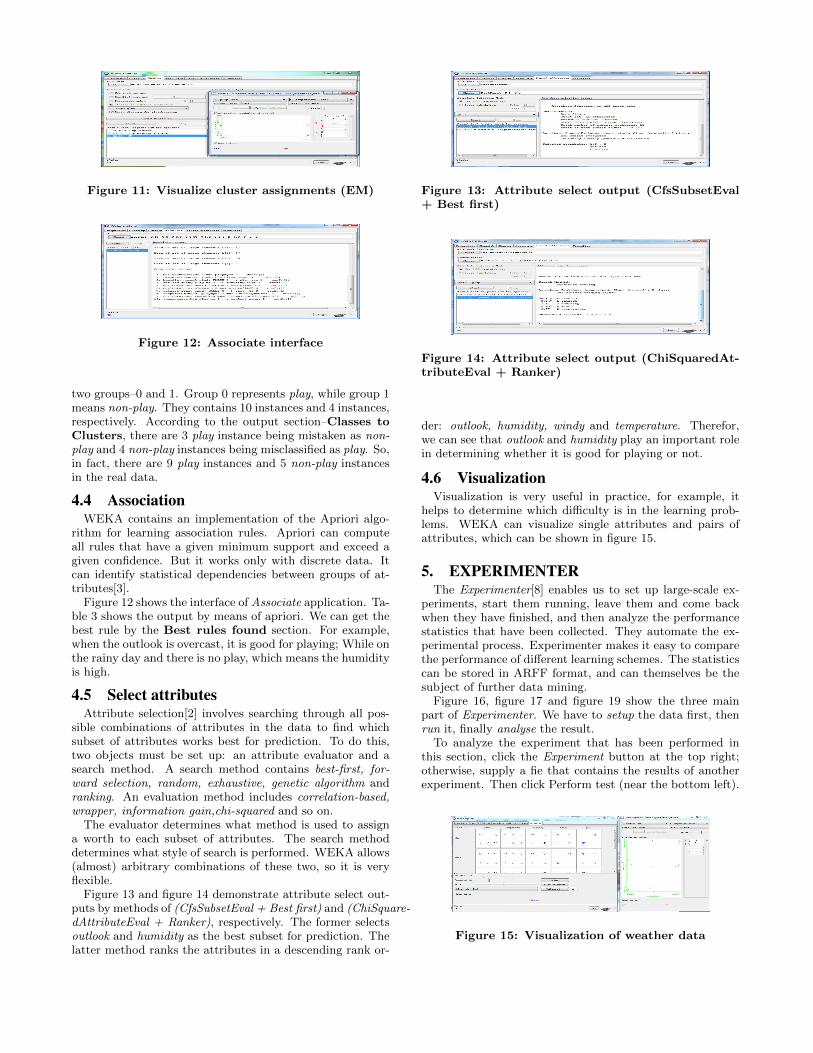
Figure 11: Visualize cluster assignments (EM)
Figure 12: Associate interface
two groups–0 and 1. Group 0 represents play, while group 1means non-play. They contains 10 instances and 4 instances,respectively. According to the output section–Classes toClusters, there are 3 play instance being mistaken as non-play and 4 non-play instances being misclassified as play. So,in fact, there are 9 play instances and 5 non-play instancesin the real data.
4.4 AssociationWEKA contains an implementation of the Apriori algo-
rithm for learning association rules. Apriori can computeall rules that have a given minimum support and exceed agiven confidence. But it works only with discrete data. Itcan identify statistical dependencies between groups of at-tributes[3].
Figure 12 shows the interface of Associate application. Ta-ble 3 shows the output by means of apriori. We can get thebest rule by the Best rules found section. For example,when the outlook is overcast, it is good for playing; While onthe rainy day and there is no play, which means the humidityis high.
4.5 Select attributesAttribute selection[2] involves searching through all pos-
sible combinations of attributes in the data to find whichsubset of attributes works best for prediction. To do this,two objects must be set up: an attribute evaluator and asearch method. A search method contains best-first, for-ward selection, random, exhaustive, genetic algorithm andranking. An evaluation method includes correlation-based,wrapper, information gain,chi-squared and so on.
The evaluator determines what method is used to assigna worth to each subset of attributes. The search methoddetermines what style of search is performed. WEKA allows(almost) arbitrary combinations of these two, so it is veryflexible.
Figure 13 and figure 14 demonstrate attribute select out-puts by methods of (CfsSubsetEval + Best first) and (ChiSquare-dAttributeEval + Ranker), respectively. The former selectsoutlook and humidity as the best subset for prediction. Thelatter method ranks the attributes in a descending rank or-
Figure 13: Attribute select output (CfsSubsetEval+ Best first)
Figure 14: Attribute select output (ChiSquaredAt-tributeEval + Ranker)
der: outlook, humidity, windy and temperature. Therefor,we can see that outlook and humidity play an important rolein determining whether it is good for playing or not.
4.6 VisualizationVisualization is very useful in practice, for example, it
helps to determine which difficulty is in the learning prob-lems. WEKA can visualize single attributes and pairs ofattributes, which can be shown in figure 15.
5. EXPERIMENTERThe Experimenter[8] enables us to set up large-scale ex-
periments, start them running, leave them and come backwhen they have finished, and then analyze the performancestatistics that have been collected. They automate the ex-perimental process. Experimenter makes it easy to comparethe performance of different learning schemes. The statisticscan be stored in ARFF format, and can themselves be thesubject of further data mining.
Figure 16, figure 17 and figure 19 show the three mainpart of Experimenter. We have to setup the data first, thenrun it, finally analyse the result.
To analyze the experiment that has been performed inthis section, click the Experiment button at the top right;otherwise, supply a fie that contains the results of anotherexperiment. Then click Perform test (near the bottom left).
Figure 15: Visualization of weather data
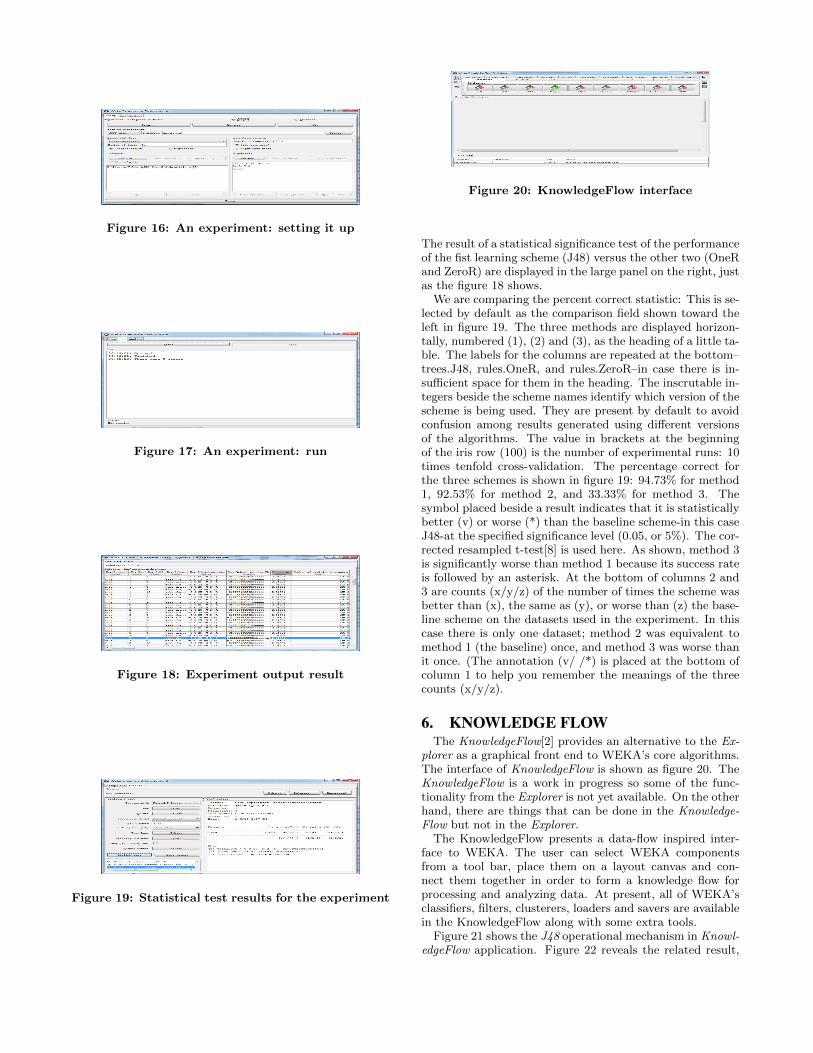
Figure 16: An experiment: setting it up
Figure 17: An experiment: run
Figure 18: Experiment output result
Figure 19: Statistical test results for the experiment
Figure 20: KnowledgeFlow interface
The result of a statistical significance test of the performanceof the fist learning scheme (J48) versus the other two (OneRand ZeroR) are displayed in the large panel on the right, justas the figure 18 shows.
We are comparing the percent correct statistic: This is se-lected by default as the comparison field shown toward theleft in figure 19. The three methods are displayed horizon-tally, numbered (1), (2) and (3), as the heading of a little ta-ble. The labels for the columns are repeated at the bottom–trees.J48, rules.OneR, and rules.ZeroR–in case there is in-sufficient space for them in the heading. The inscrutable in-tegers beside the scheme names identify which version of thescheme is being used. They are present by default to avoidconfusion among results generated using different versionsof the algorithms. The value in brackets at the beginningof the iris row (100) is the number of experimental runs: 10times tenfold cross-validation. The percentage correct forthe three schemes is shown in figure 19: 94.73% for method1, 92.53% for method 2, and 33.33% for method 3. Thesymbol placed beside a result indicates that it is statisticallybetter (v) or worse (*) than the baseline scheme-in this caseJ48-at the specified significance level (0.05, or 5%). The cor-rected resampled t-test[8] is used here. As shown, method 3is significantly worse than method 1 because its success rateis followed by an asterisk. At the bottom of columns 2 and3 are counts (x/y/z) of the number of times the scheme wasbetter than (x), the same as (y), or worse than (z) the base-line scheme on the datasets used in the experiment. In thiscase there is only one dataset; method 2 was equivalent tomethod 1 (the baseline) once, and method 3 was worse thanit once. (The annotation (v/ /*) is placed at the bottom ofcolumn 1 to help you remember the meanings of the threecounts (x/y/z).
6. KNOWLEDGE FLOWThe KnowledgeFlow[2] provides an alternative to the Ex-
plorer as a graphical front end to WEKA’s core algorithms.The interface of KnowledgeFlow is shown as figure 20. TheKnowledgeFlow is a work in progress so some of the func-tionality from the Explorer is not yet available. On the otherhand, there are things that can be done in the Knowledge-Flow but not in the Explorer.
The KnowledgeFlow presents a data-flow inspired inter-face to WEKA. The user can select WEKA componentsfrom a tool bar, place them on a layout canvas and con-nect them together in order to form a knowledge flow forprocessing and analyzing data. At present, all of WEKA’sclassifiers, filters, clusterers, loaders and savers are availablein the KnowledgeFlow along with some extra tools.
Figure 21 shows the J48 operational mechanism in Knowl-edgeFlow application. Figure 22 reveals the related result,
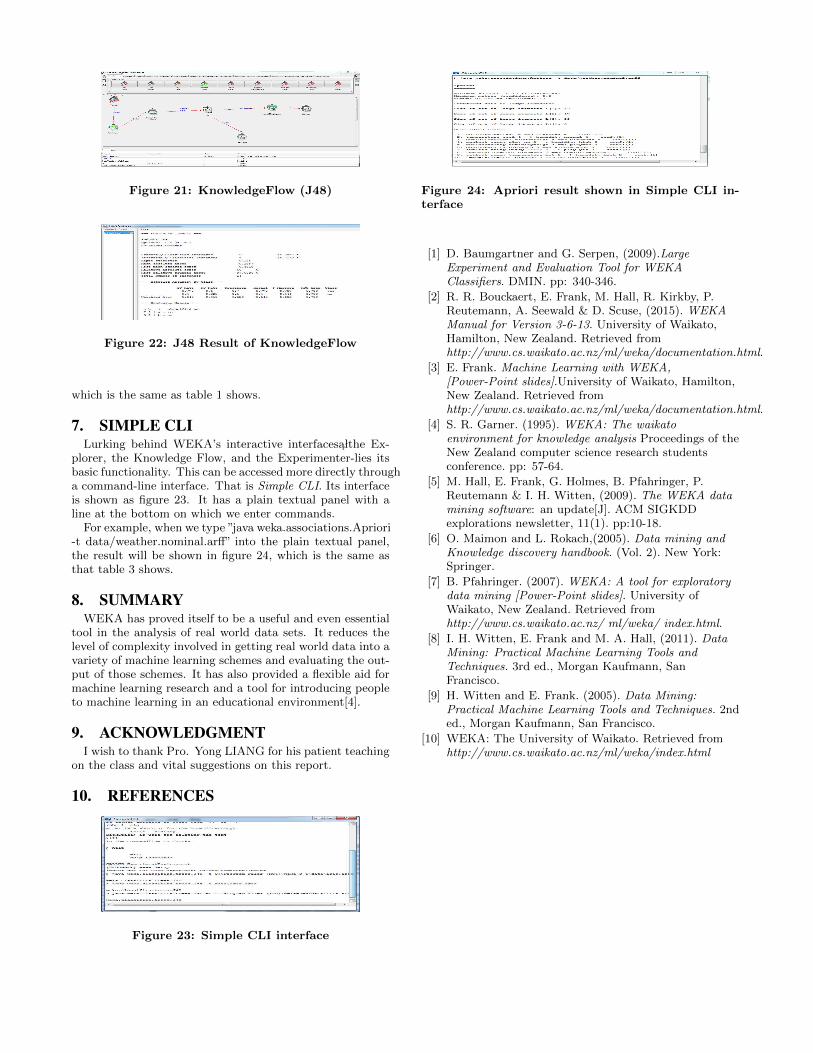
Figure 21: KnowledgeFlow (J48)
Figure 22: J48 Result of KnowledgeFlow
which is the same as table 1 shows.
7. SIMPLE CLILurking behind WEKA’s interactive interfaces ↪a lthe Ex-
plorer, the Knowledge Flow, and the Experimenter-lies itsbasic functionality. This can be accessed more directly througha command-line interface. That is Simple CLI. Its interfaceis shown as figure 23. It has a plain textual panel with aline at the bottom on which we enter commands.
For example, when we type ”java weka.associations.Apriori-t data/weather.nominal.arff” into the plain textual panel,the result will be shown in figure 24, which is the same asthat table 3 shows.
8. SUMMARYWEKA has proved itself to be a useful and even essential
tool in the analysis of real world data sets. It reduces thelevel of complexity involved in getting real world data into avariety of machine learning schemes and evaluating the out-put of those schemes. It has also provided a flexible aid formachine learning research and a tool for introducing peopleto machine learning in an educational environment[4].
9. ACKNOWLEDGMENTI wish to thank Pro. Yong LIANG for his patient teaching
on the class and vital suggestions on this report.
10. REFERENCES
Figure 23: Simple CLI interface
Figure 24: Apriori result shown in Simple CLI in-terface
[1] D. Baumgartner and G. Serpen, (2009).LargeExperiment and Evaluation Tool for WEKAClassifiers. DMIN. pp: 340-346.
[2] R. R. Bouckaert, E. Frank, M. Hall, R. Kirkby, P.Reutemann, A. Seewald & D. Scuse, (2015). WEKAManual for Version 3-6-13. University of Waikato,Hamilton, New Zealand. Retrieved fromhttp://www.cs.waikato.ac.nz/ml/weka/documentation.html.
[3] E. Frank. Machine Learning with WEKA,[Power-Point slides].University of Waikato, Hamilton,New Zealand. Retrieved fromhttp://www.cs.waikato.ac.nz/ml/weka/documentation.html.
[4] S. R. Garner. (1995). WEKA: The waikatoenvironment for knowledge analysis Proceedings of theNew Zealand computer science research studentsconference. pp: 57-64.
[5] M. Hall, E. Frank, G. Holmes, B. Pfahringer, P.Reutemann & I. H. Witten, (2009). The WEKA datamining software: an update[J]. ACM SIGKDDexplorations newsletter, 11(1). pp:10-18.
[6] O. Maimon and L. Rokach,(2005). Data mining andKnowledge discovery handbook. (Vol. 2). New York:Springer.
[7] B. Pfahringer. (2007). WEKA: A tool for exploratorydata mining [Power-Point slides]. University ofWaikato, New Zealand. Retrieved fromhttp://www.cs.waikato.ac.nz/ ml/weka/ index.html.
[8] I. H. Witten, E. Frank and M. A. Hall, (2011). DataMining: Practical Machine Learning Tools andTechniques. 3rd ed., Morgan Kaufmann, SanFrancisco.
[9] H. Witten and E. Frank. (2005). Data Mining:Practical Machine Learning Tools and Techniques. 2nded., Morgan Kaufmann, San Francisco.
[10] WEKA: The University of Waikato. Retrieved fromhttp://www.cs.waikato.ac.nz/ml/weka/index.html