an introduction to the weka data mining systemmarkov/papers/weka.pdfan introduction to the weka data...
TRANSCRIPT

An Introduction to the WEKA Data Mining System
Zdravko Markov
Central Connecticut State University
Ingrid Russell
University of Hartford
Agenda
• Data Mining
• Weka Project
• Basic functionality of Weka by example
• Weka for document classification and clustering

Database management systems (DBMS), Online
Analytical Processing (OLAP) and Data Mining
Area DBMS OLAP Data Mining
TaskExtraction of detailed
and summary data
Summaries, trends
and forecasts
Knowledge
discovery of hidden
patterns and
insights
Type of result Information AnalysisInsight and
Prediction
Method
Deduction (Ask the
question, verify with
data)
Multidimensional
data modeling,
Aggregation,
Statistics
Induction (Build the
model, apply it to
new data, get the
result)
Example
question
Who purchased mutual
funds in the last 3 years?
What is the average
income of mutual
fund buyers by
region by year?
Who will buy a
mutual fund in the
next 6 months and
why?
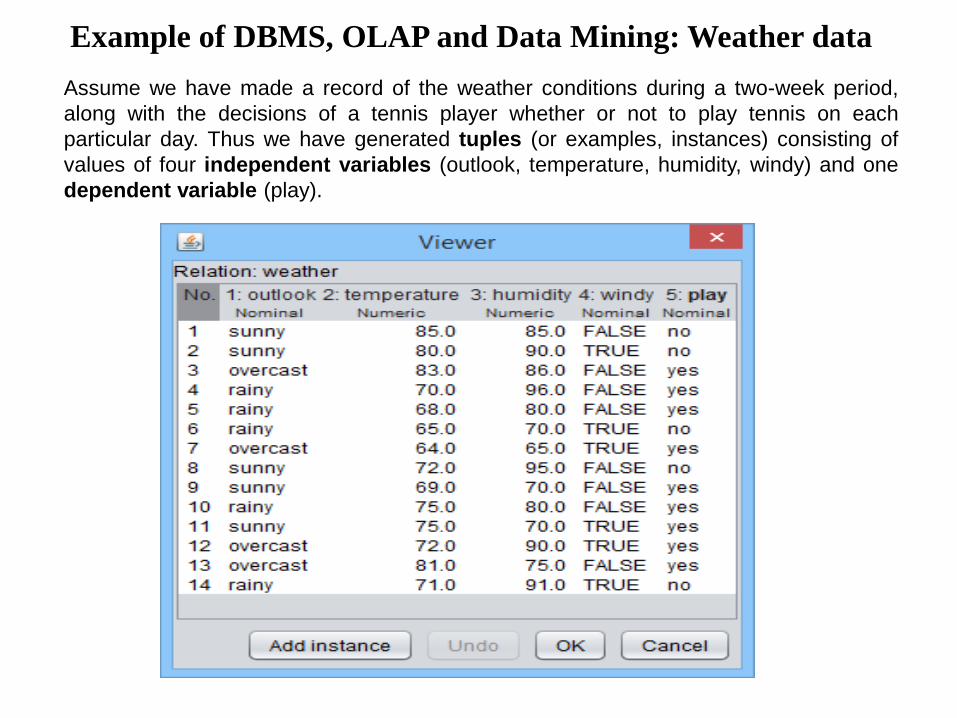
Example of DBMS, OLAP and Data Mining: Weather data
Assume we have made a record of the weather conditions during a two-week period,
along with the decisions of a tennis player whether or not to play tennis on each
particular day. Thus we have generated tuples (or examples, instances) consisting of
values of four independent variables (outlook, temperature, humidity, windy) and one
dependent variable (play).

• What was the temperature in the sunny days? {85, 80, 72, 69, 75}
• Which days the humidity was less than 75? {6, 7, 9, 11}
• Which days the temperature was greater than 70? {1, 2, 3, 8, 10, 11, 12, 13, 14}
• Which days the temperature was greater than 70 and the humidity was less than 75?
The intersection of the above two: {11}
Data-Base Management System

OLAP: Multidimensional Model (Data Cube)
9 / 5 sunny rainy overcast
Week 1 0 / 2 2 / 1 2 / 0
Week 2 2 / 1 1 / 1 2 / 0
Dimensions:
• Time: Week 1={1, 2, 3, 4, 5, 6, 7}, Week 2={8, 9, 10, 11, 12, 13, 14}
• Outlook: {sunny, rainy, overcast}
Unit: play (yes/no)
if outlook = overcast then play = yes

Data Mining: Association Rules
Discretize numeric attributes (data pre-processing
stage in data mining). Group the temperature values in
three intervals (hot, mild, cool) and humidity values in
two (high, normal).
1. humidity=normal windy=false 4 ==> play=yes (4, 1)
2. temperature=cool 4 ==> humidity=normal (4, 1)
3. outlook=overcast 4 ==> play=yes (4, 1)
4. temperature=cool play=yes 3 ==> humidity=normal (3, 1)
5. outlook=rainy windy=false 3 ==> play=yes (3, 1)
6. outlook=rainy play=yes 3 ==> windy=false (3, 1)
7. outlook=sunny humidity=high 3 ==> play=no (3, 1)
8. outlook=sunny play=no 3 ==> humidity=high (3, 1)
9. temperature=cool windy=false 2 ==> humidity=normal play=yes (2, 1)
10. temperature=cool humidity=normal windy=false 2 ==> play=yes (2, 1)

Data Mining: Decision Tree and Rules
If outlook = overcast then yes
If humidity = normal and windy = false then yes
If temperature = mild and humidity = normal then yes
If outlook = rainy and windy = false then yes
If outlook = sunny and humidity = high then no
If outlook = rainy and windy = true then no

Data Mining: Prediction
P(play=yes | outlook=sunny, temperature=mild, humidity=normal, windy=false) = 0.8
P(play=no | outlook=sunny, temperature=mild, humidity=normal, windy=false) = 0.2

Weka Project

12 Years ago …KDnuggets : News : 2005 : n13 : item2
SIGKDD Service Award is the highest service award in the field of data mining and knowledge discovery. It is is given to one individual or one group who has performed significant service to the data mining and knowledge discovery field, including professional volunteer services in disseminating technical information to the field, education, and research funding.
The 2005 ACM SIGKDD Service Award is presented to the Weka team for their development of the freely-available Weka Data Mining Software, including the accompanying book Data Mining: Practical Machine Learning Tools and Techniques (now in second edition) and much other documentation.
The Weka team includes Ian H. Witten and Eibe Frank, and the following major contributors (in alphabetical order of last names): Remco R. Bouckaert, John G. Cleary, Sally Jo Cunningham, Andrew Donkin, Dale Fletcher, Steve Garner, Mark A. Hall, Geoffrey Holmes, Matt Humphrey, Lyn Hunt, Stuart Inglis, Ashraf M. Kibriya, Richard Kirkby, Brent Martin, Bob McQueen, Craig G. Nevill-Manning, Bernhard Pfahringer, Peter Reutemann, Gabi Schmidberger, Lloyd A. Smith, Tony C. Smith, Kai Ming Ting, Leonard E. Trigg, Yong Wang, Malcolm Ware, and Xin Xu.
The Weka team has put a tremendous amount of effort into continuously developing and maintaining the system since 1994. The development of Weka was funded by a grant from the New Zealand Government's Foundation for Research, Science and Technology.
The key features responsible for Weka's success are:
– it provides many different algorithms for data mining and machine learning
– is is open source and freely available
– it is platform-independent
– it is easily usable by people who are not data mining specialists
– it provides flexible facilities for scripting experiments
– it has kept up-to-date, with new algorithms being added as they appear in the research literature.

12 Years ago …
KDnuggets : News : 2005 : n13 : item2 (cont.)
The Weka Data Mining Software has been downloaded 200,000 times since it was put on SourceForge in April 2000, and is currently downloaded at a rate of 10,000/month. The Weka mailing list has over 1100 subscribers in 50 countries, including subscribers from many major companies.
There are 15 well-documented substantial projects that incorporate, wrap or extend Weka, and no doubt many more that have not been reported on Sourceforge.
Ian H. Witten and Eibe Frank also wrote a very popular book "Data Mining: Practical Machine Learning Tools and Techniques" (now in the second edition), that seamlessly integrates Weka system into teaching of data mining and machine learning. In addition, they provided excellent teaching material on the book website.
This book became one of the most popular textbooks for data mining and machine learning, and is very frequently cited in scientific publications.
Weka is a landmark system in the history of the data mining and machine learning research communities, because it is the only toolkit that has gained such widespread adoption and survived for an extended period of time (the first version of Weka was released 11 years ago). Other data mining and machine learning systems that have achieved this are individual systems, such as C4.5, not toolkits.
Since Weka is freely available for download and offers many powerful features (sometimes not found in commercial data mining software), it has become one of the most widely used data mining systems. Weka also became one of the favorite vehicles for data mining research and helped to advance it by making many powerful features available to all.
In sum, the Weka team has made an outstanding contribution to the data mining field.

Now …


Machine Learning, Data and Web Mining
by Example
(“learning by doing” approach)
• Data preprocessing and visualization
• Attribute selection
• Classification (OneR, Decision trees)
• Prediction (Nearest neighbor)
• Model evaluation
• Clustering (K-means)
• Association rules

Data preprocessing and visualization
Initial Data Preparation(Weka data input)
• Raw data (Japanese loan data)
• Web/Text documents (Department data)

Data preprocessing and visualization
Japanese loan data (a sample from a loan history database of a Japanese bank)
Clients: s1,..., s20
• Approved loan: s1, s2, s4, s5, s6, s7, s8, s9, s14, s15, s17, s18, s19
• Rejected loan: s3, s10, s11, s12, s13, s16, s20
Clients data:• unemployed clients: s3, s10, s12
• loan is to buy a personal computer: s1, s2, s3, s4, s5, s6, s7, s8, s9, s10
• loan is to buy a car: s11, s12, s13, s14, s15, s16, s17, s18, s19, s20
• male clients: s6, s7, s8, s9, s10, s16, s17, s18, s19, s20
• not married: s1, s2, s5, s6, s7, s11, s13, s14, s16, s18
• live in problematic area: s3, s5
• age: s1=18, s2=20, s3=25, s4=40, s5=50, s6=18, s7=22, s8=28, s9=40, s10=50, s11=18, s12=20,
s13=25, s14=38, s15=50, s16=19, s17=21, s18=25, s19=38, s20=50
• money in a bank (x10000 yen): s1=20, s2=10, s3=5, s4=5, s5=5, s6=10, s7=10, s8=15, s9=20, s10=5,
s11=50, s12=50, s13=50, s14=150, s15=50, s16=50, s17=150, s18=150, s19=100, s20=50
• monthly pay (x10000 yen): s1=2, s2=2, s3=4, s4=7, s5=4, s6=5, s7=3, s8=4, s9=2, s10=4, s11=8,
s12=10, s13=5, s14=10, s15=15, s16=7, s17=3, s18=10, s19=10, s20=10
• months for the loan: s1=15, s2=20, s3=12, s4=12, s5=12, s6=8, s7=8, s8=10, s9=20, s10=12, s11=20,
s12=20, s13=20, s14=20, s15=20, s16=20, s17=20, s18=20, s19=20, s20=30
• years with the last employer: s1=1, s2=2, s3=0, s4=2, s5=25, s6=1, s7=4, s8=5, s9=15, s10=0, s11=1,
s12=2, s13=5, s14=15, s15=8, s16=2, s17=3, s18=2, s19=15, s20=2

Data preprocessing and visualization
Loan data – CSV format
(LoanData.csv)
Relations, attributes, tuples (instances)

Data preprocessing and visualizationAttribute-Relation File Format (ARFF) - http://www.cs.waikato.ac.nz/~ml/weka/arff.html

Data preprocessing and visualization
Run Weka and select the Explorer

Data preprocessing and visualization
Load data into Weka – ARFF format or CSV format (click on “Open file…”)

Data preprocessing and visualization
Converting data formats through Weka (click on “Save…”)

Data preprocessing and visualization
Editing data in Weka (click on ”Edit…”)

Data preprocessing and visualization
Examining data• Attribute type and properties
• Class (last attribute) distribution

Data preprocessing and visualizationClick on “Visualize All”

Data preprocessing and visualizationClick on “Visualize” tab, double-click on a plot to see the 2D projection of the instance space

Data preprocessing and visualizationUsing filters: click on “Choose” in the “Filter” window, select “Discretize”

Data preprocessing and visualizationClick in the “Discretize” in the Filter window and choose parameters, then click on “Apply”
Note how the plot
of “lastemp”
changed.

Data preprocessing and visualization
Web/Text documents - Department data

Data preprocessing and visualization
Department data document collection
http://www.cs.ccsu.edu/~markov/MDLclustering
http://www.cs.ccsu.edu/~markov/MDLclustering/data.zip

Data preprocessing and visualization
Department data: Create ARFF file
http://www.cs.ccsu.edu/~markov/MDLclustering/MDL.jar
Data preprocessing and visualization
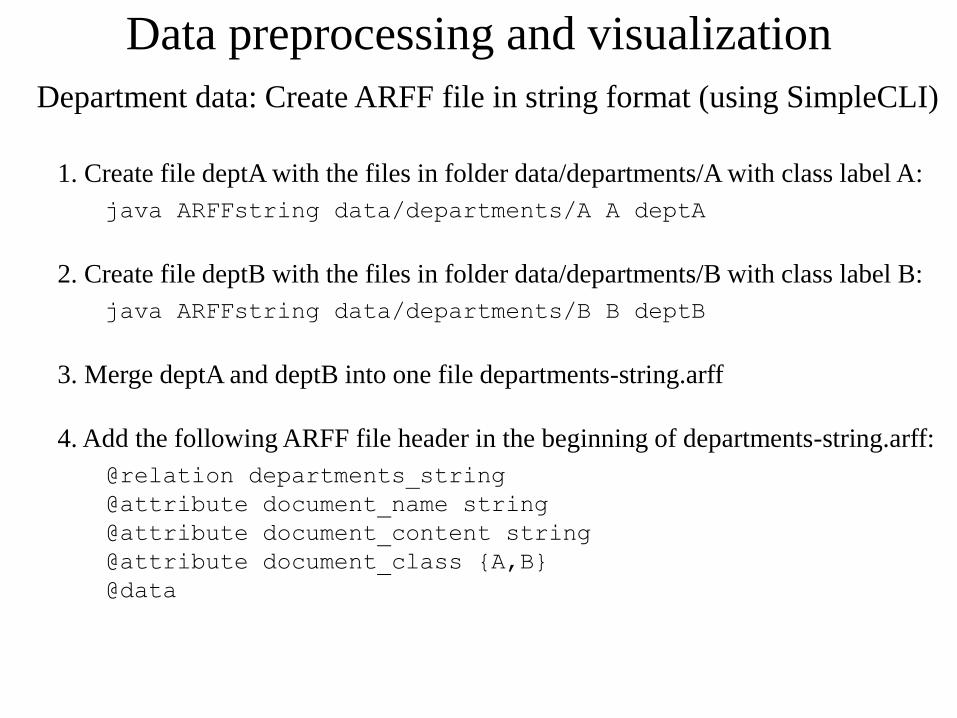
Department data: Create ARFF file in string format (using SimpleCLI)
1. Create file deptA with the files in folder data/departments/A with class label A:
java ARFFstring data/departments/A A deptA
2. Create file deptB with the files in folder data/departments/B with class label B:
java ARFFstring data/departments/B B deptB
3. Merge deptA and deptB into one file departments-string.arff
4. Add the following ARFF file header in the beginning of departments-string.arff:
@relation departments_string
@attribute document_name string
@attribute document_content string
@attribute document_class {A,B}
@data

Data preprocessing and visualization
Loading text data in Weka• String format for ID and content
• One document per line
• Add class (nominal) if needed

Data preprocessing and visualization
Converting a string attribute into nominal
Choose filters/unsupervised/attribute/StringToNominal, set attributeRange to 1, click on Apply

Data preprocessing and visualizationConverting text data into TFIDF (Term Frequency – Inverted Document Frequency) attribute format
• Choose filters/unsupervised/attribute/StringToWordVector
• Set the parameters as needed (see “More”)
• Click on “Apply”

Data preprocessing and visualizationMake document_class last attribute• Choose filters/unsupervised/attribute/Copy
• Set the index to 2 and click on Apply
• Remove attribute 2

Data preprocessing and visualization• Change the attributes to nominal (use NumericToNominal filter)
• Save data on a file for further use

Data preprocessing and visualizationARFF department data in binary format (NonSparse and Sparse format, see SparseToNonSparse filter)

Data preprocessing and visualizationARFF department data in TF and TFIDF format
Data preprocessing and visualization
• Preprocess.html
• Visualization.html
Student Projects

Attribute SelectionFinding a minimal set of attributes that preserve the class distribution
IF accounting=1 THEN class=A (Error=0, Coverage = 1 instance → overfitting )
IF accounting=0 THEN class=B (Error=10/19, Coverage = 19 instances → low accuracy)
Attribute relevance with respect to the class – irrelevant attribute (accounting)

Attribute SelectionAttribute relevance with respect to the class – relevant attribute (science)
IF science=1 THEN class=A (Error=0, Coverage = 7 instance)
IF science=0 THEN class=B (Error=4/13, Coverage = 13 instances)

Attribute Selection (with document_name)

Attribute Selection (without document_name)
Select document_name and
click on Remove

Attribute Selection (ranking)

Attribute Selection (explanation of ranking)

Attribute Selection (using filters)• Choose filters/supervised/attribute/AttributeSelection
• Set parameters to InfoGainAttributeEval and Ranker
• Click on Apply and see the attribute ordering

Attribute Selection (using filters)Choose filters/supervised/attribute/AttributeSelection and use CfsSubsetEval and BestFirst search.
Then click on Visualize All

Classification – creating models (hypotheses)Mapping (independent attributes -> class)

Classification – creating models (hypotheses)
Inferring one-attribute rules - OneR
Attribute Rules Errors Total
error
outlook sunny -> no
overcast -> yes
rainy -> yes
2/5
0/4
2/5
4/14
temperature hot -> no
mild -> yes
cool -> yes
2/4
2/6
1/4
5/14
humidity high -> no
normal -> yes
3/7
1/7
4/14
windy false -> yes
true -> no
2/8
3/5
5/14
Weather data (weather.nominal.arff)

Classification – OneR

Classification – decision treeRight click on the highlighted line in Result list and choose Visualize tree

Classification – decision tree
Top-down induction of decision trees (TDIDT, old approach know
from pattern recognition):
• Select an attribute for root node and create a branch for each
possible attribute value.
• Split the instances into subsets (one for each branch
extending from the node).
• Repeat the procedure recursively for each branch, using only
instances that reach the branch (those that satisfy the
conditions along the path from the root to the branch).
• Stop if all instances have the same class.
ID3, C4.5, J48 (Weka): Select the attribute that minimizes the class
entropy in the split.

Classification – numeric attributes
weather.arff

Classification – predicting classClick on Set… Click on Open file…

Classification – predicting classRight click on the highlighted line in Result list and choose Visualize classifier errors
Click on the square

Classification – predicting class
Click on Save


Prediction (no model, lazy learning)test: (sunny, cool, high, TRUE, ?)
X 2 8 9 11 12 … 10
Distance(test,X) 1 2 2 2 2 … 4
play no no yes yes yes … yes
• K-nearest neighbor (IBk)Take the class of the nearest neighbor
or the majority class among K neighbors
K=1 -> no
K=3 -> no
K=5 -> yes
K=14 -> yes (Majority predictor, ZeroR)
• Distance is calculated as the number of different attribute values
• Euclidean distance for numeric attributes
• Weighted K-nearest neighborK=5 -> undecided
no=1/1+1/2=1.5
yes=1/2+1/2+1/2=1.5

Prediction (no model, lazy learning)


Model evaluation – holdout (percentage split)

Model evaluation – cross validation

Model evaluation – leave one out cross validation

Model evaluation – confusion (contingency) matrix
yes no
yes 3 1
no 1 0
predicted
actu
al
yes no
yes TP FN
no FP TN
actu
al
predicted
Precision = TP/(TP+FP)
Recall = TP/(TP+FN)


Clustering – k-meansClick on Ignore attributes
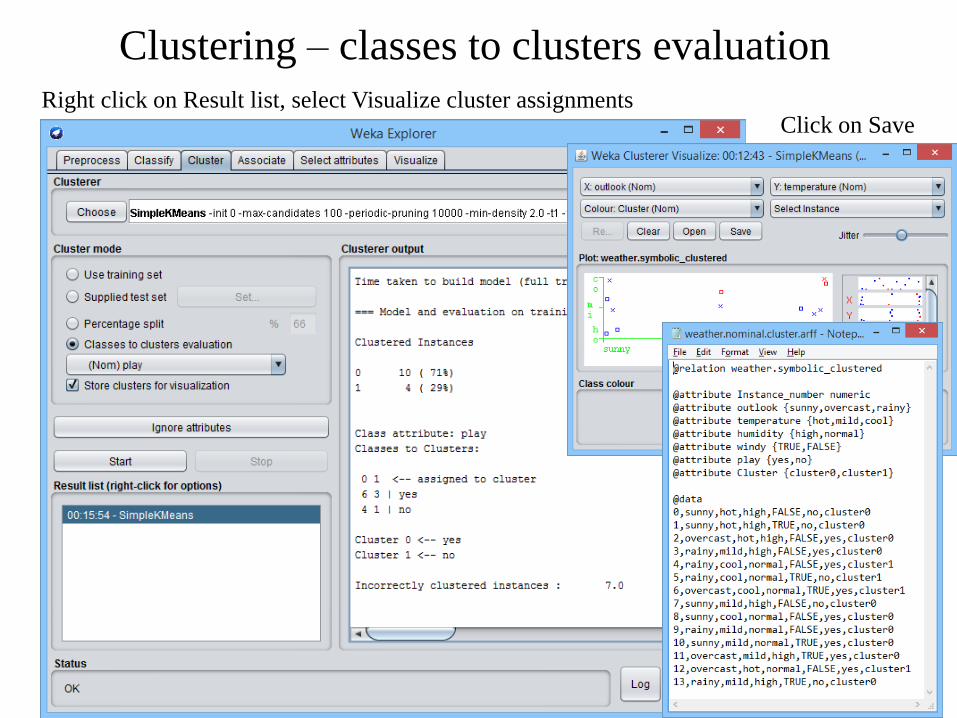
Clustering – classes to clusters evaluationRight click on Result list, select Visualize cluster assignments
Click on Save


Association Rules (A => B)
• Confidence (accuracy): P(B|A) = (# of tuples containing both A and B) / (# of tuples containing A).
• Support (coverage): P(A,B) = (# of tuples containing both A and B) / (total # of tuples)


Document classification and clustering
Predict the class of the Theatre document
1. Create a training set – all departments excluding Theatre
(data collection)
2. Use Binary, Term Frequency or TFIDF representation
(data preprocessing)
3. Select a relevant subset of attributes (attribute selection)
4. Use J48, IBk, and Naïve Bayes (classification)
5. Evaluate all models by cross validation (model
evaluation)
6. Choose the best model and predict the class of Theatre
(prediction)
7. Cluster the training set with K-means compare the
cluster centroids with Theatre

Document classification and clustering
• Zdravko Markov and Daniel T. Larose, Data Mining the Web:
Uncovering Patterns in Web Content, Structure, and Usage, Wiley 2007
(free excerpts: Chapter 1, TOC, Index)
• Lecture slides: dmw1.pdf, dmw2.pdf, dmw3.pdf, dmw4.pdf, dmw5.pdf
• Data sets: http://www.cs.ccsu.edu/~markov/dmwdata.zip
• Clustering.html
Teaching resources and student projects based on Weka
http://www.cs.ccsu.edu/~markov/MDLclustering/
http://www.cs.ccsu.edu/~markov/DMWprojects