table of contents - waxahachie, texas fees final … · 2015 waxahachie roadway impact fee update...
TRANSCRIPT
TABLE OF CONTENTS
List of Tables and Figures ii
1. Introduction ..........................................................................................................................1
2. Roadway Impact Fee Service Areas .....................................................................................3
3. Roadway Impact Fee Service Units .....................................................................................5
4. Existing Conditions Analysis .............................................................................................11
5. Projected Conditions Analysis ..........................................................................................14
6. Calculation of Impact Fees ................................................................................................21
7. Conclusions ........................................................................................................................23
Appendices .....................................................................................................................................25
A. Roadway Impact Fee Definitions
B. Land Use Definitions
C. Existing Capital Improvements
D. Calculation of Vehicle-Miles of New Demand
E. Roadway Improvements Plan Projects
F. Roadway Improvements Plan Cost Analysis
G. Service Area Analysis Summary
i
LIST OF TABLES
Page
1. Trip Reduction Estimates (PM Peak Hour) .........................................................................8
2 Average Trip Lengths ..........................................................................................................8
3. Land Use/Vehicle-Mile Equivalency Table .......................................................................10
4. Roadway Facility Vehicle-Mile Capacities ........................................................................11
5. Peak Hour Vehicle-Miles of Excess Capacity and Demand ..............................................12
6. Peak Hour Vehicle-Miles of Excess Capacity and Existing Deficiencies .........................13
7. Vehicle-Miles of New Demand .........................................................................................14
8. Roadway Impact Fee Capital Improvements Plan .............................................................18
9. Vehicle-Miles of New Capacity Supplied..........................................................................19
10. Summary of Roadway Improvements Plan Cost Analysis ................................................20
11. Capital Improvements Plan Costs Attributable to New Development ..............................20
12. Cost per Service Unit Summary ........................................................................................20
LIST OF FIGURES
Page
1. Service Areas for Roadway Impact Fees .............................................................................4
2. Roadway Impact Fee Capital Improvement Project Locations ..........................................17
ii
2015 Waxahachie Roadway Impact Fee Update Final Report
Freese and Nichols, Inc. Page 1
1. Introduction Waxahachie first implemented roadway impact fees in 2008 as a finance mechanism to help fund
transportation improvements necessitated by new growth. Since the inception of the program, impact
fee have been used to implement a number of projects citywide. Improvements facilitated by the
impact fee program have resulted in better accessibility and circulation to growing portions of the city.
In 2013, the roadway impact fee program was updated to include a variety of project additions and
modifications.
Texas initially authorized the use of impact fees with the passage of Senate Bill 336 during the 1987
legislature. Now codified in Section 395 of the Texas Local Government Codes, the legislation
authorizes cities to collect fees from new developments to finance new construction or expansion of
capital improvements such as road, water and wastewater facilities. The law stipulates that all fees
collected from new development must not exceed the maximum amount calculated by the
methodology described therein. The law also mandates that impact fee systems be updated
periodically to ensure existence of excess capacity of the capital improvement plan and that costs
necessitated by new growth are accurately reflected in the cost per service unit calculation.
Modifications to the capital improvement plan (CIP) may be made, subject to compliance with the
city’s official thoroughfare plan.
The implementation and administration of roadway impact fee systems offers several advantages to
both a city and new development among which include: 1) a systematic, structured approach to
assessment of fees, 2) a clear, equitable distribution of costs associated with the impact of new
development, 3) the ability to pool funds for project initiation within a service area, 4) assurance that
fees collected will be spent in the area where new development is occurring, 5) up-front knowledge of
fees to be imposed, 6) credits for developer participation, and 7) ability for developers to demonstrate
that, pursuant to city guidelines, specific unit equivalencies (service unit generation) may be different
from those presented in the land use equivalency table.
This update amends the roadway capital improvements program to incorporate specific roadway
project additions in Service Areas 1 and 3 deemed necessary to address future growth in the
northwestern sector of the city. Per procedural requirements establish in Chapter 395, proper public
noticing, work through the Capital Improvements Advisory Committee and public hearing process was
initiated to consider the impact fee program amendments.
2015 Waxahachie Roadway Impact Fee Update Final Report
Freese and Nichols, Inc. Page 2
Study Methodology The following steps were undertaken as part of the program update:
1. Meetings were held with the City of Waxahachie Staff and the Capital Improvement Advisory
Committee to discuss technical approach and proposed impact fee CIP amendments.
2. Roadway costs (construction, engineering, right-of-way, and project financing) were prepared
for proposed project additions and incorporated into the overall program costs. The resultant
roadway costs were compiled by service area.
3. The cost of capacity supplied, cost attributable to new development and the maximum cost per
service unit was calculated for each service area. A credit of 50% was applied to the overall
cost of the capital improvements program for use in the calculation of the cost per service unit.
4. With the recent impact fee update in 2013, no changes were made to land use assumptions,
land use equivalencies or service area structure (contained to the current city limits). With no
changes in land use assumptions or land use equivalencies, there was no change in projected
10-year growth for the city.
5. The vehicle-mile of travel (VMT) during the PM peak hour was retained as the unit of measure
for the roadway impact fee system.
6. Traffic volume count data collected as part of the 2013 update was reviewed and determined to
remain valid. Traffic data collection at five locations was conducted in the northwestern sector
of the city to supplement existing count data. This data was used to assess the existing
roadway system for deficiencies and the impact fee CIP for excess capacity. The analysis of
the existing impact fee CIP revealed excess capacity and therefore could remain in the impact
fee program.
7. This report was prepared to document the procedures, findings, and conclusions of the study.
Organization of Report
This report describes the background information, analysis, and findings of the study is as follows:
• Roadway Impact Fee Service Areas (Section 2)
• Roadway Impact Fee Service Units (Section 3)
• Existing Conditions Analysis (Section 4)
• Projected Conditions Analysis (Section 5)
• Calculation of Impact Fees (Section 6)
• Conclusion (Section 7)
2015 Waxahachie Roadway Impact Fee Update Final Report
Freese and Nichols, Inc. Page 3
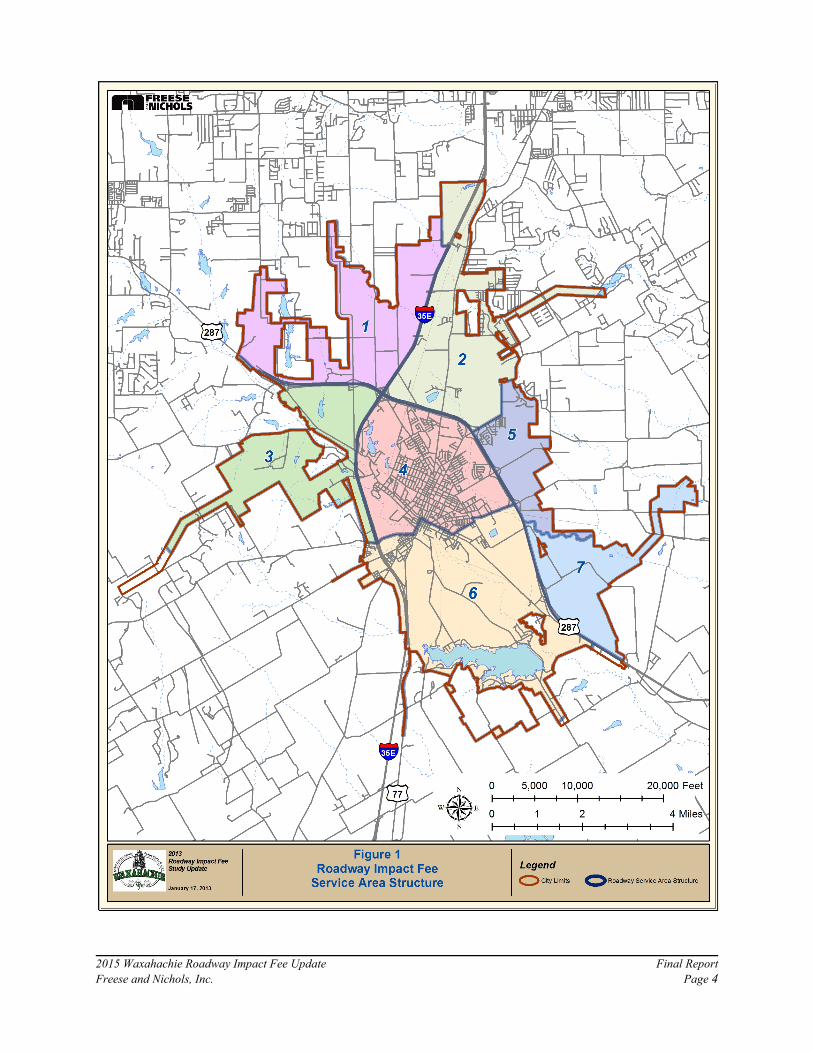
2. Roadway Impact Fee Service Areas
Chapter 395 requires that service areas be defined for impact fees to ensure that facility improvements
are located in proximity to the area that is generating needs. Legislation requires that roadway service
areas be limited to a six-mile maximum and must be located within the current city limits.
Transportation service areas are different from other impact fee service areas, which can include the
city limits and Extra Territorial Jurisdiction (ETJ). This is primarily because roadway systems are
"open" to both local and regional use as opposed to a defined limit of service that is provided with
water and wastewater systems. The result is that new development can only be assessed an impact fee
based on the cost of necessary capital improvements within that service area.
Waxahachie’s roadway impact fee system contains seven service areas. No changes were made to the
service area structure. The service area structure for Waxahachie is illustrated in Figure 1.
2015 Waxahachie Roadway Impact Fee Update Final Report
Freese and Nichols, Inc. Page 4
2015 Waxahachie Roadway Impact Fee Update Final Report
Freese and Nichols, Inc. Page 5
3. Roadway Impact Fee Service Units
An important aspect of the impact fee system is the determination of the proper service unit to be used
to calculate and assess impact fees for new developments. As defined in Chapter 395, "Service unit
means a standardized measure of consumption, use, generation, or discharge attributable to an
individual unit of development in accordance with generally accepted engineering or planning
standards for a particular category of capital improvements or facility expansions."
To determine the transportation impact fee for a particular development, the service unit must
accurately identify the impact that the development will have on the transportation system serving the
development. This impact is a combination of the number of new trips generated by the development,
the particular peaking characteristics of the land use(s) within the development, and the length of each
new trip on the transportation system.
The correct service unit must also reflect the supply, which is provided by the roadway system, and the
demand placed on the system during the time in which peak, or design, conditions are present on the
system. Transportation facilities are designed and constructed to accommodate volumes expected to
occur during the peak hours (design hours). These volumes typically occur during the morning (AM)
and evening (PM) rush hours as motorists travel to and from work.
The vehicle-mile serves as the service unit for calculating and assessing transportation impact fees in
Waxahachie. The vehicle-mile as a service unit establishes a way to relate the intensity of land
development to the demand on the system through the use of published trip generation data. It also
recognizes state legislation requirements with regards to trip length.
The PM peak hour was retained as the time period for assessing impacts because the greatest demand
for roadway capacity occurs during this hour. Roadways are sized to meet this demand, and roadway
capacity can more easily be defined on an hourly basis.
Service Units
Service units create a link between supply (roadway projects) and demand (development). Both can
be expressed as a combination of the number of vehicles traveling during the peak hour and the
distance traveled by these vehicles in miles.
Service Unit Supply
For roadway capital projects improvement, the number of service units provided during the peak hour
is simply the product of the capacity of the roadway in one hour and the length of the project. For
2015 Waxahachie Roadway Impact Fee Update Final Report
Freese and Nichols, Inc. Page 6
example:
Given a four lane divided roadway project with a 600 vehicle per hour per lane capacity and a
length of two miles, the number of service units provided is:
600 vehicles per hour per lane x 4 lanes x 2 miles = 4,800 vehicle-miles
Service Unit Demand
The demand placed on the system can be expressed in a similar manner. For example, a development
generating 100 vehicle trips in the PM peak hour with an average trip length of two miles would
generate:
100 vehicle-trips x 2 miles/trip = 200 vehicle-miles
Likewise, the existing demand placed on the roadway network is calculated in the same manner with a
known traffic volume (peak hour roadway tube counts) on a street and a given segment length.
Service Units for New Development
An important objective in the implementation of the impact fee system is the identification of a
specific service unit equivalency for individual developments. The vehicle-miles generated by a new
development are a function of the trip generation and average trip length characteristics of that
development. The following describes the process used to develop the vehicle-equivalency table,
which relates land use types and sizes to the resulting vehicle-miles of demand created by that
development.
Travel characteristics were deemed to be similar in nature to the previous system update, and therefore
no changes were made to the resultant land use equivalency table.
Trip Generation
Trip generation information for the PM peak hour was based on data published in the Ninth Edition of
Trip Generation by the Institute of Transportation Engineers (ITE). Trip Generation is a reference
publication that contains travel characteristics of over 160 land uses across the nation and is based on
empirical data gathered from over 4,800 studies that were reported to the Institute by public agencies,
developers and consulting firms. Data contained in this publication is universally accepted for use in
studies by transportation engineers throughout the nation.
Adjustments
The actual "traffic impact" of a specific site for impact fee purposes is based on the amount of traffic
added to the street system. To accurately estimate new trips generated by a new development,
adjustments must be made to trip generation rates and equations to account for pass-by and diverted
trips. The added traffic is adjusted so that each development is assigned only for a portion of trips
associated with that particular development and thus reducing the possibility of over-counting by
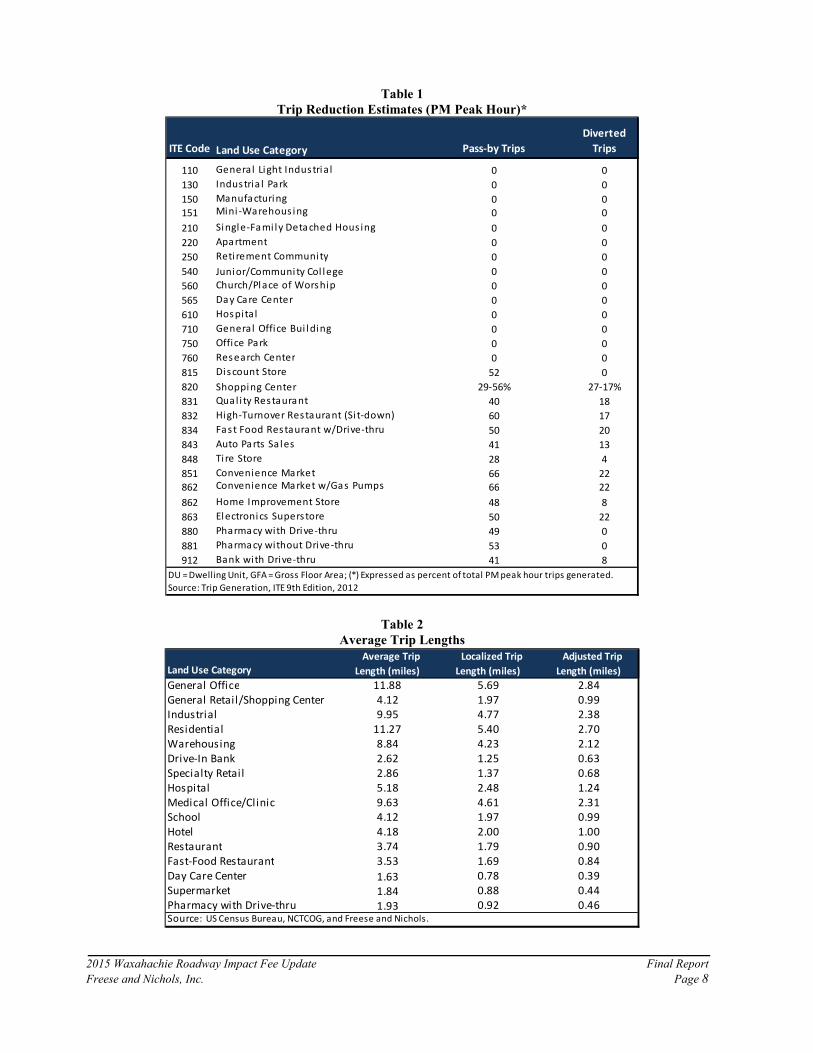
counting only primary trips generated. Trip generation rates were reduced by the percentages
presented in Table 1 in an effort to isolate the primary trip purpose.
2015 Waxahachie Roadway Impact Fee Update Final Report
Freese and Nichols, Inc. Page 7
Pass-by trips are those trips that are already on a particular route for a different purpose and simply
stop at a particular development on that route. For example, a stop at a convenience store on the way
home from the office is a pass-by trip for the convenience store. A pass-by trip does not create an
additional burden on the street system and therefore should not be counted in the assessment of impact
fees of a convenience store.
A diverted trip is a similar situation, except that a diversion is made from the regular route to make an
interim stop. For example, a trip from work to home using Brown Street would be a diverted trip if
the travel path were changed to Dallas Avenue for the purpose of stopping at a retail site. On a
system-wide basis, this trip places a slightly additional burden on the street system but in many cases,
this burden is minimal.
Table 1 contains the documented estimates of trip rate adjustments used in determining the appropriate
rate to use in the impact fee calculation process. These adjustments were based on studies conducted
by ITE.
The resulting recommended trip rates are illustrated as part of Table 3 Land Use/Vehicle Mile
Equivalency Table. Rates were developed in lieu of equations to simplify the assessment of impact
fees by the City and likewise, the estimation of impact fees by persons who may be required to pay an
impact fee in conjunction with a development project.
A local study may also be conducted to confirm rates in Trip Generation or to change rates reflecting
local conditions. In such cases, a minimum of three similar sites should be counted. Selected sites
should be isolated in nature with driveways that specifically serve the development and not any other
land uses. The results should be plotted on the scatter diagram of the selected land use contained in
Trip Generation for comparison purposes. It is recommended that no change be approved unless the
results show a variation of at least fifteen percent across the range of the sample size surveyed.
Trip Length
Trip lengths (in miles) are used in conjunction with site trip generation to estimate vehicle-miles of
travel. Trip length data was based on information generated in the 1995 North Central Texas Council
of Governments (NCTCOG) Workplace Survey. These travel characteristics were applied to
Waxahachie to determine average trips lengths for common land use types.
Table 2 summarizes the derived average trip lengths for major land use categories. These trip lengths
represent the average distance that a vehicle will travel between an origin and destination of which
either the origin or destination contains the land-use category identified below. Data compiled by the
Workplace Survey represents the best available information on trip lengths for this area.
2015 Waxahachie Roadway Impact Fee Update Final Report
Freese and Nichols, Inc. Page 8
Table 1
Trip Reduction Estimates (PM Peak Hour)*
ITE Code Land Use Category Pass-by Trips
Diverted
Trips
110 General Light Industria l 0 0
130 Industria l Park 0 0
150 Manufacturing 0 0
151 Mini -Warehous ing 0 0
210 Single-Fami ly Detached Hous ing 0 0
220 Apartment 0 0
250 Reti rement Community 0 0
540 Junior/Community Col lege 0 0
560 Church/Place of Worship 0 0
565 Day Care Center 0 0
610 Hospital 0 0
710 General Office Bui lding 0 0
750 Office Park 0 0
760 Research Center 0 0
815 Discount Store 52 0
820 Shopping Center 29-56% 27-17%
831 Qual i ty Restaurant 40 18
832 High-Turnover Restaurant (Si t-down) 60 17
834 Fast Food Restaurant w/Drive-thru 50 20
843 Auto Parts Sa les 41 13
848 Ti re Store 28 4
851 Convenience Market 66 22
862 Convenience Market w/Gas Pumps 66 22
862 Home Improvement Store 48 8
863 Electronics Superstore 50 22
880 Pharmacy with Drive-thru 49 0
881 Pharmacy without Drive-thru 53 0
912 Bank with Drive-thru 41 8
DU = Dwelling Unit, GFA = Gross Floor Area; (*) Expressed as percent of total PM peak hour trips generated.
Source: Trip Generation, ITE 9th Edition, 2012
Table 2
Average Trip Lengths
Land Use Category
General Office 11.88 5.69 2.84
General Retail/Shopping Center 4.12 1.97 0.99
Industrial 9.95 4.77 2.38
Residential 11.27 5.40 2.70
Warehousing 8.84 4.23 2.12
Drive-In Bank 2.62 1.25 0.63
Specialty Retail 2.86 1.37 0.68
Hospital 5.18 2.48 1.24
Medical Office/Clinic 9.63 4.61 2.31
School 4.12 1.97 0.99
Hotel 4.18 2.00 1.00
Restaurant 3.74 1.79 0.90
Fast-Food Restaurant 3.53 1.69 0.84
Day Care Center 1.63 0.78 0.39
Supermarket 1.84 0.88 0.44
Pharmacy with Drive-thru 1.93 0.92 0.46Source: US Census Bureau, NCTCOG, and Freese and Nichols.
Average Trip
Length (miles)
Localized Trip
Length (miles)
Adjusted Trip
Length (miles)
2015 Waxahachie Roadway Impact Fee Update Final Report
Freese and Nichols, Inc. Page 9
Adjustments
The assessment of an individual development's impact fee is based on the premise that each vehicle-
trip has an origin and a destination and that the development end should pay for one-half of the cost
necessary to complete each trip. Thus, the development is charged only for a portion of the vehicle-
trip associated with that development.
To prevent double charging, and to fairly attribute the demand placed on the system to each trip end
location, the trip length was adjusted to remove travel on the federal roadway system and then divided
by two to reflect half of the vehicle trip to and from the development. Data from the NCTCOG travel
forecast model was used to compare VMT by roadway functional class. The average trip length was
reduced by 48% to net out travel on the federal system. The average trip length, localized trip length,
and adjustment for one-half trip length is illustrated in Table 2. Where specific land uses were
considered to exhibit different trip length characteristics than those identified in Table 3, engineering
judgment was used to estimate the average trip length. Finally, as the service area structure was based
on a six-mile boundary, those land uses that exhibited trip lengths greater than six miles would be
capped to this threshold.
Service Unit Equivalency Table
The result of combining the trip generation and trip length information is an equivalency table that
establishes the service unit rate for various land uses. These service unit rates are based on an
appropriate development unit for each land use. For example, a dwelling unit is the basis for
residential uses, while 1,000 gross square feet of floor area is the basis for office, commercial, and
retail uses. Other less common land uses are based on appropriate independent variables.
Separate rates have been established for specific land uses within the broader categories of residential,
commercial, industrial and institutional to reflect the differences between land uses within the
categories. However, even with these specific land use types, information is not available for every
conceivable land use, so limitations do exist.
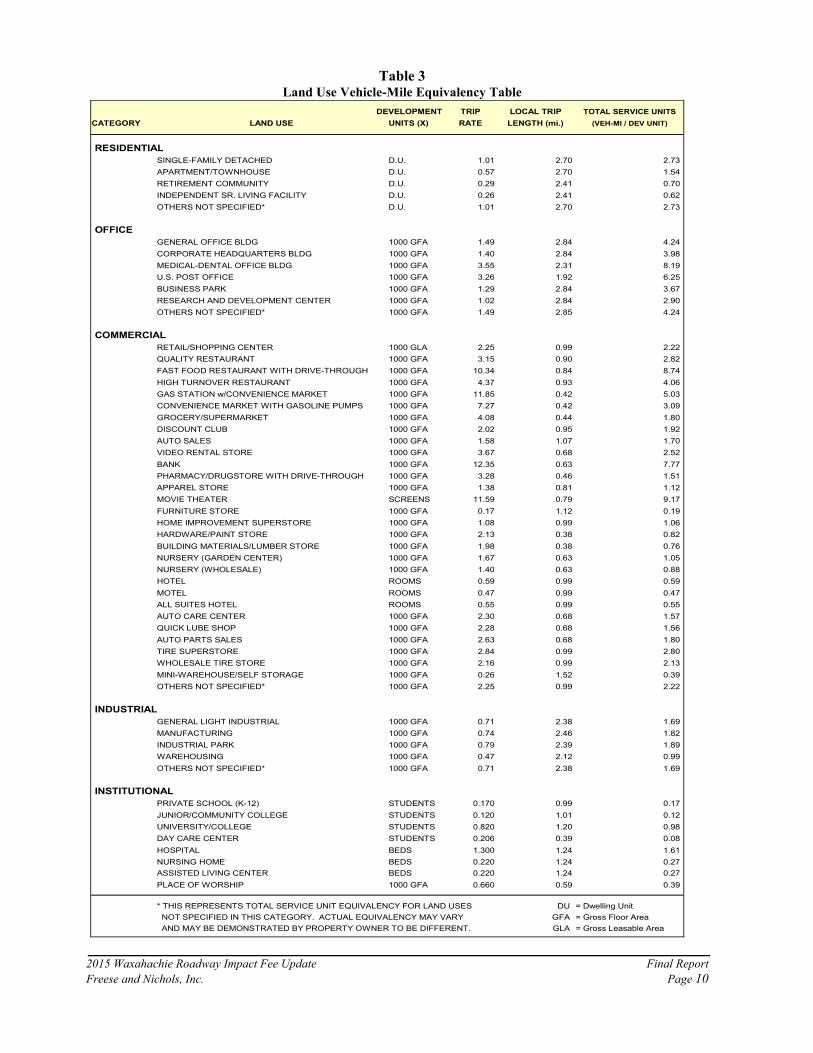
The updated equivalency table is illustrated in Table 3. Table 3 is reflective of adjusted trip rates
(detailed in Table 1) and trip lengths (Table 2).
2015 Waxahachie Roadway Impact Fee Update Final Report
Freese and Nichols, Inc. Page 10
Table 3 Land Use Vehicle-Mile Equivalency Table
DEVELOPMENT TRIP LOCAL TRIP TOTAL SERVICE UNITS
CATEGORY LAND USE UNITS (X) RATE LENGTH (mi.) (VEH-MI / DEV UNIT)
LOCALIZED
RESIDENTIAL
SINGLE-FAMILY DETACHED D.U. 1.01 2.70 2.73
APARTMENT/TOWNHOUSE D.U. 0.57 2.70 1.54
RETIREMENT COMMUNITY D.U. 0.29 2.41 0.70
INDEPENDENT SR. LIVING FACILITY D.U. 0.26 2.41 0.62
OTHERS NOT SPECIFIED* D.U. 1.01 2.70 2.73
OFFICE
GENERAL OFFICE BLDG 1000 GFA 1.49 2.84 4.24
CORPORATE HEADQUARTERS BLDG 1000 GFA 1.40 2.84 3.98
MEDICAL-DENTAL OFFICE BLDG 1000 GFA 3.55 2.31 8.19
U.S. POST OFFICE 1000 GFA 3.26 1.92 6.25
BUSINESS PARK 1000 GFA 1.29 2.84 3.67
RESEARCH AND DEVELOPMENT CENTER 1000 GFA 1.02 2.84 2.90
OTHERS NOT SPECIFIED* 1000 GFA 1.49 2.85 4.24
COMMERCIAL
66% RETAIL/SHOPPING CENTER 1000 GLA 2.25 0.99 2.22
58% QUALITY RESTAURANT 1000 GFA 3.15 0.90 2.82
59% FAST FOOD RESTAURANT WITH DRIVE-THROUGH 1000 GFA 10.34 0.84 8.74
60% HIGH TURNOVER RESTAURANT 1000 GFA 4.37 0.93 4.06
88% GAS STATION w/CONVENIENCE MARKET 1000 GFA 11.85 0.42 5.03
89% CONVENIENCE MARKET WITH GASOLINE PUMPS 1000 GFA 7.27 0.42 3.09
GROCERY/SUPERMARKET 1000 GFA 4.08 0.44 1.80
DISCOUNT CLUB 1000 GFA 2.02 0.95 1.92
AUTO SALES 1000 GFA 1.58 1.07 1.70
VIDEO RENTAL STORE 1000 GFA 3.67 0.68 2.52
73% BANK 1000 GFA 12.35 0.63 7.77
62% PHARMACY/DRUGSTORE WITH DRIVE-THROUGH 1000 GFA 3.28 0.46 1.51
APPAREL STORE 1000 GFA 1.38 0.81 1.12
MOVIE THEATER SCREENS 11.59 0.79 9.17
64% FURNITURE STORE 1000 GFA 0.17 1.12 0.19
56% HOME IMPROVEMENT SUPERSTORE 1000 GFA 1.08 0.99 1.06
HARDWARE/PAINT STORE 1000 GFA 2.13 0.38 0.82
BUILDING MATERIALS/LUMBER STORE 1000 GFA 1.98 0.38 0.76
NURSERY (GARDEN CENTER) 1000 GFA 1.67 0.63 1.05
NURSERY (WHOLESALE) 1000 GFA 1.40 0.63 0.88
HOTEL ROOMS 0.59 0.99 0.59
MOTEL ROOMS 0.47 0.99 0.47
ALL SUITES HOTEL ROOMS 0.55 0.99 0.55
AUTO CARE CENTER 1000 GFA 2.30 0.68 1.57
QUICK LUBE SHOP 1000 GFA 2.28 0.68 1.56
AUTO PARTS SALES 1000 GFA 2.63 0.68 1.80
32% TIRE SUPERSTORE 1000 GFA 2.84 0.99 2.80
WHOLESALE TIRE STORE 1000 GFA 2.16 0.99 2.13
MINI-WAREHOUSE/SELF STORAGE 1000 GFA 0.26 1.52 0.39
OTHERS NOT SPECIFIED* 1000 GFA 2.25 0.99 2.22
INDUSTRIAL
GENERAL LIGHT INDUSTRIAL 1000 GFA 0.71 2.38 1.69
MANUFACTURING 1000 GFA 0.74 2.46 1.82
INDUSTRIAL PARK 1000 GFA 0.79 2.39 1.89
WAREHOUSING 1000 GFA 0.47 2.12 0.99
OTHERS NOT SPECIFIED* 1000 GFA 0.71 2.38 1.69
INSTITUTIONAL
PRIVATE SCHOOL (K-12) STUDENTS 0.170 0.99 0.17
JUNIOR/COMMUNITY COLLEGE STUDENTS 0.120 1.01 0.12
UNIVERSITY/COLLEGE STUDENTS 0.820 1.20 0.98
DAY CARE CENTER STUDENTS 0.206 0.39 0.08
HOSPITAL BEDS 1.300 1.24 1.61
NURSING HOME BEDS 0.220 1.24 0.27
ASSISTED LIVING CENTER BEDS 0.220 1.24 0.27
PLACE OF WORSHIP 1000 GFA 0.660 0.59 0.39
* THIS REPRESENTS TOTAL SERVICE UNIT EQUIVALENCY FOR LAND USES DU = Dwelling Unit
NOT SPECIFIED IN THIS CATEGORY. ACTUAL EQUIVALENCY MAY VARY GFA = Gross Floor Area
AND MAY BE DEMONSTRATED BY PROPERTY OWNER TO BE DIFFERENT. GLA = Gross Leasable Area
2015 Waxahachie Roadway Impact Fee Update Final Report
Freese and Nichols, Inc. Page 11
4. Existing Conditions Analysis
Chapter 395 identifies specific requirements necessary in the capital improvements plan for impact
fees. The existing conditions, including defining the existing roadway system, and analysis of the total
capacity, the level of current usage, and commitments for usage of the existing roadway are required as
part of the capital improvements plan. This Section discusses the existing conditions.
Existing Conditions
An inventory of the collector and arterial roadway facilities was conducted to determine existing
conditions throughout Waxahachie. This analysis determines the capacity provided by the existing
roadway system, the demand currently placed on the system, and the potential existence of deficiencies
on the system.
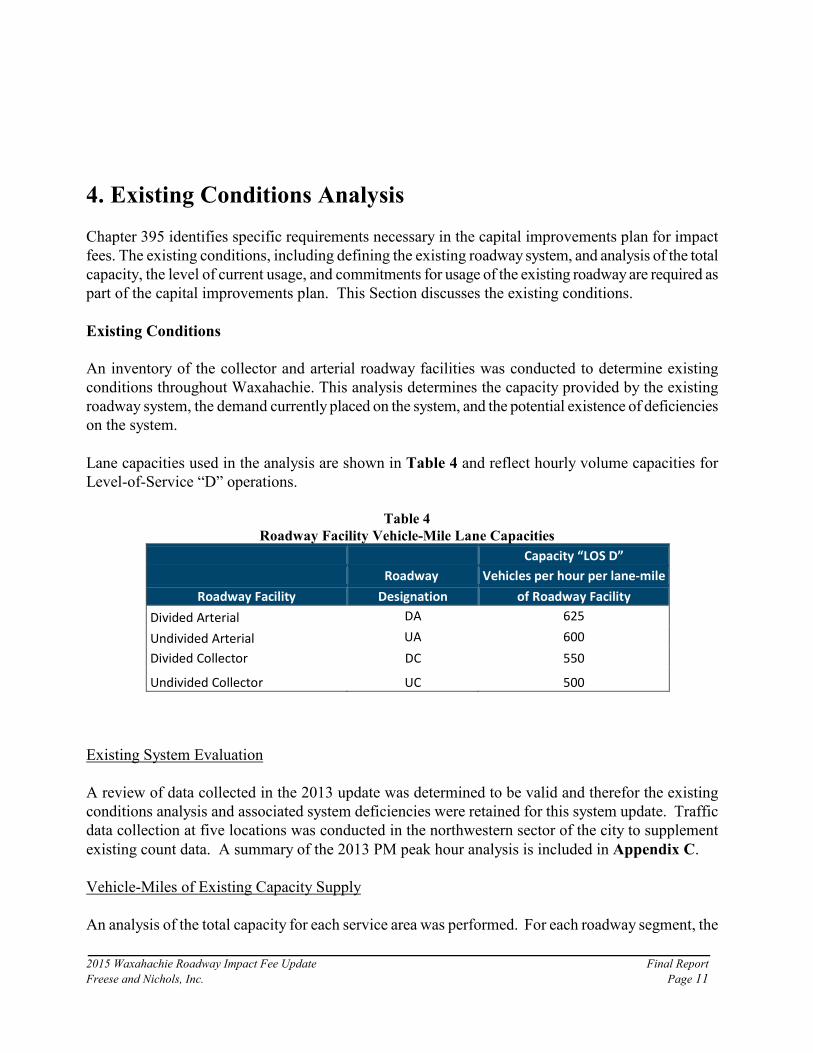
Lane capacities used in the analysis are shown in Table 4 and reflect hourly volume capacities for
Level-of-Service “D” operations.
Table 4
Roadway Facility Vehicle-Mile Lane Capacities
Capacity “LOS D”
Roadway Vehicles per hour per lane-mile
Roadway Facility Designation of Roadway Facility
Divided Arterial DA 625
Undivided Arterial UA 600
Divided Collector DC 550
Undivided Collector UC 500
Existing System Evaluation
A review of data collected in the 2013 update was determined to be valid and therefor the existing
conditions analysis and associated system deficiencies were retained for this system update. Traffic
data collection at five locations was conducted in the northwestern sector of the city to supplement
existing count data. A summary of the 2013 PM peak hour analysis is included in Appendix C.
Vehicle-Miles of Existing Capacity Supply
An analysis of the total capacity for each service area was performed. For each roadway segment, the
2015 Waxahachie Roadway Impact Fee Update Final Report
Freese and Nichols, Inc. Page 12
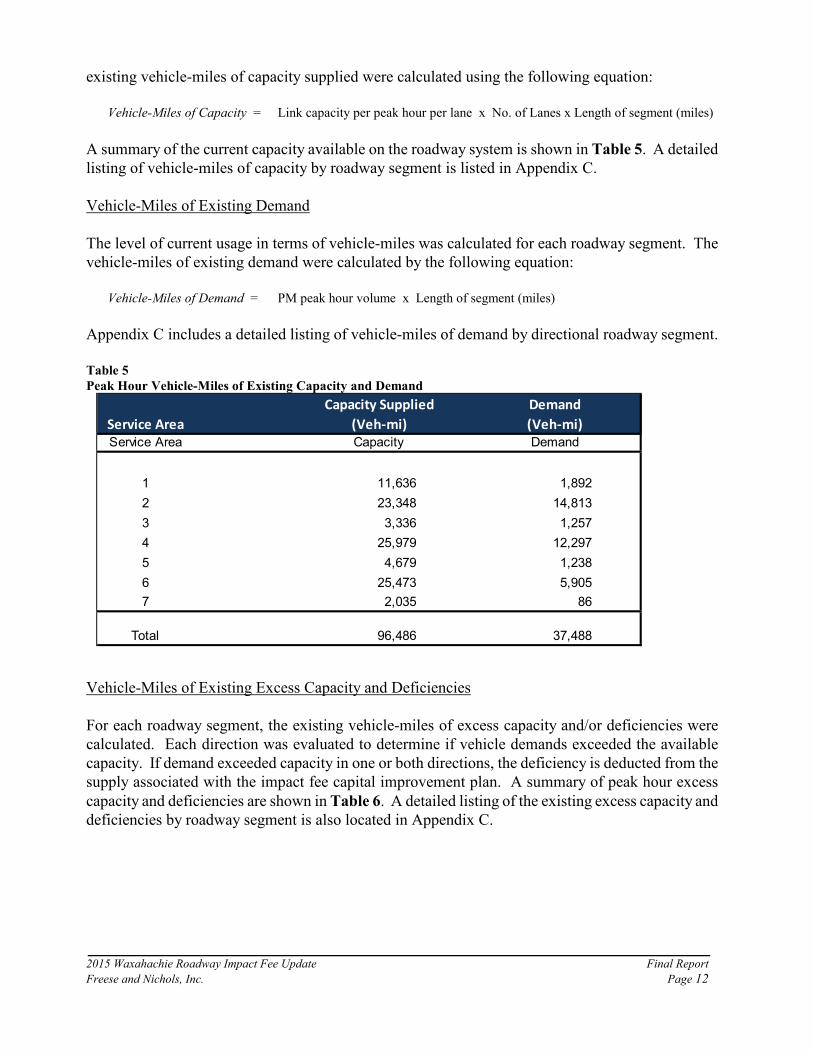
existing vehicle-miles of capacity supplied were calculated using the following equation:
Vehicle-Miles of Capacity = Link capacity per peak hour per lane x No. of Lanes x Length of segment (miles)
A summary of the current capacity available on the roadway system is shown in Table 5. A detailed
listing of vehicle-miles of capacity by roadway segment is listed in Appendix C.
Vehicle-Miles of Existing Demand
The level of current usage in terms of vehicle-miles was calculated for each roadway segment. The
vehicle-miles of existing demand were calculated by the following equation:
Vehicle-Miles of Demand = PM peak hour volume x Length of segment (miles)
Appendix C includes a detailed listing of vehicle-miles of demand by directional roadway segment.
Table 5
Peak Hour Vehicle-Miles of Existing Capacity and Demand
Capacity Supplied Demand
Service Area (Veh-mi) (Veh-mi)
Service Area Capacity Demand
1 11,636 1,892
2 23,348 14,813
3 3,336 1,257
4 25,979 12,297
5 4,679 1,238
6 25,473 5,905
7 2,035 86
Total 96,486 37,488
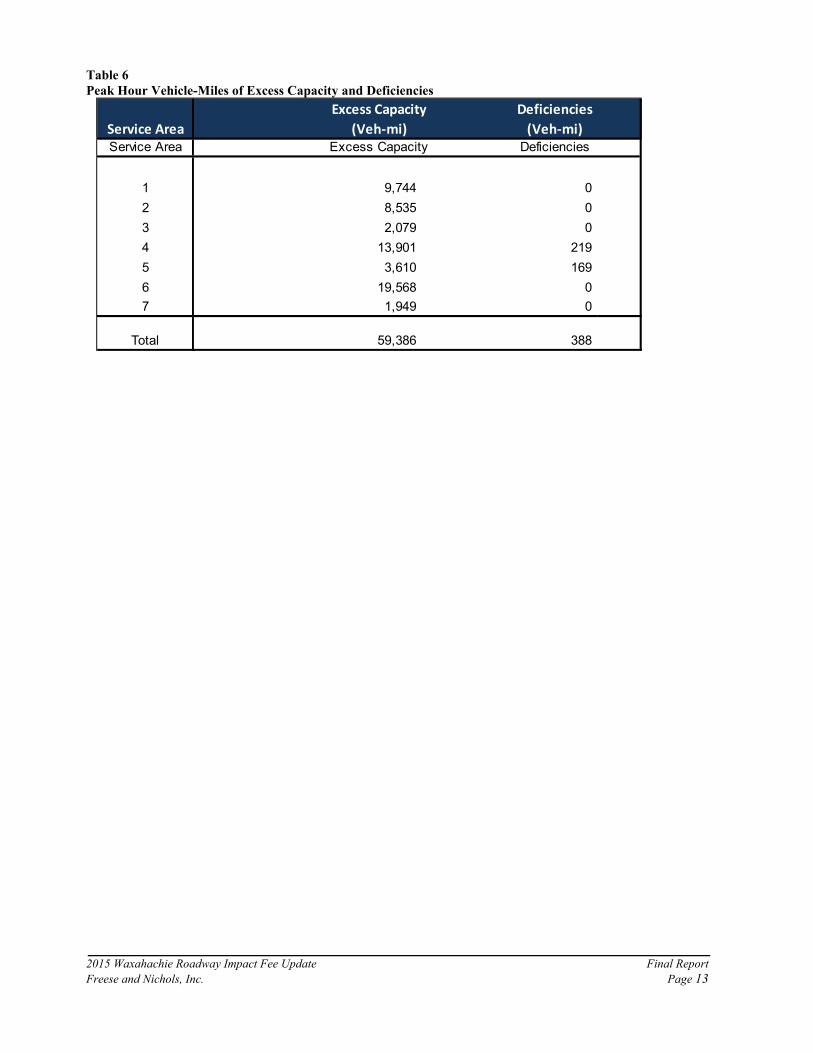
Vehicle-Miles of Existing Excess Capacity and Deficiencies
For each roadway segment, the existing vehicle-miles of excess capacity and/or deficiencies were
calculated. Each direction was evaluated to determine if vehicle demands exceeded the available
capacity. If demand exceeded capacity in one or both directions, the deficiency is deducted from the
supply associated with the impact fee capital improvement plan. A summary of peak hour excess
capacity and deficiencies are shown in Table 6. A detailed listing of the existing excess capacity and
deficiencies by roadway segment is also located in Appendix C.
2015 Waxahachie Roadway Impact Fee Update Final Report
Freese and Nichols, Inc. Page 13
Table 6
Peak Hour Vehicle-Miles of Excess Capacity and Deficiencies
Excess Capacity Deficiencies
Service Area (Veh-mi) (Veh-mi)
Service Area Excess Capacity Deficiencies
1 9,744 0
2 8,535 0
3 2,079 0
4 13,901 219
5 3,610 169
6 19,568 0
7 1,949 0
Total 59,386 388
2015 Waxahachie Roadway Impact Fee Update Final Report
Freese and Nichols, Inc. Page 14
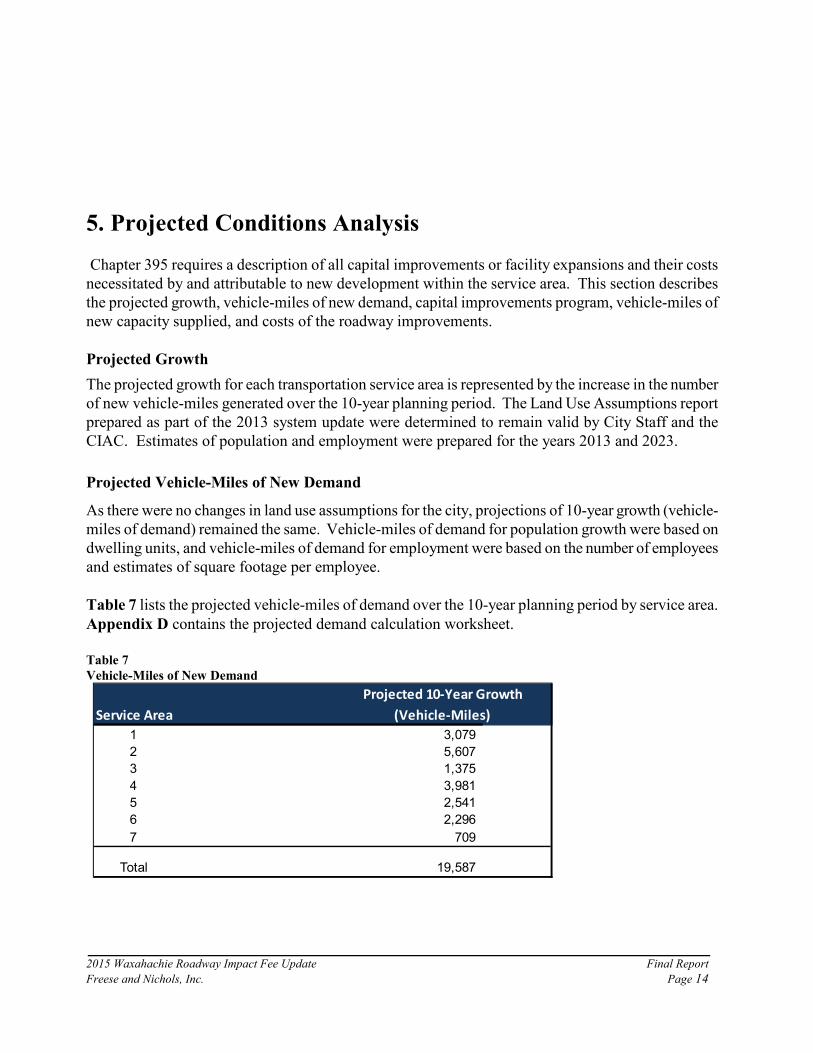
5. Projected Conditions Analysis
Chapter 395 requires a description of all capital improvements or facility expansions and their costs
necessitated by and attributable to new development within the service area. This section describes
the projected growth, vehicle-miles of new demand, capital improvements program, vehicle-miles of
new capacity supplied, and costs of the roadway improvements.
Projected Growth
The projected growth for each transportation service area is represented by the increase in the number
of new vehicle-miles generated over the 10-year planning period. The Land Use Assumptions report
prepared as part of the 2013 system update were determined to remain valid by City Staff and the
CIAC. Estimates of population and employment were prepared for the years 2013 and 2023.
Projected Vehicle-Miles of New Demand
As there were no changes in land use assumptions for the city, projections of 10-year growth (vehicle-
miles of demand) remained the same. Vehicle-miles of demand for population growth were based on
dwelling units, and vehicle-miles of demand for employment were based on the number of employees
and estimates of square footage per employee.
Table 7 lists the projected vehicle-miles of demand over the 10-year planning period by service area.
Appendix D contains the projected demand calculation worksheet.
Table 7
Vehicle-Miles of New Demand
Projected 10-Year Growth
Service Area (Vehicle-Miles)
1 3,079
2 5,607
3 1,375
4 3,981
5 2,541
6 2,296
7 709
Total 19,587
2015 Waxahachie Roadway Impact Fee Update Final Report
Freese and Nichols, Inc. Page 15
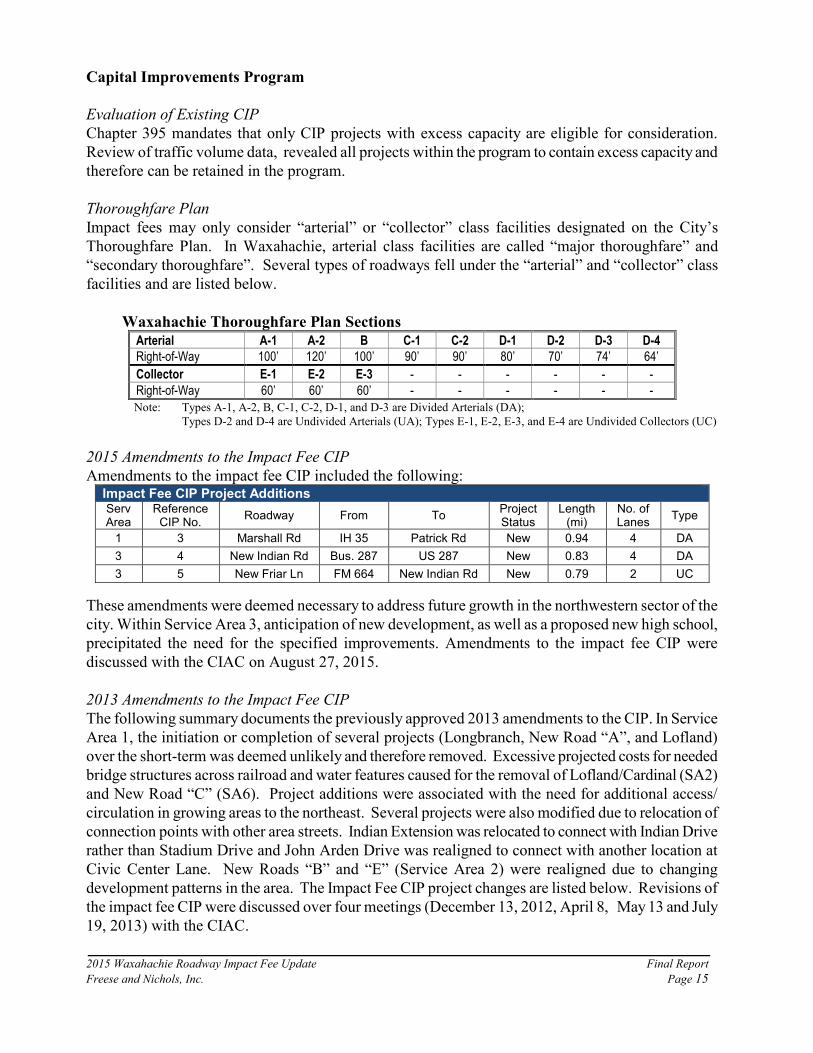
Capital Improvements Program
Evaluation of Existing CIP
Chapter 395 mandates that only CIP projects with excess capacity are eligible for consideration.
Review of traffic volume data, revealed all projects within the program to contain excess capacity and
therefore can be retained in the program.
Thoroughfare Plan
Impact fees may only consider “arterial” or “collector” class facilities designated on the City’s
Thoroughfare Plan. In Waxahachie, arterial class facilities are called “major thoroughfare” and
“secondary thoroughfare”. Several types of roadways fell under the “arterial” and “collector” class
facilities and are listed below.
Waxahachie Thoroughfare Plan Sections
Arterial A-1 A-2 B C-1 C-2 D-1 D-2 D-3 D-4
Right-of-Way 100’ 120’ 100’ 90’ 90’ 80’ 70’ 74’ 64’
Collector E-1 E-2 E-3 - - - - - -
Right-of-Way 60’ 60’ 60’ - - - - - -
Note: Types A-1, A-2, B, C-1, C-2, D-1, and D-3 are Divided Arterials (DA);
Types D-2 and D-4 are Undivided Arterials (UA); Types E-1, E-2, E-3, and E-4 are Undivided Collectors (UC)
2015 Amendments to the Impact Fee CIP
Amendments to the impact fee CIP included the following: Impact Fee CIP Project Additions Serv Area
Reference CIP No.
Roadway From To Project Status
Length (mi)
No. of Lanes
Type
1 3 Marshall Rd IH 35 Patrick Rd New 0.94 4 DA
3 4 New Indian Rd Bus. 287 US 287 New 0.83 4 DA
3 5 New Friar Ln FM 664 New Indian Rd New 0.79 2 UC
These amendments were deemed necessary to address future growth in the northwestern sector of the
city. Within Service Area 3, anticipation of new development, as well as a proposed new high school,
precipitated the need for the specified improvements. Amendments to the impact fee CIP were
discussed with the CIAC on August 27, 2015.
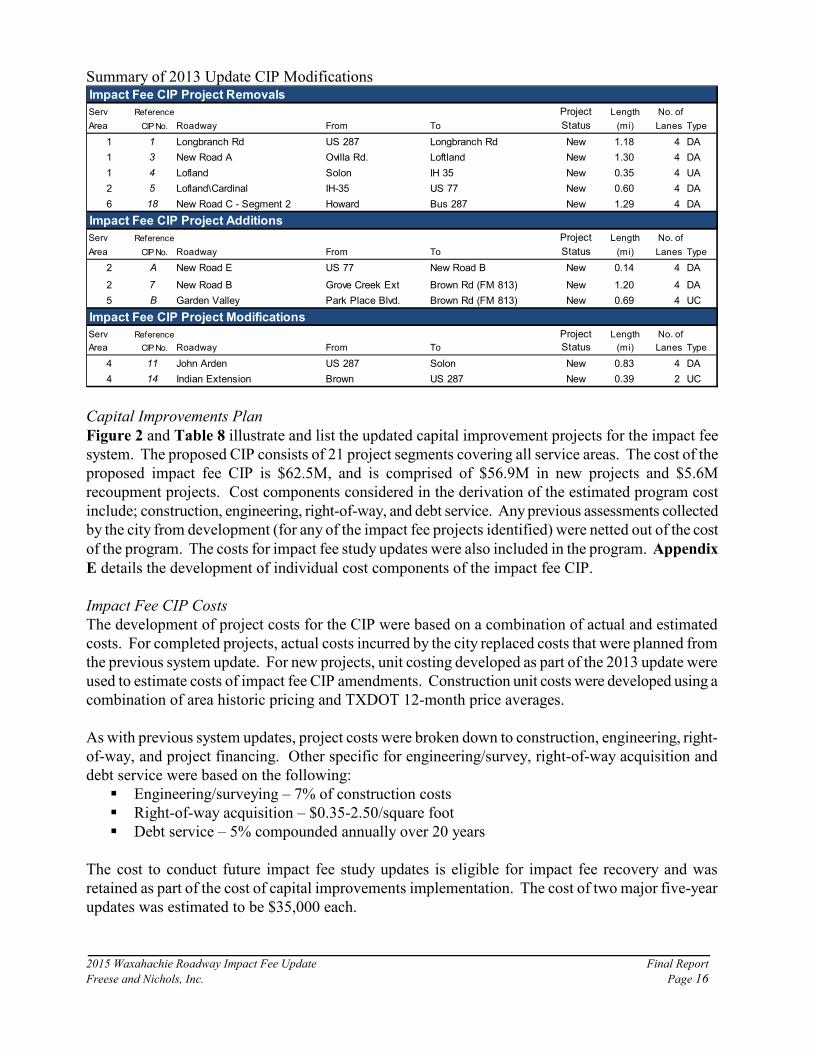
2013 Amendments to the Impact Fee CIP
The following summary documents the previously approved 2013 amendments to the CIP. In Service
Area 1, the initiation or completion of several projects (Longbranch, New Road “A”, and Lofland)
over the short-term was deemed unlikely and therefore removed. Excessive projected costs for needed
bridge structures across railroad and water features caused for the removal of Lofland/Cardinal (SA2)
and New Road “C” (SA6). Project additions were associated with the need for additional access/
circulation in growing areas to the northeast. Several projects were also modified due to relocation of
connection points with other area streets. Indian Extension was relocated to connect with Indian Drive
rather than Stadium Drive and John Arden Drive was realigned to connect with another location at
Civic Center Lane. New Roads “B” and “E” (Service Area 2) were realigned due to changing
development patterns in the area. The Impact Fee CIP project changes are listed below. Revisions of
the impact fee CIP were discussed over four meetings (December 13, 2012, April 8, May 13 and July
19, 2013) with the CIAC.
2015 Waxahachie Roadway Impact Fee Update Final Report
Freese and Nichols, Inc. Page 16
Summary of 2013 Update CIP Modifications Impact Fee CIP Project Removals
Serv Reference Project Length No. of
Area CIP No. Roadway From To Status (mi) Lanes Type
1 1 Longbranch Rd US 287 Longbranch Rd New 1.18 4 DA
1 3 New Road A Ovilla Rd. Loftland New 1.30 4 DA
1 4 Lofland Solon IH 35 New 0.35 4 UA
2 5 Lofland\Cardinal IH-35 US 77 New 0.60 4 DA
6 18 New Road C - Segment 2 Howard Bus 287 New 1.29 4 DA
Impact Fee CIP Project Additions
Serv Reference Project Length No. of
Area CIP No. Roadway From To Status (mi) Lanes Type
2 A New Road E US 77 New Road B New 0.14 4 DA
2 7 New Road B Grove Creek Ext Brown Rd (FM 813) New 1.20 4 DA
5 B Garden Valley Park Place Blvd. Brown Rd (FM 813) New 0.69 4 UC
Impact Fee CIP Project Modifications
Serv Reference Project Length No. of
Area CIP No. Roadway From To Status (mi) Lanes Type
4 11 John Arden US 287 Solon New 0.83 4 DA
4 14 Indian Extension Brown US 287 New 0.39 2 UC
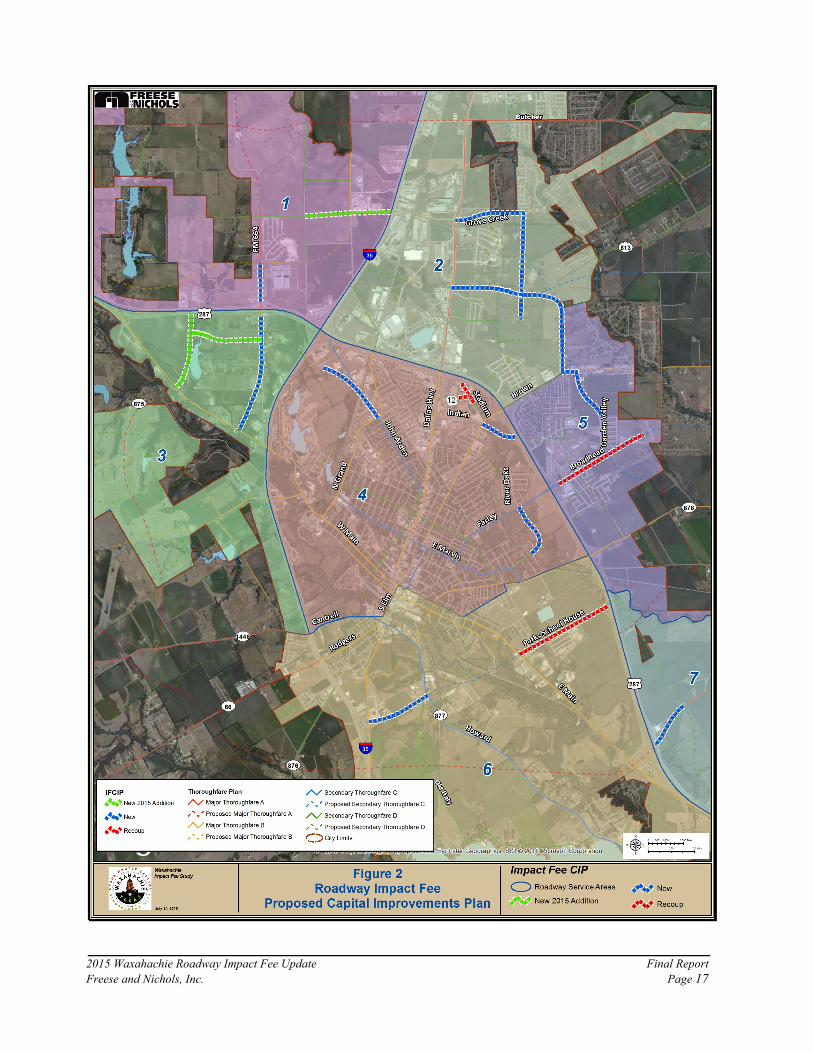
Capital Improvements Plan
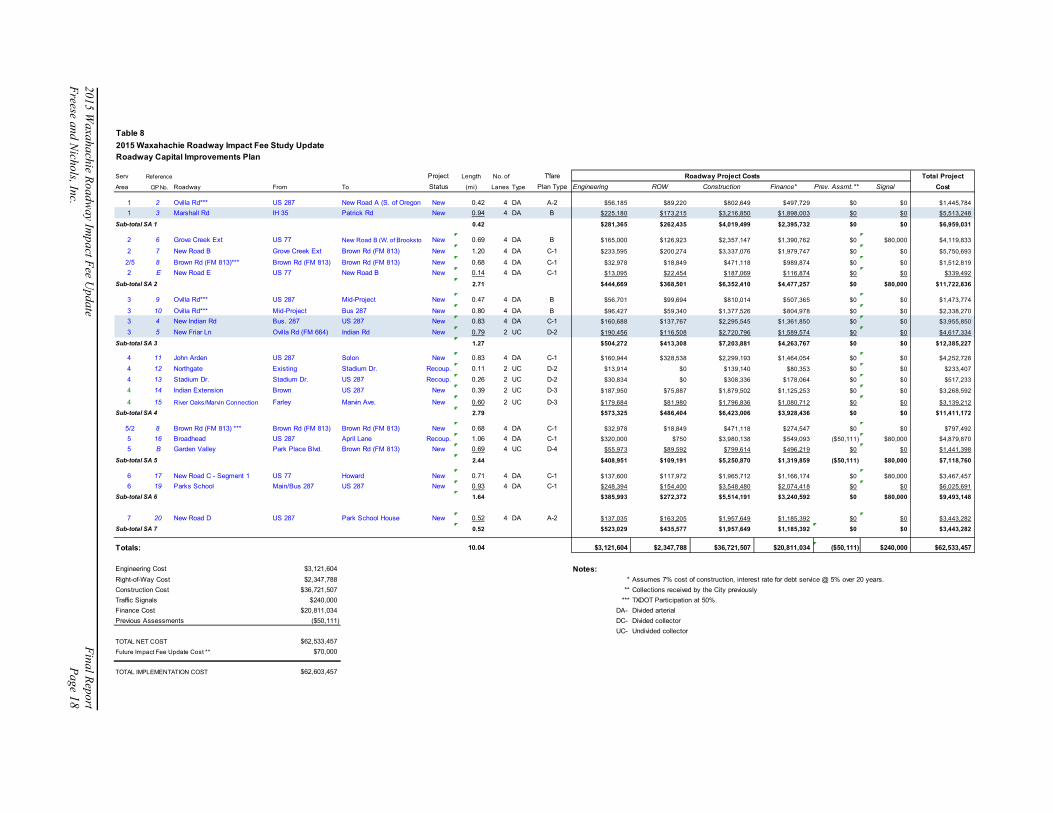
Figure 2 and Table 8 illustrate and list the updated capital improvement projects for the impact fee
system. The proposed CIP consists of 21 project segments covering all service areas. The cost of the
proposed impact fee CIP is $62.5M, and is comprised of $56.9M in new projects and $5.6M
recoupment projects. Cost components considered in the derivation of the estimated program cost
include; construction, engineering, right-of-way, and debt service. Any previous assessments collected
by the city from development (for any of the impact fee projects identified) were netted out of the cost
of the program. The costs for impact fee study updates were also included in the program. Appendix
E details the development of individual cost components of the impact fee CIP.
Impact Fee CIP Costs
The development of project costs for the CIP were based on a combination of actual and estimated
costs. For completed projects, actual costs incurred by the city replaced costs that were planned from
the previous system update. For new projects, unit costing developed as part of the 2013 update were
used to estimate costs of impact fee CIP amendments. Construction unit costs were developed using a
combination of area historic pricing and TXDOT 12-month price averages.
As with previous system updates, project costs were broken down to construction, engineering, right-
of-way, and project financing. Other specific for engineering/survey, right-of-way acquisition and
debt service were based on the following:
� Engineering/surveying – 7% of construction costs
� Right-of-way acquisition – $0.35-2.50/square foot
� Debt service – 5% compounded annually over 20 years
The cost to conduct future impact fee study updates is eligible for impact fee recovery and was
retained as part of the cost of capital improvements implementation. The cost of two major five-year
updates was estimated to be $35,000 each.
2015 Waxahachie Roadway Impact Fee Update Final Report
Freese and Nichols, Inc. Page 17
20
15
Wa
xah
ach
ie Ro
ad
wa
y Imp
act F
ee Up
da
te F
ina
l Rep
ort
Freese a
nd
Nich
ols, In
c. P
ag
e 18
Table 8
2015 Waxahachie Roadway Impact Fee Study Update
Roadway Capital Improvements Plan
Serv Reference Project Length No. of T'fare Roadway Project Costs Total Project
Area CIP No. Roadway From To Status (mi) Lanes Type Plan Type Engineering ROW Construction Finance* Prev. Assmt.** Signal Cost
1 2 Ovilla Rd*** US 287 New Road A (S. of Oregon ) New 0.42 4 DA A-2 $56,185 $89,220 $802,649 $497,729 $0 $0 $1,445,784
1 3 Marshall Rd IH 35 Patrick Rd New 0.94 4 DA B $225,180 $173,215 $3,216,850 $1,898,003 $0 $0 $5,513,248
Sub-total SA 1 0.42 $281,365 $262,435 $4,019,499 $2,395,732 $0 $0 $6,959,031
2 6 Grove Creek Ext US 77 New Road B (W. of Brookstone) New 0.69 4 DA B $165,000 $126,923 $2,357,147 $1,390,762 $0 $80,000 $4,119,833
2 7 New Road B Grove Creek Ext Brown Rd (FM 813) New 1.20 4 DA C-1 $233,595 $200,274 $3,337,076 $1,979,747 $0 $0 $5,750,693
2/5 8 Brown Rd (FM 813)*** Brown Rd (FM 813) Brown Rd (FM 813) New 0.68 4 DA C-1 $32,978 $18,849 $471,118 $989,874 $0 $0 $1,512,819
2 E New Road E US 77 New Road B New 0.14 4 DA C-1 $13,095 $22,454 $187,069 $116,874 $0 $0 $339,492
Sub-total SA 2 2.71 $444,669 $368,501 $6,352,410 $4,477,257 $0 $80,000 $11,722,836
3 9 Ovilla Rd*** US 287 Mid-Project New 0.47 4 DA B $56,701 $99,694 $810,014 $507,365 $0 $0 $1,473,774
3 10 Ovilla Rd*** Mid-Project Bus 287 New 0.80 4 DA B $96,427 $59,340 $1,377,526 $804,978 $0 $0 $2,338,270
3 4 New Indian Rd Bus. 287 US 287 New 0.83 4 DA C-1 $160,688 $137,767 $2,295,545 $1,361,850 $0 $0 $3,955,850
3 5 New Friar Ln Ovilla Rd (FM 664) Indian Rd New 0.79 2 UC D-2 $190,456 $116,508 $2,720,796 $1,589,574 $0 $0 $4,617,334
Sub-total SA 3 1.27 $504,272 $413,308 $7,203,881 $4,263,767 $0 $0 $12,385,227
4 11 John Arden US 287 Solon New 0.83 4 DA C-1 $160,944 $328,538 $2,299,193 $1,464,054 $0 $0 $4,252,728
4 12 Northgate Existing Stadium Dr. Recoup. 0.11 2 UC D-2 $13,914 $0 $139,140 $80,353 $0 $0 $233,407
4 13 Stadium Dr. Stadium Dr. US 287 Recoup. 0.26 2 UC D-2 $30,834 $0 $308,336 $178,064 $0 $0 $517,233
4 14 Indian Extension Brown US 287 New 0.39 2 UC D-3 $187,950 $75,887 $1,879,502 $1,125,253 $0 $0 $3,268,592
4 15 River Oaks/Marvin Connection Farley Marvin Ave. New 0.60 2 UC D-3 $179,684 $81,980 $1,796,836 $1,080,712 $0 $0 $3,139,212
Sub-total SA 4 2.79 $573,325 $486,404 $6,423,006 $3,928,436 $0 $0 $11,411,172
5/2 8 Brown Rd (FM 813) *** Brown Rd (FM 813) Brown Rd (FM 813) New 0.68 4 DA C-1 $32,978 $18,849 $471,118 $274,547 $0 $0 $797,492
5 16 Broadhead US 287 April Lane Recoup. 1.06 4 DA C-1 $320,000 $750 $3,980,138 $549,093 ($50,111) $80,000 $4,879,870
5 B Garden Valley Park Place Blvd. Brown Rd (FM 813) New 0.69 4 UC D-4 $55,973 $89,592 $799,614 $496,219 $0 $0 $1,441,398
Sub-total SA 5 2.44 $408,951 $109,191 $5,250,870 $1,319,859 ($50,111) $80,000 $7,118,760
6 17 New Road C - Segment 1 US 77 Howard New 0.71 4 DA C-1 $137,600 $117,972 $1,965,712 $1,166,174 $0 $80,000 $3,467,457
6 19 Parks School Main/Bus 287 US 287 New 0.93 4 DA C-1 $248,394 $154,400 $3,548,480 $2,074,418 $0 $0 $6,025,691
Sub-total SA 6 1.64 $385,993 $272,372 $5,514,191 $3,240,592 $0 $80,000 $9,493,148
7 20 New Road D US 287 Park School House New 0.52 4 DA A-2 $137,035 $163,205 $1,957,649 $1,185,392 $0 $0 $3,443,282
Sub-total SA 7 0.52 $523,029 $435,577 $1,957,649 $1,185,392 $0 $0 $3,443,282
Totals: 10.04 $3,121,604 $2,347,788 $36,721,507 $20,811,034 ($50,111) $240,000 $62,533,457
Engineering Cost $3,121,604 Notes:
Right-of-Way Cost $2,347,788 * Assumes 7% cost of construction, interest rate for debt service @ 5% over 20 years.
Construction Cost $36,721,507 ** Collections received by the City previously
Traffic Signals $240,000 *** TXDOT Participation at 50%.
Finance Cost $20,811,034 DA- Divided arterial DC- Divided collector N - New Project
Previous Assessments ($50,111) DC- Divided collector R - Recoupment project
UC- Undivided collector
TOTAL NET COST $62,533,457
Future Impact Fee Update Cost ** $70,000
TOTAL IMPLEMENTATION COST $62,603,457
2015 Waxahachie Roadway Impact Fee Update Final Report
Freese and Nichols, Inc. Page 19
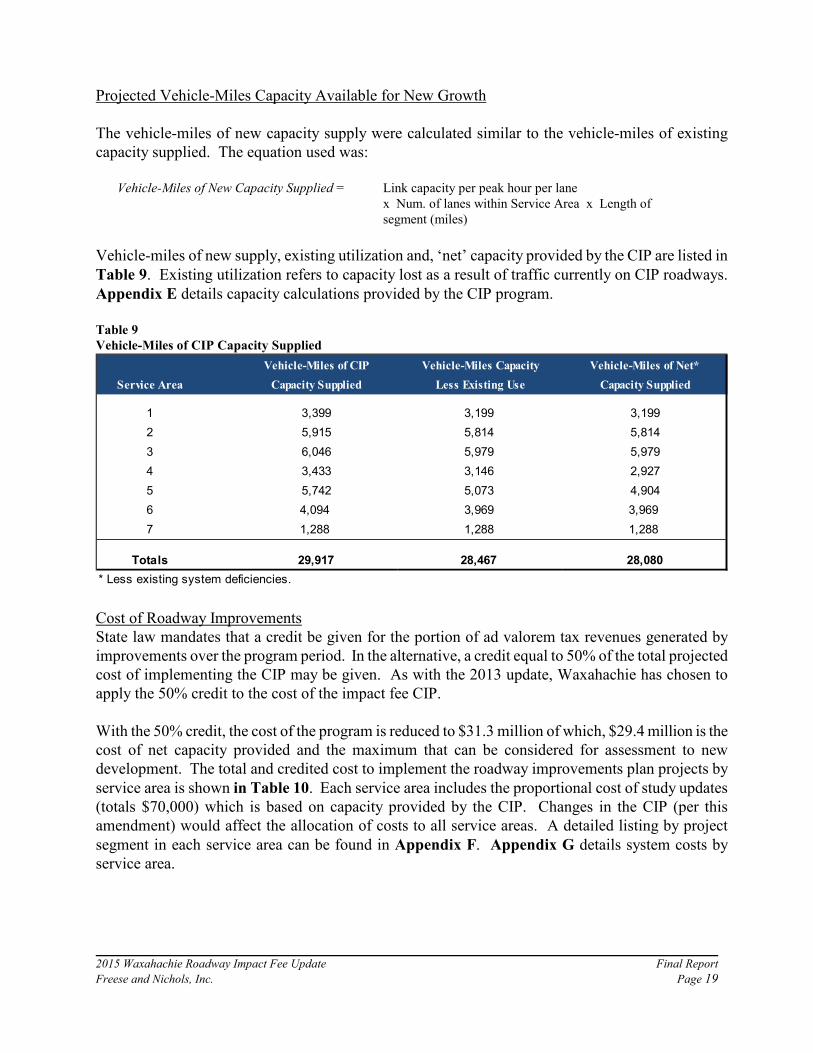
Projected Vehicle-Miles Capacity Available for New Growth
The vehicle-miles of new capacity supply were calculated similar to the vehicle-miles of existing
capacity supplied. The equation used was:
Vehicle-Miles of New Capacity Supplied = Link capacity per peak hour per lane
x Num. of lanes within Service Area x Length of
segment (miles)
Vehicle-miles of new supply, existing utilization and, ‘net’ capacity provided by the CIP are listed in
Table 9. Existing utilization refers to capacity lost as a result of traffic currently on CIP roadways.
Appendix E details capacity calculations provided by the CIP program.
Table 9
Vehicle-Miles of CIP Capacity Supplied
Vehicle-Miles of CIP Vehicle-Miles Capacity Vehicle-Miles of Net*
Service Area Capacity Supplied Less Existing Use Capacity Supplied
1 3,399 3,199 3,199
2 5,915 5,814 5,814
3 6,046 5,979 5,979
4 3,433 3,146 2,927
5 5,742 5,073 4,904
6 4,094 3,969 3,969
7 1,288 1,288 1,288
Totals 29,917 28,467 28,080
* Less existing system deficiencies.
Cost of Roadway Improvements
State law mandates that a credit be given for the portion of ad valorem tax revenues generated by
improvements over the program period. In the alternative, a credit equal to 50% of the total projected
cost of implementing the CIP may be given. As with the 2013 update, Waxahachie has chosen to
apply the 50% credit to the cost of the impact fee CIP.
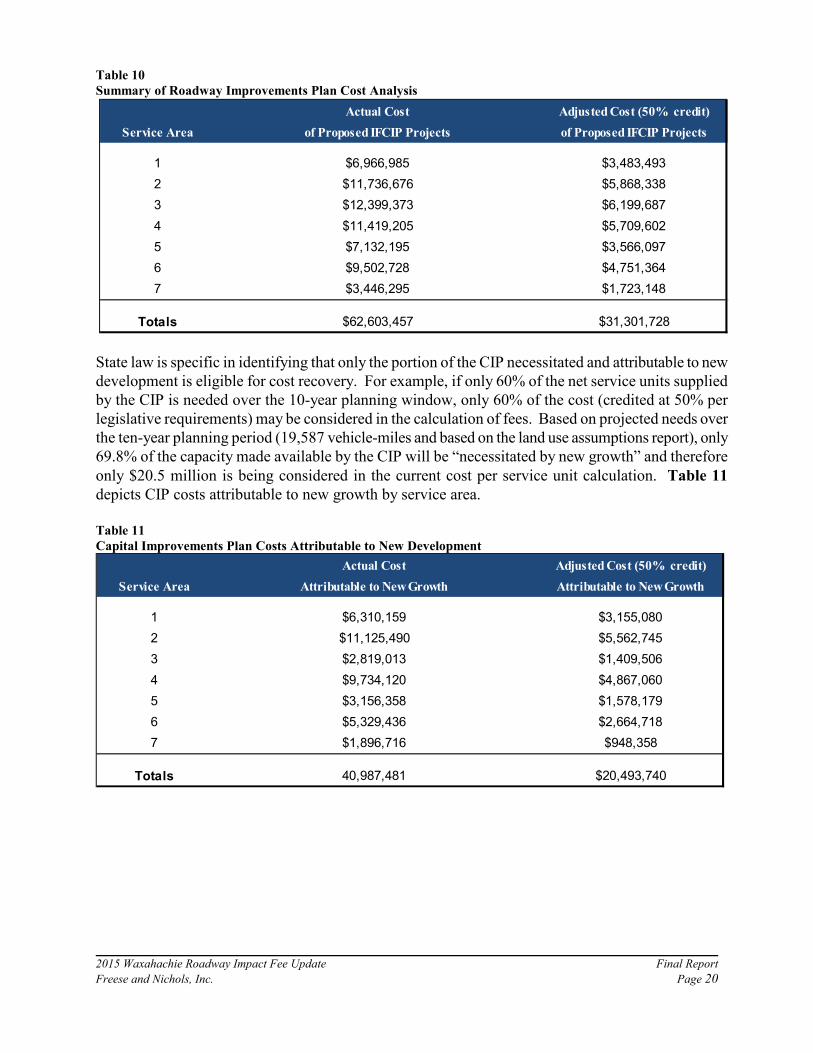
With the 50% credit, the cost of the program is reduced to $31.3 million of which, $29.4 million is the
cost of net capacity provided and the maximum that can be considered for assessment to new
development. The total and credited cost to implement the roadway improvements plan projects by
service area is shown in Table 10. Each service area includes the proportional cost of study updates
(totals $70,000) which is based on capacity provided by the CIP. Changes in the CIP (per this
amendment) would affect the allocation of costs to all service areas. A detailed listing by project
segment in each service area can be found in Appendix F. Appendix G details system costs by
service area.
2015 Waxahachie Roadway Impact Fee Update Final Report
Freese and Nichols, Inc. Page 20
Table 10
Summary of Roadway Improvements Plan Cost Analysis
Actual Cost Adjusted Cost (50% credit)
Service Area of Proposed IFCIP Projects of Proposed IFCIP Projects
1 $6,966,985 $3,483,493
2 $11,736,676 $5,868,338
3 $12,399,373 $6,199,687
4 $11,419,205 $5,709,602
5 $7,132,195 $3,566,097
6 $9,502,728 $4,751,364
7 $3,446,295 $1,723,148
Totals $62,603,457 $31,301,728
State law is specific in identifying that only the portion of the CIP necessitated and attributable to new
development is eligible for cost recovery. For example, if only 60% of the net service units supplied
by the CIP is needed over the 10-year planning window, only 60% of the cost (credited at 50% per
legislative requirements) may be considered in the calculation of fees. Based on projected needs over
the ten-year planning period (19,587 vehicle-miles and based on the land use assumptions report), only
69.8% of the capacity made available by the CIP will be “necessitated by new growth” and therefore
only $20.5 million is being considered in the current cost per service unit calculation. Table 11
depicts CIP costs attributable to new growth by service area.
Table 11
Capital Improvements Plan Costs Attributable to New Development
Actual Cost Adjusted Cost (50% credit)
Service Area Attributable to New Growth Attributable to New Growth
1 $6,310,159 $3,155,080
2 $11,125,490 $5,562,745
3 $2,819,013 $1,409,506
4 $9,734,120 $4,867,060
5 $3,156,358 $1,578,179
6 $5,329,436 $2,664,718
7 $1,896,716 $948,358
Totals 40,987,481 $20,493,740
2015 Waxahachie Roadway Impact Fee Update Final Report
Freese and Nichols, Inc. Page 21
6. Calculation of Impact Fees
This Section discusses the calculation of the cost per service unit and the calculation of roadway
impact fees. The transportation impact fee will vary by the particular land use, service area, and size
of the development. Examples are included to better illustrate the method by which the transportation
impact fees are calculated.
Cost Per Service Unit
The cost per service unit is calculated by dividing the cost of the CIP necessitated and attributable to
new demand (net cost as developed in Table 11) by the projected service units of growth over the 10-
year planning period (Table 7 in Section 5).
Generally, the cost per service unit varies by service area because of the net capacity being provided by
the proposed projects, variations in cost of CIP, and the number of service units necessitated by new
growth in each impact fee service area.
Table 12 lists the results of the cost per service unit calculation by service area. The actual cost per
service unit reflects the true burden to the City for the implementation of the roadway capital
improvements program. As per state law, a credit for the portion of ad-valorem tax revenues
generated by improvements over the program period, or a credit equal to 50% of the total projected
cost of implementing the capital improvements plan must be given. Based on this analysis, the
maximum collection rate reflects the maximum amount per service unit that can be charged to be in
compliance with the state statute. Appendix G details the maximum fee per service unit calculation
for each service area.
2015 Waxahachie Roadway Impact Fee Update Final Report
Freese and Nichols, Inc. Page 22
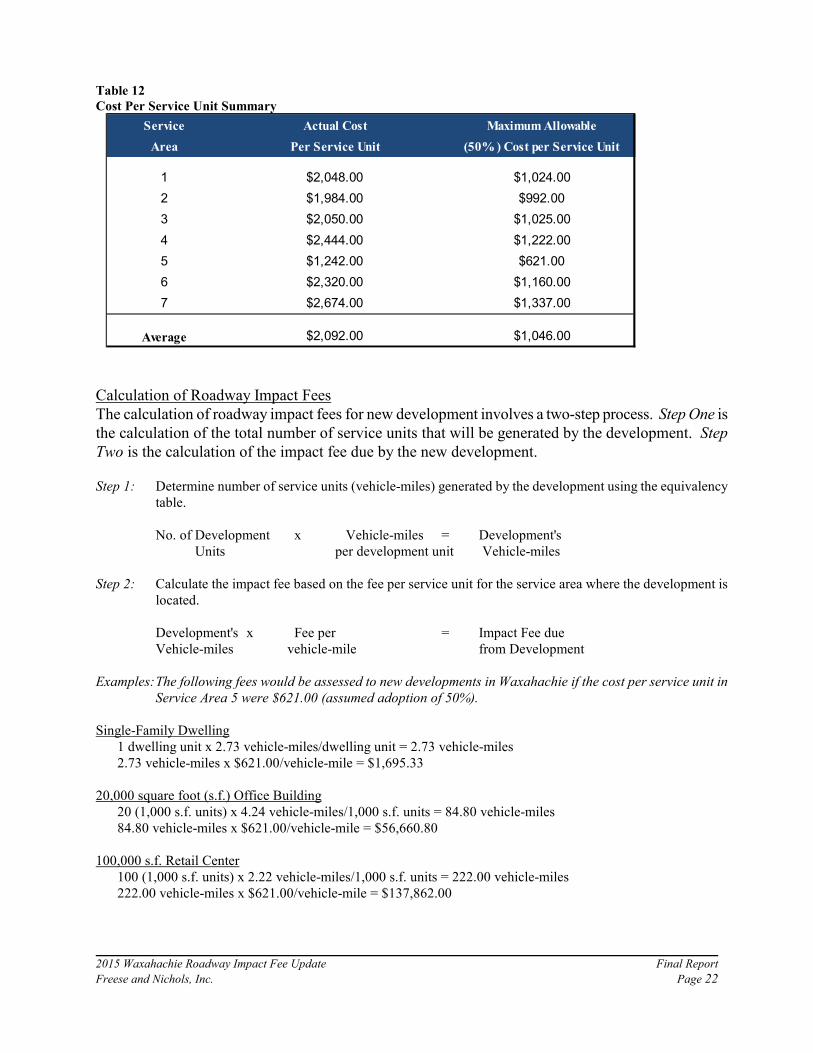
Table 12
Cost Per Service Unit Summary
Service Actual Cost Maximum Allowable
Area Per Service Unit (50% ) Cost per Service Unit
1 $2,048.00 $1,024.00
2 $1,984.00 $992.00
3 $2,050.00 $1,025.00
4 $2,444.00 $1,222.00
5 $1,242.00 $621.00
6 $2,320.00 $1,160.00
7 $2,674.00 $1,337.00
Average $2,092.00 $1,046.00
Calculation of Roadway Impact Fees
The calculation of roadway impact fees for new development involves a two-step process. Step One is
the calculation of the total number of service units that will be generated by the development. Step
Two is the calculation of the impact fee due by the new development. Step 1: Determine number of service units (vehicle-miles) generated by the development using the equivalency
table.
No. of Development x Vehicle-miles = Development's
Units per development unit Vehicle-miles
Step 2: Calculate the impact fee based on the fee per service unit for the service area where the development is
located.
Development's x Fee per = Impact Fee due
Vehicle-miles vehicle-mile from Development
Examples: The following fees would be assessed to new developments in Waxahachie if the cost per service unit in
Service Area 5 were $621.00 (assumed adoption of 50%).
Single-Family Dwelling
1 dwelling unit x 2.73 vehicle-miles/dwelling unit = 2.73 vehicle-miles
2.73 vehicle-miles x $621.00/vehicle-mile = $1,695.33
20,000 square foot (s.f.) Office Building
20 (1,000 s.f. units) x 4.24 vehicle-miles/1,000 s.f. units = 84.80 vehicle-miles
84.80 vehicle-miles x $621.00/vehicle-mile = $56,660.80
100,000 s.f. Retail Center
100 (1,000 s.f. units) x 2.22 vehicle-miles/1,000 s.f. units = 222.00 vehicle-miles
222.00 vehicle-miles x $621.00/vehicle-mile = $137,862.00
2015 Waxahachie Roadway Impact Fee Update Final Report
Freese and Nichols, Inc. Page 23
7. Conclusions
Chapter 395 authorizes the assessment and collection of impact fees in Texas for transportation related
capital improvements that must be met in order to assess and collect impact fees. This study was
conducted to fulfill amend the impact fee CIP with specific project additions. These additions were
determined to be needed based on changes in growth and anticipated access/circulation needs in
Service Areas 1 and 3.
Amendments to the impact fee CIP included the following:
• Service Area 1: Marshall Rd Ext. (IH35 to Patrick); Type B, 6-lane divided, 100’ ROW
• Service Area 3: New Indian Rd. (Bus 287 to US287); Type C-1, 4-lane divided, 80’ ROW
• Service Area 3: New Friar Ln. (FM 664 to New Indian); Type D-2, 3-lane undivided, 80’ ROW
Updated costs were prepared for the impact fee CIP amendments and included in the CIP program.
No changes were made to the service area structure as part of this system update. Seven service areas
were created for Waxahachie as part of the initial impact fee program. This service area structure was
configured so that no point is greater than the six-mile maximum set forth by law. The six-mile limit
ensures that roadway improvements are in close proximity to the development paying the fees that it
serves.
The land use equivalency table was deemed to be adequate for this update and hence, no changes were
made to the land use equivalency table.
An analysis of existing conditions revealed that the current roadway system provides over 96,486
vehicle-miles of capacity. The existing demand placed on the system was determined to be 37,488
vehicle-miles. Evaluation of the existing roadway system found 388 vehicle-miles of deficiencies on
the existing roadway network.
The Land Use Assumptions prepared as part of the 2013 update were deemed to be adequate for this
system update. With no changes to land use assumptions or the land use equivalency table, the
resultant projected 10-year growth, in terms of vehicle-miles, remained at 19,587.
The amended roadway impact fee capital improvements plan consists of twenty-one project segments,
totaling $62.6 million. The credited (50%) cost attributable to new growth is $20.5 million and
represents 70% of the net capacity made available for development by impact fee roadway projects.
The recommended CIP program provides 28,080 vehicle-miles of net new capacity.
Based on the revised impact fee CIP and associated program costs, the actual cost per service unit was
2015 Waxahachie Roadway Impact Fee Update Final Report
Freese and Nichols, Inc. Page 24
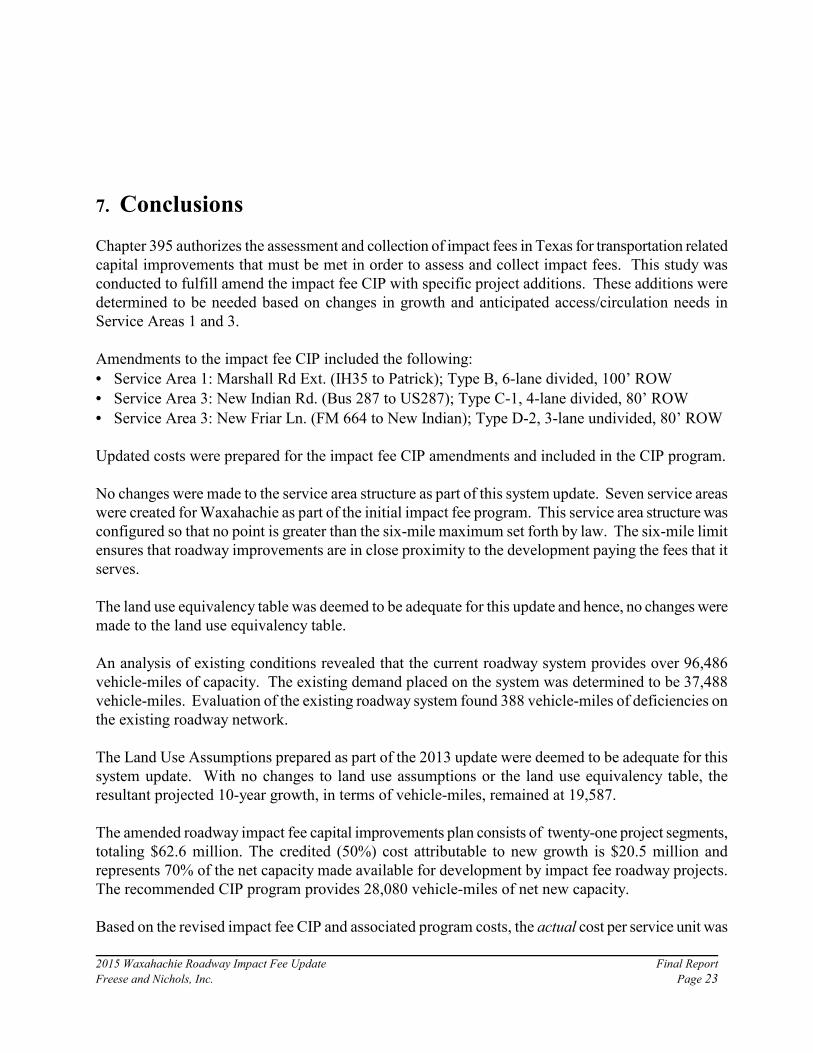
calculated to be between $1,242.00 and $2,674.00. The credited (50%) cost per service unit was
calculated to be between $621.00 and $1,337.00. Based on the updated CIP, the cost per service unit
for Service Areas 1 and 3 increased from $188 to $1024 and from $599 to $1025, respectively. A
summary of changes for the cost per service unit for all service areas is listed below.
2013 2015
Service Cost per Service Unit Cost per Service Unit
Area w/ 50% Credit w/ 50% Credit
1 $188.00 $1,024.00
2 $921.00 $992.00
3 $599.00 $1,025.00
4 $1,265.00 $1,222.00
5 $621.00 $621.00
6 $1,160.00 $1,160.00
7 $1,338.00 $1,337.00
Average $962.00 $1,046.00
The determination of fees due from new development is based upon the size of development, its
associated service unit generation (equivalency table) and the cost per service unit derived or adopted
for each service area.
2015 Waxahachie Roadway Impact Fee Update Final Report
Freese and Nichols, Inc. Page 25
APPENDICES
A. Roadway Impact Fee Definitions
ROADWAY IMPACT FEE DEFINITIONS
Average Trip Length - the average actual travel distance between two points. The average trip length
by specific land use varies.
Diverted Trip - similar to pass-by trip, but a diversion is made from the regular route to make an
interim stop.
Impact Fee - a charge or assessment imposed by a city against new development to generate revenue
for funding or recouping roadway improvements necessitated and attributable to new development.
Maximum Fee Per Service Unit - the highest impact fee that may be collected by the City per
vehicle-mile of supply. Calculated by dividing the costs of the capital improvements by the total
number of vehicle-miles of demand expected in the 10-year planning period.
Pass-by Trip - a trip made as an intermediate stop on the way from an origin to a primary trip
destination. For example, a stop at a convenience store on the way to office from home.
PM Peak Hour - the hour when the highest volume of traffic typically occurs. Data collection
(September 2001) revealed the peak hour of travel between 5:00 and 6:00 pm for Waxahachie.
PM Peak Hour Traffic Counts - the number of vehicles passing a certain point during the peak hours
of travel. Traffic counts are conducted during the PM peak hour because the greatest demand for
roadway capacity occurs during this hour.
Primary Trip - a trip made for the specific purpose of visiting a destination; for example, from home
to office.
Roadway Demand - the demand placed on the roadway network as a result of development.
Determined by multiplying the trip generation of a specific land use by the average trip length.
Roadway Supply (or Capacity) - the number of service units provided by a segment of roadway over
a period of time. Determined by multiplying the lane capacity by the roadway length.
Service Area - the area within the city boundaries to be served by capital improvements. Criteria for
developing the service area structure include; 1) restricted to six-mile limit by legislation (to ensure
proximity of roadway improvements to development), 2) conforms to census or forecast model
boundaries, 3) projects on CIP as boundaries, 4) effort to match roadway supply with projected
demand, or 5) city limit boundaries.
Service Unit - a measure of use or generation attributable to new development for roadway
improvements. Also used to measure supply provided by existing and proposed roadway
improvements.
Trip - a single, one-direction vehicle movement from an origin to a destination.
Trip Generation - the total trip ends for a land use over a given period of time or the total of all trips
entering and exiting a site during that designated time. Used in the development of 10-year traffic
demand projections and the equivalency table for Waxahachie. Based primarily on data prepared by
the Institute of Transportation Engineers (ITE).
Vehicle - for impact fee purposes, any motorized appurtenance that carries passengers and/or goods on
the roadway system during peak periods of travel.
Vehicle-mile - a unit used to express both supply and demand provided by, and placed on, the
roadway system. A combination of a number of vehicles traveling during a given time period and the
distance in which these vehicles travel in miles.
B. Land Use Definitions
LAND USE DEFINITIONS
Residential
Single-Family Detached - Any single-family detached home on an individual lot is included in this
category. A typical example of this land use is a home in a suburban subdivision. Also included
are duplex residential units and manufactured homes and other residential land uses not specified
above.
Multi-Family - This land use includes both low-rise ("walk-up" dwellings) and high-rise multi-
family apartments. An apartment is defined as a dwelling unit that is located within the same
building with three or more dwelling units. Also included in this land use are residential
condominiums, townhomes, triplex and quadplex units. Residential condominiums and
townhomes are defined as single-family units that have at least one other single-family unit within
the same building structure.
Independent Senior Living Facility - Retirement communities - restricted to adults or senior
citizens - contain residential units similar to apartments or condominiums, and are usually self-
contained villages. They may also contain special services such as medical facilities, dining
facilities, and some limited supporting retail facilities.
Office
General Office Building - A general office building houses one or more tenants and is the location
where affairs of a business, commercial or industrial organization, and professional activity are
conducted. The building or buildings may be limited to one tenant or contain a mixture of tenants
including professional services, insurance companies, investment brokers, company headquarters,
and services for the tenants such as a bank or savings and loan, a restaurant or cafeteria, and
several retail facilities. Also included in this category are office parks, and other office uses not
specified above.
Medical Office Building – A building that provides diagnoses and outpatient care on a routine
basis but is unable to provide prolonged in-house medical and surgical care. One or more private
physicians or dentists generally operate this type of facility.
Commercial/Retail
General Retail – General retail includes a variety of land uses that include shopping centers, home
improvement stores, hardware stores selling a complete assortment of food, household goods and
materials, apparel, servicing items. A shopping center is an integrated group of commercial
establishments that is planned, developed, owned, and managed as a unit. It is related to its market
area in terms of size, location, and type of store. Shopping centers provide on-site parking
facilities. Some centers may include non-merchandising uses such as small office professional
services, post offices, banks, health clubs, video rentals, and recreational facilities such as ice-
skating rinks or video arcades.
Restaurant - This land use consists of sit-down eating establishments. Quality and high-turnover
(sit-down) restaurants are included in this category. Quality restaurants usually have a turnover
rate of at least one hour or longer. The turnover rate for a high-turnover (sit-down) restaurant is
usually less than one hour.
Fast Food Restaurant - This category includes fast food restaurants with or without drive-through
windows, such as McDonalds, Burger King, Dunkin Donuts, and Taco Bell. Some establishments
may include an indoor or outdoor playground.
Convenience Store/Gas Station - Any convenience market that sells convenience foods,
newspapers, magazines, and often, beer and wine and may have gasoline pumps. Gas stations
generally are located at intersections or freeway interchanges and may include facilities for
servicing, repairing, fueling motor vehicles and also may have convenience stores. Convenience
stores/gas stations that have a fast-food restaurant contained within should be calculated on a
separate basis based on the appropriate independent variable.
Bank - This land use includes walk-in and drive-in banks. Walk-in banks are generally free-
standing buildings with their own parking lots. These banks do not have drive-in windows. Drive-
in banks provide banking facilities for the motorist while in a vehicle; many also serve patrons who
walk into the building. Savings and loan companies should also be included in this category.
Hotel/Motel – A place of lodging that provides sleeping accommodations, small restaurants,
lounges, and meeting spaces. Some hotels or motels may provide banquet rooms or other retail
and service shops.
Furniture and Appliance Sales - A store specializing in the sale of furniture, household appliances
and goods and often, carpeting.
Theater – This land use consists of a movie or live theater and contains audience seating, single or
multiple auditoriums, lobby, offices and refreshment stands.
Self-Storage Facilities - A self serve storage unit or vault that is rented for the storage of goods.
Each unit is physically separated from other units and access is usually provided through an
overhead door or other common access point.
Industrial
General Industrial – General industrial includes a variety of land uses such as light industrial,
manufacturing, salvage, facilities for preparation/assembly and warehouse/distribution of goods.
Other uses include materials testing laboratories, high-tech facilities and assemblers of technical
equipment. Most facilities are free standing and devoted to a single use. Also included in this
category are any other industrial uses not specified above.
Manufacturing – Facilities where the primary activity is the conversion or fabrication of raw
materials to finished products. In addition to production of goods, manufacturing facilities may
also have ancillary office, warehouse and associated functions.
Warehousing – These facilities are primarily devoted to the storage of materials. These facilities
differ from mini-warehouse in that they are generally not self-service in nature.
Institutional
Private School - Private schools serve students between the kindergarten and middle school or
high school levels. Private schools are usually centrally located in residential communities in order
to facilitate student access and have no student drivers.
Community College - Community college provides two and four year advanced degrees.
Vocational and technical schools are other uses that may fall under this category.
Day Care Center - A day care center is a facility where care for pre-school age children is provided,
normally during the daytime hours. Day care facilities generally include classrooms, offices, eating
areas, and playgrounds. Some centers also provide after-school care for older children.
Hospital - A hospital is any institution where medical or surgical care is given to non-ambulatory
and ambulatory patients, and overnight accommodations are provided.
Nursing Home - A nursing home is any facility whose primary purpose is to care for persons who
are unable to care for themselves. The term applies to rest homes, chronic care, and convalescent
homes.
Religious Facilities – Churches, synagogues or houses of worship that provide public worship
services, and generally house an assembly hall or sanctuary, meeting rooms, classrooms, and
occasionally dining, catering, or party facilities.
Activity Centers – A recreational center or private club such as a YMCA that may offer classes and
clubs for adults and children; a day care or a nursery school, meeting rooms, swimming pools and
whirlpools; saunas, tennis, racquetball and handball courts, exercise classes, weightlifting
equipment and locker rooms. Some may offer a small restaurant or snack bar within.
U.S. Post Office – A building that contains service windows for mailing packages and letters, post
office boxes, offices, sorting and distributing facilities for mail and vehicle storage areas.
C. Existing Capital Improvements
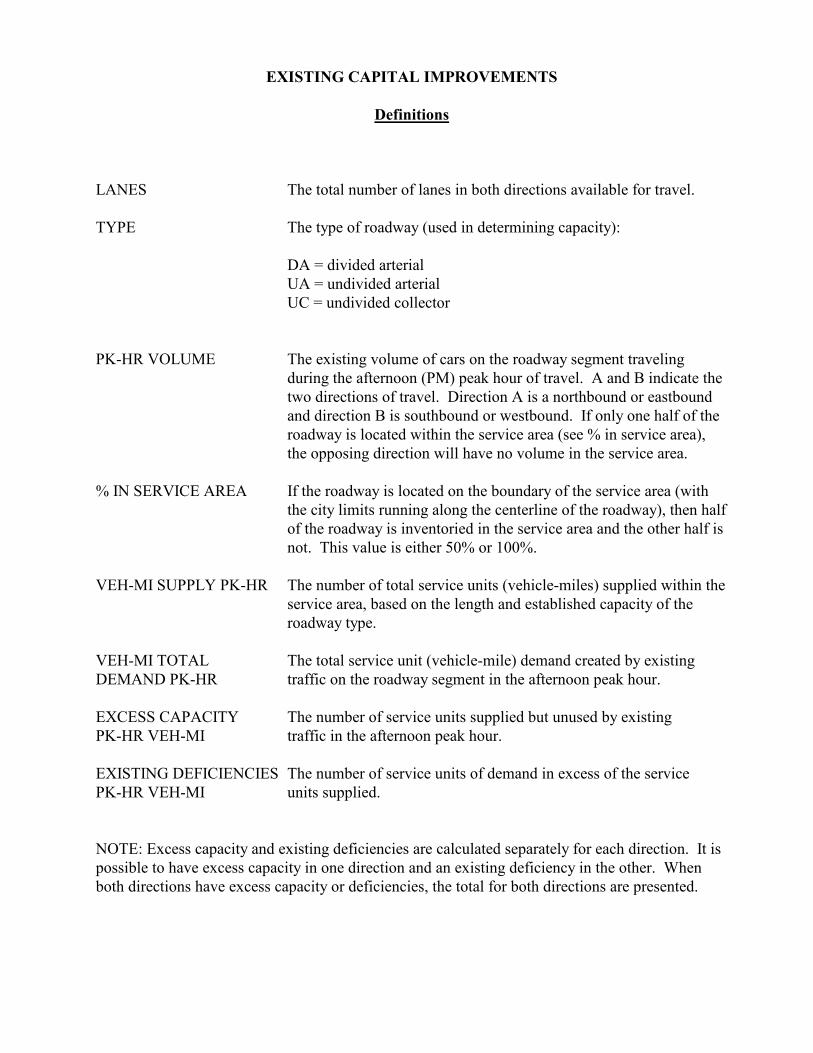
EXISTING CAPITAL IMPROVEMENTS
Definitions
LANES The total number of lanes in both directions available for travel.
TYPE The type of roadway (used in determining capacity):
DA = divided arterial
UA = undivided arterial
UC = undivided collector
PK-HR VOLUME The existing volume of cars on the roadway segment traveling
during the afternoon (PM) peak hour of travel. A and B indicate the
two directions of travel. Direction A is a northbound or eastbound
and direction B is southbound or westbound. If only one half of the
roadway is located within the service area (see % in service area),
the opposing direction will have no volume in the service area.
% IN SERVICE AREA If the roadway is located on the boundary of the service area (with
the city limits running along the centerline of the roadway), then half
of the roadway is inventoried in the service area and the other half is
not. This value is either 50% or 100%.
VEH-MI SUPPLY PK-HR The number of total service units (vehicle-miles) supplied within the
service area, based on the length and established capacity of the
roadway type.
VEH-MI TOTAL The total service unit (vehicle-mile) demand created by existing
DEMAND PK-HR traffic on the roadway segment in the afternoon peak hour.
EXCESS CAPACITY The number of service units supplied but unused by existing
PK-HR VEH-MI traffic in the afternoon peak hour.
EXISTING DEFICIENCIES The number of service units of demand in excess of the service
PK-HR VEH-MI units supplied.
NOTE: Excess capacity and existing deficiencies are calculated separately for each direction. It is
possible to have excess capacity in one direction and an existing deficiency in the other. When
both directions have excess capacity or deficiencies, the total for both directions are presented.
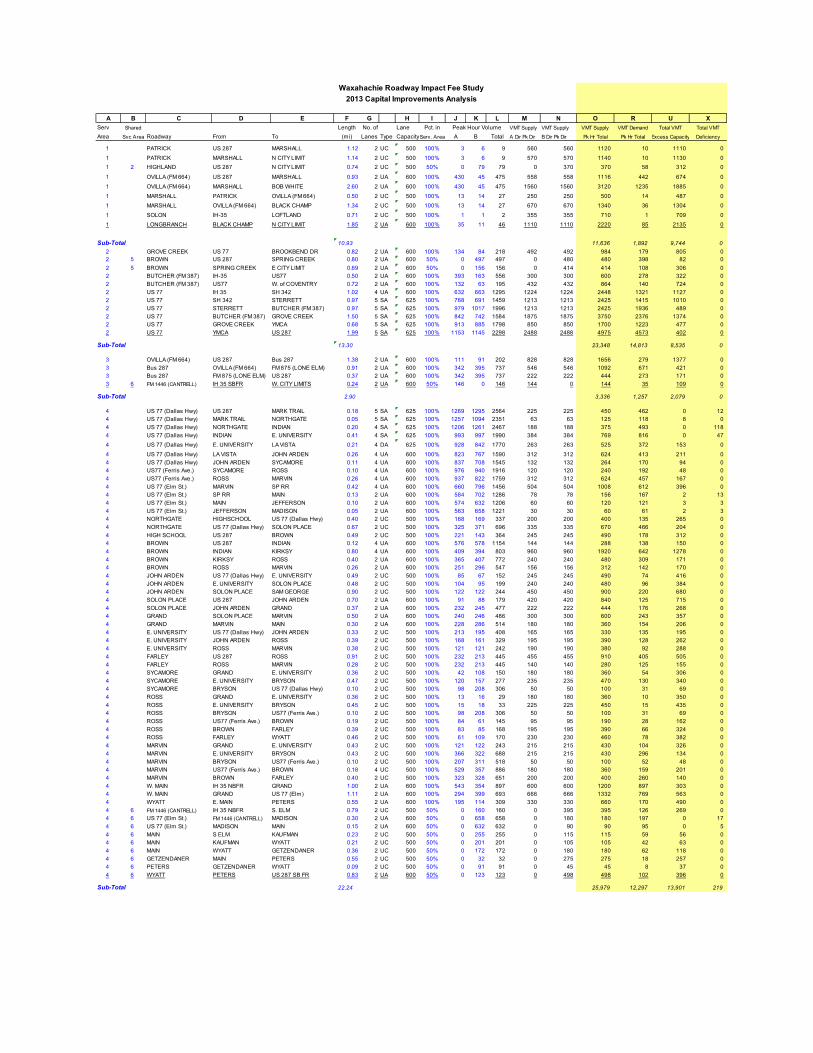
Waxahachie Roadway Impact Fee Study
2013 Capital Improvements Analysis
2013 VolsA B C D E F G H I J K L M N O R U X
Serv Shared Length No. of Lane Pct. in Peak Hour Volume VMT Supply VMT Supply VMT Supply VMT Demand Total VMT Total VMT
Area Svc Area Roadway From To (mi) Lanes Type CapacityServ. Area A B Total A Dir Pk Dir B Dir Pk Dir Pk Hr Total Pk Hr Total Excess Capacity Deficiency
1 PATRICK US 287 MARSHALL 1.12 2 UC 500 100% 3 6 9 560 560 1120 10 1110 0
1 PATRICK MARSHALL N CITY LIMIT 1.14 2 UC 500 100% 3 6 9 570 570 1140 10 1130 0
1 2 HIGHLAND US 287 N CITY LIMIT 0.74 2 UC 500 50% 0 79 79 0 370 370 58 312 0
1 OVILLA (FM 664) US 287 MARSHALL 0.93 2 UA 600 100% 430 45 475 558 558 1116 442 674 0
1 OVILLA (FM 664) MARSHALL BOB WHITE 2.60 2 UA 600 100% 430 45 475 1560 1560 3120 1235 1885 0
1 MARSHALL PATRICK OVILLA (FM 664) 0.50 2 UC 500 100% 13 14 27 250 250 500 14 487 0
1 MARSHALL OVILLA (FM 664) BLACK CHAMP 1.34 2 UC 500 100% 13 14 27 670 670 1340 36 1304 0
1 SOLON IH-35 LOFTLAND 0.71 2 UC 500 100% 1 1 2 355 355 710 1 709 0
1 LONGBRANCH BLACK CHAMP N CITY LIMIT 1.85 2 UA 600 100% 35 11 46 1110 1110 2220 85 2135 0
Sub-Total 10.93 11,636 1,892 9,744 0
2 GROVE CREEK US 77 BROOKBEND DR 0.82 2 UA 600 100% 134 84 218 492 492 984 179 805 0
2 5 BROWN US 287 SPRING CREEK 0.80 2 UA 600 50% 0 497 497 0 480 480 398 82 0
2 5 BROWN SPRING CREEK E CITY LIMIT 0.69 2 UA 600 50% 0 156 156 0 414 414 108 306 0
2 BUTCHER (FM 387) IH-35 US77 0.50 2 UA 600 100% 393 163 556 300 300 600 278 322 0
2 BUTCHER (FM 387) US77 W. of COVENTRY 0.72 2 UA 600 100% 132 63 195 432 432 864 140 724 0
2 US 77 IH 35 SH 342 1.02 4 UA 600 100% 632 663 1295 1224 1224 2448 1321 1127 0
2 US 77 SH 342 STERRETT 0.97 5 SA 625 100% 768 691 1459 1213 1213 2425 1415 1010 0
2 US 77 STERRETT BUTCHER (FM 387) 0.97 5 SA 625 100% 979 1017 1996 1213 1213 2425 1936 489 0
2 US 77 BUTCHER (FM 387) GROVE CREEK 1.50 5 SA 625 100% 842 742 1584 1875 1875 3750 2376 1374 0
2 US 77 GROVE CREEK YMCA 0.68 5 SA 625 100% 913 885 1798 850 850 1700 1223 477 0
2 US 77 YMCA US 287 1.99 5 SA 625 100% 1153 1145 2298 2488 2488 4975 4573 402 0
Sub-Total 13.30 23,348 14,813 8,535 0
3 OVILLA (FM 664) US 287 Bus 287 1.38 2 UA 600 100% 111 91 202 828 828 1656 279 1377 0
3 Bus 287 OVILLA (FM 664) FM 875 (LONE ELM) 0.91 2 UA 600 100% 342 395 737 546 546 1092 671 421 0
3 Bus 287 FM 875 (LONE ELM) US 287 0.37 2 UA 600 100% 342 395 737 222 222 444 273 171 0
3 6 FM 1446 (CANTRELL) IH 35 SBFR W. CITY LIMITS 0.24 2 UA 600 50% 146 0 146 144 0 144 35 109 0
Sub-Total 2.90 3,336 1,257 2,079 0
4 US 77 (Dallas Hwy) US 287 MARK TRAIL 0.18 5 SA 625 100% 1269 1295 2564 225 225 450 462 0 12
4 US 77 (Dallas Hwy) MARK TRAIL NORTHGATE 0.05 5 SA 625 100% 1257 1094 2351 63 63 125 118 8 0
4 US 77 (Dallas Hwy) NORTHGATE INDIAN 0.20 4 SA 625 100% 1206 1261 2467 188 188 375 493 0 118
4 US 77 (Dallas Hwy) INDIAN E. UNIVERSITY 0.41 4 SA 625 100% 993 997 1990 384 384 769 816 0 47
4 US 77 (Dallas Hwy) E. UNIVERSITY LA VISTA 0.21 4 DA 625 100% 928 842 1770 263 263 525 372 153 0
4 US 77 (Dallas Hwy) LA VISTA JOHN ARDEN 0.26 4 UA 600 100% 823 767 1590 312 312 624 413 211 0
4 US 77 (Dallas Hwy) JOHN ARDEN SYCAMORE 0.11 4 UA 600 100% 837 708 1545 132 132 264 170 94 0
4 US77 (Ferris Ave.) SYCAMORE ROSS 0.10 4 UA 600 100% 976 940 1916 120 120 240 192 48 0
4 US77 (Ferris Ave.) ROSS MARVIN 0.26 4 UA 600 100% 937 822 1759 312 312 624 457 167 0
4 US 77 (Elm St.) MARVIN SP RR 0.42 4 UA 600 100% 660 796 1456 504 504 1008 612 396 0
4 US 77 (Elm St.) SP RR MAIN 0.13 2 UA 600 100% 584 702 1286 78 78 156 167 2 13
4 US 77 (Elm St.) MAIN JEFFERSON 0.10 2 UA 600 100% 574 632 1206 60 60 120 121 3 3
4 US 77 (Elm St.) JEFFERSON MADISON 0.05 2 UA 600 100% 563 658 1221 30 30 60 61 2 3
4 NORTHGATE HIGHSCHOOL US 77 (Dallas Hwy) 0.40 2 UC 500 100% 168 169 337 200 200 400 135 265 0
4 NORTHGATE US 77 (Dallas Hwy) SOLON PLACE 0.67 2 UC 500 100% 325 371 696 335 335 670 466 204 0
4 HIGH SCHOOL US 287 BROWN 0.49 2 UC 500 100% 221 143 364 245 245 490 178 312 0
4 BROWN US 287 INDIAN 0.12 4 UA 600 100% 576 578 1154 144 144 288 138 150 0
4 BROWN INDIAN KIRKSY 0.80 4 UA 600 100% 409 394 803 960 960 1920 642 1278 0
4 BROWN KIRKSY ROSS 0.40 2 UA 600 100% 365 407 772 240 240 480 309 171 0
4 BROWN ROSS MARVIN 0.26 2 UA 600 100% 251 296 547 156 156 312 142 170 0
4 JOHN ARDEN US 77 (Dallas Hwy) E. UNIVERSITY 0.49 2 UC 500 100% 85 67 152 245 245 490 74 416 0
4 JOHN ARDEN E. UNIVERSITY SOLON PLACE 0.48 2 UC 500 100% 104 95 199 240 240 480 96 384 0
4 JOHN ARDEN SOLON PLACE SAM GEORGE 0.90 2 UC 500 100% 122 122 244 450 450 900 220 680 0
4 SOLON PLACE US 287 JOHN ARDEN 0.70 2 UA 600 100% 91 88 179 420 420 840 125 715 0
4 SOLON PLACE JOHN ARDEN GRAND 0.37 2 UA 600 100% 232 245 477 222 222 444 176 268 0
4 GRAND SOLON PLACE MARVIN 0.50 2 UA 600 100% 240 246 486 300 300 600 243 357 0
4 GRAND MARVIN MAIN 0.30 2 UA 600 100% 228 286 514 180 180 360 154 206 0
4 E. UNIVERSITY US 77 (Dallas Hwy) JOHN ARDEN 0.33 2 UC 500 100% 213 195 408 165 165 330 135 195 0
4 E. UNIVERSITY JOHN ARDEN ROSS 0.39 2 UC 500 100% 168 161 329 195 195 390 128 262 0
4 E. UNIVERSITY ROSS MARVIN 0.38 2 UC 500 100% 121 121 242 190 190 380 92 288 0
4 FARLEY US 287 ROSS 0.91 2 UC 500 100% 232 213 445 455 455 910 405 505 0
4 FARLEY ROSS MARVIN 0.28 2 UC 500 100% 232 213 445 140 140 280 125 155 0
4 SYCAMORE GRAND E. UNIVERSITY 0.36 2 UC 500 100% 42 108 150 180 180 360 54 306 0
4 SYCAMORE E. UNIVERSITY BRYSON 0.47 2 UC 500 100% 120 157 277 235 235 470 130 340 0
4 SYCAMORE BRYSON US 77 (Dallas Hwy) 0.10 2 UC 500 100% 98 208 306 50 50 100 31 69 0
4 ROSS GRAND E. UNIVERSITY 0.36 2 UC 500 100% 13 16 29 180 180 360 10 350 0
4 ROSS E. UNIVERSITY BRYSON 0.45 2 UC 500 100% 15 18 33 225 225 450 15 435 0
4 ROSS BRYSON US77 (Ferris Ave.) 0.10 2 UC 500 100% 98 208 306 50 50 100 31 69 0
4 ROSS US77 (Ferris Ave.) BROWN 0.19 2 UC 500 100% 84 61 145 95 95 190 28 162 0
4 ROSS BROWN FARLEY 0.39 2 UC 500 100% 83 85 168 195 195 390 66 324 0
4 ROSS FARLEY WYATT 0.46 2 UC 500 100% 61 109 170 230 230 460 78 382 0
4 MARVIN GRAND E. UNIVERSITY 0.43 2 UC 500 100% 121 122 243 215 215 430 104 326 0
4 MARVIN E. UNIVERSITY BRYSON 0.43 2 UC 500 100% 366 322 688 215 215 430 296 134 0
4 MARVIN BRYSON US77 (Ferris Ave.) 0.10 2 UC 500 100% 207 311 518 50 50 100 52 48 0
4 MARVIN US77 (Ferris Ave.) BROWN 0.18 4 UC 500 100% 529 357 886 180 180 360 159 201 0
4 MARVIN BROWN FARLEY 0.40 2 UC 500 100% 323 328 651 200 200 400 260 140 0
4 W. MAIN IH 35 NBFR GRAND 1.00 2 UA 600 100% 543 354 897 600 600 1200 897 303 0
4 W. MAIN GRAND US 77 (Elm) 1.11 2 UA 600 100% 294 399 693 666 666 1332 769 563 0
4 WYATT E. MAIN PETERS 0.55 2 UA 600 100% 195 114 309 330 330 660 170 490 0
4 6 FM 1446 (CANTRELL) IH 35 NBFR S. ELM 0.79 2 UC 500 50% 0 160 160 0 395 395 126 269 0
4 6 US 77 (Elm St.) FM 1446 (CANTRELL) MADISON 0.30 2 UA 600 50% 0 658 658 0 180 180 197 0 17
4 6 US 77 (Elm St.) MADISON MAIN 0.15 2 UA 600 50% 0 632 632 0 90 90 95 0 5
4 6 MAIN S ELM KAUFMAN 0.23 2 UC 500 50% 0 255 255 0 115 115 59 56 0
4 6 MAIN KAUFMAN WYATT 0.21 2 UC 500 50% 0 201 201 0 105 105 42 63 0
4 6 MAIN WYATT GETZENDANER 0.36 2 UC 500 50% 0 172 172 0 180 180 62 118 0
4 6 GETZENDANER MAIN PETERS 0.55 2 UC 500 50% 0 32 32 0 275 275 18 257 0
4 6 PETERS GETZENDANER WYATT 0.09 2 UC 500 50% 0 91 91 0 45 45 8 37 0
4 6 WYATT PETERS US 287 SB FR 0.83 2 UA 600 50% 0 123 123 0 498 498 102 396 0
Sub-Total 22.24 25,979 12,297 13,901 219
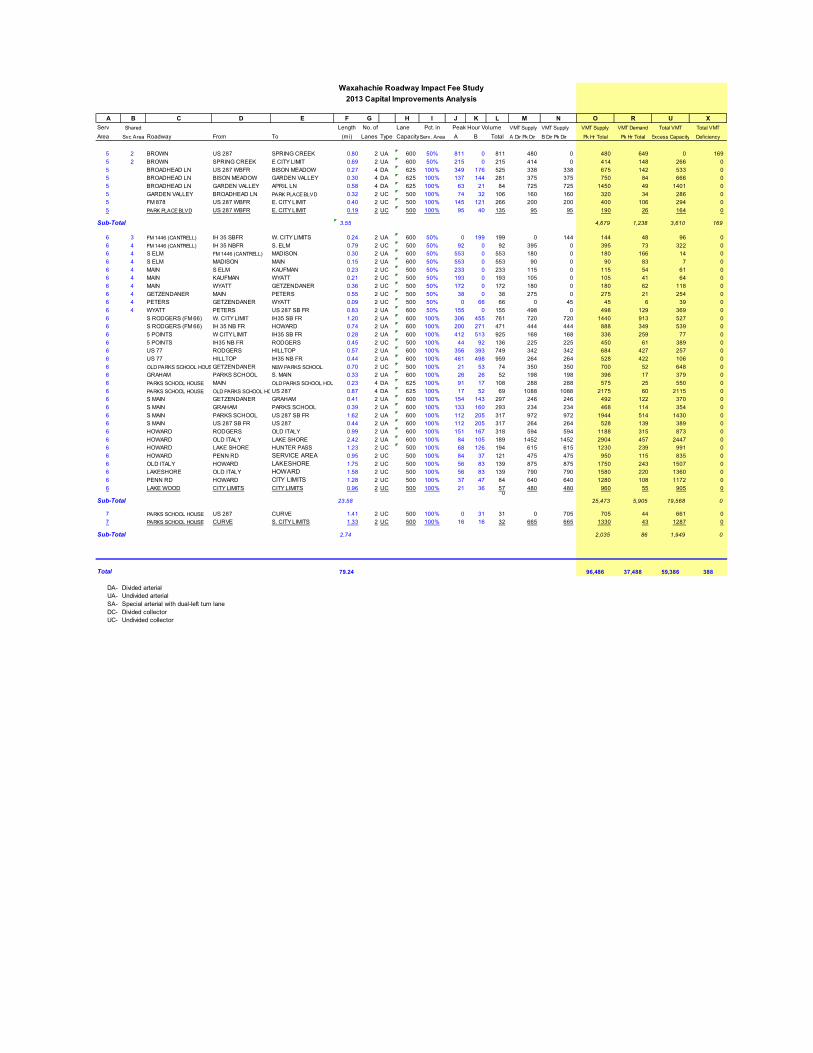
Waxahachie Roadway Impact Fee Study
2013 Capital Improvements Analysis
2013 VolsA B C D E F G H I J K L M N O R U X
Serv Shared Length No. of Lane Pct. in Peak Hour Volume VMT Supply VMT Supply VMT Supply VMT Demand Total VMT Total VMT
Area Svc Area Roadway From To (mi) Lanes Type CapacityServ. Area A B Total A Dir Pk Dir B Dir Pk Dir Pk Hr Total Pk Hr Total Excess Capacity Deficiency
5 2 BROWN US 287 SPRING CREEK 0.80 2 UA 600 50% 811 0 811 480 0 480 649 0 169
5 2 BROWN SPRING CREEK E CITY LIMIT 0.69 2 UA 600 50% 215 0 215 414 0 414 148 266 0
5 BROADHEAD LN US 287 WBFR BISON MEADOW 0.27 4 DA 625 100% 349 176 525 338 338 675 142 533 0
5 BROADHEAD LN BISON MEADOW GARDEN VALLEY 0.30 4 DA 625 100% 137 144 281 375 375 750 84 666 0
5 BROADHEAD LN GARDEN VALLEY APRIL LN 0.58 4 DA 625 100% 63 21 84 725 725 1450 49 1401 0
5 GARDEN VALLEY BROADHEAD LN PARK PLACE BLVD 0.32 2 UC 500 100% 74 32 106 160 160 320 34 286 0
5 FM 878 US 287 WBFR E. CITY LIMIT 0.40 2 UC 500 100% 145 121 266 200 200 400 106 294 0
5 PARK PLACE BLVD US 287 WBFR E. CITY LIMIT 0.19 2 UC 500 100% 95 40 135 95 95 190 26 164 0
Sub-Total 3.55 4,679 1,238 3,610 169
6 3 FM 1446 (CANTRELL) IH 35 SBFR W. CITY LIMITS 0.24 2 UA 600 50% 0 199 199 0 144 144 48 96 0
6 4 FM 1446 (CANTRELL) IH 35 NBFR S. ELM 0.79 2 UC 500 50% 92 0 92 395 0 395 73 322 0
6 4 S ELM FM 1446 (CANTRELL) MADISON 0.30 2 UA 600 50% 553 0 553 180 0 180 166 14 0
6 4 S ELM MADISON MAIN 0.15 2 UA 600 50% 553 0 553 90 0 90 83 7 0
6 4 MAIN S ELM KAUFMAN 0.23 2 UC 500 50% 233 0 233 115 0 115 54 61 0
6 4 MAIN KAUFMAN WYATT 0.21 2 UC 500 50% 193 0 193 105 0 105 41 64 0
6 4 MAIN WYATT GETZENDANER 0.36 2 UC 500 50% 172 0 172 180 0 180 62 118 0
6 4 GETZENDANER MAIN PETERS 0.55 2 UC 500 50% 38 0 38 275 0 275 21 254 0
6 4 PETERS GETZENDANER WYATT 0.09 2 UC 500 50% 0 66 66 0 45 45 6 39 0
6 4 WYATT PETERS US 287 SB FR 0.83 2 UA 600 50% 155 0 155 498 0 498 129 369 0
6 S RODGERS (FM 66) W. CITY LIMIT IH35 SB FR 1.20 2 UA 600 100% 306 455 761 720 720 1440 913 527 0
6 S RODGERS (FM 66) IH 35 NB FR HOWARD 0.74 2 UA 600 100% 200 271 471 444 444 888 349 539 0
6 5 POINTS W CITY LIMIT IH35 SB FR 0.28 2 UA 600 100% 412 513 925 168 168 336 259 77 0
6 5 POINTS IH35 NB FR RODGERS 0.45 2 UC 500 100% 44 92 136 225 225 450 61 389 0
6 US 77 RODGERS HILLTOP 0.57 2 UA 600 100% 356 393 749 342 342 684 427 257 0
6 US 77 HILLTOP IH35 NB FR 0.44 2 UA 600 100% 461 498 959 264 264 528 422 106 0
6 OLD PARKS SCHOOL HOUSEGETZENDANER NEW PARKS SCHOOL 0.70 2 UC 500 100% 21 53 74 350 350 700 52 648 0
6 GRAHAM PARKS SCHOOL S. MAIN 0.33 2 UA 600 100% 26 26 52 198 198 396 17 379 0
6 PARKS SCHOOL HOUSE MAIN OLD PARKS SCHOOL HOUSE 0.23 4 DA 625 100% 91 17 108 288 288 575 25 550 0
6 PARKS SCHOOL HOUSE OLD PARKS SCHOOL HOUSEUS 287 0.87 4 DA 625 100% 17 52 69 1088 1088 2175 60 2115 0
6 S MAIN GETZENDANER GRAHAM 0.41 2 UA 600 100% 154 143 297 246 246 492 122 370 0
6 S MAIN GRAHAM PARKS SCHOOL 0.39 2 UA 600 100% 133 160 293 234 234 468 114 354 0
6 S MAIN PARKS SCHOOL US 287 SB FR 1.62 2 UA 600 100% 112 205 317 972 972 1944 514 1430 0
6 S MAIN US 287 SB FR US 287 0.44 2 UA 600 100% 112 205 317 264 264 528 139 389 0
6 HOWARD RODGERS OLD ITALY 0.99 2 UA 600 100% 151 167 318 594 594 1188 315 873 0
6 HOWARD OLD ITALY LAKE SHORE 2.42 2 UA 600 100% 84 105 189 1452 1452 2904 457 2447 0
6 HOWARD LAKE SHORE HUNTER PASS 1.23 2 UC 500 100% 68 126 194 615 615 1230 239 991 0
6 HOWARD PENN RD SERVICE AREA 0.95 2 UC 500 100% 84 37 121 475 475 950 115 835 0
6 OLD ITALY HOWARD LAKESHORE 1.75 2 UC 500 100% 56 83 139 875 875 1750 243 1507 0
6 LAKESHORE OLD ITALY HOWARD 1.58 2 UC 500 100% 56 83 139 790 790 1580 220 1360 0
6 PENN RD HOWARD CITY LIMITS 1.28 2 UC 500 100% 37 47 84 640 640 1280 108 1172 0
6 LAKE WOOD CITY LIMITS CITY LIMITS 0.96 2 UC 500 100% 21 36 57 480 480 960 55 905 00
Sub-Total 23.58 25,473 5,905 19,568 0
7 PARKS SCHOOL HOUSE US 287 CURVE 1.41 2 UC 500 100% 0 31 31 0 705 705 44 661 0
7 PARKS SCHOOL HOUSE CURVE S. CITY LIMITS 1.33 2 UC 500 100% 16 16 32 665 665 1330 43 1287 0
Sub-Total 2.74 2,035 86 1,949 0
Total 79.24 96,486 37,488 59,386 388
DA- Divided arterial
UA- Undivided arterial
SA- Special arterial with dual-left turn lane
DC- Divided collector
UC- Undivided collector
D. Calculation of Vehicle-Miles of New Demand
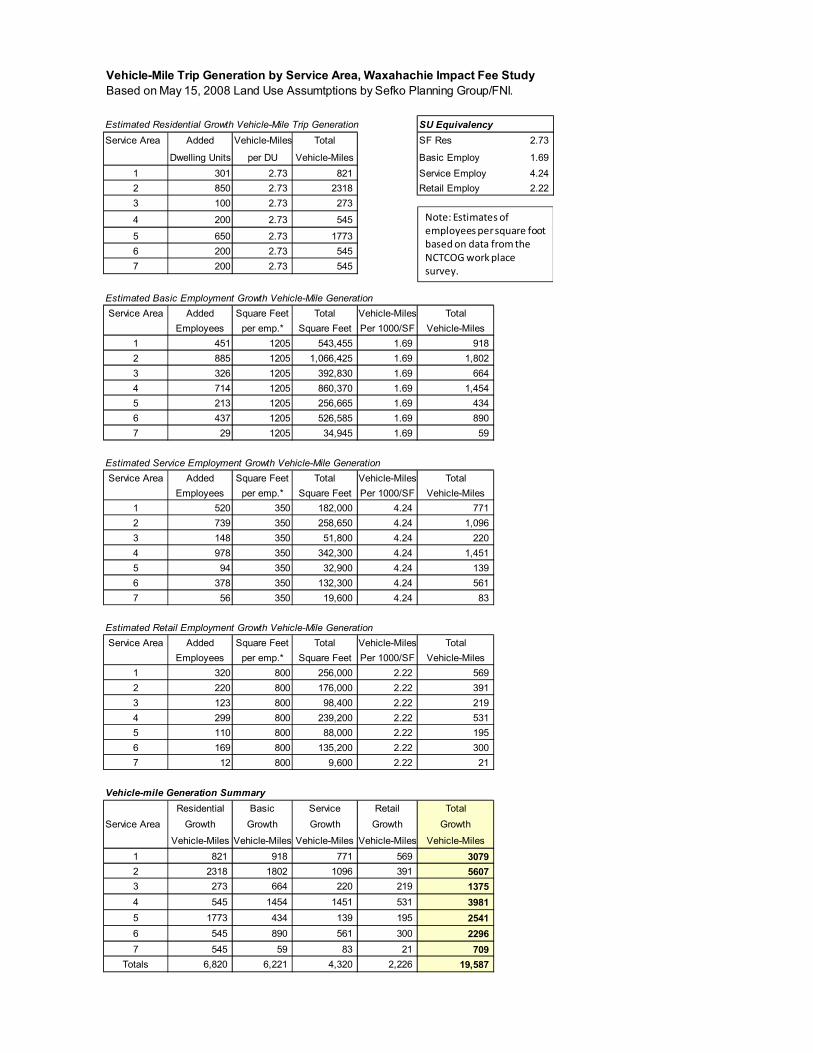
Vehicle-Mile Trip Generation by Service Area, Waxahachie Impact Fee Study
Based on May 15, 2008 Land Use Assumtptions by Sefko Planning Group/FNI.
Estimated Residential Growth Vehicle-Mile Trip Generation SU Equivalency
Service Area Added Vehicle-Miles Total SF Res 2.73
Dwelling Units per DU Vehicle-Miles Basic Employ 1.69
1 301 2.73 821 Service Employ 4.24
2 850 2.73 2318 Retail Employ 2.22
3 100 2.73 273
4 200 2.73 545
5 650 2.73 1773
6 200 2.73 545
7 200 2.73 545
2501
Estimated Basic Employment Growth Vehicle-Mile Generation
Service Area Added Square Feet Total Vehicle-Miles Total
Employees per emp.* Square Feet Per 1000/SF Vehicle-Miles
1 451 1205 543,455 1.69 918
2 885 1205 1,066,425 1.69 1,802
3 326 1205 392,830 1.69 664
4 714 1205 860,370 1.69 1,454
5 213 1205 256,665 1.69 434
6 437 1205 526,585 1.69 890
7 29 1205 34,945 1.69 59
3055
Estimated Service Employment Growth Vehicle-Mile Generation
Service Area Added Square Feet Total Vehicle-Miles Total
Employees per emp.* Square Feet Per 1000/SF Vehicle-Miles
1 520 350 182,000 4.24 771
2 739 350 258,650 4.24 1,096
3 148 350 51,800 4.24 220
4 978 350 342,300 4.24 1,451
5 94 350 32,900 4.24 139
6 378 350 132,300 4.24 561
7 56 350 19,600 4.24 83
2913
Estimated Retail Employment Growth Vehicle-Mile Generation
Service Area Added Square Feet Total Vehicle-Miles Total
Employees per emp.* Square Feet Per 1000/SF Vehicle-Miles
1 320 800 256,000 2.22 569
2 220 800 176,000 2.22 391
3 123 800 98,400 2.22 219
4 299 800 239,200 2.22 531
5 110 800 88,000 2.22 195
6 169 800 135,200 2.22 300
7 12 800 9,600 2.22 21
1253
Vehicle-mile Generation Summary
Residential Basic Service Retail Total
Service Area Growth Growth Growth Growth Growth
Vehicle-Miles Vehicle-Miles Vehicle-Miles Vehicle-Miles Vehicle-Miles
1 821 918 771 569 3079
2 2318 1802 1096 391 5607
3 273 664 220 219 1375
4 545 1454 1451 531 3981
5 1773 434 139 195 2541
6 545 890 561 300 2296
7 545 59 83 21 709
Totals 6,820 6,221 4,320 2,226 19,587
Note: Estimates of
employees per square foot
based on data from the
NCTCOG work place
survey.
E. Roadway Improvement Plan Projects
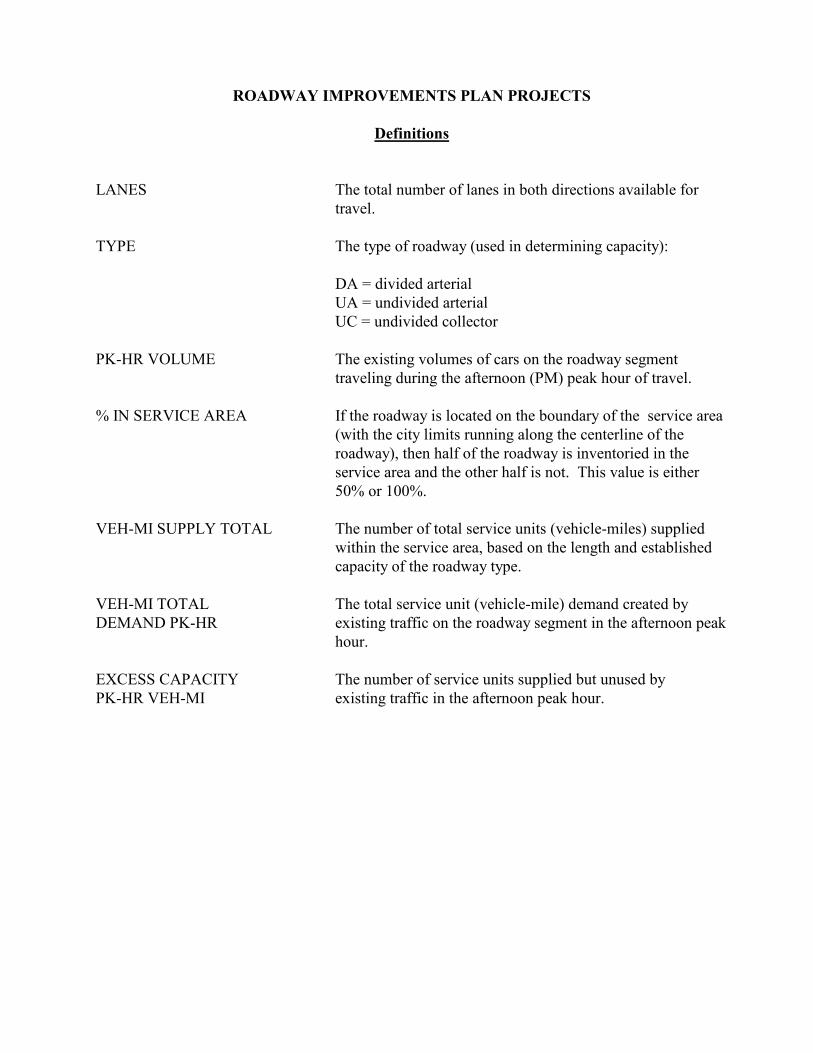
ROADWAY IMPROVEMENTS PLAN PROJECTS
Definitions
LANES The total number of lanes in both directions available for
travel.
TYPE The type of roadway (used in determining capacity):
DA = divided arterial
UA = undivided arterial
UC = undivided collector
PK-HR VOLUME The existing volumes of cars on the roadway segment
traveling during the afternoon (PM) peak hour of travel.
% IN SERVICE AREA If the roadway is located on the boundary of the service area
(with the city limits running along the centerline of the
roadway), then half of the roadway is inventoried in the
service area and the other half is not. This value is either
50% or 100%.
VEH-MI SUPPLY TOTAL The number of total service units (vehicle-miles) supplied
within the service area, based on the length and established
capacity of the roadway type.
VEH-MI TOTAL The total service unit (vehicle-mile) demand created by
DEMAND PK-HR existing traffic on the roadway segment in the afternoon peak
hour.
EXCESS CAPACITY The number of service units supplied but unused by
PK-HR VEH-MI existing traffic in the afternoon peak hour.
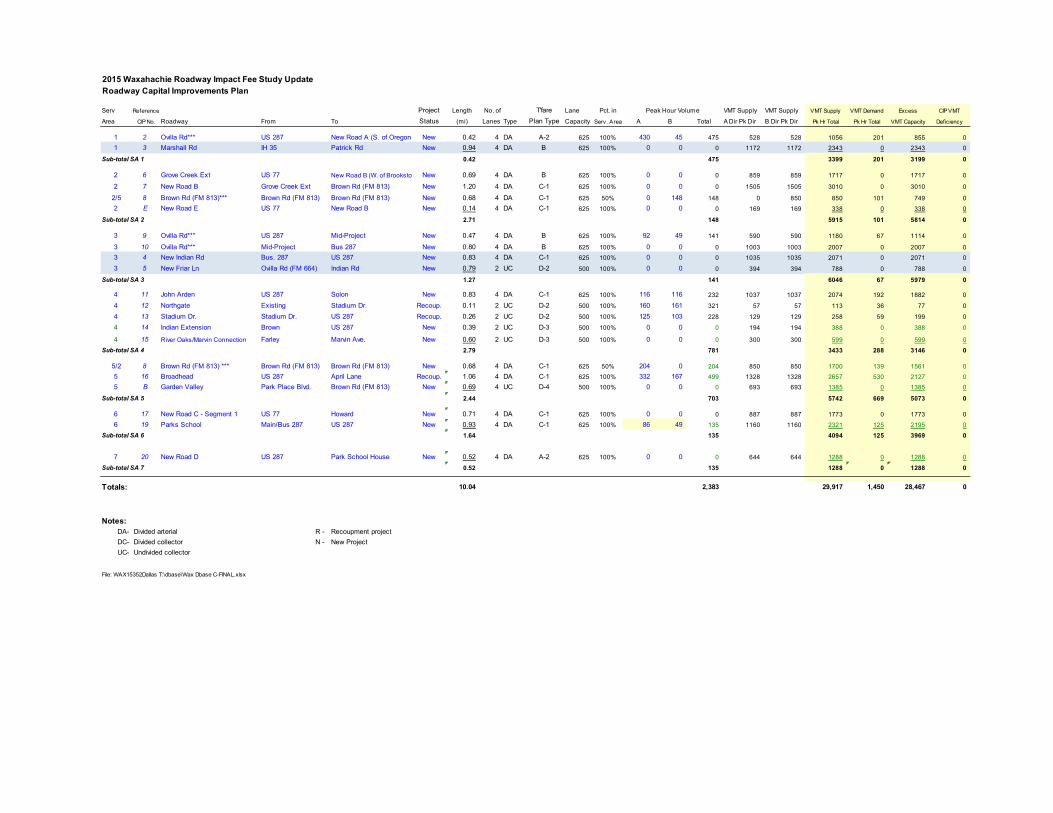
2015 Waxahachie Roadway Impact Fee Study Update
Roadway Capital Improvements Plan
Serv Reference Project Length No. of T'fare Lane Pct. in Peak Hour Volume VMT Supply VMT Supply VMT Supply VMT Demand Excess CIP VMT
Area CIP No. Roadway From To Status (mi) Lanes Type Plan Type Capacity Serv. Area A B Total A Dir Pk Dir B Dir Pk Dir Pk Hr Total Pk Hr Total VMT Capacity Deficiency
1 2 Ovilla Rd*** US 287 New Road A (S. of Oregon ) New 0.42 4 DA A-2 625 100% 430 45 475 528 528 1056 201 855 0
1 3 Marshall Rd IH 35 Patrick Rd New 0.94 4 DA B 625 100% 0 0 0 1172 1172 2343 0 2343 0
Sub-total SA 1 0.42 475 3399 201 3199 0
2 6 Grove Creek Ext US 77 New Road B (W. of Brookstone) New 0.69 4 DA B 625 100% 0 0 0 859 859 1717 0 1717 0
2 7 New Road B Grove Creek Ext Brown Rd (FM 813) New 1.20 4 DA C-1 625 100% 0 0 0 1505 1505 3010 0 3010 0
2/5 8 Brown Rd (FM 813)*** Brown Rd (FM 813) Brown Rd (FM 813) New 0.68 4 DA C-1 625 50% 0 148 148 0 850 850 101 749 0
2 E New Road E US 77 New Road B New 0.14 4 DA C-1 625 100% 0 0 0 169 169 338 0 338 0
Sub-total SA 2 2.71 148 5915 101 5814 0
3 9 Ovilla Rd*** US 287 Mid-Project New 0.47 4 DA B 625 100% 92 49 141 590 590 1180 67 1114 0
3 10 Ovilla Rd*** Mid-Project Bus 287 New 0.80 4 DA B 625 100% 0 0 0 1003 1003 2007 0 2007 0
3 4 New Indian Rd Bus. 287 US 287 New 0.83 4 DA C-1 625 100% 0 0 0 1035 1035 2071 0 2071 0
3 5 New Friar Ln Ovilla Rd (FM 664) Indian Rd New 0.79 2 UC D-2 500 100% 0 0 0 394 394 788 0 788 0
Sub-total SA 3 1.27 141 6046 67 5979 0
4 11 John Arden US 287 Solon New 0.83 4 DA C-1 625 100% 116 116 232 1037 1037 2074 192 1882 0
4 12 Northgate Existing Stadium Dr. Recoup. 0.11 2 UC D-2 500 100% 160 161 321 57 57 113 36 77 0
4 13 Stadium Dr. Stadium Dr. US 287 Recoup. 0.26 2 UC D-2 500 100% 125 103 228 129 129 258 59 199 0
4 14 Indian Extension Brown US 287 New 0.39 2 UC D-3 500 100% 0 0 0 194 194 388 0 388 0
4 15 River Oaks/Marvin Connection Farley Marvin Ave. New 0.60 2 UC D-3 500 100% 0 0 0 300 300 599 0 599 0
Sub-total SA 4 2.79 781 3433 288 3146 0
5/2 8 Brown Rd (FM 813) *** Brown Rd (FM 813) Brown Rd (FM 813) New 0.68 4 DA C-1 625 50% 204 0 204 850 850 1700 139 1561 0
5 16 Broadhead US 287 April Lane Recoup. 1.06 4 DA C-1 625 100% 332 167 499 1328 1328 2657 530 2127 0
5 B Garden Valley Park Place Blvd. Brown Rd (FM 813) New 0.69 4 UC D-4 500 100% 0 0 0 693 693 1385 0 1385 0
Sub-total SA 5 2.44 703 5742 669 5073 0
6 17 New Road C - Segment 1 US 77 Howard New 0.71 4 DA C-1 625 100% 0 0 0 887 887 1773 0 1773 0
6 19 Parks School Main/Bus 287 US 287 New 0.93 4 DA C-1 625 100% 86 49 135 1160 1160 2321 125 2195 0
Sub-total SA 6 1.64 135 4094 125 3969 0
7 20 New Road D US 287 Park School House New 0.52 4 DA A-2 625 100% 0 0 0 644 644 1288 0 1288 0
Sub-total SA 7 0.52 135 1288 0 1288 0
Totals: 10.04 2,383 29,917 1,450 28,467 0
Notes:
DA- Divided arterial R - Recoupment project
DC- Divided collector N - New Project
UC- Undivided collector
File: WAX15352Dallas T:\dbase\Wax Dbase C-FINAL.xlsx
F. Roadway Improvements Plan Cost Analysis
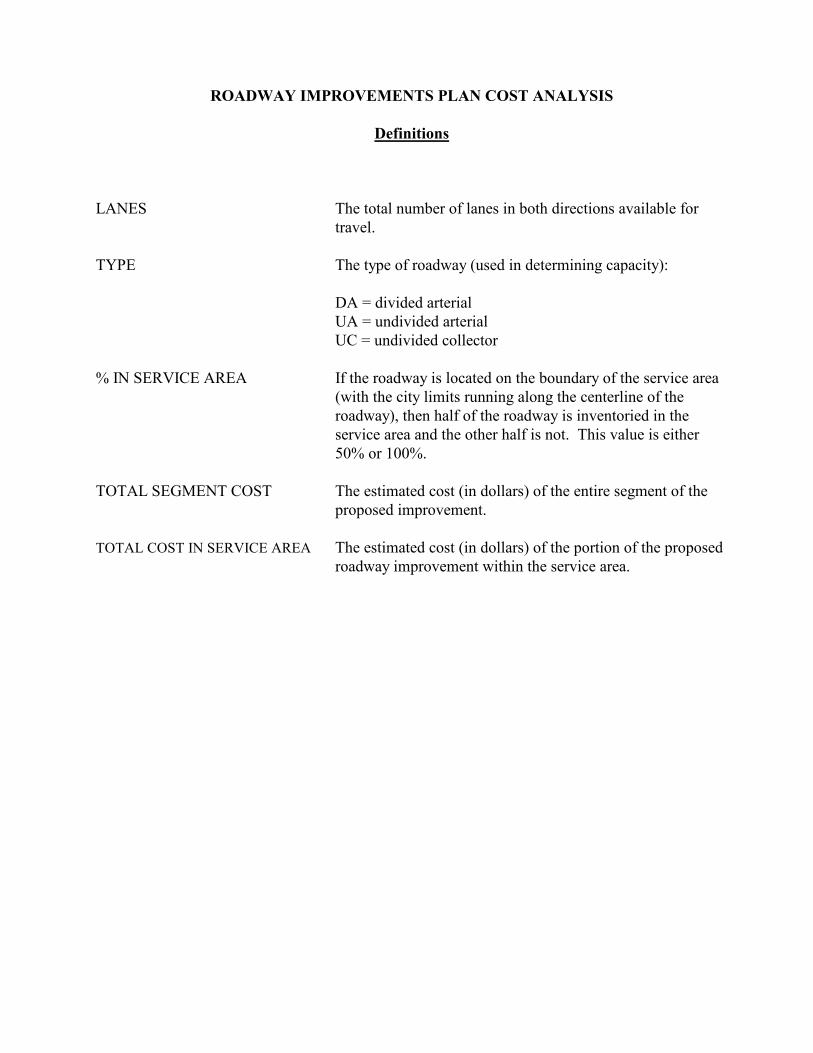
ROADWAY IMPROVEMENTS PLAN COST ANALYSIS
Definitions
LANES The total number of lanes in both directions available for
travel.
TYPE The type of roadway (used in determining capacity):
DA = divided arterial
UA = undivided arterial
UC = undivided collector
% IN SERVICE AREA If the roadway is located on the boundary of the service area
(with the city limits running along the centerline of the
roadway), then half of the roadway is inventoried in the
service area and the other half is not. This value is either
50% or 100%.
TOTAL SEGMENT COST The estimated cost (in dollars) of the entire segment of the
proposed improvement.
TOTAL COST IN SERVICE AREA The estimated cost (in dollars) of the portion of the proposed
roadway improvement within the service area.
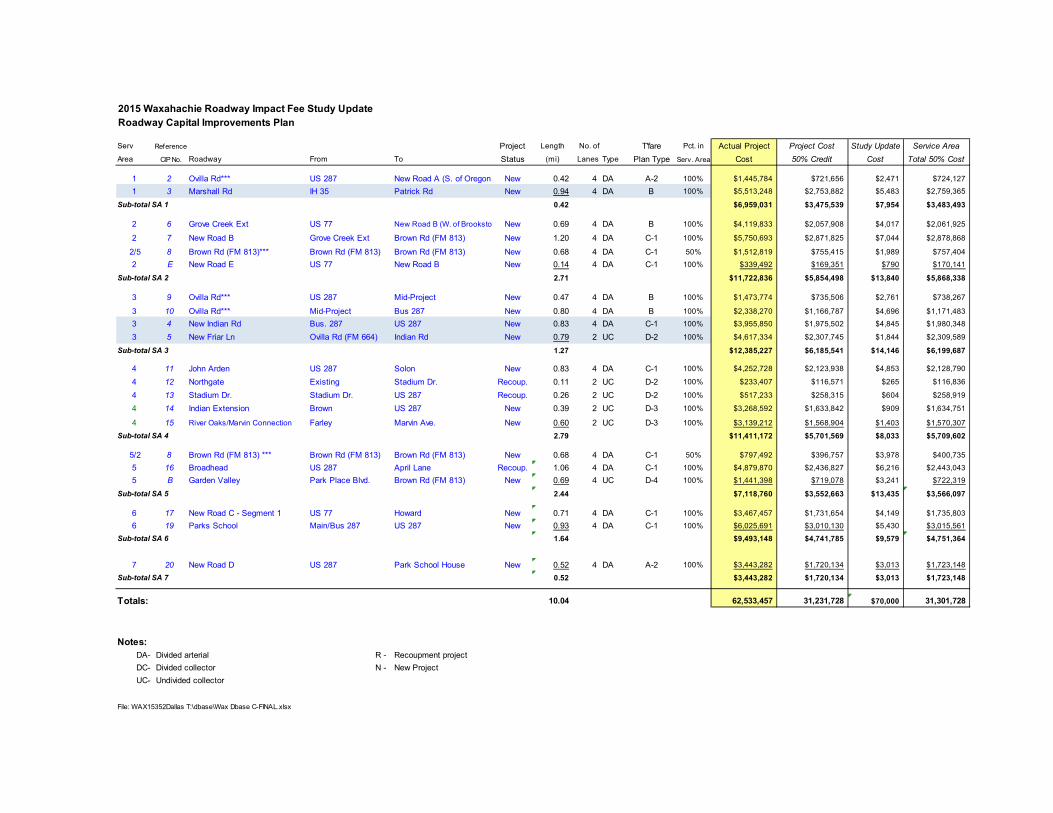
2015 Waxahachie Roadway Impact Fee Study Update
Roadway Capital Improvements Plan
Serv Reference Project Length No. of T'fare Pct. in Actual Project Project Cost Study Update Service Area
Area CIP No. Roadway From To Status (mi) Lanes Type Plan Type Serv. Area Cost 50% Credit Cost Total 50% Cost0.5
1 2 Ovilla Rd*** US 287 New Road A (S. of Oregon ) New 0.42 4 DA A-2 100% $1,445,784 $721,656 $2,471 $724,127
1 3 Marshall Rd IH 35 Patrick Rd New 0.94 4 DA B 100% $5,513,248 $2,753,882 $5,483 $2,759,365
Sub-total SA 1 0.42 $6,959,031 $3,475,539 $7,954 $3,483,493
2 6 Grove Creek Ext US 77 New Road B (W. of Brookstone) New 0.69 4 DA B 100% $4,119,833 $2,057,908 $4,017 $2,061,925
2 7 New Road B Grove Creek Ext Brown Rd (FM 813) New 1.20 4 DA C-1 100% $5,750,693 $2,871,825 $7,044 $2,878,868
2/5 8 Brown Rd (FM 813)*** Brown Rd (FM 813) Brown Rd (FM 813) New 0.68 4 DA C-1 50% $1,512,819 $755,415 $1,989 $757,404
2 E New Road E US 77 New Road B New 0.14 4 DA C-1 100% $339,492 $169,351 $790 $170,141
Sub-total SA 2 2.71 $11,722,836 $5,854,498 $13,840 $5,868,338
3 9 Ovilla Rd*** US 287 Mid-Project New 0.47 4 DA B 100% $1,473,774 $735,506 $2,761 $738,267
3 10 Ovilla Rd*** Mid-Project Bus 287 New 0.80 4 DA B 100% $2,338,270 $1,166,787 $4,696 $1,171,483
3 4 New Indian Rd Bus. 287 US 287 New 0.83 4 DA C-1 100% $3,955,850 $1,975,502 $4,845 $1,980,348
3 5 New Friar Ln Ovilla Rd (FM 664) Indian Rd New 0.79 2 UC D-2 100% $4,617,334 $2,307,745 $1,844 $2,309,589
Sub-total SA 3 1.27 $12,385,227 $6,185,541 $14,146 $6,199,687
4 11 John Arden US 287 Solon New 0.83 4 DA C-1 100% $4,252,728 $2,123,938 $4,853 $2,128,790
4 12 Northgate Existing Stadium Dr. Recoup. 0.11 2 UC D-2 100% $233,407 $116,571 $265 $116,836
4 13 Stadium Dr. Stadium Dr. US 287 Recoup. 0.26 2 UC D-2 100% $517,233 $258,315 $604 $258,919
4 14 Indian Extension Brown US 287 New 0.39 2 UC D-3 100% $3,268,592 $1,633,842 $909 $1,634,751
4 15 River Oaks/Marvin Connection Farley Marvin Ave. New 0.60 2 UC D-3 100% $3,139,212 $1,568,904 $1,403 $1,570,307
Sub-total SA 4 2.79 $11,411,172 $5,701,569 $8,033 $5,709,602
5/2 8 Brown Rd (FM 813) *** Brown Rd (FM 813) Brown Rd (FM 813) New 0.68 4 DA C-1 50% $797,492 $396,757 $3,978 $400,735
5 16 Broadhead US 287 April Lane Recoup. 1.06 4 DA C-1 100% $4,879,870 $2,436,827 $6,216 $2,443,043
5 B Garden Valley Park Place Blvd. Brown Rd (FM 813) New 0.69 4 UC D-4 100% $1,441,398 $719,078 $3,241 $722,319
Sub-total SA 5 2.44 $7,118,760 $3,552,663 $13,435 $3,566,097
6 17 New Road C - Segment 1 US 77 Howard New 0.71 4 DA C-1 100% $3,467,457 $1,731,654 $4,149 $1,735,803
6 19 Parks School Main/Bus 287 US 287 New 0.93 4 DA C-1 100% $6,025,691 $3,010,130 $5,430 $3,015,561
Sub-total SA 6 1.64 $9,493,148 $4,741,785 $9,579 $4,751,364
7 20 New Road D US 287 Park School House New 0.52 4 DA A-2 100% $3,443,282 $1,720,134 $3,013 $1,723,148
Sub-total SA 7 0.52 $3,443,282 $1,720,134 $3,013 $1,723,148
Totals: 10.04 62,533,457 31,231,728 $70,000 31,301,728
Notes:
DA- Divided arterial R - Recoupment project
DC- Divided collector N - New Project
UC- Undivided collector
File: WAX15352Dallas T:\dbase\Wax Dbase C-FINAL.xlsx
G. Service Area Analysis Summary
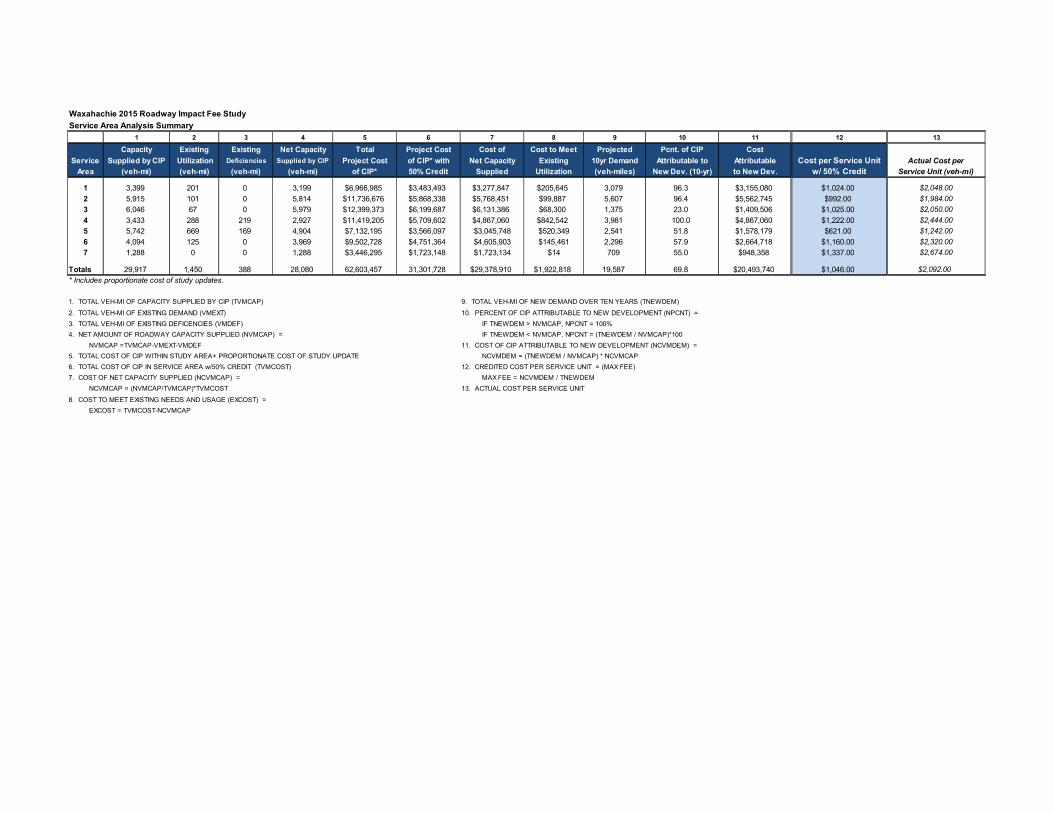
Waxahachie 2015 Roadway Impact Fee Study
Service Area Analysis Summary
1 2 3 4 5 6 7 8 9 10 11 12 13
Capacity Existing Existing Net Capacity Total Project Cost Cost of Cost to Meet Projected Pcnt. of CIP Cost
Service Supplied by CIP Utilization Deficiencies Supplied by CIP Project Cost of CIP* with Net Capacity Existing 10yr Demand Attributable to Attributable Cost per Service Unit Actual Cost per
Area (veh-mi) (veh-mi) (veh-mi) (veh-mi) of CIP* 50% Credit Supplied Utilization (veh-miles) New Dev. (10-yr) to New Dev. w/ 50% Credit Service Unit (veh-mi)
1 3,399 201 0 3,199 $6,966,985 $3,483,493 $3,277,847 $205,645 3,079 96.3 $3,155,080 $1,024.00 $2,048.00
2 5,915 101 0 5,814 $11,736,676 $5,868,338 $5,768,451 $99,887 5,607 96.4 $5,562,745 $992.00 $1,984.00
3 6,046 67 0 5,979 $12,399,373 $6,199,687 $6,131,386 $68,300 1,375 23.0 $1,409,506 $1,025.00 $2,050.00
4 3,433 288 219 2,927 $11,419,205 $5,709,602 $4,867,060 $842,542 3,981 100.0 $4,867,060 $1,222.00 $2,444.00
5 5,742 669 169 4,904 $7,132,195 $3,566,097 $3,045,748 $520,349 2,541 51.8 $1,578,179 $621.00 $1,242.00
6 4,094 125 0 3,969 $9,502,728 $4,751,364 $4,605,903 $145,461 2,296 57.9 $2,664,718 $1,160.00 $2,320.00
7 1,288 0 0 1,288 $3,446,295 $1,723,148 $1,723,134 $14 709 55.0 $948,358 $1,337.00 $2,674.00
Totals 29,917 1,450 388 28,080 62,603,457 31,301,728 $29,378,910 $1,922,818 19,587 69.8 $20,493,740 $1,046.00 $2,092.00
* Includes proportionate cost of study updates.
1. TOTAL VEH-MI OF CAPACITY SUPPLIED BY CIP (TVMCAP) 9. TOTAL VEH-MI OF NEW DEMAND OVER TEN YEARS (TNEWDEM)
2. TOTAL VEH-MI OF EXISTING DEMAND (VMEXT) 10. PERCENT OF CIP ATTRIBUTABLE TO NEW DEVELOPMENT (NPCNT) =
3. TOTAL VEH-MI OF EXISTING DEFICENCIES (VMDEF) IF TNEWDEM > NVMCAP, NPCNT = 100%
4. NET AMOUNT OF ROADWAY CAPACITY SUPPLIED (NVMCAP) = IF TNEWDEM < NVMCAP, NPCNT = (TNEWDEM / NVMCAP)*100
NVMCAP =TVMCAP-VMEXT-VMDEF 11. COST OF CIP ATTRIBUTABLE TO NEW DEVELOPMENT (NCVMDEM) =
5. TOTAL COST OF CIP WITHIN STUDY AREA+ PROPORTIONATE COST OF STUDY UPDATE NCVMDEM = (TNEWDEM / NVMCAP) * NCVMCAP
6. TOTAL COST OF CIP IN SERVICE AREA w/50% CREDIT (TVMCOST) 12. CREDITED COST PER SERVICE UNIT = (MAX FEE)
7. COST OF NET CAPACITY SUPPLIED (NCVMCAP) = MAX FEE = NCVMDEM / TNEWDEM
NCVMCAP = (NVMCAP/TVMCAP)*TVMCOST 13. ACTUAL COST PER SERVICE UNIT
8. COST TO MEET EXISTING NEEDS AND USAGE (EXCOST) =
EXCOST = TVMCOST-NCVMCAP