table of contents - texas tech...
TRANSCRIPT


1
Table of Contents Executive Summary .............................................................................2
Accounting Analysis.......................................................................... 4 Ratio Analysis Forecast Financials...................................................... 5 Analysis Evaluations ......................................................................... 6
Overview of ADM and the Industry .....................................................8 Five Forces Model ............................................................................ 9 Rivalry Among Existing Firms ............................................................ 10 Threat of New Entrants .................................................................... 14 Threat of Substitute Products............................................................ 15 Bargaining Power of Buyers .............................................................. 17 Bargaining Power of Suppliers........................................................... 18 Characterization of Industry.............................................................. 18 Key Success Factors ......................................................................... 19 Competitive Advantage Analysis ........................................................ 22
Accounting Analysis.............................................................................26 Key Accounting Policies .................................................................... 26 ADM Pension Benefits....................................................................... 28 Accounting Flexibility........................................................................ 30 Evaluating Accounting Strategy ......................................................... 32 Quality of Disclosure ........................................................................ 33 Core Expense Manipulation Diagnostics.............................................. 39 Sales of Manipulation Diagnostics ...................................................... 39 Potential “Red Flags”........................................................................ 43 Fixing Accounting Distortions ............................................................ 44
Ratio Analysis Forecast Financials .......................................................45 Ratio Analysis .................................................................................. 45 Profitability Analysis ......................................................................... 54 Capital Structure Analysis ................................................................. 62 Extended Ratio Analysis.................................................................... 66 SGR and IGR Analysis....................................................................... 76 Forecasting...................................................................................... 77
Analysis of Valuations..........................................................................80 Valuation Models.............................................................................. 80 Methods of Comparables .................................................................. 81 Cost of Capital ................................................................................. 86 Intrinsic Valuation Models ................................................................. 88 Altman Z-Score ................................................................................ 95
Appendix..............................................................................................97 Works Cited………………………………………………………………………...114

2
Executive Summary Archer Daniels Midland Investment Recommendation: Over-valued, Sell 11/1/2006
ADM- NYSE $36.61 EPS Forecast 52 Week Range $23.37 - $46.71 2006(A) 2007E 2008E 2009E Revenue (2006) $37.4 Bil. EPS $2.32 $1.56 $1.69 $1.84 Market Capitalization $22.89 Bil. Shares Outstanding 657,250,000 Method of Comparables ADM Industry Trailing P/E 15.25 15.14 Dividend Yield 1.10% Forward P/E 18.30 24.77 3-month Avg Daily Trading Volume 5,365,840 PEG 91.76 73.07
Percent Institutional Ownership 68% P/B 1.13 1.11 P/S 0.66 1.14
Enterprise value to EBITDA 11.94 19.82 Enterprise value to Recurring NOPAT 19.38 15.74
Book Value Per Share (mrq) $15.656 Valuation Estimates ROE 13.38% ROA 6.17% Actual Current Price $36.61 Estimated 5-yr EPS Growth Rate Ratio Based Valuations Cost of Capital Est. R^2 Beta Ke P/E Trailing $24.30 Ke Estimated 9.53% P/E Forward $49.57 10-year .1777 .8846 9.53% PEG Forward $29.15
7-year .1771 .8830 10.22%
P/B $35.84 P/S $63.75 Enterprise value to EBITDA $69.49 Enterprise value to Recurring NOPAT $36.98
5-year .1746 .8754 9.28% 1-year .1728 .8732 9.53% Published .97 Intrinsic Based Valuations Discounted Dividends $7.25 Kd 5.8% Free Cash Flows ($1.46) WACC 7.78% Residual Income $14.71 Abnormal Earnings Growth $17.04 Altman Z-score 3.853 Long-Run Residual Income Perpetuity $26.46
3
Archer Daniels Midland Company is one of the largest agricultural processors in
the world. They take crops and process them to make food ingredients and
renewable fuels. ADM has manufacturing facilities all over world, and has its
headquarters located in Decatur, Illinois. It was founded in 1902, and is one of
the oldest agricultural processors around. ADM’s competitors include Bunge
Limited, Cargill Incorporated, and ConAgra Foods Inc. The threat of new
competitors is low in this industry due to several factors including large capital
investments and the fact that there are few sellers and buyer, so the entrant of a
new firm would over populate the supply. Being that this industry is an oligopoly
in nature, this business leaves a relatively low amount of competitors but a high
amount of competition.
There are a few of ADM’s product that could be under the threat of substitution.
One of those products is the high fructose corn syrup, which has been
discovered to be a leading cause in the American battle with obesity, which
results in Type II diabetes. Because of its negative affects on the human body,
the use of high fructose corn syrup could decrease while the use of sugar could
increase. The other product under threat of substitution is corn-ethanol. There
is shortage a corn, resulting in researchers looking for alternative ways to
produce ethanol.
Customers in the commodity industry have the bargaining power because they
are the ones that are able to shop around and find who they would like to
purchase from. ADM has managed to be a cost leader due to its vertical
integration system they have set up. Cost leadership is crucial and is valued as a
long term advantage in maintaining customer loyalty and repeat customers.
Companies in this industry have no real potential for pure growth, so it is
important for them to have a strong customer base, which is a key success

4
factor for this industry. Another factor is being able to maintain economies of
scope, which ADM is able to do by making such large orders and keeping the
cost per unit down. It is also key for ADM to understand all the sectors of it
company to maintain specialization as a competitive advantage. This falls under
the key success factors of economies of scale and delegation of managerial
responsibilities.
Accounting Analysis
When evaluating ADM’s key accounting policies, it was important to take into
account its key success factors. ADM had several major accounting factors that
were included in its 10-K. In a commodity industry, it is important for ADM to
have derivatives and futures to set off the risk due to unpredictable weather,
planting, changes in global demand, and many other risks. Some other key
accounting policies include ADM’s employee benefit plans and pension plans,
which are good tools to give its employees motivation to do a good quality job.
Because ADM is capital intensive and has many assets that contribute to its
production, a major accounting policy for ADM to focus on is its asset write-
downs and asset abandonment.
ADM is believed to follow conservative accounting policies while preparing its
financial statements in conformity with generally accepted accounting principles
(GAAP). The quality of a firm’s disclosure on its financial statements helps an
analyst understand the business and gives a sense of transparency. ADM’s 10-K
however, did a poor job of separating the company base, though much of the
specific information is disclosed regarding the industry. Sector information is
available, but no information is disclosed about specific assets or location of
operations. Overall, ADM did not nothing special to its 10-K to make it as a
guide for investors.

5
By running ADM’s sales and expense ratios, we were able to evaluate any
potential “red flags” found in its 10-K. There was only one ratio that showed
some strange results, which was the expense diagnostic of cash flow from
operations over operating income in year 2004. After some research into ADM’s
10-K we noticed that ADM had an unusually large write off that year which
depressed its cash flow from operations. Therefore, ADM had no unusual
accounting distortions.
Ratio Analysis and Forecast Financials
By analyzing ADM’s ratios that examined its liquidity and operating efficiency,
profitability, and capital structure we were able to get a better understanding of
where it stands within the agricultural processing industry, compared to
competitors. By evaluating ADM’s liquidity and operating efficiency ratios, they
showed that ADM appeared to be growing more liquid overtime, while
experiencing a decrease in its operating efficiency. The fact that ADM is losing
operating efficiency is a sign that they may lose a competitive advantage in the
foreseeable future. As for the profitability ratios, they all improve in ADM’s favor
almost every year. This illustrates management’s ability to focus and maintain
constantly increasing levels of profitability each year. When evaluating ADM’s
capital structure, we were concerned by the debt service margin, which went
through some significant changes due to volatile fluctuations in cash flows from
operations.
There are extended ratios that help get an even better understanding of how
ADM is doing and what its future may hold, which include recurring NOPAT
margin, EBITDA margin, net long-term asset turnover, PP&E turnover, operating
cash flow ratio, and dividend payout ratio. All of the ratios seemed to be in favor
of ADM, except the recurring NOPAT margin, EBITDA margin, and the operating
cash flow ratio. The recurring NOPAT margin seems be low due to the hedging

6
contracts that ADM has and the volatility of commodity prices. It has been
experiencing exceptional gains, but still leaves doubt if they can maintain them.
The decline of ADM’s EBITDA margin is believed to be a direct result of the
slowing economy, but also shows that management was ineffective in combating
the slowing growth despite its dominate market position. The last ratio that
concerned us was the operating cash flow ratio which was way too erratic for a
company of this maturity. The erratic ness was due to both the operating cash
flows and the current maturities of long term debt, which is hoped to not
manifest into the future. Overall, the future of ADM seems promising with a few
issues that it should work to improve.
Analysis Evaluations
Determining whether the stock price of ADM is undervalued, fairly valued, or
overvalued can be done through several methods. Not all the methods we used
to evaluate ADM are equally reliable, so we had to go through the methods and
decide whether they were accurate or not. One of the methods that we believed
was accurate for ADM was the price to book ratio. This method gave us a stock
price of $35.84, compared with the observed stock price of $36.61, to result in a
fairly valued evaluation. Another method that we believed to be fairly accurate
was the enterprise value to recurring NOPAT margin. The estimated price of
$36.98 is the closest to the observed share price of $36.61 out of any model that
we have used due to the fact that it more accurately reflect companies that are
heavily based in fixed assets, such as ADM. Even though these methods were
believed to be the most accurate out of the method of comparables ratios, we
still do not rely on them because ADM is considered to be an overvalued
company, not fairly valued as stated in the outcome of these two ratios.
For the rest of our intrinsic value models, it was necessary for us to find the cost
of equity, cost of debt, and the weighted average cost of capital. We then

7
carried on to the Discounted Dividend Model, Free Cash Flows Model, Residual
Income Model, Abnormal Earnings Growth Model, and the Long Run Residual
Income Perpetuity Model. Again, not all of these models were believed to be
accurate. We found the Long-run Residual Income Perpetuity to be our most
accurate model, with the Residual income and Abnormal Earnings Growth Models
close behind, which all resulted in overvalued estimations. Overall, we believe
that ADM should be valued lower than the observed market price of $36.61 with
a sell opportunity due to this prevalent theme across most of our intrinsic
valuation models.

8
Overview of ADM and the Industry
Archer Daniels Midland Company is one of the largest agricultural processors in
the world. It serves as one of the most important links between farmers and
consumers. ADM takes inputs and processes them to make food ingredients,
renewable fuels, and naturally derived alternatives to industrial chemicals.
Archer Daniels Midland was founded in 1902 and incorporated in 1923. ADM’s
headquarters are in Decatur, Illinois and they operate processing and
manufacturing facilities across the United States and worldwide. ADM’s
competitors include Bunge Limited, Cargill Incorporated, and ConAgra Foods Inc.
(ADMworld.com).
0
10
20
30
40
2001 2002 2003 2004 2005 2006
ADM's Total Sales (in billions)
Sales
ADM is an S&P 500 company, which gives them a valued weighted index where
they make up 2.8 % of the total S&P 500 according to share price. ADM’s sales
volume has continued to increase in the past five years ending in 2001 with 19.5
billion dollars and currently at 36.4 billion dollars. Sales grew from 2001 to 2004,
excessively from 19 billion to 36 billion then in 2005 going down to 35 billion, yet
pulling it up to its current sales of 36 billion. This gives ADM an annual growth
percentage of about 28%. Not only are they a continuously growing company,
they are the current leader in the market against its direct competitors, Bunge
Ltd., Cargill Incorporated (privately held), and ConAgra Foods Inc. With a 25

9
billion dollar market capitalization, ADM is 13 billion dollars larger than ConAgra
Foods Inc., its closest competitor. For the overall food industry, ADM is ranked
fourth of the top eight, trailing behind Unilever NV, who leads the industry, by 44
billion dollars. This puts ADM as a strong leader in the market. ADM does trail by
44 billion dollars to Unilever NV; however, ADM’s stock price is over 14 dollars
higher and they have 2 million more shares in volume. ADM asset value has
gone from 14.3 billion in 2001 to 21.3 billion in 3rd quarter of 2006. Since ADM is
growing and leading the industry, it is investing more, expanding, and increasing
its inventory. The company’s ability to lead the industry has increased its stock
from roughly 12 dollars in April of 2001 to its current closing price of 38 dollars,
with only one split of 105/100 in August 2001(MorningStar.com). ADM is a
diverse company that produces a variety of food ingredients including corn syrup,
specialty flowers, cocoa, and sweeteners. ADM also produces products such as
ethanol, fertilizer, and common household products. Because ADM has such a
wide variety of products they compete in numerous markets, including consumer
food industry, farm product industry, and bio-diesel industry (ADMworld.com).
Five Forces Model
Rivalry among
existing firms
Threat of New
Entrants
Threat of
Substitute
Products
Bargaining
Power of
Buyers
Bargaining
Power of
Suppliers
High Low Average Low Low
The Five Forces Model shows us in great detail the opportunities that face firms,
in a particular industry. In an attempt to analyze the profitability of industry,
there are several important areas to consider. Breaking down the analysis of an
industry into five forces allows specific attention to be given to any area in which
abnormal profits are able to be made. The degree of competition among
existing firms determines the strength of any particular company in relation to its

10
competitors. The availability of new entrants into an industry shows potential for
profit maximization or the converse, long term losses. Substitution of a
company’s product is always a concern that needs to be analyzed in order to
determine future profitability of a company. A company’s ability to negotiate
prices and terms with suppliers, as well as customers, is essential to the long
term success of a business. Analysts need to be aware of the threats and
opportunities that face any company in regards to its industry.
Rivalry Among Existing Firms
Company Market Share (In Billions)
ADM 22.89
BG 8.38
CAG Privately Held
Industry 19.30
Industry Growth
Potential growth is an important aspect to consider within an industry. The
ability of a company to take advantage of growth opportunities can broaden
market share and boost earnings. In the commodity processing industry,
chances for growth are few but strong. Rising demand for an ever expanding
global marketplace, as well as overpopulated countries give rise to levels of
demand scarce seen in history. Furthermore, the diversity of such commodities,
such as corn, is being pushed to the limits with developments in corn ethanol,
bio-diesel, and even plastics. The chances for growth within the industry are as
limitless as a company’s imagination when considering all of the innovation and
emerging markets for agricultural processors. The few companies that are in the
commodities industry make this industry a high concentrated market because the

11
potential for growth within the industry is rising especially with ethanol
production.
Concentration
Agricultural processing is an oligopoly industry in which ADM is the largest public
corporation. ADM’s other main competitors include Bunge Ltd. and Cargill
Incorporated. Although ADM is the largest publicly traded company in the
American agricultural sector, the second largest privately held company in the
United States, Cargill Incorporated, sits at the top. Even though Cargill’s revenue
almost doubles ADM’s revenue, ADM by far has the largest market cap among
the publicly traded firms. There are several other food manufacturing firms such
as ConAgra Foods Inc., Kraft Foods Inc., and Unilever that contribute only small
portions of their firms to agricultural processing (finance.yahoo.com). These
firms compose the majority of the rest of the industry. In conclusion, ADM is
one of the largest companies in a highly concentrated industry.
Differentiation and Switching Costs
Differentiation is a helpful strategy for a company to use in order to remain
ahead of the competition that can increase profits. Differentiation includes
offering products and services that the competition does not. Since the
agricultural processing industry is highly dependent on commodity goods,
differentiation is extremely low. Even when considering industrial outputs, the
end product is still in natural a commodity. Because of this, ADM and its
competitors focus on controlling and lowering price levels. In addition to having
commodity goods as raw materials, the industry also produces commodity goods.
Knowing that it is common that ADM’s products are easily substituted by
competitor’s products, ADM has low switching costs in regards to its customers.
Even though ADM spends time innovating within the industry, special attention

12
must be given to the readiness of its customers to switch to a different company
for their supplies. Given the commodity nature of both the inputs and outputs
for agriculturally processing firms, switching costs remain high and need to be
given special attention or else customer base will be lost. In conclusion, with
these factors in mind ADM is positioning itself to set the pace for its competitors
being a high concentrated market.
Fixed-Variable Costs
To become a price leader in the industry, one must reduce the variable cost as
much as possible, and ADM puts a great deal of effort into finding ways to keep
variable costs low. Therefore, the high fixed to variable cost ratio in this market
forces firms to sell high quantities of products at lower costs to turn higher
profits. Processing plants, joint elevators, elevators, and warehouses make up
the bulk of ADM’s fixed cost. Alone, fixed costs for the company are high, but
massive production provides for a low fixed cost per unit. Also, the massive
production and processing per plant makes for a low variable cost per unit.
ADM’s competitors in this field take full advantage of their size and ability to
produce in bulk helping make most players in this industry focus on low costs to
maintain profits.
Excess Capacity
Excess capacity is the result of high inventories, which can burden a company
with unnecessary costs (Palepu 2-3). Excess capacity is not a major concern to
ADM. In the agricultural processing industry, creating enough demand is not a
problem. The ingredients produced by ADM and its competitors are so widely
used, demand is higher than what the industry is capable to produce. This is in
part due to the fact that the industry relies heavily on crop production and the
farmers’ ability to grow enough to keep up with demand. Excess capacity rarely
13
is an issue for companies in this field, but if such an occasion does arise, a
system of checks and balances are in place to prevent it from adversely affecting
the company. Storage, such as grain silos, and the ability to open up to new
markets oversees helps to quickly diminish any excess the company might
experience. If or when there is excess capacity in the industry, smaller firms
suffer and die out, not the major firms like ADM. Since ADM has a high degree
of bargaining power with customers, excess capacity does not hinder company’s
ability to sell its products due to a variety of distribution options.
Exit Barriers
Exit barriers can keep a suffering firm in an industry because it is more
expensive to leave. Exit barriers leave the option of “bad eggs” to be chosen in
an area where they are suffering. In the agricultural processing industry, exit
barriers are relatively low for smaller firms but increasingly become higher the
larger the firm. Smaller or dying firms are easily taken over by larger firms in
the industry. Furthermore, less is invested in the fixed assets of a smaller
company, making it easier for a company to sell off everything and leave that
particular field. Larger firms can expand by taking over or buying out firms
wanting out of the industry. Contracts, relationships with farmers, and other
partnerships built over several decades by large companies, such as ADM, make
exit barriers higher for those firms. Legal contracts that exist go years into the
future, which ADM has to satisfy whether or not it is still in that field. It is
difficult for other companies to take the market share over when a large
company attempts to exit the industry, because of the relationships and
company identification established by the larger companies. Overall, exit barriers
are relatively high, but for the few exceptions of the smaller firms, adding to the
degree of commitment needed for any serious competitor.

14
Threat of New Entrants
A new business entering into the agricultural industry is not very likely. Since
Archer Daniels Midland has been in the agricultural business since 1902, it has a
first mover advantage. This first mover advantage is easily illustrated by the
expansion of ADM into other countries, or perhaps into fields still in
development, such as ethanol. ADM is vertically integrated with 240 processing
plants, and is now a global company. The degree of vertical integration varies
from ADM’s own transportation services, to bring in its raw materials, to the
plants that actually refine the final products, and trucks to ship those goods out.
ADM was the innovator of two different types of technologies, the separation
technology and fermentation. Separation technology involves rendering raw
materials, such as corn, into a variety of different products, for food and
industrial uses. An example of fermentation is turning corn into ethanol, lactic
acids, or other products. Also, ADM pioneered the development of textured soy
protein.
The agricultural business industry has developed into an oligonomy, meaning
there are few sellers and buyers. These few players dominate the industry and
collectively change the rules. The industry’s largest producers settled to fix
prices and fix market share. Because of this, a company trying to enter the
lysine industry would lead to an overproduction of lysine, and this would yield
below normal profits. New entrants would be driven out quickly. The large
companies are constantly looking for disruptive new companies, attempting to
enter the industry. Because entering the industry is very difficult, innovators
tend to have two choices; get bought out by a larger company, or get destroyed
by the rival companies that steal the innovative ideas. Many new and smaller
businesses try to establish a new idea, knowing that large companies have a
difficult time doing this, and then will simply cash out of the industry. Other

15
companies use what is called the boutique approach and never get big enough
to attract the large companies’ attention.
A large capital investment also tends to be a problem for potential entrants into
the industry. For example, entry into the corn syrup industry is difficult because
the construction of a corn wet milling facility generally takes more than two
years to complete. These two years, or more, is from the time the site is
selected to the production of commercial quantities. For a company to build a
plant at the same level as ADM, it would have to invest more than $150 million.
An amount of money most businesses do not have. There are also high technical
and knowledge barriers. Research and development barriers become a sunk cost
for new entrants, since technology is not freely available.
Finally, there are numerous regulations in the agriculture industry. For a
company that is wishing to produce ethanol, it must abide by the Renewable
Fuels Association’s regulations. This association promotes policies, regulations,
and research and development initiatives that will lead to an increase in ethanol
production. To receive the permits and regulatory requirements, a company
could wait up to a year to be processed. There are also tight environment
regulations. To stay in compliance with the environment regulations, a company
has to have the most recent technology that is the most environmentally safe,
which tends to be the most expensive. (ADMworld.com)
Threat of Substitute Products
Substitute Products are products and services that are interchangeable
depending on factors such as the state of the economy, income level, and wants
and needs of the consumers. Substitute products have the potential to
undermine a company’s profitability and overall growth potential. (Palepu 2-4)
High fructose corn syrup is used as a sweetener for items such as jellies, baked

16
goods, canned food, dairy products, and beverages including soft drinks. The
reason for using a high fructose corn syrup in these items is because it is
cheaper than sugar, due to the impact of sugar tariffs. The corn syrup has a
long shelf life, and a liquid is easier to transport and blend into the product. Due
to the make up of high fructose corn syrup, honey would be a good substitute
because it is another product that is a mixture of different types of sugars, small
amount of compounds, and water. High fructose corn syrup and honey have a
similar fructose and glucose ratio.
With high fructose corn syrup consumption on the rise in America for the past 30
years, scientists and nutritionists have been studying the effects of it to the
human body. It has been discovered that high fructose corn syrup is one of the
leading causes of obesity, which results in Type II Diabetes. Numerous lab tests
show that a diet high in high fructose corn syrup leads to copper deficiencies in
growing bodies, which can result in the swelling of vital organs, including the
heart and liver. With this new knowledge about high fructose corn syrup, the
consumption of sugar could increase.
Another product that is under the threat of a substitute is corn-ethanol. The rise
of corn-ethanol is resulting in a shortage of corn. Farmers can only produce so
much corn at a time before it becomes too damaging to the land. Because ADM
is a global company, the shortage of corn has put a strain on not only the
farmers but also management decision within ADM. Archer Daniels Midland has
to choose whether to produce corn-ethanol or use the corn as a food product.
Due to the shortage, researchers have been looking into different ways to
produce ethanol. Brazil now produces ethanol made from sugar cane. The
sugar-based ethanol has a 30% lower production costs than corn-ethanol.
Critics state that the reason it is cheaper is because sugar is cheaper in Brazil
than it is in the United States. But since there is only so much corn that can be
produced at a time, the price of corn is increasing. Because of this, oil and

17
gasoline companies are looking for alternative ways to receive ethanol.
Therefore, due to a rising threat of substitute products entering into the industry,
ADM needs to focus on what works best for the end user. (ADMworld.com)
Bargaining Power of Buyers
Bargaining power of buyers is the ability to influence prices when there are
numerous competitors offering many substitutes. (Palepu 2-5) This is an
important factor for ADM considering the emphasis that it placed on lowering
cost to entice and keep their customers. Archer Daniels Midland is one of the
world leaders in oilseed production. ADM is also the world’s largest corn
processing company. Not only does ADM have a majority of market share in
these fields, but they also are a cost leader due to the vertical integration of its
business structure. Despite the fact that ADM has three major components that
contribute to the bottom line, all of these components can be analyzed as one
since all of these segments are commodities. ADM is able to undercut most
competitors on price to maintain customers, which are mainly in the food
processing business, but also include fertilizers. Since ADM is dealing in a
commodity business, cost leadership is crucial and is valued as a long term
advantage in maintaining customer loyalty and repeat customers. In a
commodity related field, the customer is usually the one who can shop around
for the lowest price, giving the customer an advantage over the supplier. With
the vertical integration system ADM has set up, it will continue to be a cost
leader in this sector for the foreseeable future. Even though the customer has
most of the bargaining power in the commodity field, ADM is positioned well due
to its cost leadership.

18
Bargaining Power of Suppliers
When an organization has few suppliers to choose from and there are high
switching costs, the supplier has power over the organization. When suppliers
have power over the buyers, the organization has fewer options on how to
increase revenue. (Palepu 2-5) However, in any commodity related business the
supplier has little room to vary its price. Because there are numerous suppliers
within the agricultural industry, suppliers are forced to be inflexible. Due to
marketing equilibrium, if one farmer increases the price of a product, the farmer
will lose all buyers because there are other farmers Archer Daniels Midland can
buy from. This is strength for ADM because ADM remains in control of the
prices. The suppliers are not bound to ADM’s bargaining power, but rather
economic conditions that will not allow for any extraordinary profit gain. This
simple principle illustrates ADM’s ability to search for the lowest price among its
suppliers. Regardless of ADM’s market leadership, any bargaining power
regarding suppliers falls in ADM’s favor.
Characterization of Industry
Overall the agricultural processing and refinement industry has a dominant
advantage in cost leadership. In addition, the industry shows signs of having
advantage in differentiation. Since this is a commodity based industry cost
leadership might be the only way to achieve superior performance (Palepu 2-7).
There are many ways to achieve cost leadership, including economies of scale
and scope, economies of learning, efficient production, and lower input costs
(Palepu 2-8).
Economies scale is when average cost declines with increase in output. This can
be accomplished by companies within the industry producing mass quantities for
consumers. An economy of scope is achieved when average total costs are

19
lowered due to a rise in the amount of different items being produced. When
companies within the agricultural processing industry introduce different items
into their production lines, such as bio-diesel or ethanol, this can achieve an
economy of scope. An economy of learning is when there is a decrease in
average cost arising from accumulating experience.
Efficient production is an individual measurement of how effective a company
can produce its product. This can be accomplished by decreasing wasted time,
wasted materials, and work in progress. In the agricultural processing industry,
lower input costs are achieved by establishing sound relationships with suppliers,
in this case farmers.
Differentiation in the industry is shown by investments made in research and
development. For example, the research teams are developing new ways to
derive food and chemicals from renewable resources in order to continue to
produce animal feed products.
With these factors in mind, we believe the agricultural industry is predominately
a cost leader and shows a possible sign of differentiation. It is important to
understand the characterization of the industry because it gives a benchmark of
the valuation of individual firms within the industry.
Key Success Factors
Defining key success factors enable a company to understand how it can better
develop for future performance. This gives investors an advantage in deciding
which companies to endow. The key success factors play an important role in
maintaining a competitive edge and supplier relations.
Bargaining Power

20
The presence of bargaining power usually arises from an established industry
with reputable companies. Bargaining power gives a company the competitive
advantage because of the relationships between suppliers and buyers. Due to
the long established field of agricultural refinement, the market is satiated with
firms struggling to compete for customer base. This leaves no room for pure
growth in the industry, but rather a struggle to steal customers from
competitors. Thus the relationship between companies and their suppliers, as
well as customers, is essential to the overall success of a firm. Long established
companies have a competitive edge in this regard due to their partnerships and
relationships with clients built over years of experience. Without bargaining
power, firms have no chance of success and will be smothered within this highly
competitive industry.
Cost leadership in Commodity Field
Cost leadership requires a company to be the lowest cost producer, while
continuing to produce a higher quality product. In order to be successful within
this industry, a company must find ways to keep cost at a minimum. (Palepu 2-
7) One way is by avoiding unnecessary cost. This can be completed by being
knowledgeable about the production, as well as being skilled in the
manufacturing process. Vertical integration and finding lower cost materials are
additional ways to lower production costs. Cost leadership has the ability to
target broad markets. Failure to be a cost leader in a commodity market can
result in continual loss of customers and ultimately profits.
Economies of Scale
An economy of scale occurs when a company has the ability to lower the cost
per unit when it increases the amount of production. A result of this marginal

21
profit increases per additional unit of production. This is possible because a
company can buy and produce materials in mass as well as maintain a high level
of efficient production. The company also is able to improve efficiency since
large productions of similar items require specialized and expensive equipment
that can efficiently allocate and utilize its resources. When a company
successfully improves efficiency using resources, they have the ability to control
cost of production.
Economy of Scope
An economy of scope is achieved when average total cost are lowered due to a
rise in the amount of different items being produced. A company must
understand the industry it belongs to, so it will not loose focus. A company that
chooses to market a particular product has a competitive advantage when it
understands the customers the product will be marketed to. Specialization of a
company can help it to maintain focus in a highly diversified market such as the
agricultural processing industry. A company remains competitive when it
understands that company objectives must be specialized, and the company is
willing to adapt to these specialties to better satisfy its clients.
Delegation of Managerial Responsibilities
Delegating managerial responsibilities empowers management to make decisions
and organize goals. By delegating the right task to the correct person, multiple
tasks can be completed efficiently and in a timely manner. Because this industry
is dominated by only a few companies that are large, firms must rely upon their
management staff to make regional and sector specific decisions. Without doing
so, companies in this field run the risk of not being efficient in each of the
echelons of the refining process. Remaining competitive in cost is essential in

22
commodity fields, and efficient managerial programs are necessary in attaining
that goal.
In conclusion, it’s important for a company to address these factors when
determining how it can better compete against competitors within the industry.
These factors make-up what companies in the commodity industry
Competitive Advantage Analysis
The agricultural processing industry consists of few major companies, therefore
making this a competitive cost leadership industry. As previously discussed, to
achieve competitive advantage ADM must learn to be efficient in the factors that
make up the industry.
ADM Key Success Factors
Bargaining
Power
Cost
Leadership
Economies of
Scale
Economies of
Scope
Delegation of
Management
Fair Excellent Excellent Good Good
Bargaining Power
Bargaining power, a company’s ability to control prices among buyers and
sellers, is an essential factor for an industry dominated by commodities since it is
one of the few ways to truly minimize costs while optimizing profit. ADM is an
agricultural food processing company, however; they focus on maintaining a
strong relationship between farmers and consumers. Therefore, its partnership
with farmers has become essential to ADM’s overall market. ADM fully utilizes
this partnership through hedging contracts, futures, and options. While ADM’s
top competitor Cargill Inc. focuses mainly on relationships with its customers and

23
the effect their products have on them. ADM is restricted to bargaining with its
customers mainly because of price competition and market sensitivity to product
substitution. For example, some of ADM’s goods are commodity in nature, such
as corn syrup, which leads to an inability to negotiate on price. Furthermore,
substitutions threaten ADM’s product line in areas such as corn ethanol, where
sugar ethanol could be an easy replacement. ADM spends most of their time
and effort enhancing their relationship with their suppliers rather than
customers. This gives ADM a power of bargaining because with their superior
supplier relationship, they are able to get products at a lower cost without
expending significant resources into customer relations. Having the power of
bargaining gives ADM a competitive advantage over their competitors with
regards to inputs; however, we believe ADM’s lack of sufficient customer
bargaining power can be considered a weakness.
Cost Leadership in Commodity Field
Cost leadership is a crucial success driver in any commodity industry since it is
one of few areas where any true profit can be squeezed out of markets defined
by undifferentiated products. By implementing vertical integration ADM cuts out
any unnecessary costs, such as a middle man. The fact that ADM owns its own
transportation routes helps mitigate any excess costs or volatility in pricing due
to recent fuel concerns and fluctuations in the trucking industry. With ADM
being located all over the world, it is important for them to be able to minimize
their costs when they are distributing their products. The fact that they are able
to lower costs of transportation, allows them to gain cost leadership by being
able to produce more all over the world at a lower cost per unit. “Flexibility,
efficiency, reliability, and quality”, are four words ADM uses to describe their
transportation system. They currently own and operate 20,500 railcars, 2,300
tractor trailers, 2,100 barges, 30 tow boats, and 29 line boats. (ADMworld.com)
With such extensive focus on lowering costs through transportation and vertical

24
integration ADM has become a cost leader giving them higher profits and more
market share than competitors.
Economies of Scale
ADM is able to reduce fixed cost by large scale production, known as economies
of scale, which provides them a competitive advantage. They possess
manufacturing, distribution, and sales facilities located in 40 different states of
the US, in Canada, Africa, Europe, Asia, and Latin America.
(www.admworld.com) By being located all over the world, ADM has the
capabilities to process its products in massive quantities. Cost per unit is
lowered by spreading fixed costs across a larger product base. For instance, they
have 137 processing plants in the United States, giving ADM the resources to
increase its total production. Overall, ADM’s sheer size and processing clout,
lowers its total operating costs allowing them to be price competitive within the
industry.
Economy of Scope
Economy of scope is the ability to focus on a particular field without spreading a
company too thin across other markets, causing them to lose profits. Maintaining
ADM’s core competencies by focusing on agricultural processing, the company
continues to be a contender due to its ability to consistently innovate. This stays
consistent with their mission statement, “To unlock the potential of nature to
improve the quality of life”. (ADMworld.com) ADM is able to consistently
compete with its new products because they know a great deal about the
industry, in which they are one of the prime leaders. With ADM’s wide range of
products, they have been able to develop unique products such as corn based
ethanol within the corn processing industry. ADM has become the leader in
production of the renewable fuels called ethanol and bio-diesel. This is one of

25
the many ways that ADM proves to be focused in the industry, but still expand
into other areas of the corn processing market. With much investment in
research and development, in areas such as corn ethanol, and the creation of
these innovative products, the company is able to have a competitive advantage
with economies of scope.
Delegation of Managerial Responsibilities
Similar to the economies of scope, mangers need to be specialized in the field
they are overseeing. It is extremely important for the management staff of ADM
to be able to make regional and sector specific decisions. Just last year, ADM
underwent some major management changes, switching current managers to
different managing positions. ADM seems to be efficient in delegating
managerial responsibilities by having numerous managers for every aspect of the
company. They are very specific as to what each manager is responsible for; for
example, some management titles consist of Vice President with responsibilities
for global cocoa business, Vice President with responsibilities for compensation
and benefits, and Vice President with responsibilities for global oilseed
businesses. With such highly specialized managers, ADM is able to quickly react
and adapt to any problem that may incur within the company. By separating the
responsibilities throughout the company, ADM is able to carry a competitive
advantage by having each of its managers highly skilled in the responsibilities
they oversee.

26
Accounting Analysis
Key Accounting Policies
Accounting analysis is vital for a firm in order to evaluate its current financial
position and forecast its future performance, which will allow the firm and
investors to be aware of what is expected from the company in the future.
When performing an accounting analysis, there are several key steps to follow in
order to evaluate the firm’s accounting quality. First, is identifying key
accounting policies. When identifying key accounting policies, it is important to
take into account its key success factors and evaluate if ADM supports them in
its accounting policies and uses them as critical value drivers. As previously
discussed, ADM is able to be a cost leader due to the fact that it is vertically
integrated. This allows ADM to produce globally at a relatively lower cost per
unit. Many estimates are made when preparing the financial statements which
involve knowledge of historical and current facts in order to make decisions for
its position in the future. For example, because ADM owns its own
transportation, it must make estimates such as the amount of depreciation.
Therefore, it is important for ADM to be able to make educated estimates to
ensure that its financial statements will be properly stated.
Inventories and derivatives are considered a key success factor and a critical
accounting policy because ADM is able to pay fixed prices through its futures and
options contracts which set off many risks of the business. Some of ADM’s
agricultural inventories consist of “forward fixed-price purchase and sale
contracts and exchange-traded futures and options contracts that are valued at
an estimated market value” (ADM’s 10-K). Using exchange-quoted prices that
are adjusted for local market differences is how ADM estimates the market value.
In the statement of earnings under cost of products sold, the changes in the

27
market value of inventories and contracts is documented. For the derivatives
contracts, which are an agreement for an asset at a future date for an agreed
upon price, ADM designates them as cash flow hedges. When these hedged
items are recognized, gains and losses from the transactions are recorded in
other comprehensive income, net of income taxes. (ADM’s 10-K) This is found in
the statement of earnings under the cost of product sold. It is important for
ADM to cover itself with futures contracts since they run a risk in its commodity
business due to unpredictable weather, planting, changes in global demand, and
many other risks.
Employee Benefit Plans
Another critical accounting policy is employee benefit plans, which ADM provides
for selected international locations and all employees in the United States. ADM
employee benefit plans consist of defined contribution plans and defined benefit
plans. The defined contribution plan is where companies agree to contribute
fixed amounts today to cover future benefits. This requires very little forecasting
to estimate their annual cost since the firm’s obligation is limited to its annual
obligation to contribute to the employees’ retirement plans. (Palepu 4-40)
Whereas defined benefit plans use estimates to forecast future benefit needs.
Roughly 79 percent of ADM’s pension plans are made of defined benefit plans.
(ADM’s 10-K)

28
ADM Pension Benefits
2004 2005 2006
Defined Benefits 88,521 105,955 114,417
Defined Contribution 23,622 25,046 26,616
As of June 30, 2006, ADM employed about 26,800 employees, which indicates
how many estimates have to be made in order to predict benefit plans required
to cover all of their employees. Many estimates are taken into consideration
when measuring the pension, postretirement health care, and life insurance
benefits, which consist of “interest rates used to discount certain liabilities, rates
of return on assets set aside to fund these plans, rates of compensation
increases, employee turnover rates, anticipated mortality rates, and anticipated
future health care costs” (ADM’s 10-K) The rate at which pensions are estimated
for future expenses is called the “discount rate.” The return on assets uses the
net profit margin and asset turnover ratio to ensure its assets are able to
continually contribute to the pension funds. With the help of third-party
specialist, ADM is able to estimate the expenses and funded condition for the
employee benefit plans. It is vital as a firm to have these incentives of benefits
for employees to give them something to want to work for and keep them loyal,
which will in effect produce efficient and high quality performance. Incorrect
measurements of these expenses could result in incorrect estimates in the future
that leave them financially unprepared to supply its employees with benefits, so
it is important that ADM is as certain as possible for the amounts it records in the
financial statements.
Since ADM’s business is extremely capital intensive with many assets involved all
over the world, it is key that they realize when it is time for asset abandonment

29
and write-downs to make sure they are able to conduct their production
efficiently. One of ADM’s key success factors is how ADM operates its own
transportation, and does not have to worry about the fuel concerns and
fluctuations in the trucking industry. This brings on the next critical accounting
policy which is asset abandonment and write-downs. ADM’s assets, such as
property, plant, and equipment, are monitored for impairment as they are being
depreciated. When the assets are no longer of use to the company, they can be
abandoned, use for something alternatively within the company, or sold in order
to recover the carrying value. Repairs are expensed as they are incurred. As for
depreciation, the straight line method is used for financial reporting and the
accelerated method is used for income tax purposes. ADM recorded a 61 million
dollar charge to cost of products sold related to abandonment and write-offs
which led to a nine million dollar loss in equity in earnings. It is important that
the estimates and depreciation ADM records on its financial statements are
correct because they affect several years in the future and could lead to
overstating or understating the value of ADM.
It is essential that ADM’s estimates are correct or close to correct measurements
when valuing these critical policies and all other accounting inputs, because
there are many penalties that could result if it appears that ADM is trying to
overestimate or underestimate its financial statements. There are many ways in
which firms can do this, which will be examined in future sections. Identifying
key accounting policies is just the beginning of the accounting analysis and it is a
way to see how ADM treats its key success factors on the accounting side and
see what its critical value drivers are. Once this is completed, analysts can
determine the amount of accounting flexibility within the company’s financial
statements.

30
Accounting Flexibility
Archer Daniels Midland prepares its financial statements in compliance with SEC
regulations as well as the generally accepted accounting principles (GAAP.)
While ADM must follow the basic guidelines, management does have the choice
to use an amount of flexibility to its advantage. An example of this flexibility is
how ADM chooses to disclose its estimations. The use of tax depreciation
estimates the asset lives, salvage values, and amortization rates. Assets are
likely to amortize more rapidly than justifiable, given the assets’ economic
usefulness, leading to long term asset understatements. (Palepu 4-13) Choices
such as whether a company wants to be conservative or aggressive with its
accounting can determine future revenues and expenses. Based on the choices
evident in ADM’s 10-K, we feel that ADM follows conservative accounting
policies. One of ADM’s key success factors, managerial delegation, gives the
managers the power to make decisions regarding which accounting policies to
disclose and which are kept private within the company. Since accountants are
naturally predisposed toward conservative accounting, ADM’s managers
delegated the responsibility for choosing whether or not to follow conservative
policies to its accounting department. We believe that ADM does not have a
sufficient reason to keep from disclosing most of its financial statements and see
this as a weakness within the company’s policies regarding conservatism.
Inventory, a key success factor through its variable cost, is valued at the
estimated market value. These estimates are made by management and are
based on the exchange-quoted price. If management changes inventory
methods or market value changes, it must be noted within the financial reports.
At this point in time, ADM is using the LIFO method for its inventory. This
means the last items put into inventory are taken out of inventory first. When
LIFO is used, cost of goods sold is higher, which results in a lower income and
lower retained earnings. However, LIFO lowers taxes, which raises income.

31
Businesses do not look as well off using LIFO as they would using FIFO, first
inventory in is the first inventory out, which lowers cost of goods sold, increasing
income. It should be noted however that ADM uses FIFO as well as a Market
Inventory system to account for its commodity inventories.
ADM records property, plant, and equipment at cost, which is a conservative
accounting method, mandated by GAAP. This is important to understand
because GAAP regulates how often firms are able to revalue the long term assets
to ensure the quality of accounting. While ADM uses the straight line
depreciation method for its financial reporting, it uses accelerated methods for
income tax purposes. Because of accounting flexibility, a company can have
separate “books” for financial reports and income tax purposes. For ADM,
management has decided to depreciate buildings for 10 to 50 years and
equipment for 3 to 30 years.
Goodwill is an intangible asset that’s innately hard to value but can most readily
be described as the amount paid in excess of market value, when acquiring
another company. If a company, like ADM does not revaluate Goodwill in the
balance sheet, the company could be inaccurately stating an important asset.
According to GAAP requirements, firms must revalue their goodwill accounts
annually. The flexibility regarding goodwill can manifest itself when managers
must mark down goodwill to market value. Managers can be tempted to
manipulate this data to show higher earnings in following periods. When looking
at ADM’s financial statements it seems to have accurately stated impairments,
acquisitions, and disposals correctly in the goodwill account. (ADM’s 10-K) The
fact that ADM accurately represents its goodwill in the financial statements gives
a sense of confidence that it is honestly representing the company’s true value.

32
Evaluating Accounting Strategy
Looking at ADM’s recent 10K that was filed in September of 2006, we notice that
ADM uses Last-in First-out (LIFO) to classify inventory. This means that in a
period of rising prices, this method yields a lower ending inventory, a higher cost
of goods sold, a lower gross profit (assuming constant price), and a lower
taxable income. ADM prepares its financial statements in conformity with
generally accepted accounting principles (GAAP). Following generally accepted
accounting principles requires management to make estimates and assumptions
that affect amounts reported on their financial statements (10-K). Based on
ADM’s past financial statements, they prove to have a conservative approach to
accounting due to the fact that ADM spends more time recognizing losses than
gains. ADM’s top competitors are Bunge Ltd, Cargill Inc., and ConAgra Foods
who all use similar accounting policies. Having competitors use similar
accounting policies sets everyone at a level playing field with accounting
strategies.
According to ADM’s 10-K report, it has had one fairly recent change in its
accounting policy. In March of 2005, the Financial Accounting Standards Board
(FASB) issued FIN 47, Accounting for Conditional Asset Retirement Obligations,
an interpretation of FASB statement No. 143. FIN 47 clarifies how to handle the
legal obligation to perform asset retirement activity. ADM adopted FIN 47 on July
1, 2005. The result of implementing FIN 47 was positive, giving ADM a $3
million increase in property, plant and equipment. Also, hedging is a means of
insuring a company’s inventory by countering any losses (gains) by providing
gains (losses) through setting future commodity prices. This is particularly useful
in a field with highly fluctuating commodity prices, such as ADM’s. After looking
at ADM’s accounting strategies, there appears to be no reason to raise questions
concerning the policies they put into practice. ADM’s strategies can be justified
for the type of commodity industry in which they operate.
33
Quality of Disclosure
The quality of a firm’s financial statements helps one to clearly see into the inner
workings of a business. A level of transparency is gained with high quality
disclosures that help analysts to truly understand a business down to every
detail. The ability to accurately understand a firm is crucial to estimating the
value of a firm.
Qualitative
The bulk of a company’s financial information is found in a company’s 10-K
annual report. This report should disclose everything that is needed to know
about the company from both a qualitative and quantitative viewpoint. ADM
does a poor job of disaggregating the company base, though much of the
specific information is disclosed regarding industry. Sector information is
available, but no information is disclosed about specific assets or location of
operations. Overall, ADM did not do anything to set their financial statements as
a guide for investors.
From a Qualitative standpoint, the information provided gave a general
impression of the company’s inner workings and departments. However, we feel
that specifics were lacking. ADM is reluctant to give any information that dealt
with particular regions of the business, leaving an overall feeling of
disappointment. What we want to see is information broken down
geographically. We would also like to see information regarding fixed assets.
Considering both of these factors are largely important to the operations of ADM,
we feel investors need to know more about these segments of the company.
The lack of some information and overall vagueness of the qualitative section
leaves investors vulnerable and confused when it comes to truly understanding

34
ADM. Overall, we give the qualitative section of ADM’s financial statement a fair
rating; it seems the company only gives the required information for a 10-K
when there are clearly areas where ADM should go into further depth.
Quantitative
Quantitative information is rather direct, raw numbers expressing a company’s
performance. Quantitative information is just as important, if not more
important than qualitative sections. The numbers of a company can tell you its
history, its performance, its strategy; the numbers of a company can tell you as
much of a story as words themselves.
In the following section, we ran some ratios on ADM and two of its main
competitors. Cargill is also a main competitor, but since the company is privately
held, financial information gathering is all but impossible. Also Bunge Limited
has only been publicly traded over the past three years, so any previous
information not gathered is due to the same reason.
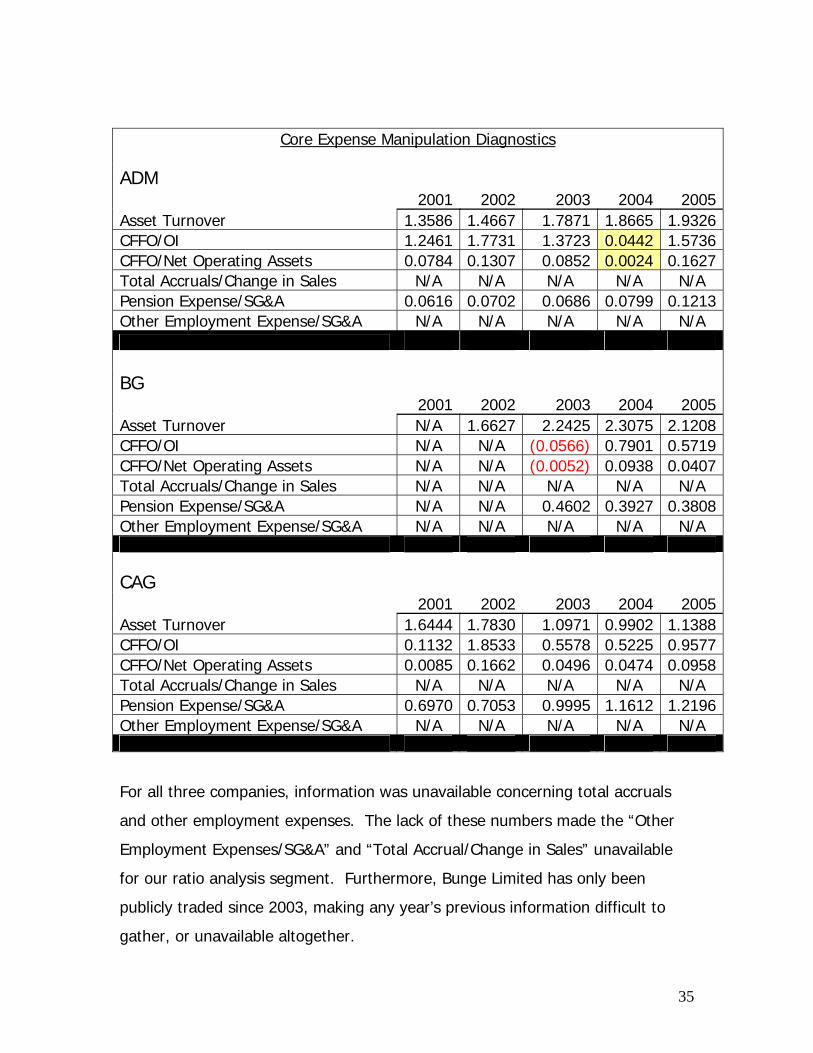
Core Expense Manipulation Diagnostics
The following information represents the core measurements of detecting
possible accounting irregularities regarding expenses. Since ADM is in a highly
cost competitive field, cost manipulations are key areas to investigate. There are
a few areas of concern regarding the financial information we ran these ratios on
that will be further discussed in a later section.
35
For all three companies, information was unavailable concerning total accruals
and other employment expenses. The lack of these numbers made the “Other
Employment Expenses/SG&A” and “Total Accrual/Change in Sales” unavailable
for our ratio analysis segment. Furthermore, Bunge Limited has only been
publicly traded since 2003, making any year’s previous information difficult to
gather, or unavailable altogether.
Core Expense Manipulation Diagnostics
ADM 2001 2002 2003 2004 2005Asset Turnover 1.3586 1.4667 1.7871 1.8665 1.9326 CFFO/OI 1.2461 1.7731 1.3723 0.0442 1.5736 CFFO/Net Operating Assets 0.0784 0.1307 0.0852 0.0024 0.1627 Total Accruals/Change in Sales N/A N/A N/A N/A N/A Pension Expense/SG&A 0.0616 0.0702 0.0686 0.0799 0.1213 Other Employment Expense/SG&A N/A N/A N/A N/A N/A BG 2001 2002 2003 2004 2005Asset Turnover N/A 1.6627 2.2425 2.3075 2.1208 CFFO/OI N/A N/A (0.0566) 0.7901 0.5719 CFFO/Net Operating Assets N/A N/A (0.0052) 0.0938 0.0407 Total Accruals/Change in Sales N/A N/A N/A N/A N/A Pension Expense/SG&A N/A N/A 0.4602 0.3927 0.3808 Other Employment Expense/SG&A N/A N/A N/A N/A N/A
CAG 2001 2002 2003 2004 2005Asset Turnover 1.6444 1.7830 1.0971 0.9902 1.1388 CFFO/OI 0.1132 1.8533 0.5578 0.5225 0.9577 CFFO/Net Operating Assets 0.0085 0.1662 0.0496 0.0474 0.0958Total Accruals/Change in Sales N/A N/A N/A N/A N/A Pension Expense/SG&A 0.6970 0.7053 0.9995 1.1612 1.2196 Other Employment Expense/SG&A N/A N/A N/A N/A N/A

36
Asset Turnover (Sales/Assets)
0.0000
0.5000
1.0000
1.5000
2.0000
2.5000
2001 2002 2003 2004 2005
ADMBGCAG
An asset diagnostic is crucial to the understanding of the capital intensive Archer
Daniels Midland. The steady growth rate is promising for ADM compared to its
more volatile competitors. This is a strong sign of reliability for ADM. The sale
of a division from CAG explains the extreme drop in 2003. Since BG is such a
small and growing company, its ratio is understandingly volatile in growth, but
appears to be leveling off.

37
Cash Flow from Operations/Operating Income
(0.5000)
0.0000
0.5000
1.0000
1.5000
2.0000
2001 2002 2003 2004 2005
ADMBGCAG
This particular ratio is alarming at first due to the varying ratio levels across the
board. For ADM, the severe drop in 2004 is directly related to a massive level of
inventory write-offs, which in turn reduced cash flows from operations
significantly. ADM takes considerable actions to hedge any inventory losses. For
the year 2004, ADM realized a gain of nine million dollars as a direct result of
their hedging activities, as well as a gain of 83 million dollars in “other
comprehensive income.” (www.Morningstar.com) According to ADM’s financials,
hedging activities can materialize in the “other comprehensive income section”.
The gain in hedging for 2004, considering an inventory loss, is a sign of good
hedging activities on part of the company. There was no correlation in 2004 to
such an extensive inventory write-off in competing firms.

38
CFFO/Net Operating Assets
(0.0250)
0.0000
0.0250
0.0500
0.0750
0.1000
0.1250
0.1500
0.1750
0.2000
2001 2002 2003 2004 2005
ADMBGCAG
As with the previous graph, the high degree of volatility illustrated in this ratio is
due to the drastic change in cash flows from operations. Net operating assets
themselves are not the volatile element in this ratio.

39
Pension Expense/SG&A Expense
0.0000
0.2000
0.4000
0.6000
0.8000
1.0000
1.2000
1.4000
2001 2002 2003 2004 2005
ADMBGCAG
The Pension Expense Ratio foreshadows a company’s ability to handle employee
costs in the future. The trend for this ratio is similar across the board; a raising
ratio in reference to pension expense is to be expected in today’s economy with
high concerns regarding retirement benefits and the uncertainty in that field.
The consistency of growth per company, and within the industry is within
reasonable expectations. The stability of this ratio is reassuring that ADM is
planning well in regards to pension expenses.
Sales Manipulation Diagnostics
Sales manipulation is something of a concern for most firms since managers are
typically tempted to inflate sales for the sake of self interest. Managers often
can gain bonuses directly related to sales. With this in mind we ran ratios of
ADM’s sales with respect to two of its competitors.
40
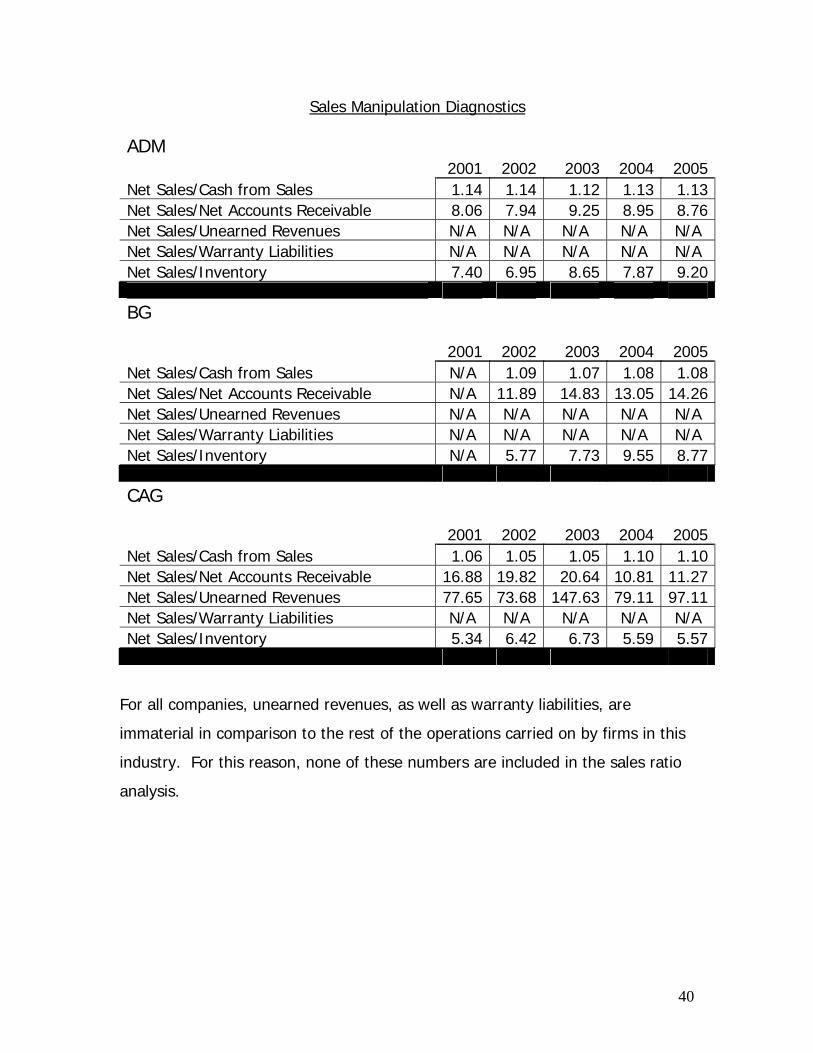
Sales Manipulation Diagnostics
ADM 2001 2002 2003 2004 2005Net Sales/Cash from Sales 1.14 1.14 1.12 1.13 1.13 Net Sales/Net Accounts Receivable 8.06 7.94 9.25 8.95 8.76 Net Sales/Unearned Revenues N/A N/A N/A N/A N/A Net Sales/Warranty Liabilities N/A N/A N/A N/A N/A Net Sales/Inventory 7.40 6.95 8.65 7.87 9.20
BG 2001 2002 2003 2004 2005Net Sales/Cash from Sales N/A 1.09 1.07 1.08 1.08 Net Sales/Net Accounts Receivable N/A 11.89 14.83 13.05 14.26 Net Sales/Unearned Revenues N/A N/A N/A N/A N/A Net Sales/Warranty Liabilities N/A N/A N/A N/A N/A Net Sales/Inventory N/A 5.77 7.73 9.55 8.77
CAG 2001 2002 2003 2004 2005Net Sales/Cash from Sales 1.06 1.05 1.05 1.10 1.10 Net Sales/Net Accounts Receivable 16.88 19.82 20.64 10.81 11.27 Net Sales/Unearned Revenues 77.65 73.68 147.63 79.11 97.11 Net Sales/Warranty Liabilities N/A N/A N/A N/A N/A Net Sales/Inventory 5.34 6.42 6.73 5.59 5.57
For all companies, unearned revenues, as well as warranty liabilities, are
immaterial in comparison to the rest of the operations carried on by firms in this
industry. For this reason, none of these numbers are included in the sales ratio
analysis.
41
Net Sales/Cash from Sales
1.00
1.05
1.10
1.15
1.20
2001 2002 2003 2004 2005
ADMBGCAG
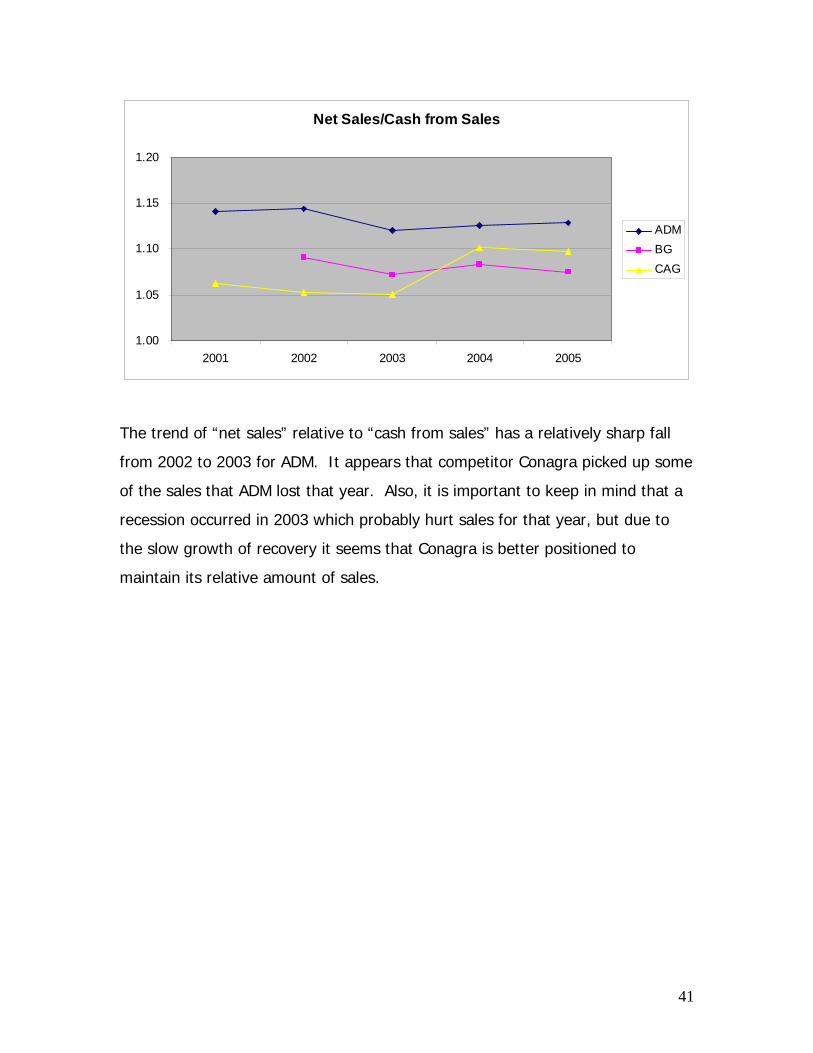
The trend of “net sales” relative to “cash from sales” has a relatively sharp fall
from 2002 to 2003 for ADM. It appears that competitor Conagra picked up some
of the sales that ADM lost that year. Also, it is important to keep in mind that a
recession occurred in 2003 which probably hurt sales for that year, but due to
the slow growth of recovery it seems that Conagra is better positioned to
maintain its relative amount of sales.

42
Net Sales/Net Accounts Receivable
0.00
5.00
10.00
15.00
20.00
25.00
2001 2002 2003 2004 2005
ADMBGCAG
ADM is very consistent in the field of accounts receivables, leaving little room for
suspicion. ADM seems to be steadier than its competitors in this area, although
it should be mentioned that the sale of one of Conagra’s divisions could explain
some of the distorted ratios in the period between 2003 and 2004. The
consistency of ADM’s ratio is reassuring to the reliability of the company’s
performance.

43
Net Sales/Inventory
0.00
2.00
4.00
6.00
8.00
10.00
12.00
2001 2002 2003 2004 2005
ADMBGCAG
Net Sales with respect to inventory is the most important sale ratio to look at for
ADM considering the company’s relatively large amount of fixed assets. There is
a cyclical pattern for ADM whereas Conagra and Bunge Limited seem to have
more volatile numbers. We feel this only reinforces ADM’s maturity in this field,
especially with respect to BG.
Potential “Red Flags”
When assessing companies’ financial statements, ratio analysis is a common tool
used to determine if any degree of accounting distortion is being used to mislead
the casual investor. Any accounting distortions that are discovered are
commonly referred to as “red flags”. These red flags alert company evaluators
that some deception may be occurring. It is crucial to find and asses red flags
whenever discovered as to prevent misleading investors for their protection.
After running sales and expense ratios on ADM financial statements going back
for the past five years, most of the ratios were in line with expectations.
However, when addressing the expense diagnostic of cash flow from operations

44
over operating income, some alarming numbers were found. The ratio itself was
extremely low in 2004 compared to the previous and following years. After some
initial investigation, it appears that CFFO was the number that was severely
depressed. Following up this discovery, the Cash Flow Statement disclosed an
unusually high inventory write off, 750 million dollars higher than the previous
year (ADM’s 10-K). Despite all of these alarming indicators, ADM managed to
hedge this loss with nearly 92 million dollars of revenue through contracts. At
first glance this gain seems minimal in comparison to the inventory write-off in
2004, but the hedging activities served their purpose by providing income in a
year of loss.
All of this leads us to believe that ADM has a team of experienced veterans in
control of hedging contracts for the firm. This is a highly valued asset in regards
to ADM’s industry and we view it as a strong competitive advantage and value
added for the firm.
Fixing Accounting Distortions
After investigation of ADM’s financial statements concerning the alarmingly low
CFFO in 2004, we found no indication of accounting distortions. At first glance
the numbers seem suspicious; however, after studying inventory management,
we found that this discrepancy was due to hedging contracts. In conclusion,
ADM’s financial statements seem accurate and true to form, adding another
degree of confidence regarding ADM’s business practices.

45
Ratio Analysis & Forecast Financials
Ratio Analysis
Profitability and growth are determining factors of the value of the firm. By
reviewing the ratios as well as forecasting the financial statements ten years in
the future, we can gain an understanding of ADM’s past financial performance,
as well as where the firm is going in the future. The ratios help examine the
firm’s liquidity & operating efficiency, profitability, and capital structure, as well
as give a better understanding of where ADM stands within the agricultural
processing industry, compared to competitors. Analyzing ADM, and the industry
in general, is important because it allows us to have a better understanding of
the information the company provides to see where the company has been, and
where the company is going relative to the industry.
Trend and Cross Sectional Analysis
The objective of a trend analysis is to make a reasonable forecast from the data
given by identifying any trends that exists. It is a tool to analyze not only the
firm, but also the overall industry. By revealing any trends that might be
occurring, we can begin to understand where the firm and industry will go.
During this trend analysis, we will review the past five years of financial
information for ADM and its competitors. Once the information is analyzed, it
will then be used to reasonably forecast information in future years. This
information will let us know if ADM is operating efficiently and effectively and
how it compares to its competitors and the overall industry.
Liquidity and Operating Efficiency Analysis Liquidity ratios attempt to measure the firm’s ability to repay its’ current liabilities
(Palepu 5). Liquidity is broken down into five separate ratios including: current
ratio, quick asset ratio, inventory turnover, receivable turnover and working

46
capital turnover. Current ratio and quick asset ratio show the firm’s liquidity
which is the cash equivalence of assets. Inventory turnover, receivables
turnover, and working capital turnover show the firm’s operating efficiency.
These liquidity ratios measure the firm’s ability to maintain sufficient cash
resources to cover current obligations.
Liquidity Analysis
2002 2003 2004 2005 2006 Current Ratio 1.59 1.64 1.53 1.81 1.92 Quick Asset Ratio 0.80 0.79 0.68 0.86 0.91 Accounts Rec. Turnover 9.36 9.25 8.95 8.76 8.18 Days Supply Receivables 39.01 39.47 40.80 41.66 44.59 Inventory Turnover 8.86 8.16 7.41 8.58 7.19 Days Supply Inventory 41.19 44.71 49.29 42.55 50.77 Working Capital Turnover 9.90 9.38 10.07 8.27 6.46
Overall, ADM seems to be growing more liquid over time, providing a greater
ease for which the company can pay off immediate liabilities and acquire future
loans. Furthermore, the operating efficiency of the company is failing in the
recent years shown in the decline of the efficiency ratios. Although ADM is able
to grow more liquid, we foresee the loss in efficiency as a negative reflection on
ADM’s competitive advantage.

47
2002 2003 2004 2005 2006 Current Ratio 1.59 1.64 1.53 1.81 1.92
Current Ratio
1.00
1.10
1.20
1.30
1.40
1.50
1.60
1.70
1.80
1.90
2.00
2002 2003 2004 2005 2006
ADMBGCAGIndustry
The current ratio is where you take your current assets and divide them by
current liabilities. This ratio shows how much money a company can convert to
cash within one year compared to money being paid in cash for debt and
business obligations. ADM’s current ratio had a slight increase from 2002 to
2003. In 2004 we saw a slight decrease of .11. In 2005 we saw an increase of
.18 that continues to steadily increase into 2006. Overall, from 2002 to 2006
ADM became more liquid in its ability to pay off its short term debt.
Compared to the industry, ADM has shown their ability to maintain a higher level
of assets to their liabilities changes year to year with the exception of a decrease
in liquidity in 2004. The industry has been steadily increasing in liquidity over
the past four years. After some short deviation from the industry in 2004 we

48
believe that ADM is not much different than the industry in terms of liquidity with
the exception of the most recent year 2006. This illustrates that ADM has been
improving, but only at par; however ADM’s breakaway from the industry average
is a promising sign of improvements to come.
2002 2003 2004 2005 2006Quick Asset Ratio 0.80 0.79 0.68 0.86 0.91
Quick Asset Ratio
0.00
0.10
0.20
0.30
0.40
0.50
0.60
0.70
0.80
0.90
1.00
2002 2003 2004 2005 2006
ADMBGCAGIndustry
The quick asset ratio is found by adding cash, securities, and accounts receivable
and dividing by current liabilities. The quick asset ratio shows us the amount of
assets we have immediately on hand for every dollar of current liabilities. In
2004 we saw a slight decrease of .11 that then increased by .18 in 2005 and
remained steady through 2006. For the most part, ADM’s quick asset ratio stays
relatively steady from 2002 to 2006 with the exception of the decline in 2004.
Overall, ADM slightly improves in liquidity through the years analyzed.
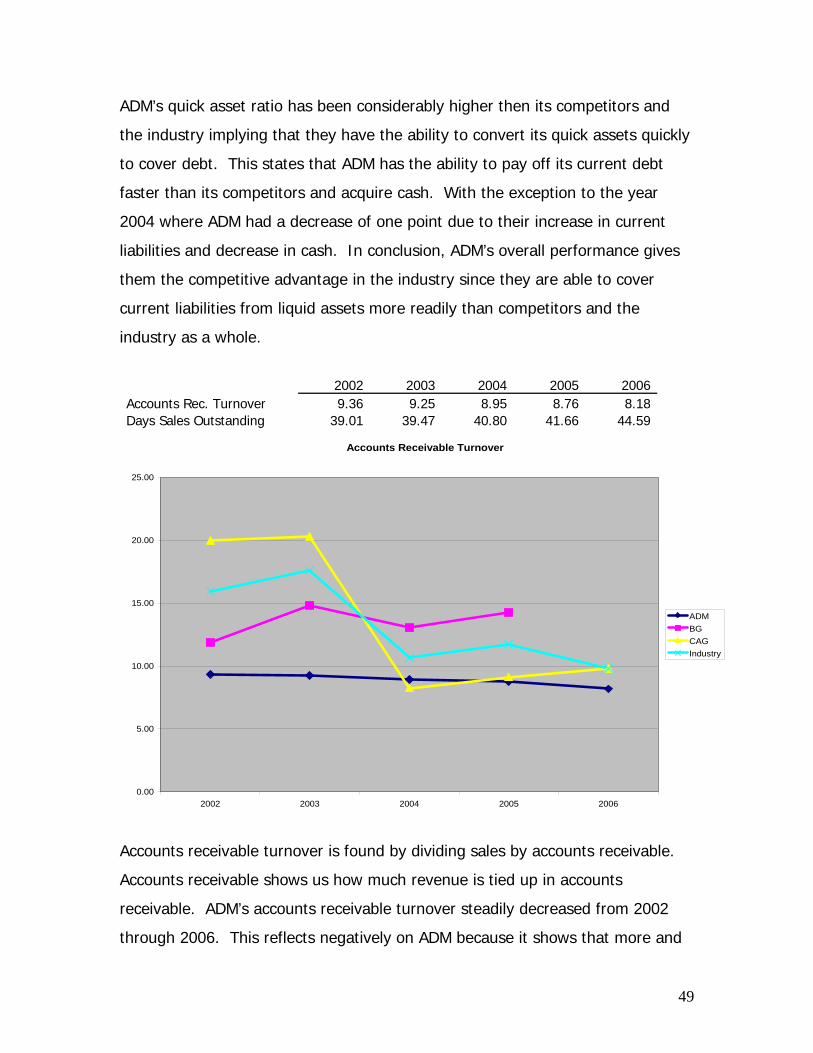
49
ADM’s quick asset ratio has been considerably higher then its competitors and
the industry implying that they have the ability to convert its quick assets quickly
to cover debt. This states that ADM has the ability to pay off its current debt
faster than its competitors and acquire cash. With the exception to the year
2004 where ADM had a decrease of one point due to their increase in current
liabilities and decrease in cash. In conclusion, ADM’s overall performance gives
them the competitive advantage in the industry since they are able to cover
current liabilities from liquid assets more readily than competitors and the
industry as a whole.
2002 2003 2004 2005 2006 Accounts Rec. Turnover 9.36 9.25 8.95 8.76 8.18 Days Sales Outstanding 39.01 39.47 40.80 41.66 44.59
Accounts Receivable Turnover
0.00
5.00
10.00
15.00
20.00
25.00
2002 2003 2004 2005 2006
ADMBGCAGIndustry
Accounts receivable turnover is found by dividing sales by accounts receivable.
Accounts receivable shows us how much revenue is tied up in accounts
receivable. ADM’s accounts receivable turnover steadily decreased from 2002
through 2006. This reflects negatively on ADM because it shows that more and

50
more money over time is being tied up in accounts receivable. This money tied
up in accounts receivable could be reinvested in company operations or used to
make more profit for the company through some other means rather than just
sitting in accounts receivable.
Days supply of receivables is found by dividing 365 by accounts receivable
turnover. Days supple of receivables tells us how long it takes for our
receivables to be acquired from customers. Unlike accounts receivable turnover,
days supply of receivables takes time into account. ADM’s days supply of
receivables steadily increases from 2002 to 2006. As for the same reasons
above, the longer it takes for ADM to collect accounts receivable the more lost
opportunity there is for reinvesting this money.
ADM’s ability to collect in accounts receivable has been consistent over the past
five years and is lower then their competitors and the industry average. This
shows their competitors are at an advantage since they are able to collect owed
money and reinvest it a faster rate then ADM. ADM needs to re-evaluate their
credit policies and methods of collecting accounts in order to increase their
turnover and compete with their competitors. In conclusion, for ADM to increase
its turns in collecting accounts receivables and become more competitive with
the industry they must make changes.

51
2002 2003 2004 2005 2006 Inventory Turnover 8.86 8.16 7.41 8.58 7.19 Days Supply Inventory 41.19 44.71 49.29 42.55 50.77
Inventory Turnover
0.00
1.00
2.00
3.00
4.00
5.00
6.00
7.00
8.00
9.00
10.00
2002 2003 2004 2005 2006
ADMBGCAGIndustry
Inventory turnover is found by dividing cost of goods sold by inventory.
Inventory turnover shows us how efficiently ADM is selling its inventory.
Efficiency is increased with a higher turnover. ADM’s inventory turnover steadily
decreases from 2002 to 2004. In 2005 there is an increase of 1.17 followed by a
decrease of 1.39. Taking out of account outliers (2005), ADM is becoming less
efficient in the management of its inventory.
Days supply of inventory is found by dividing 365 by the inventory turnover.
ADM’s days supply of inventory steadily increased from 2002 to 2004. In 2005
days supple of inventory decreased by 6.74 days followed by an increase in 2006
by 8.22 days. This means that 2002 was ADM’s most efficient year according to
days supply of inventory because inventory was being moved faster. ADM’s

52
inability to move inventory out at a more efficient rate is hurting their
profitability.
Inventory turnover gives you a look at how well ADM can turnover its inventory,
which creates sales and brings in cash. Looking at the chart you notice that
ADM’s has been leading the industry with a high inventory turnover rate
compared to its competitors with an exception of BG. in the year 2004. Even
with this exception ADM has continued to maintain significantly higher turns
above the industry average, showing that ADM is able to sale it’s products faster
and increasing ability to bring in cash. In the last two years ADM’s turn has
fluctuated down a little over a point; however ADM has maintained much higher
turns than its competitors and the industry average. ADM has had a competitive
advantage but is slowly losing their edge as their inventory is staying in house
longer.

53
2002 2003 2004 2005 2006 Working Capital Turnover 9.90 9.38 10.07 8.27 6.46
Working Capital Turnover
0.00
2.00
4.00
6.00
8.00
10.00
12.00
14.00
2002 2003 2004 2005 2006
ADMBGCAGIndustry
Working capital is found by dividing sales by the amount of current assets less
current liabilities. In 2005 we saw a decrease of 1.82 followed by another
decrease of 1.34 the following year in 2006. These decreases were due to the
fact that in 2005 and in 2006, ADM saw an increase in current liabilities. This
increase in liabilities is dragging down ADM’s efficiency at producing a profit.
An increase in sales and/or a decrease in current assets will cause this turnover
to increase. CAG experienced a decrease from 2002 to 2004 due to a decrease
in its sales. It was able to recover its sales from 2005 and forward, increasing its
working capital ratio. BG was able to stay stable over the years, only
experiencing a slight decrease in sales in 2005, causing its working capital ratio
to decrease. As for ADM, from years 2002 until 2004, it remained overall steady
with a slight decrease from years 2002 to 2003 as a result of an increase in
assets and a slight increase from years 2003 to 2004 due to an increase in sales.

54
From year 2004 and on, ADM slowly began decreasing due to a decrease in sales
and an increase in its assets. With ADM’s working capital decreasing, it shows
that they are not operating as efficiently as they once were, meaning its
investments in its operating capital are not paying off with its sales.
Profitability Analysis
Profitability ratios are used to measure the firm’s effectiveness in turning a profit.
Profitability is broken down into six separate ratios including: gross profit margin,
operating expense, net profit margin, asset productivity, return on assets and
rate of return on equity. Gross profit margin, operating expense ratio and net
profit margin show the firm’s operating efficiency. Asset productivity, return on
assets, and rate of return on equity show the firm’s profitability. Profitability
ratios measure the firm’s ability to operating efficiently while measuring
profitability.
Profitability Analysis
2002 2003 2004 2005 2006 Gross Profit Margin 7.45% 5.62% 5.94% 6.76% 8.10% Operating Expense Ratio 4.27% 3.57% 3.96% 2.55% 3.03% Net Profit Margin 2.26% 1.47% 1.37% 2.91% 3.59% Asset Turnover 1.58 1.79 1.87 1.93 1.72 Return on Assets 3.56% 2.63% 2.55% 5.62% 6.17% Return on Equity 8.07% 6.38% 6.43% 12.38% 13.38%
Overall, assessing ADM’s profitability, the ratios all improve in ADM’s favor almost
every year. This illustrates management’s ability to focus and maintain
constantly increasing levels of profitability each year.

55
2002 2003 2004 2005 2006 Gross Profit Margin 7.45% 5.62% 5.94% 6.76% 8.10%
Gross Profit Margin
0.00%
5.00%
10.00%
15.00%
20.00%
25.00%
30.00%
2002 2003 2004 2005 2006
ADMBGCAGIndustry
Gross profit margin is the amount that revenues exceed any direct costs that are
associated with sales. It is influenced by the price premium that a firm’s
products command in the market and the efficiency of the firm’s procurement
and production process. (Palepu 5-9). In 2003, ADM showed a decrease of
1.82%, which then increased steady through 2005. This decrease was due to
the fact that ADM’s sales increased by $8,096,139 from 2002 to 2003. AMD
then saw an increase in the gross profit margin of 1.34% in 2006 due to the fact
that ADM’s gross profit saw an increase of $534,475. Other than the decrease in
2003, ADM’s gross profit margin increased from 2002 to 2006. Despite an initial
decline, ADM was able to get back on track and increase its profitability in
remaining years, thus improving profitability.

56
Although ADM seems to have a steadily increasing gross profit margin, they fall
far behind its competitors and the industry as a whole. ConAgra and the
industry in general had a higher gross profit margin than ADM. At first ADM
seems to be improving in respect to profitability, but when the industry is taken
into account ADM seems to be performing poorly.
2002 2003 2004 2005 2006 Operating Expense Ratio 4.27% 3.57% 3.96% 2.55% 3.03%
Operating Expense Ratio
0.00%
2.00%
4.00%
6.00%
8.00%
10.00%
12.00%
14.00%
16.00%
18.00%
2002 2003 2004 2005 2006
ADMBGCAGIndustry
Operating expense ratios is found by dividing selling and administrative expenses
by sales. ADM’s operating expense ratio decreased from 2002 to 2006. In 2003
operating expense ratio decreased by 0.7% followed by a slight increase of
0.39% in 2004. In 2005 ADM saw a decrease of 0.59% followed by a slight
increase of 0.48% in 2006. This shows us that ADM seems to have a handle on
its operating expenses which is key in a cost leadership industry.

57
ADM’s operating expense ratio is significantly lower than the operating expense
ratio of the industry. Since ADM is operating at a lower expense ratio, this
shows that it is operating more efficiently than the industry in general. Because
ADM competes on price, rather than quality and differentiation, the research and
development costs are low. Managing overhead efficiently is important for a
company like ADM to keep cost low. While there have been dramatic changes in
ADM’s operating expense ratio from 2002 to 2005, overall it has been a steady
decrease. Overall, the industry, as well as ADM’s competitors, has increased its
operating expenses each year. This gives ADM a competitive advantage because
ADM, as opposed to its competitors, has the ability to produce more sales
without creating drastic increases in selling and administrative expenses.

58
2002 2003 2004 2005 2006 Net Profit Margin 2.26% 1.47% 1.37% 2.91% 3.59%
Net Profit Margin
0.00%
1.00%
2.00%
3.00%
4.00%
5.00%
6.00%
7.00%
8.00%
2002 2003 2004 2005 2006
ADMBGCAGIndustry
Net profit margin is found by dividing net income by sales. ADM’s net profit
margin steadily decreased from 2002 to 2004. In 2005, there was an increase of
1.54%. This increase was due to the fact that net income increased by
$516,675 from 2004 to 2005. In 2006, ADM saw a slight increase of 0.68%.
After the decrease in the first two years of analysis, ADM rebounds with a higher
degree of ability to retain profits for each dollar in sales made.
There have been large fluctuations in ADM’s net profit margin. In 2002 through
2005, ADM was significantly lower than the overall industry. The industry and
ADM’s competitors were not only selling more, but also producing more net
income from their sales through 2005. This is a disadvantage to ADM because it
is not receiving as high of a profit on its return on sales. This results in a low
operating efficiency for the firm, perhaps because ADM was unable to transfer its
cost of production to its customers through sales.

59
2002 2003 2004 2005 2006 Asset Turnover 1.58 1.79 1.87 1.93 1.72
Asset Turnover
0.00
0.50
1.00
1.50
2.00
2.50
2002 2003 2004 2005 2006
ADMBGCAGIndustry
Asset turnover measures the revenue productivity of resources employed by a
company, which is used in evaluating profitability. Asset turnover is found by
dividing sales by total assets. ADM’s asset turnover shows no significant change
and steadily increases from 2002 to 2005. In 2006, ADM has a decrease of .21.
Excluding the most recent year, ADM has had constant growth relative to its total
assets.
ADM has a consistently higher asset turnover than the overall industry. From
2002 to 2005, BG out performs ADM. This could be because BG is a smaller
company than ADM, so there are fewer assets to turnover within BG. Because
ADM has a higher asset turnover than the industry, it has a better utilization of
assets, than its competitors. Overall, ADM is operating at an effective asset

60
turnover rate. This is good for ADM because they are allowing their assets to
increase profitability compared to the industry.
2002 2003 2004 2005 2006 Return on Assets 3.56% 2.63% 2.55% 5.62% 6.17%
Return on Assets
0.00%
1.00%
2.00%
3.00%
4.00%
5.00%
6.00%
7.00%
2002 2003 2004 2005 2006
ADMBGCAGIndustry
The return on assets (ROA) is an important measure because it takes into
account profits and capital used to earn profits to show how much return a
company can produce for each dollar of assets invested (Palepu 5-6). Return on
assets is found by dividing net income by total assets. In 2002 to 2004 ADM’s
return on assets steadily decreased. In 2005 ADM saw a 3.07% increase. Until
recently ADM has not managed to create a sufficient return on the income
statement from its assets.
ADM seems to be inversely related to the performance of the industry. This
makes intuitive sense considering that ADM is directly competing with these

61
companies for sales. ADM is experiencing a strong return on its assets, in the
recent two years, which allows ADM to have a higher ROE.
2002 2003 2004 2005 2006 Return on Equity 8.07% 6.38% 6.43% 12.38% 13.38%
Return on Equity
0.00%
2.00%
4.00%
6.00%
8.00%
10.00%
12.00%
14.00%
16.00%
18.00%
20.00%
2002 2003 2004 2005 2006
ADMBGCAGIndustry
Return on owner’s equity measures the profitability of the owners’ interest in
total assets. Return on equity is found by dividing net income by equity. In
2003, ADM saw a decrease of 1.69% due to the fact that net income decreased
by $59,948. This trend remained steady through 2004 when ADM then saw a
significant increase of 5.95%. In recent years ADM seems to have explosive
returns on equity, proving to be a strong competitive advantage for the
company.
As illustrated in ROA, ADM appears to have a lower ROE compared to the other
firms from years 2002 to 2004 due to the fluctuations in net income. The

62
shareholder’s equity continues to grow from year to year and with the net
income being affected so much by the expenses, it gives ADM a low ROE until
year 2005. For the rest of the years, BG and CAG followed the industry average
from its peak from 2002 to 2004 and its slow decline from 2005 and on, while
ADM increases from 2005 and on. With ADM’s growing ROE, it is able to
generate profits from the shareholder’s investments in the company, which will
allow ADM pay its investors with higher dividends, highly desired by investors.
Capital Structure Analysis
Capital structure of a company refers to the sources of financing used to acquire
assets (Handout). Capital structure ratios are broken down into three different
ratios including: debt to equity, times interest earned, and debt service margin.
Capital structure ratios are useful in evaluating the considerations of the amount
of debt relative to owner’s equity and ability to service principle and interest
requirement (Handout).
Capital Structure Analysis
2002 2003 2004 2005 2006 Debt to Equity Ratio 1.27 1.43 1.52 1.21 1.17 Times Interest Earned 1.02 0.75 1.10 3.64 4.08 Debt Service Margin 3.97 34.61 0.21 9.54 17.25
Capital structure ratios refer to the sources of financing used to acquire assets.
Overall, ADM’s main concern is with the debt service margin which went through
some significant changes due to volatile fluctuations in cash flows from
operations.

63
2002 2003 2004 2005 2006 Debt to Equity Ratio 1.27 1.43 1.52 1.21 1.17
Debt to Equity Ratio
0.00
0.50
1.00
1.50
2.00
2.50
3.00
3.50
4.00
4.50
5.00
2002 2003 2004 2005 2006
ADMBGCAGIndustry
The debt to equity ratio shows us the credit risk that a company is exposed to.
A credit risk is the risk that interest and debt repayments cannot be satisfied with
available cash flows (Moore). It tells us how much ADM has in liabilities in
comparison to every dollar of equity. Debt to equity ratio is found by dividing
total liabilities by owner’s equity. ADM’s debt to equity ratio steadily increases
from 2002 to 2004. In 2005, ADM has a slight decrease of 0.31 followed by
another decrease of 0.04 in 2006. Overall, ADM is slightly reducing its leverage
which makes them less risky.
ADM’s debt to equity ratio is low compared to the overall industry, as well as its
competitors. From 2002 to 2005, ADM has a debt to equity ratio that is around
1.17 to 1.52, while the overall industry ranges anywhere from 1.57 to 3.14.
According to these numbers, ADM holds less debt than the overall industry but
has a higher amount of owner’s equity. ADM stays relatively constant from 2002

64
to 2005, while BG, CAG, and the overall industry’s debt to equity ratio
continuously decreases through the five years. This means that ADM has a
competitive advantage over its competitors, because ADM holds less risk while its
competitors continue to hold approximately the same amount of risk.
2002 2003 2004 2005 2006 Times Interest Earned 1.02 0.75 1.10 3.64 4.08
Times Interest Earned
0.00
1.00
2.00
3.00
4.00
5.00
6.00
2002 2003 2004 2005 2006
ADMBGCAGIndustry
Times interest earned indicates the adequacy of income from operations to cover
required interest charges. Times interest earned is found by dividing NIBIT by
interest expense. ADM’s times interest earned deceases from 2002 to 2003, but
then drastically increases from 2004 to 2006. In 2005 we saw an increase of 2.5
due to the fact that interest expense decreased between 2004 and 2005. This
means that ADM has an increasing ability to cover its interest expense with cash
on hand.

65
ADM had a steady increase of times interest earned over past four years moving
over three points to its current spot in leading the industry. While in the early
years such as 2002, 2003, and 2004 they were well behind its competitors and
the industry average. This could mean that ADM had trouble using its income
from operations to pay interest expense. This in turn makes it hard to spin
profits to the stockholders. As ADM struggled with trailing the industry in those
three years, ADM has become more efficient on managing their income from
operations to put ADM well ahead of their competitors and the industry average.
2002 2003 2004 2005 2006Debt Service Margin 3.97 34.61 0.21 9.54 17.25
Debt Service Margin
-5.00
0.00
5.00
10.00
15.00
20.00
25.00
30.00
35.00
40.00
2002 2003 2004 2005 2006
ADMBGCAGIndustry
The debt service ratio measures the adequacy of cash provided by operations to
cover required annual installment payments on the principal amount of long-term
liabilities. Debt service margin is found by dividing operating cash flow by notes
payable. In 2003, ADM saw a significant increase of 30.64 due to the fact that
from 2002 to 2003 they saw an increase in cash flow from operations of

66
$446,412. This is followed by a drop of 34.41 in 2004 due to the fact that ADM
saw a drop in cash flows from operations by $1,035,837. In 2005, ADM saw an
increase of 9.33 due to the fact that between 2004 and 2005 they saw an
increase in cash flows from operations of $2,092,840. This trend continued with
a 7.71 increase in 2006 due to an increase in cash flows from operations of
$750,138. Due to the volatility of cash flows from operations, ADM’s debt
service margin has no stability which is not acceptable for a company as mature
as ADM.
The industry as a whole had small fluctuations but stayed constant within five to
ten points. ADM has jumped all around the chart with high and low numbers to
current position where they are leading the industry with the advantage of
having a sufficient amount of cash to cover current notes payable.
Extended Ratio Analysis
The extended ratio analysis is a set of tools that allow us to analyze a company
further than the basic 14 ratios will allow. With the more extensive set of ratios
we can analyze core competency of ADM by determining how profitable it is at
its core business by using the following: recurring NOPAT margin, EBITDA
margin, net long-term asset turnover, PP&E turnover, operating cash flow ratio
and dividend payout ratio. Furthermore, we can see how profitably ADM handles
its assets with some of these ratios. These five additional ratios pertain to ADM
for the aforementioned reasons. With the help of these ratios we should be
better to truly value ADM with less accounting distortions.
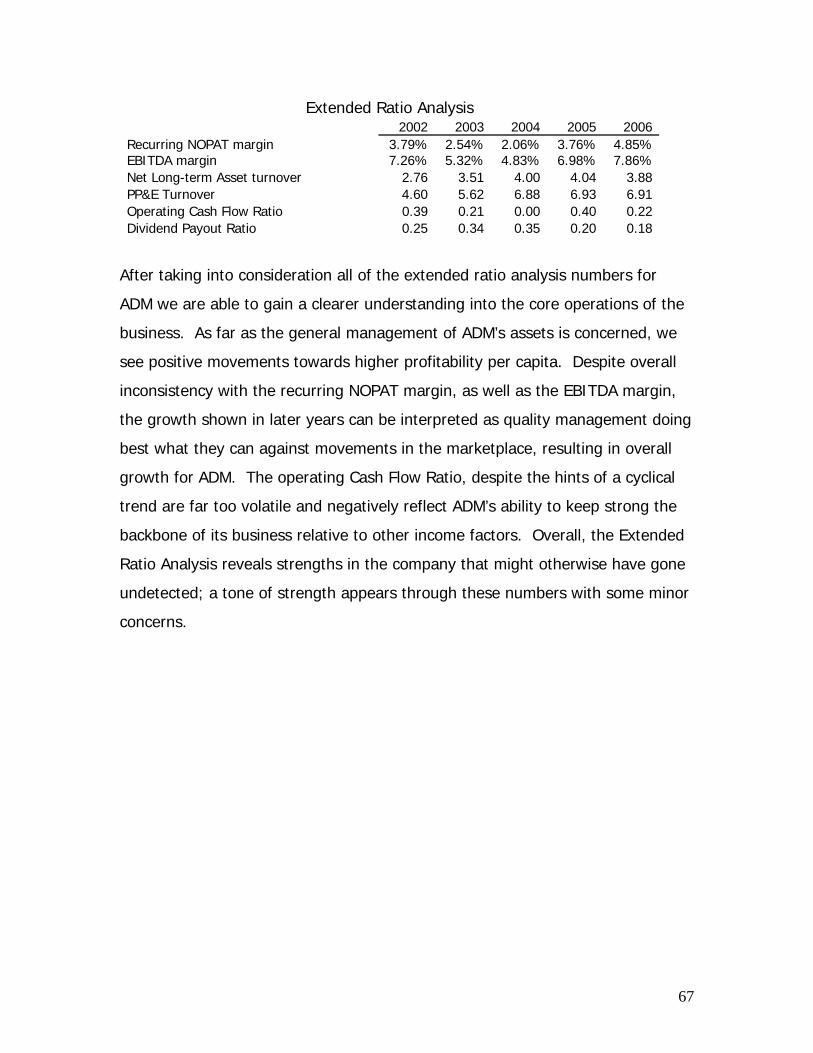
67
Extended Ratio Analysis 2002 2003 2004 2005 2006 Recurring NOPAT margin 3.79% 2.54% 2.06% 3.76% 4.85% EBITDA margin 7.26% 5.32% 4.83% 6.98% 7.86% Net Long-term Asset turnover 2.76 3.51 4.00 4.04 3.88 PP&E Turnover 4.60 5.62 6.88 6.93 6.91 Operating Cash Flow Ratio 0.39 0.21 0.00 0.40 0.22 Dividend Payout Ratio 0.25 0.34 0.35 0.20 0.18
After taking into consideration all of the extended ratio analysis numbers for
ADM we are able to gain a clearer understanding into the core operations of the
business. As far as the general management of ADM’s assets is concerned, we
see positive movements towards higher profitability per capita. Despite overall
inconsistency with the recurring NOPAT margin, as well as the EBITDA margin,
the growth shown in later years can be interpreted as quality management doing
best what they can against movements in the marketplace, resulting in overall
growth for ADM. The operating Cash Flow Ratio, despite the hints of a cyclical
trend are far too volatile and negatively reflect ADM’s ability to keep strong the
backbone of its business relative to other income factors. Overall, the Extended
Ratio Analysis reveals strengths in the company that might otherwise have gone
undetected; a tone of strength appears through these numbers with some minor
concerns.

68
2002 2003 2004 2005 2006 Recurring NOPAT margin 3.79% 2.54% 2.06% 3.76% 4.85%
Recurring NOPAT Margin
0.00%
2.00%
4.00%
6.00%
8.00%
10.00%
12.00%
2002 2003 2004 2005 2006
ADMBGCAGIndustry
The recurring NOPAT margin is a measure of the profitability of a company after
taking taxes and extraordinary or nonrecurring income or losses that have
occurred out of the picture. Recurring NOPAT margin is found by adding net
income & taxes less extraordinary gains & losses divided by sales. Recurring
NOPAT margin is an accurate measure of the profitability of ADM, because it
takes out the nonrecurring income which can easily distort ADM’s statements.
These distortions are prevalent due to the large amount of hedging contracts
ADM undertakes, as well as volatility of commodity prices. Depreciation is left
into the assessment of NOPAT profitability, which in our opinion, is essential to
value ADM’s profitability regarding the use of the company’s assets. ADM is
heavily asset based, and although depreciation distorts cash flows and profits, it
theoretically represents the loss of value on an asset through use. After some
concerning declines in the recurring NOPAT for 2003 and 2004, ADM seems to be
recovering with exceptional gains in such a mature industry. This leaves doubt

69
about ADM’s ability to remain consistent in its gains, but shows the company’s
ability to recover nicely.
At first glance, ADM seemed to be promising with the amount of growth the
company showed towards the more current years; however, compared to the
industry and competitors, this no longer seems true. ADM performs more
consistently compared to the new BG, but consistently underperforms compared
to CAG. CAG is continually growing more than ADM, and it seems that ADM is
merely just now catching up to the industry average. With respect to the
industry and the competitors within, we find ADM’s performance disappointing.
2002 2003 2004 2005 2006 EBITDA margin 7.26% 5.32% 4.83% 6.98% 7.86%
EBITDA Margin
0.00%
2.00%
4.00%
6.00%
8.00%
10.00%
12.00%
2002 2003 2004 2005 2006
ADMBGCAGIndustry
EBITDA margin is the measurement of the profitability of a company after
compensating for taxes and interest, and non-cash expenses, such as
depreciation and amortization divided by sales. After a few years of suffering

70
under the measurements of this margin, ADM has been able to return to
previous levels of profitability. This return to roughly 7% annual gains took five
years to occur. We believe the slowdown in growth is a direct result of a slowing
economy from 2002-2004, and the recent economic boom has returned ADM to
previous levels of profitability. Management was ineffective in combating
slowing growth despite its dominate market position. With such market position,
ADM should have been able to find means to pass on costs or extend market
share to maintain higher levels of profitability. Overall, this speaks poorly for the
management of ADM.
The industry trends tell different stories. Once the distortions from asset
depreciation are taken out of the profitability of ADM and its competitors, which
is a large portion of the balance sheet, ADM is not performing as bad as
previously thought. ADM is still an underperformer in regards to CAG, but in
2005 ADM betters the industry average and remains close to 1% behind CAG in
2006. We feel that ADM should be the industry leader given its market share
and sheer size, not CAG. It appears that ADM might have the ability to
overcome this problem in the near future; however, we still hold a negative
opinion of ADM’s performance.

71
2002 2003 2004 2005 2006 Net Long-term Asset turnover 2.76 3.51 4.00 4.04 3.88
Net Long-term Asset Turnover
0.00
1.00
2.00
3.00
4.00
5.00
6.00
7.00
2002 2003 2004 2005 2006
ADMBGCAGIndustry
Net Long-term Asset turnover is the measure of a dollar of sales per dollar
invested in long term assets. The performance of this ratio is crucial to a firm as
heavily anchored in long-term assets as ADM. The growth of this ratio over time
is very impressive given the size and structure of ADM. The growth in return of
the profitability of long term-assets from 2002 to its peak in 2005 is over 46%.
In terms of the management of ADM’s long term assets, ADM has done
exceptionally well at getting the most money out of their long-term assets.
At first glance, the net long-term asset turnover would be seemingly in favor of
BG. But due to the nature of a ratio that focuses on long term assets with
depreciation taken out of the picture, BG should be in the lead. BG is a growing
company that focuses on mining to compete in the fertilizer sector with ADM;

72
overall, this requires a lower amount of assets to compete in this particular field.
We believe the other discrepancies of these numbers are due to investments and
hedging situations in which ADM performed favorably.
2002 2003 2004 2005 2006 PP&E Turnover 4.60 5.62 6.88 6.93 6.91
PP&E Turnover
0.00
2.00
4.00
6.00
8.00
10.00
12.00
2002 2003 2004 2005 2006
ADMBGCAGIndustry
PP&E turnover is the measurement of dollar returned per dollar invested in
PP&E. This is a more narrow measure of fixed assets than the net long-term
asset turnover ratio since PP&E is merely a portion of long term assets. ADM has
managed its investment into the field of PP&E quite well with large returns,
illustrated in the growth of this ratio over time. The increase in this ratio seems
to be the driving factor in the increase on the net long-term asset turnover ratio.
This is a success factor that reflects favorably upon ADM.
The closer correlation of the numbers compared to that of the conceptually
similar net long-term asset turnover illustrates a few points about the industry.

73
First of all, BG is seemingly outperforming its peers and the industry; however,
BG still in the growth stage of a firm, therefore producing abnormal profits.
Secondly, the similarity of ADM and CAG’s numbers simply illustrate the similar
fields and overall high competitiveness of the industry. Overall, these trends
show neither a favorable or unfavorable situation for ADM, it is merely
performing at par.
2002 2003 2004 2005 2006 Operating Cash Flow Ratio 0.39 0.21 0.00 0.40 0.22
Operating Cash Flow Ratio
-0.10
0.00
0.10
0.20
0.30
0.40
0.50
0.60
2002 2003 2004 2005 2006
ADMBGCAGIndustry
The operating cash flow ratio is a measure of the company’s total operating
activities divided by total current liabilities. This measure shows ADM’s ability to
cover its financing activities used for the acquisition of assets. These assets, in
turn, should be used to increase the operating cash flow of ADM. Given the
nature of long term debt, this ratio will be erratic. However, numbers like those
in year 2004 are concerning. This number is not actually zero, just very small
due to operating cash flows of $33,339. Operating cash flows this low is a direct

74
result of unusually high inventory expenses, hopefully something that will not
manifest itself in the future. Overall, ADM’s operating cash flow ratio is erratic
due to both the operating cash flows and the current maturities of long term
debt. We expect smoother operations from such an established company
despite the volatility of commodity based business, and are disappointed in the
high variance of these numbers.
In 2002, ConAgra experienced an increase in its assets from a higher cash flow
from operations, increasing its position up above ADM and the industry average.
Overall, the industry did very well that year. Year 2003 shows the industry as a
whole coming down from its extremely high increase in cash flows from
operations. ADM’s operating cash flow ratio for 2004 dropped due to an increase
in liabilities and a decrease in cash. With both of these factors being a major
component of the operating cash flow ratio, it had a drastic effect on ADM’s
ratio. For the remaining two years, ADM mirrored the industry average by
increasing with it in 2005 and then decreasing in 2006. This shows that ADM is
losing short term liquidity, but it does not necessarily mean they are in the
danger zone for being able to cover its liabilities.

75
2002 2003 2004 2005 2006Dividend Payout Ratio 0.25 0.34 0.35 0.20 0.18
Dividend Payout Ratio
0.00
0.20
0.40
0.60
0.80
1.00
1.20
2002 2003 2004 2005 2006
ADMBGCAGIndustry
Dividend payout ratios is cash dividends paid divided by net income. It reflects
the extent at which company’s pay out profits or retains them for reinvestment
(Palepu-12). Looking at the chart you see that ADM has remained lower than the
industry average for the past five years. ADM has stayed constant with slight
increases in 2005 and 2006. Although ADM has been below the industry
average, so has its competitor BG. BG has been considerably lower than ADM
and the industry average. This means that ADM maintains a low dividend payout
ratio because they choose to pay fewer dividends and retain profit for re-
investment as well as its competitor BG. This could also imply that both ADM and
BG have a conservative dividend policy compared to the industry. This gives
ADM an advantage since they are able to re-invest money into the company to in
turn make more money and increase the worth of the company.

76
SGR & IGR Analysis
The sustainable growth rate, known as SGR, is defined as the maximum rate of
growth that a firm can grow without borrowing additional equity. On the other
hand, the internal growth rate, known as IGR, can be defined as the highest
growth rate possible for a firm to achieve while keeping its profitability and
financial policies unchanged (Palepu, 5-19). These measurements set a
benchmark for a firm’s growth strategies to be assessed. This benchmark is
important to evaluate because a firm’s growth rate takes into account several
financial ratios, in hopes of giving an accurate firm valuation. The SGR actually
includes IGR in the equation, and just multiplies it by the leverage which is
(1+D/E). The following are ADM’s IGR and SGR.
2002 2003 2004 2005 2006 IGR 0.06 0.04 0.04 0.10 0.11 SGR 0.14 0.10 0.10 0.22 0.24
As shown, the SGR is always larger than or equal to IGR and they increase or
decrease together. From years 2001 to 2004, the growth rates were overall
steady with small increases and decreases. Then, in 2005, the rates increased
dramatically and continued a steady increase in 2006. Looking back at ADM’s
income statement, it shows that ADM experienced a gain in operating expenses
of $165,847. This caused ADM’s net earnings to increase drastically from
$494,710 in 2004 to $1,044,385 in 2005. With the increased earnings that ADM
experienced in 2005, it was able to keep up the growth momentum and earn
more net income in 2006. If ADM can keep up with these growth rates, they will
be able to sustain its company while having to borrow less additional equity.

77
Forecasting
To help ascertain the value of ADM, we forecasted its financial statements ten
years into the future. This forecasting will reveal any sustainability issues that
are reasonably possible in the upcoming future.
Balance Sheet
Forecasting the balance sheet helps us see the overall sustainability of ADM into
the future. For most items we used an average growth rate percentage based
on the common sized balance sheet. Another method we used was to take
smaller items as a percentage of a larger line item to maintain a relation that we
can forecast into the future. We believe this to be an accurate forecasting
method due to ADM’s maturity and the low likelihood that the company will
drastically change its business practices in the foreseeable future. Overall we do
not expect any drastic changes to occur relevant to ADM’s balance sheet.
Income Statement
To forecast the income statement we used a combination of different
mathematical and forecasting methods. Net sales were forecasted by finding the
average sales growth rate from 2003 to 2006 and applying it to years 2007 to
2016. Years 2001 and 2002 were not taken into account due to a recession in
2001. ADM started climbing out of this recession in 2002, but didn’t level off
until 2003. Gross profit was forecasted by finding the average gross profit margin
which was 6.87%. By first forecasting gross profit, we were then able to take net
sales less gross profit to forecast our cost of goods sold. Selling, general, and
administrative expenses were forecasted by finding the average growth rate
which was 3.44%. Other expenses were not forecasted due to its broadness and

78
lack of trend. We felt that there was no specific method available to forecast
other expenses that logically made sense. Earnings before income taxes was
then forecasted by taking gross profit less selling, general, and administrative
expenses. Income taxes were forecasted using the average growth rate of
29.25%. Net earnings were then forecasted by taking earnings before income
taxes less income taxes.
Cash Flow Statement
When forecasting for the operating cash flows, it was necessary to evaluate each
line item of the statement and decide if it was important to be forecasted or not.
This was done by analyzing the line items and seeing if any sort of pattern of
growth occurred. We first wanted to see if there was a cyclical pattern in its past
cash flows. We gathered data for the past 10 years and analyzed it, noticing
that ADM’s past cash flow from operations, accounts payable, and depreciation
experienced a cyclical pattern, which is a reoccurring business cycle. Once we
found a pattern, we were able to find the growth rates for all the inclines and all
the declines, and then find the overall averages for the incline and decline. We
took notice of how many years it experienced these increases or decreases and
we applied the appropriate growth rates accordingly. For the cash flow from
operations, we found that it had a steady growth rate of 3%, which included the
nominal interest rate. This was followed by an increasing year of 86% growth
rate and then a year of a decreasing growth rate of 45%. This pattern is
projected to continue until year 2016. As for the accounts payable pattern, we
found that it had a cyclical pattern of a decrease of 165% in year 2007, and then
an increase of 267% for the year 2008. This decreasing, increasing pattern
should repeat until the year 2016. Finally, the depreciation experienced a two
year increase of 5% and a two year decrease of 3%. This pattern is anticipated
to continue into year 2016. The cyclical pattern allows us to make an accurate

79
assumption that ADM will continue to maintain its current position while enduring
an overall growth rate.
There was an overall steady growth rate found in the past years for net earnings.
With this observation we forecasted that there would be an overall average
growth rate of 22%by finding each year’s growth rate but not taking into
account year 2003 and 2005 due to outliers. The line item of inventory was
forecasted by looking back 10 years and finding the averages of the cash flows.
Years 2003 until 2006 were not included in this average because they were
considered outliers due to their negative standings. The average cash flow was
$116,582, and we just applied this number over the future years until 2016. As
for accounts receivable, we took a common size income statement, which is an
income statement as a percentage of sales, for years 2001 until 2006. With
those percentages, we averaged them which resulted in a 12% rate. This rate
was applied to year 2006 to get the 2007 cash flows and was repeated every
year until 2016. In conclusion, forecasting can give us an insight as to the future
of ADM’s cash flow statements, which will allow us to evaluate the firm.

80
Analysis of Valuations
Valuation Models
Several methods of valuing a company’s stock price can be employed to gain a
relative understanding of whether or not a stock is over, fairly, or undervalued.
These initial valuations, combined with intangible issues addressed previously
can help one to truly ascertain the value of a stock price. The Method of
Comparables provides a screening method of determining relative profitability for
a company. This method is used mainly for initial valuation purposes. For more
in depth analysis, other models of valuation are preferred due to the high
variance of results from the method of comparables.
To help more accurately value ADM’s stock price, a weighted average cost of
capital, as well as a weighted average cost of equity, are employed as discount
factors in attempts to value ADM’s share price. These factors are assessed
through historical, present, and estimated data. The models that employ the
cost of equity (Ke) and cost of debt (Kd) are the discounted dividend model, free
cash flow model, residual income, abnormal earnings growth, long-run residual
income perpetuity. These models allow us, for the most part, to see more
accurately the share price for ADM. Not all of these models are accurate, but
they are theoretically based and if the idea represents the company’s method of
operations proportionately, the estimations should be reasonably close to the
intrinsic value of ADM.

81
Method of Comparables
ADM Share Price
Forward P/E (2006) $49.57 Trailing P/E (2005) $24.30 P/B $35.84 Price/Sales $63.75 PEG $29.15 Enterprise Value/EBITDA $69.49 Enterprise Value/Recurring NOPAT $36.98
The method of comparables valuation models rely on the most recent historical
data, as well as competitor’s information, to value a company. Specific data
used depends on the model, but typically it is derived from financial statement
line items in relation to another item on a per share basis. These models overall
seem rather unreliable for the analysis of ADM since one of the largest factors of
valuation is the dependency on industry average. For valuing ADM this is an
issue since in 2006 data is unavailable for BG, resulting in CAG being the industry
average. Furthermore, ADM is an oligopolistic company, excluding ADM in taking
the industry average drastically distorts the benchmark for which ADM should be
measured against. This in turn leads to skewed reference data, resulting in
inaccurate valuation models. Overall, despite the inaccuracy of these models,
they still provide a method of relating ADM and its competitors, making it
valuable in those regards.

82
Forward Price to Earnings
Forward P/E (2006)
PPS EPS P/E IND AVG.
ADM Share Price
ADM $36.61 $2.00 $18.30 $49.57 CAG $25.96 $1.05 $24.77 $24.77 BG $64.57 -
To calculate the average P/E ratios of the competitors, we multiplied the P/E
averages for each competitor by the current earnings per share. This value was
then multiplied by ADM’s earnings per share to give us ADM’s share price. The
forward P/E for ADM is $49.57, implying that ADM is an undervalued company
compared to the observed share price of $36.61. Since the idea of ADM as an
undervalued stock goes against the prevalent theme in our other models that
ADM is overvalued, we believe this model to be inaccurate. However, as a
method of relationships, we can see that ADM is clearly well positioned in
relation to the industry in the upcoming future.
Trailing Price to Earnings
Trailing P/E (2005)
PPS EPS P/E IND AVG.
ADM Share Price
ADM $24.49 $1.61 $15.25 $24.30 CAG $23.30 $1.24 $18.83 $15.14 BG $50.84 $4.44 $11.44

83
To compute trailing price to earnings, we took the price per share and divided it
by earnings per share. We then averaged the trailing P/E ratio, giving us the
industry average. To find ADM’s price per share, we took the industry average
and multiplied it by ADM’s earnings per share. The trailing P/E method provides
a price of $24.30, implying an undervalued stock. Due to the degree of which
ADM is undervalued implied by this model, we feel that it is an inaccurate
measure of ADM’s true share price. However, we again see that ADM is well
positioned in comparison to the industry averaged.
Price to Book
P/B
PPS BPS P/B IND AVG.
ADM Share Price
ADM $36.61 $32.44 $1.13 $35.84 CAG $25.96 $23.49 $1.11 $1.11 BG $64.57 -
In calculating price to book, we took the price per share and divided it by the
book value per share. After doing this for CAG, we found the industry average.
When factoring the average, we did not include BG due to lack of information.
Taking this into consideration, we took the industry average, and then multiplied
it by ADM’s book value per share. This model seems accurate since book value
is a key component of this model, and ADM is a mature, asset heavy, firm. This
gave us ADM’s share price of 35.84, fairly close to the observed price of $36.61.
Price to Sales
Price/Sales
PPS SPS P/S IND AVG.
ADM Share Price
ADM $36.61 $55.81 $0.66 $63.75 CAG $25.96 $22.73 $1.14 $1.14 BG

84
To find the price/sales ratio, we took price per share and divide it by sales per
share. After computing the ratio for CAG, the industry average was formed.
Due to CAG being the only competitor with published information, CAG
constitutes the industry average. ADM’s share price could then be calculated by
multiplying the industry average by sales per share. After computing ADM’s
share price of $63.75, we feel that the ratio is not an adequate representation of
ADM’s actual share price because it is dramatically higher than the other share
price estimates computed.
Price Earnings Growth
PEG
PPS EPS PEG IND AVG.
ADM Share Price
ADM $36.61 $2.00 $91.76 $29.15 CAG $25.96 $1.05 $73.07 $73.07 BG $64.57 -
The PEG is computed by taking the price to earning ratio and dividing it by the
growth rate. Again, CAG constitutes the industry average since BG does not
have published financials for this year. After calculating PEG, we got a share
price of $29.15, which is an undervalued estimate of ADM’s share price.
Enterprise Value to EBITDA
Enterprise Value/EBITDA Calculated Multiples ADM Share Price ADM 11.94 19.82 $69.49
Formula Data ADM CAG BVL $11,462,150 $7,320,000 CASH $1,112,853 $332,000 EBITDA $2,877,144 $1,020,200 BVE $24,005,909 $13,227,658
The formulations of ADM’s share price using the enterprise value to EBITDA
method is very similar to a method of comparables function that takes into
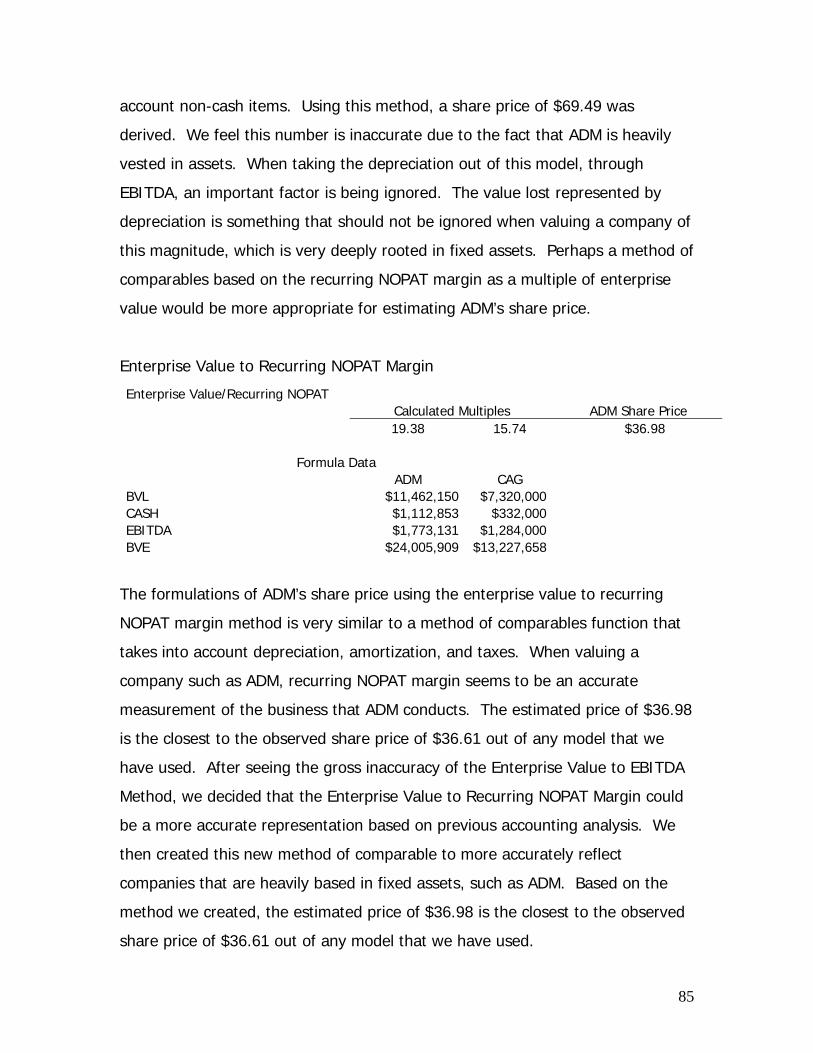
85
account non-cash items. Using this method, a share price of $69.49 was
derived. We feel this number is inaccurate due to the fact that ADM is heavily
vested in assets. When taking the depreciation out of this model, through
EBITDA, an important factor is being ignored. The value lost represented by
depreciation is something that should not be ignored when valuing a company of
this magnitude, which is very deeply rooted in fixed assets. Perhaps a method of
comparables based on the recurring NOPAT margin as a multiple of enterprise
value would be more appropriate for estimating ADM’s share price.
Enterprise Value to Recurring NOPAT Margin
Enterprise Value/Recurring NOPAT Calculated Multiples ADM Share Price
19.38 15.74 $36.98
Formula Data ADM CAG BVL $11,462,150 $7,320,000 CASH $1,112,853 $332,000 EBITDA $1,773,131 $1,284,000 BVE $24,005,909 $13,227,658
The formulations of ADM’s share price using the enterprise value to recurring
NOPAT margin method is very similar to a method of comparables function that
takes into account depreciation, amortization, and taxes. When valuing a
company such as ADM, recurring NOPAT margin seems to be an accurate
measurement of the business that ADM conducts. The estimated price of $36.98
is the closest to the observed share price of $36.61 out of any model that we
have used. After seeing the gross inaccuracy of the Enterprise Value to EBITDA
Method, we decided that the Enterprise Value to Recurring NOPAT Margin could
be a more accurate representation based on previous accounting analysis. We
then created this new method of comparable to more accurately reflect
companies that are heavily based in fixed assets, such as ADM. Based on the
method we created, the estimated price of $36.98 is the closest to the observed
share price of $36.61 out of any model that we have used.

86
Cost of Capital
Cost of capital is an important aspect of valuing a business and understanding its
operations. The costs of capital can be broken down into the Weighted Average
Cost of Capital, the Cost of Debt, and the Cost of Equity. These costs each
provide insight into the potential to a company’s profitability, as well as the best
financing option for the corporation. In the following segments, we have
formulated the aforementioned costs and analyzed their relevance to ADM.
Formulation of WACC
Weighted average cost of capital (WACC) is an expectation of a company’s
overall profitability. WACC is the basis for formulating all of the following
intrinsic valuation models, thus we must first find WACC before starting
valuations. In determining WACC, one must first calculate several variables
within the formula including the value of debt (Vd), the value of equity (Ve), the
value of the firm (Vf), cost of debt (Kd), cost of equity (Ke), and the tax rate (T).
WACC = (Vd/Vf)(Kd(1-T)) + (Ve/Vf)Ke
Value of debt, value of equity, and value of the firm can be determined by
analyzing current data from the financial statements and finding current stock
information. Because the market value of debt is comparable to the book value
of debt, we used ADM’s value of total liabilities, $11,462,150, as published in the
most recent 10-K. As for the value of equity, we multiplied ADM’s current stock
price and current number of shares outstanding to find an accurate market value
of $24,005,909. By adding these to variables together, we established a market
value of the firm of $35,468,059. In assessing the appropriate tax rate, we

87
found that, because ADM was not affected by changing tax regulations in the
past five years, we were able to use a five-year average tax rate of 29.03%.
Cost of Debt (Kd)
To find a cost of debt for the firm, we first broke down the liability side of the
balance sheet and found discount rates for each line item of current and long
term liabilities based on each items yield to maturity. Most of the short term
rates are based off of t-bill risk free rates, while our long term rates and current
payables on long term debt are weighted averages of long term debt rates
disclosed in the footnotes of the financial statements of the 10-K.These rates
were then weighted as a percent of total liabilities. By adding these individual
rates together, we came up with a total cost of debt of 5.8%.
Cost of Equity (Ke)
The cost of equity (Ke) is crucial to identifying the profitability of firms’
investments in regards to the price per share of equity. To solve for Ke we used
the CAPM model, along with evidence of observed market statistics.
CAPM Model
Ke = Risk Free Rate + Beta * Market Risk Premium
ADM Cost of Equity
9.53% = 5.11% + .8846 * 5%
To help determine the elements of the CAPM model, market information was
essential. For the risk free rate of 5.11%, we observed monthly percentage data
of 10 year maturity T-bills. We chose the 10 year maturity due to the high
adjusted R squared that resulted in our statistical equations; also we chose this

88
maturity horizon because we believe it accurately reflects the investment
horizons of ADM investors. Beta was calculated through processing the
comparative performance of ADM stock with that of the overall market producing
a measure of reaction that is to be expected from the company. A market risk
premium of 5% was determined from an analysis of current market conditions.
A traditional market risk premium of 7% is provided by historical evidence;
however some analysts believe that a more competitive market is pushing the
market risk premium down to 3-4%. (Palepu, 8 8-4) We believe the market risk
premium to be slightly above this due to increased risk in the market place.
Primarily this risk is based on the inversion of the long term yield curve which
signifies instability in a marketplace. With the combination of all of these
elements, a Ke of 9.53% is derived, which is an integral part of the intrinsic
valuation models.
Intrinsic Valuation Models
We used five intrinsic valuation models to help pinpoint the most accurate
estimation of what ADM’s stock price should be as of November 1, 2006. The
Discounted Dividend Model, Free Cash Flow Model, Residual Income, Abnormal
Earnings Growth Model, and the Long-run Residual Income Perpetuity are the
five models used in our estimation of the current share price for ADM. These
models take into account theoretically based principles, combined with
accounting data, to provide relatively accurate estimations for the value of a
firm. Overall we found the Long-run Residual Income Perpetuity to be our most
accurate model, with the Residual income and Abnormal Earnings Growth Models
close behind.

89
Discounted Dividends Model
Sensitivity Analysis
Ke 0.058 0.065 0.0953 0.1 0.11 0 11.45 10.84 7.25 6.86 6.14 0.01 12.64 11.96 7.66 7.22 6.41
Growth 0.02 14.32 13.54 8.19 7.67 6.74 0.03 16.88 15.93 8.88 8.25 7.15 0.04 21.24 20.01 9.81 9.02 7.68 Observed Share Price $36.61 Overvalued < 32.95 Fairly Valued +/- 10% Undervalued > 40.27
The discounted dividend model is a valuation model that conveys the value of
the firm’s equity as the present value of forecasted dividends. “Finance theory
states that the value of any financial claim is the present value of the cash
payoffs that its claimholders receive. Since shareholders receive cash payoffs
from a firm in the form of dividends, the value of equity is the present value of
future dividends.” (Palepu, 7-2, 3) When calculating our model, we used
forecasted dividends per share and the estimated cost of equity. Once we had
the necessary information, we were able to find the present value factor by
discounting the forecasted dividends for the next ten years, back to the current
year. Using cost of equity as our discount factor we multiplied the present value
factor by each forecasted dividend and added the numbers to get the total
present value of estimated dividends which is $3.70. To find the present value
of terminal value of perpetuity, we first had to take the perpetuity dividend of
year 2017 and divide it by the cost of equity less a growth rate of zero. A
growth rate of zero is used because ADM is a mature company that will most
likely not experience a high growth rate. We then took this number and
multiplied it by the present value factor for year 2016 which gave us $3.55 as a
present value of terminal value perpetuity. By adding our total present value of

90
estimated dividends and present value of a terminal value perpetuity we
calculated an estimated share price of $7.25 for 2006. ADM’s actual share price
is $36.61, so by running the sensitivity analysis, we observed that ADM is
overvalued with inputting values of a growth rates up to four percent and a cost
of equity up to eleven percent. Based of this sensitivity analysis ADM has an
implied cost of equity lower than the risk free rate. That coupled with a growth
rate higher than 4% is unreasonable. Because ADM’s yearly dividend payout is
relatively low, this model is yet again a poor measurement of ADM’s intrinsic
value. Even though, the estimated share price is unrealistic, the theme of an
overvalued stock is prevalent.
Free Cash Flow Model
Sensitivity Analysis
WACC 0.05 0.055 0.0597 0.065 0.0778 0.085 0 3.99 2.66 1.6 0.56 (1.46) (2.37) 0.01 5.87 4.12 2.76 1.47 (0.90) (1.94)
Growth 0.02 9.01 6.4 4.5 2.8 (0.16) (1.38) 0.03 15.29 10.51 7.42 4.87 0.89 (0.62) 0.04 34.14 20.09 13.29 8.61 2.49 0.47 Observed Share Price $36.61
Overvalued < 32.95
Fairly Valued +/- 10%
Undervalued > 40.27
The discounted free cash flow model valuation approach involves using
forecasted cash flows and discounting them back at ADM’s estimated cost of
equity to get an expected present value. To be able to start this model, we had
to find the cash flow to firm’s assets or otherwise known as the free cash flows.
This was found by subtracting our forecasted cash investments from our
forecasted cash from operations. The next step was to find the present value

91
factor using WACC as the discount rate. Then we multiplied the present value
factors to each of the free cash flows and added them together to get the total
present value of annual free cash flows, $8,061,331. The terminal value
perpetuity was found by taking the forecasted value of year 2017, $402,648, and
dividing it by the WACC less the growth rate of zero, giving the value of
$2,446,607. By adding the present value of annual free cash flows and the
terminal value perpetuity, we get the value of the firm as $10,507,937. Taking
this number and subtracting the book value of liabilities, which was found in
ADM’s financial statements, we get the estimated market value of equity as
($954,213). To get the estimated price per share, we have to divide this number
by the total of shares outstanding to give us an estimate value of -$1.46. This
value is a great deal lower than the current stock price of $36.61, suggesting
that ADM is once again overvalued. Due to the negative estimated stock price,
we believe this model to be an inaccurate measure of ADM’s intrinsic value.
When applying the sensitivity analysis, the prices stay overvalued until the
growth rate moves to four percent and the WACC moves down to five percent.
This is highly unlikely to happen since ADM is a mature company and does not
expect to experience such growth rates. Furthermore this is unrealistic; a WACC
of 5% would suggest the WACC is comparable to that of the risk free rate. A
WACC as low as the risk free rate is simply impractical. Once again due to the
extreme difference in the estimated stock price and observed, we believe this
model is a poor means of valuation for ADM. However, the model does suggest
that ADM is overpriced, consistent with our other models.

92
Residual Income Model
Sensitivity Analysis
Ke 0.06 0.065 0.075 0.0953 0.1 0 29.88 27.09 22.81 17.28 16.36 0.01 31.5 28.2 23.34 17.37 16.42
Growth 0.02 33.92 29.82 24.07 17.49 16.48 0.03 37.96 32.35 25.11 17.65 16.56 0.04 46.04 36.9 26.76 17.85 16.68 Observed Share Price $36.61 Overvalued < 32.95
Fairly Valued +/- 10%
Undervalued > 40.27
The residual income model uses the present value of a company’s yearly
forecasted residual income to find an intrinsically valued share price. To do this,
we first found ADM’s yearly residual income, for our ten year forecasted data, by
subtracting each year’s normal earnings from that year’s earnings per share.
After finding residual income for our forecasted years, we present valued back
each residual income to the current year. In our present value factor, we again
used cost of equity as the discount rate. After finding the present values of
residual income, we then found the present value of the terminal value
perpetuity and, also, discounted it back to the current year. The summation of
the present values and the current book value of equity per share rendered us
with an estimated intrinsic value $17.28 for ADM, with 86% of the value in
current equity value. After running sensitivity analysis, we again found ADM’s
current share price to be overvalued. To be a fairly valued stock, the sensitivity
analysis reveals that a growth rate of 2-3% along with a cost of equity of 6% are
required. We feel that this model is a stronger representation of our company’s
intrinsic value due to a more accurate estimation of $17.28; we believe that a

93
current share price of $36.61 is overvalued, which aligns with the findings of the
other five valuation models.
Abnormal Earnings Growth Model
Sensitivity Analysis
Ke 0.06 0.075 0.85 0.0953 0.1
Growth 0 35.91 26.22 21.81 18.35 17.04 Observed Share Price $36.61 Overvalued < 32.95
Fairly Valued +/- 10%
Undervalued > 40.27
The Abnormal Earnings Growth Model finds the incremental increase in earnings
each year in respect to cost of equity. The cumulative earnings for each year are
calculated by adding the previous years dividend reinvestment rate (D.R.I.P.)
and then deducting previous year’s earnings grown at the rate of cost of equity,
from the current year’s earnings. Then this value is present valued back to the
current year using cost of equity as the discount factor.
According to the results of the model, using a Ke of 9.53%, the stock with an
observed share price of 36.61 is overvalued. However, if we use the implied cost
of equity of 6% the stock becomes more fairly valued. Although, a Ke of 6% is
unrealistic; this implied cost of equity is too close for the risk free rate, which
would imply a market risk premium of 0%. Despite more competitive trends that
leave analysts to believe the market risk premium is falling, concerns about the
inversion of the long term yield curve causes skepticism among investors and
therefore innately rises the level of risk. Hence the market risk premium should

94
be at least a few percentage points above zero, leaving ADM as an overvalued
stock.
Long-run Residual Income Perpetuity Model
Sensitivity Analysis
Ke
0.0500 0.0600 0.0685 0.0810 0.09 0.0953 0.1 0.11
0.06 (71.77) N/A 84.44 34.18 23.92 20.33 17.94 14.35
0.0788178 (15.14) (23.18) (42.28) 199.89 39.01 26.46 20.59 13.99
Growth 0.09 (6.72) (8.96) (12.51) (29.88) N/A 50.74 26.89 13.45
0.1 (2.39) (2.98) (3.79) (6.28) (11.93) (25.39) N/A 11.93
0.11 0.50 0.61 0.73 1.04 1.51 2.06 3.03 N/A Observed Share Price $36.61 Overvalued < 32.95 Fairly Valued +/- 10% Undervalued > 40.27
The long-run residual income perpetuity model utilizes a perpetuity of a
company’s residual income to estimate the intrinsic value of the current stock
price. To find the perpetuity we first had to find return on equity and growth of
book value of equity for each forecasted year. We then found averages for each
of the previous calculations to determine our perpetuity. By using these
averages, along with the cost of equity, we were then able to find the perpetuity.
To calculate the intrinsic share price of $26.46, we added the perpetuity to the
current book value of equity. As with the previous valuation models the
estimated share price of ADM is again overvalued. Although, our sensitivity
analysis in this model shows, with a slight decrease of cost of equity to 9% and a
growth rate of 7.88%, our company would be in the fairly valued range. Despite
these implied rates, this model is relatively accurate giving us the most solid
evidence to conclude that ADM’s current stock price is inherently overvalued.

95
Altman Z-score
2002 2003 2004 2005 2006Altman Z-scores 2.696 2.835 3.078 3.650 3.853
The Altman Z-score is the calculation we used to assess the risk of ADM by using
a weighted ratio based formula. This formula consists of financial statement
items used to evaluate the credit risk of a company. By looking at the leverage
and ADM’s ability to make its principal and interest payments we can determine
the degree of risk the company holds. The formula simply involves plugging in
the historical information for the year. By analyzing ADM’s Altman Z-scores over
the past years, they appear to have increased every year to hold a current score
of 3.853. This increase in score illustrates ADM’s decline in risk over the past
five years. A score of 3.853 makes ADM a low credit risk to lenders, since a
score above 2.67 is the benchmark for a “low-risk” firm. Due to its low credit
risk, ADM has access to more borrowing opportunities and therefore greater
access to capital in the debt market. Furthermore, ADM will experience a
decrease in default risk and, with continued high credit ratings, WACC is likely to
decrease over time.
Analyst Recommendation
After in depth research concerning not only ADM, but ADM’s competitors, as well
as the industry overall we fully understand the conditions in which ADM
operates. ADM is a cost leader in a field with only a few competitors. ADM, for
the most part satisfies the success factors that are key for doing well in its
industry. ADM is mature, and we expect steady growth into the future of its
operations, providing a solid investment. However, after running intrinsic
valuation models, there is a high degree of implication that ADM is overvalued
from nearly every aspect that can be estimated. Even the most accurate

96
forecasts and models show ADM to be overvalued. We believe this overvaluation
comes from undue enthusiasm in the marketplace concerning the future
expansion and potential for profitability in the ethanol market. The market
believes that ADM is well positioned in this area due to its high control over the
inputs for this potentially profitable growth area. We believe that contrary to the
market’s enthusiasm, there is no sound reason to believe that ADM has the
potential to exploit the ethanol market greatly. We believe that ADM should be
valued lower than the observed market price of $36.61 due to this prevalent
theme across most of our intrinsic valuation models. Our most optimistic model
values ADM at $26.46, and we believe this model to be our most accurate as
well. Therefore, after all of our in depth analysis, we conclude that ADM is an
overvalued firm with a sell opportunity.

97
AppendixBalance Sheet
Archer Daniels Midland Co. 2001 2002 2003 2004 2005 2006 2007 2008 2009 2010 2011 2012 2013 2014 2015 2016
ASSETS
CURRENT ASSETS:
Cash and cash equivalents $844,187 $676,068 $764,959 $540,207 $522,420 $1,112,853 $612,069 $636,552 $1,183,987 $651,193 $677,240 $1,259,667 $692,817 $720,530 $1,340,185 $737,102 use 3 year cyclical pattern from CFFO delayed by on
Accounts receivable $2,849,523 $2,416,432 $3,320,336 $4,040,759 $4,102,263 $4,471,201 $4,963,033 $5,508,967 $6,114,953 $6,787,598 $7,534,234 $8,362,999 $9,282,929 $10,304,052 $11,437,497 $12,695,622 11% of TA avg growth rate
Inventories, net $3,225,412 $2,361,885 $3,550,225 $4,591,648 $3,906,698 $4,677,508 $4,509,912 $4,798,161 $5,104,834 $5,431,107 $5,778,235 $6,147,548 $6,540,467 $6,958,498 $7,403,248 $7,876,424 use avg inventory turnover of 8.04 and forecasted C
Segregated cash and investments $134,474 $141,672 $544,669 $871,439 $908,001 $1,220,666 $1,232,548 $1,244,545 $1,256,659 $1,268,891 $1,281,242 $1,293,714 $1,306,306 $1,319,022 $1,331,861 $1,344,825 avg growth rate of 0.97%
Prepaid expenses and other assets $279,635 $284,226 $241,668 $294,943 $271,319 $344,049 $285,973 $285,973 $285,973 $285,973 $285,973 $285,973 $285,973 $285,973 $285,973 $285,973 avg
Total current assets $7,363,231 $6,150,301 $8,421,857 $10,338,996 $9,710,701 $11,826,277 $13,093,215 $14,140,672 $15,807,783 $17,072,405 $18,750,710 $20,250,767 $21,870,828 $23,620,494 $25,510,134 $27,550,944 57% of TA for first two years, 59% of TA for next t
Investments in and advances to affiliates $1,761,938 $2,052,222 $1,763,453 $1,832,619 $1,879,501 $1,985,662
Long Term Marketable Securities $876,802 $698,629 $818,016 $1,161,388 $1,049,952 $1,110,177
Property and equipment, net $4,890,241 $4,920,425 $5,468,716 $5,254,738 $5,184,380 $5,293,032 $6,431,755 $6,698,213 $6,966,142 $7,234,070 $7,812,796 $8,437,819 $9,112,845 $9,841,873 $10,629,222 $11,479,560 as percentage of total assets decining 1% a year un
Goodwill $344,720 $337,474 $325,167 $322,292 not forecastable due to unpredictability
Other assets $524,061 $518,354 $366,117 $443,606 $448,404 $731,590 not forecastable
Total long term assets $8,053,042 $8,189,630 $8,761,022 $9,029,825 $8,887,404 $9,442,753 $9,877,338 $10,667,525 $10,985,069 $11,863,875 $12,500,473 $13,500,511 $14,580,552 $15,746,996 $17,006,756 $18,367,296 43% of TA for first two years, 41% of TA for next t
TOTAL ASSETS $15,416,273 $14,339,931 $17,182,879 $19,368,821 $18,598,105 $21,269,030 $22,970,552 $24,808,197 $26,792,852 $28,936,281 $31,251,183 $33,751,278 $36,451,380 $39,367,490 $42,516,889 $45,918,241 average annual growth of 8%
LIABILITIES AND SHAREHOLDERS EQUITY 8%
CURRENT LIABILITIES:
Short-term debt $967,473 $875,703 $1,279,483 $1,770,512 $425,808 $549,419 Too volatile to forecast
Accounts payable $2,330,992 $1,794,684 $2,848,826 $3,238,230 $3,399,352 $4,014,392 $3,764,997 $4,066,196 $4,391,492 $4,742,811 $5,122,236 $5,532,015 $5,974,576 $6,452,543 $6,968,746 $7,526,246 28.95% of Total Liabilities
Accrued expenses and other current liabilities $1,115,042 $814,450 $988,175 $1,580,700 $1,318,766 $1,521,188 Not Forecastable
Current portion of long-term debt $305,790 $382,144 $30,888 $160,795 $222,938 $79,768 Not Forecastable
Total current liabilities $4,719,297 $3,866,981 $5,147,472 $6,750,237 $5,366,864 $6,164,767 $6,894,544 $7,446,108 $8,041,796 $8,685,140 $9,379,951 $10,130,347 $10,940,775 $11,816,037 $12,761,320 $13,782,225 53.01% of Total Liabilities
Long-term debt $3,111,294 $3,354,067 $3,872,287 $3,739,875 $3,530,140 $4,050,323 $4,294,811 $4,535,732 $4,691,154 $4,929,804 $5,320,727 $5,654,502 $6,012,532 $6,404,059 $6,871,729 $7,413,105 6% average growth rate
Deferred income taxes $631,923 $644,295 $543,555 $653,834 $779,427 $756,600 not forecastable due to unpredictability of tempora
Other $198,938 $145,905 $550,368 $526,659 $488,202 $490,460 Not Forecastable
Total long term liabilities $3,942,155 $4,144,267 $4,966,210 $4,920,368 $4,797,769 $5,297,383 $6,110,985 $6,599,863 $7,127,852 $7,698,081 $8,313,927 $8,979,041 $9,697,365 $10,473,154 $11,311,006 $12,215,887 46.99% of Total Liabilities
TOTAL LIABILITIES $8,661,452 $8,011,248 $10,113,682 $11,670,605 $10,164,633 $11,462,150 $13,005,529 $14,045,971 $15,169,649 $16,383,221 $17,693,878 $19,109,388 $20,638,140 $22,289,191 $24,072,326 $25,998,112 56.62% of Total Assets
COMMITMENTS AND CONTINGENCIES
SHAREHOLDERS EQUITY:
Common stock $5,436,151 $5,608,741 $5,373,005 $5,431,510 $5,385,840 $5,511,019 $5,457,711 $5,457,711 $5,457,711 $5,457,711 $5,457,711 $5,457,711 $5,457,711 $5,457,711 $5,457,711 $5,457,711 Average
Reinvested Earnings $1,567,570 $1,187,357 $1,863,150 $2,183,751 $3,011,015.00 $4,081,490.00 $4,818,957 $5,622,186 $6,496,020 $7,445,636 $8,476,560 $9,594,701 $10,806,366 $12,118,291 $13,537,669 $15,072,180 last year's RE+(net income-(avg DPR*NI))
Accumulated other comprehensive income (loss) ($248,900) ($464,415) ($166,958) $82,955 $36,617.00 $214,371.00 Not ForecastableTotal shareholders equity $6,754,821 $6,331,683 $7,069,197 $7,698,216 $8,433,472.00 $9,806,880.00 $9,965,825 $10,763,091 $11,624,138 $12,554,069 $13,558,394 $14,643,066 $15,814,511 $17,079,672 $18,446,046 $19,921,730 43.39% of Total Assets
TOTAL LIABILITIES AND SHAREHOLDERS EQUITY $15,416,273 $14,339,931 $17,182,879 $19,368,821 $18,598,105.00 $21,269,030.00 $22,970,552 $24,808,197 $26,792,852 $28,936,281 $31,251,183 $33,751,278 $36,451,380 $39,367,490 $42,516,889 $45,918,241 Total Assets

98
Common Size Balance Sheet
ASSETS
CURRENT ASSETS:
Cash and cash equivalents 5.48% 4.71% 4.45% 2.79% 2.81% 5.23% 2.66% 2.57% 4.42% 2.25% 2.17% 3.73% 1.90% 1.83% 3.15% 1.61%
Accounts receivable 18.48% 16.85% 19.32% 20.86% 22.06% 21.02% 21.61% 22.21% 22.82% 23.46% 24.11% 24.78% 25.47% 26.17% 26.90% 27.65%
Inventories, net 20.92% 16.47% 20.66% 23.71% 21.01% 21.99% 19.63% 19.34% 19.05% 18.77% 18.49% 18.21% 17.94% 17.68% 17.41% 17.15%
Segregated cash and investments 0.87% 0.99% 3.17% 4.50% 4.88% 5.74% 5.37% 5.02% 4.69% 4.39% 4.10% 3.83% 3.58% 3.35% 3.13% 2.93%
Prepaid expenses and other assets 1.81% 1.98% 1.41% 1.52% 1.46% 1.62% 1.24% 1.15% 1.07% 0.99% 0.92% 0.85% 0.78% 0.73% 0.67% 0.62%
Total current assets 47.76% 42.89% 49.01% 53.38% 52.21% 55.60% 57.00% 57.00% 59.00% 59.00% 60.00% 60.00% 60.00% 60.00% 60.00% 60.00%
Investments in and advances to affiliates 11.43% 14.31% 10.26% 9.46% 10.11% 9.34% 0.00% 0.00% 0.00% 0.00% 0.00% 0.00% 0.00% 0.00% 0.00% 0.00%
Long Term Marketable Securities 5.69% 4.87% 4.76% 6.00% 5.65% 5.22% 0.00% 0.00% 0.00% 0.00% 0.00% 0.00% 0.00% 0.00% 0.00% 0.00%
Property and equipment, net 31.72% 34.31% 31.83% 27.13% 27.88% 24.89% 28.00% 27.00% 26.00% 25.00% 25.00% 25.00% 25.00% 25.00% 25.00% 25.00%
Goodwill 0.00% 0.00% 2.01% 1.74% 1.75% 1.52% 0.00% 0.00% 0.00% 0.00% 0.00% 0.00% 0.00% 0.00% 0.00% 0.00%
Other assets 3.40% 3.61% 2.13% 2.29% 2.41% 3.44% 0.00% 0.00% 0.00% 0.00% 0.00% 0.00% 0.00% 0.00% 0.00% 0.00%
Total long term assets 52.24% 57.11% 50.99% 46.62% 47.79% 44.40% 43.00% 43.00% 41.00% 41.00% 40.00% 40.00% 40.00% 40.00% 40.00% 40.00%
TOTAL ASSETS 100.00% 100.00% 100.00% 100.00% 100.00% 100.00% 100.00% 100.00% 100.00% 100.00% 100.00% 100.00% 100.00% 100.00% 100.00% 100.00%
LIABILITIES AND SHAREHOLDERS EQUITY
CURRENT LIABILITIES:
Short-term debt 11.17% 10.93% 12.65% 15.17% 4.19% 4.79% 0.00% 0.00% 0.00% 0.00% 0.00% 0.00% 0.00% 0.00% 0.00% 0.00%
Accounts payable 26.91% 22.40% 28.17% 27.75% 33.44% 35.02% 28.95% 28.95% 28.95% 28.95% 28.95% 28.95% 28.95% 28.95% 28.95% 28.95%
Accrued expenses and other current liabilities 12.87% 10.17% 9.77% 13.54% 12.97% 13.27% 0.00% 0.00% 0.00% 0.00% 0.00% 0.00% 0.00% 0.00% 0.00% 0.00%
Current portion of long-term debt 3.53% 4.77% 0.31% 1.38% 2.19% 0.70% 0.00% 0.00% 0.00% 0.00% 0.00% 0.00% 0.00% 0.00% 0.00% 0.00%
Total current liabilities 54.49% 48.27% 50.90% 57.84% 52.80% 53.78% 53.01% 53.01% 53.01% 53.01% 53.01% 53.01% 53.01% 53.01% 53.01% 53.01%
Long-term debt 35.92% 41.87% 38.29% 32.05% 34.73% 35.34% 33.02% 32.29% 30.92% 30.09% 30.07% 29.59% 29.13% 28.73% 28.55% 28.51%
Deferred income taxes 7.30% 8.04% 5.37% 5.60% 7.67% 6.60% 0.00% 0.00% 0.00% 0.00% 0.00% 0.00% 0.00% 0.00% 0.00% 0.00%
Other 2.30% 1.82% 5.44% 4.51% 4.80% 4.28% 0.00% 0.00% 0.00% 0.00% 0.00% 0.00% 0.00% 0.00% 0.00% 0.00%
Total long term liabilities 45.51% 51.73% 49.10% 42.16% 47.20% 46.22% 46.99% 46.99% 46.99% 46.99% 46.99% 46.99% 46.99% 46.99% 46.99% 46.99%
TOTAL LIABILITIES 100.00% 100.00% 100.00% 100.00% 100.00% 100.00% 100.00% 100.00% 100.00% 100.00% 100.00% 100.00% 100.00% 100.00% 100.00% 100.00%
COMMITMENTS AND CONTINGENCIES
SHAREHOLDERS EQUITY:
Common stock 80.48% 88.58% 76.01% 70.56% 63.86% 56.20% 54.76% 50.71% 46.95% 43.47% 40.25% 37.27% 34.51% 31.95% 29.59% 27.40%
Reinvested Earnings 23.21% 18.75% 26.36% 28.37% 35.70% 41.62% 48.35% 52.24% 55.88% 59.31% 62.52% 65.52% 68.33% 70.95% 73.39% 75.66%
Accumulated other comprehensive income (loss) -3.68% -7.33% -2.36% 1.08% 0.43% 2.19% 0.00% 0.00% 0.00% 0.00% 0.00% 0.00% 0.00% 0.00% 0.00% 0.00%
Total shareholders equity 100.00% 100.00% 100.00% 100.00% 100.00% 100.00% 100.00% 100.00% 100.00% 100.00% 100.00% 100.00% 100.00% 100.00% 100.00% 100.00%
TOTAL LIABILITIES AND SHAREHOLDERS EQUITY
Total Liabilities 56.18% 55.87% 58.86% 60.25% 54.65% 53.89%
Total Shareholders Equity 43.82% 44.15% 41.14% 39.75% 45.35% 46.11%
Total 100.00% 100.00% 100.00% 100.00% 100.00% 100.00%
ASSETS
CURRENT ASSETS: AVG AVG RAW AVG Growth AVG Div Payout Ratio
Cash and cash equivalents 4.25% 0.28
Accounts receivable 19.77% $3,533,419 0.113821015
Inventories, net 20.79%
Segregated cash and investments 3.36% 0.97%
Prepaid expenses and other assets 1.63%
Total current assets 50.14%
Investments in and advances to affiliates 10.82%
Long Term Marketable Securities 5.36%
Property and equipment, net 29.63%
Goodwill 1.17%
Other assets 2.88%
Total long term assets 49.86%
TOTAL ASSETS 100.00%
LIABILITIES AND SHAREHOLDERS EQUITY
CURRENT LIABILITIES:
Short-term debt 9.82%
Accounts payable 28.95%
Accrued expenses and other current liabilities 12.10%
Current portion of long-term debt 2.15%
Total current liabilities 53.01%
Long-term debt 36.36%
Deferred income taxes 6.76%
Other 3.86%
Total long term liabilities 46.99%
TOTAL LIABILITIES 100.00%
COMMITMENTS AND CONTINGENCIES
SHAREHOLDERS EQUITY:
Common stock 72.61%
Reinvested Earnings 29.00%
Accumulated other comprehensive income (loss) -1.61%
Total shareholders equity 100.00%
TOTAL LIABILITIES AND SHAREHOLDERS EQUITY

99
Income StatementArcher Daniels Midland Co. 2001/06/30 2002 2003 2004 2005 2006 2007 2008 2009 2010 2011 2012 2013 2014 2015 2016
Net sales and other operating income $19,483,211 $22,611,894 $30,708,033 $36,151,394 $35,943,810 $36,596,111 $38,935,138 $41,423,663 $44,071,241 $46,888,039 $49,884,870 $53,073,244 $56,465,400 $60,074,366 $63,913,997 $67,999,036 average of 6% increase based on last four steady years of growth
Cost of products sold $18,051,413 $20,928,438 $28,980,895 $34,003,070 $33,512,471 $33,630,297 $36,259,691 $38,577,215 $41,042,864 $43,666,104 $46,457,007 $49,426,289 $52,585,352 $55,946,326 $59,522,115 $63,326,449 sales-gross profit
Gross Profit $1,431,798 $1,683,456 $1,727,138 $2,148,324 $2,431,339 $2,965,814 $2,675,447 $2,846,448 $3,028,377 $3,221,935 $3,427,864 $3,646,954 $3,880,048 $4,128,040 $4,391,882 $4,672,588 6.87% of sales
SG&A $731,029 $826,922 $947,694 $1,401,833 $1,080,811 $1,192,683 $1,233,709 $1,276,147 $1,320,044 $1,365,451 $1,412,420 $1,461,005 $1,511,261 $1,563,245 $1,617,018 $1,672,641 3.44% average growth rate
Other expense - net $178,870 $137,597 $148,471 $28,480 ($165,847) ($82,119)Operating Income $521,899 $718,937 $630,973 $718,011 $1,516,375 $1,855,250 $1,441,738 $1,570,301 $1,708,334 $1,856,484 $2,015,444 $2,185,950 $2,368,788 $2,564,795 $2,774,864 $2,999,947 gross profit-expenses
Income taxes $138,615 $207,844 $179,828 $223,301 $471,990 $543,180 $421,646 $459,245 $499,613 $542,941 $589,430 $639,295 $692,767 $750,091 $811,527 $877,354 average rate of 29.25%
Net Earnings $383,284 $511,093 $451,145 $494,710 $1,044,385 $1,312,070 $1,020,093 $1,111,056 $1,208,720 $1,313,543 $1,426,014 $1,546,655 $1,676,020 $1,814,704 $1,963,337 $2,122,593 EBIT-Taxes
CSIS
Net sales and other operating income 100.00% 100.00% 100.00% 100.00% 100.00% 100.00% 100.00% 100.00% 100.00% 100.00% 100.00% 100.00% 100.00% 100.00% 100.00% 100.00%Cost of products sold 92.65% 92.55% 94.38% 94.06% 93.24% 91.90% 93.13% 93.13% 93.13% 93.13% 93.13% 93.13% 93.13% 93.13% 93.13% 93.13%Gross Profit 7.35% 7.45% 5.62% 5.94% 6.76% 8.10% 6.87% 6.87% 6.87% 6.87% 6.87% 6.87% 6.87% 6.87% 6.87% 6.87%Selling, general and administrative expenses 3.75% 3.66% 3.09% 3.88% 3.01% 3.26% 3.17% 3.08% 3.00% 2.91% 2.83% 2.75% 2.68% 2.60% 2.53% 2.46%Other expense - net 0.92% 0.61% 0.48% 0.08% -0.46% -0.22%Operating Income 2.68% 3.18% 2.05% 1.99% 4.22% 5.07% 3.70% 3.79% 3.88% 3.96% 4.04% 4.12% 4.20% 4.27% 4.34% 4.41%Income taxes 0.71% 0.92% 0.59% 0.62% 1.31% 1.48% 1.08% 1.11% 1.13% 1.16% 1.18% 1.20% 1.23% 1.25% 1.27% 1.29%Net Earnings 1.97% 2.26% 1.47% 1.37% 2.91% 3.59% 2.62% 2.68% 2.74% 2.80% 2.86% 2.91% 2.97% 3.02% 3.07% 3.12%
AVERAGE SALES GROWTH RATE 6%COST OF GOOD SOLD 93.13%GROSS PROFIT (percent of sales) 6.87%SG&A Average Growth Rate 3.44%OTHER EXPENSE - NETOPERATING INCOME 3.70%INCOME TAXES 1.08%NET EARNINGS 2.26%AVERAGE TAX RATE 26.56% 28.91% 28.50% 31.10% 31.13% 29.28% 29.25%
31.10% 31.13% 29.28 30.50%

100
Cash Flows StatementArcher Daniels Midland Co. 2001/06/30 2002 2003 2004 2005 2006 2007 2008 2009 2010 2011 2012 2013 2014 2015 2016
Operating ActivitiesNet earnings $383,284 $511,093 $451,145 $494,710 $1,044,385 $1,312,070 $1,020,093 $1,111,056 $1,208,720 $1,313,543 $1,426,014 $1,546,655 $1,676,020 $1,814,704 $1,963,337 $2,122,593 NI on I/SAdjustments to reconcile net earnings to net cash provided by operating activitiesDepreciation $572,390 $566,576 $643,615 $685,613 $664,652 $656,714 $689,550 $724,027 $702,306 $681,237 $715,299 $751,064 $728,532 $706,676 $742,010 $779,110 5% growth rateAsset abandonments $0 $82,927 $13,221 $50,576 $41,548 $71,264Deferred income taxes $3,919 ($4,972) $105,086 ($67,505) $241,671 ($105,646)(Gain) loss on marketable securities transactions $56,160 ($38,588) $363 ($23,968) ($113,299) ($39,803)Amortization of long-term debt discount $49,584 $47,494Equity in (earnings) loss of affiliates, net of dividends ($14,138) ($84,930) ($91,280) ($69,334)Stock contributed to employee benefit plans $40,425 $23,263 $23,591 $23,281 $23,840 $25,089Pension and postretirement payments in excess of accruals ($164,141)Other - net ($4,936) $1,631 $130,427 ($59,138) $42,732 $91,410Changes in operating assets and liabilities Segregated cash and investments ($134,434) ($316,423) ($37,319) ($239,842) Receivables ($84,017) ($37,142) ($112,460) ($378,501) ($216,967) ($177,430) $122,411 $133,327 $145,046 $157,625 $171,122 $185,599 $201,122 $217,764 $235,600 $254,711 6% of net earnings Inventories $229,289 ($72,508) ($200,392) ($950,792) $825,486 ($600,588) ($116,582) ($116,582) ($116,582) ($116,582) ($116,582) ($116,582) ($116,582) ($116,582) ($116,582) ($116,582) average of years 1995 - 2002 leaving out volatile outliers of 2003-2006 Other assets $1,557 ($44,197) ($39,061) ($6,724) ($35,056) ($28,246) Accounts payable and accrued expenses ($376,082) $481,011 $202,213 $667,140 ($264,214) $644,524 ($418,941) $699,630 ($454,760) $759,449 ($493,642) $824,382 ($535,848) $894,866 ($581,663) $971,377 3 year cyclical patternTotal Operating Activities $871,573 $1,516,588 $1,069,176 $33,339 $2,126,179 $1,376,041 $1,417,322 $2,636,219 $1,449,921 $1,493,418 $2,777,758 $1,527,767 $1,573,600 $2,926,896 $1,609,793 $1,658,086 3% growth rate
Investing Activities Too Volatile, Not ForecastablePurchases of property, plant, and equipment ($273,168) ($349,637) ($435,952) ($509,237) ($623,819) ($762,009)Proceeds from sales of property, plant, and equipment $40,061 $57,226 $43,611 $53,704Net assets of businesses acquired ($124,639) ($40,012) ($526,970) ($93,022) ($24,238) ($182,213)Investments in and advances to affiliates ($147,735) $2,963 ($130,096) ($112,984) ($112,018) ($125,625)Distributions from affiliates, excluding dividends $40,113 $122,778 $157,824 $57,690Purchases of marketable securities ($460,195) ($455,908) ($328,852) ($857,786) ($1,433,412) ($684,940)Proceeds from sales of marketable securities $838,859 $434,826 $271,340 $786,492 $1,674,180 $581,489Other - net ($30,922) $404 $11,258 $32,098 $16,364 ($6,637)Total Investing Activities ($197,800) ($407,364) ($1,059,098) ($574,435) ($301,508) ($1,068,541)
Financing Activities Too Volatile, Not ForecastableLong-term debt borrowings $429,124 $7,621 $517,222 $4,366 $18,547 $643,544Long-term debt payments ($41,702) ($459,826) ($315,319) ($32,381) ($185,913) ($265,988)Net borrowings (payments) under line of credit agreements ($674,350) ($174,399) $281,669 $483,764 ($1,357,456) $104,548Purchases of treasury stock ($62,932) ($184,519) ($101,212) ($4,113) ($139,112) ($1,585)Cash dividends ($125,053) ($130,000) ($155,565) ($174,109) ($209,425) ($241,995)Proceeds from exercises of stock options $1,971 $38,817 $30,901Other $44,409Total Financing Activities ($474,913) ($941,123) $228,766 $316,344 ($1,842,458) $283,933
Increase (Decrease) in Cash and Cash Equivalents $198,860 $168,101 $238,844 ($224,752) ($17,787) $590,433
Cash and Cash Equivalents - Beginning of Year $477,226 $676,086 $526,115 $764,959 $540,207 $522,420
Cash and Cash Equivalents - End of Year $676,086 $844,187 $764,959 $540,207 $522,420 $1,112,853

101
common size cash flows
2001/06/30 2002 2003 2004 2005 2006 2007 2008 2009 2010 2011 2012 2013 2014 2015 2016
Operating ActivitiesNet earnings 43.98% 33.70% 42.20% 1483.88% 49.12% 95.35% 71.97% 42.15% 83.36% 87.96% 51.34% 101.24% 106.51% 62.00% 121.96% 128.01%Adjustments to reconcile net earnings to net cash provid 0.00% 0.00% 0.00% 0.00% 0.00% 0.00% 0.00% 0.00% 0.00% 0.00% 0.00% 0.00% 0.00% 0.00% 0.00% 0.00%Depreciation 65.67% 37.36% 60.20% 2056.49% 31.26% 47.72% 48.65% 27.46% 48.44% 45.62% 25.75% 49.16% 46.30% 24.14% 46.09% 46.99%Asset abandonments 0.00% 5.47% 1.24% 151.70% 1.95% 5.18% 0.00% 0.00% 0.00% 0.00% 0.00% 0.00% 0.00% 0.00% 0.00% 0.00%Deferred income taxes 0.45% -0.33% 9.83% -202.48% 11.37% -7.68% 0.00% 0.00% 0.00% 0.00% 0.00% 0.00% 0.00% 0.00% 0.00% 0.00%(Gain) loss on marketable securities transactions 6.44% -2.54% 0.03% -71.89% -5.33% -2.89% 0.00% 0.00% 0.00% 0.00% 0.00% 0.00% 0.00% 0.00% 0.00% 0.00%Amortization of long-term debt discount 5.69% 3.13% 0.00% 0.00% 0.00% 0.00% 0.00% 0.00% 0.00% 0.00% 0.00% 0.00% 0.00% 0.00% 0.00% 0.00%Equity in (earnings) loss of affiliates, net of dividends 0.00% 0.00% -1.32% -254.75% -4.29% -5.04% 0.00% 0.00% 0.00% 0.00% 0.00% 0.00% 0.00% 0.00% 0.00% 0.00%Stock contributed to employee benefit plans 4.64% 1.53% 2.21% 69.83% 1.12% 1.82% 0.00% 0.00% 0.00% 0.00% 0.00% 0.00% 0.00% 0.00% 0.00% 0.00%Pension and postretirement payments in excess of accru 0.00% 0.00% 0.00% 0.00% 0.00% -11.93% 0.00% 0.00% 0.00% 0.00% 0.00% 0.00% 0.00% 0.00% 0.00% 0.00%Other - net -0.57% 0.11% 12.20% -177.38% 2.01% 6.64% 0.00% 0.00% 0.00% 0.00% 0.00% 0.00% 0.00% 0.00% 0.00% 0.00%Changes in operating assets and liabilities 0.00% 0.00% 0.00% 0.00% 0.00% 0.00% 0.00% 0.00% 0.00% 0.00% 0.00% 0.00% 0.00% 0.00% 0.00% 0.00% Segregated cash and investments 0.00% 0.00% -12.57% -949.11% -1.76% -17.43% 0.00% 0.00% 0.00% 0.00% 0.00% 0.00% 0.00% 0.00% 0.00% 0.00% Receivables -9.64% -2.45% -10.52% -1135.31% -10.20% -12.89% 8.64% 5.06% 10.00% 10.55% 6.16% 12.15% 12.78% 7.44% 14.64% 15.36% Inventories 26.31% -4.78% -18.74% -2851.89% 38.82% -43.65% -8.23% -4.42% -8.04% -7.81% -4.20% -7.63% -7.41% -3.98% -7.24% -7.03% Other assets 0.18% -2.91% -3.65% -20.17% -1.65% -2.05% 0.00% 0.00% 0.00% 0.00% 0.00% 0.00% 0.00% 0.00% 0.00% 0.00% Accounts payable and accrued expenses -43.15% 31.72% 18.91% 2001.08% -12.43% 46.84% -29.56% 26.54% -31.36% 50.85% -17.77% 53.96% -34.05% 30.57% -36.13% 58.58%Total Operating Activities 100.00% 100.00% 100.00% 100.00% 100.00% 100.00% 100.00% 100.00% 100.00% 100.00% 100.00% 100.00% 100.00% 100.00% 100.00% 100.00%
Investing Activities Too VolatilePurchases of property, plant, and equipmentProceeds from sales of property, plant, and equipmentNet assets of businesses acquiredInvestments in and advances to affiliatesDistributions from affiliates, excluding dividendsPurchases of marketable securitiesProceeds from sales of marketable securitiesOther - netTotal Investing Activities
Financing Activities Too VolatileLong-term debt borrowingsLong-term debt paymentsNet borrowings (payments) under line of credit agreementsPurchases of treasury stockCash dividendsProceeds from exercises of stock optionsOtherTotal Financing ActivitiesIncrease (Decrease) in Cash and Cash Equivalents
Cash and Cash Equivalents - Beginning of Year
Cash and Cash Equivalents - End of Year

102
Ratio Analysis (ADM raw numbers in THOUSANDS)
2001 2002 2003 2004 2005 2006 2007 2008 2009 2010 2011 2012 2013 2014 2015 2016
Current Ratio 1.56 1.59 1.64 1.53 1.81 1.92 1.90 1.90 1.97 1.97 2.00 2.00 2.00 2.00 2.00 2.00Quick Asset Ratio 0.78 0.80 0.79 0.68 0.86 0.91 0.81 0.83 0.91 0.86 0.88 0.95 0.91 0.93 1.00 0.97Accounts Rec. Turnover 6.84 9.36 9.25 8.95 8.76 8.18 7.85 7.52 7.21 6.91 6.62 6.35 6.08 5.83 5.59 5.36Days Supply Receivables 53.38 39.01 39.47 40.80 41.66 44.59 46.53 48.54 50.64 52.84 55.13 57.51 60.01 62.61 65.32 68.15Inventory Turnover 5.60 8.86 8.16 7.41 8.58 7.19 8.04 8.04 8.04 8.04 8.04 8.04 8.04 8.04 8.04 8.04Days Supply Inventory 65.22 41.19 44.71 49.29 42.55 50.77 45.40 45.40 45.40 45.40 45.40 45.40 45.40 45.40 45.40 45.40Working Capital Turnover 7.37 9.90 9.38 10.07 8.27 6.46 6.28 6.19 5.67 5.59 5.32 5.24 5.17 5.09 5.01 4.94Gross Profit Margin 7.35% 7.45% 5.62% 5.94% 6.76% 8.10% 6.87% 6.87% 6.87% 6.87% 6.87% 6.87% 6.87% 6.87% 6.87% 6.87%Operating Expense Ratio 4.67% 4.27% 3.57% 3.96% 2.55% 3.03% 3.17% 3.08% 3.00% 2.91% 2.83% 2.75% 2.68% 2.60% 2.53% 2.46%Net Profit Margin 1.97% 2.26% 1.47% 1.37% 2.91% 3.59% 2.62% 2.68% 2.74% 2.80% 2.86% 2.91% 2.97% 3.02% 3.07% 3.12%Asset Turnover 1.26 1.58 1.79 1.87 1.93 1.72 1.70 1.67 1.64 1.62 1.60 1.57 1.55 1.53 1.50 1.48Return on Assets 2.49% 3.56% 2.63% 2.55% 5.62% 6.17% 4.44% 4.48% 4.51% 4.54% 4.56% 4.58% 4.60% 4.61% 4.62% 4.62%Return on Equity 5.67% 8.07% 6.38% 6.43% 12.38% 13.38% 10.24% 10.32% 10.40% 10.46% 10.52% 10.56% 10.60% 10.62% 10.64% 10.65%Debt to Equity Ratio 1.28 1.27 1.43 1.52 1.21 1.17 1.31 1.31 1.31 1.31 1.31 1.31 1.31 1.31 1.31 1.31Times Interest Earned 0.31 1.02 0.75 1.10 3.64 4.08 #DIV/0! #DIV/0! #DIV/0! #DIV/0! #DIV/0! #DIV/0! #DIV/0! #DIV/0! #DIV/0! #DIV/0! Interest Expense Not ForecastableDebt Service Margin 2.85 3.97 34.61 0.21 9.54 17.25 #DIV/0! #DIV/0! #DIV/0! #DIV/0! #DIV/0! #DIV/0! #DIV/0! #DIV/0! #DIV/0! #DIV/0! Current Portion of long term debt not forecastable
Recurring NOPAT margin 3.60% 3.79% 2.54% 2.06% 3.76% 4.85% 3.70% 3.79% 3.88% 3.96% 4.04% 4.12% 4.20% 4.27% 4.34% 4.41%EBITDA margin 7.66% 7.26% 5.32% 4.83% 6.98% 7.86% 5.47% 5.54% 5.47% 5.41% 5.47% 5.53% 5.49% 5.45% 5.50% 5.56%Net Long-term Asset turnover 2.42 2.76 3.51 4.00 4.04 3.88 3.94 3.88 4.01 3.95 3.99 3.93 3.87 3.81 3.76 3.70PP&E Turnover 3.98 4.60 5.62 6.88 6.93 6.91 6.05 6.18 6.33 6.48 6.39 6.29 6.20 6.10 6.01 5.92Operating Cash Flow Ratio 0.18 0.39 0.21 0.00 0.40 0.22 0.21 0.35 0.18 0.17 0.30 0.15 0.14 0.25 0.13 0.12
Dividend Payout Ratio 0.33 0.25 0.34 0.35 0.20 0.18 0.00 0.00 0.00 0.00 0.00 0.00 0.00 0.00 0.00 0.00 no dividend payout ratio
IGR 3.82% 6.02% 4.18% 4.16% 9.90% 10.91% 10.24% 10.32% 10.40% 10.46% 10.52% 10.56% 10.60% 10.62% 10.64% 10.65%SGR 8.72% 13.63% 10.16% 10.48% 21.83% 23.66% 23.59% 23.79% 23.97% 24.12% 24.24% 24.35% 24.43% 24.49% 24.53% 24.56%
2001 2002 2003 2004 2005 2006Interest Expense $398,131 $355,956 $359,971 $341,991 $326,580 $365,180

103
Ratio Analysis
2001 2002 2003 2004 2005 2006
Current Ratio #DIV/0! 1.44 1.63 1.71 1.81Quick Asset Ratio #DIV/0! 0.43 0.50 0.60 0.57Accounts Rec. Turnover #DIV/0! 11.89 14.83 13.05 14.26Days Supply Receivables #DIV/0! 30.71 24.62 27.96 25.59Inventory Turnover 7.55 5.21 7.28 8.83 8.20Days Supply Inventory 48.33 70.04 50.17 41.33 44.52Working Capital Turnover #DIV/0! 8.39 8.93 9.10 8.24Gross Profit Margin 8.59% 9.64% 5.89% 7.49% 6.47%Operating Expense Ratio 3.74% 4.17% 3.12% 3.46% 3.94%Net Profit Margin 1.19% 1.84% 1.85% 1.86% 2.18%Asset Turnover 2.08 1.66 2.24 2.31 2.12Return on Assets 2.46% 3.05% 4.16% 4.30% 4.63%Return on Equity 9.74% 17.32% 17.29% 13.90% 12.54%Debt to Equity Ratio 0.00 4.67 3.16 2.23 1.71Times Interest Earned 1.18 2.73 3.36 4.22 2.25Debt Service Margin #DIV/0! 0.51 -0.32 5.73 2.15
2001 2002 2003 2004 2005 2006
Current Ratio 1.06 1.49 1.59 1.71 1.81 1.62Quick Asset Ratio 0.26 0.33 0.42 0.64 0.56 0.51Accounts Rec. Turnover 15.61 19.96 20.33 8.25 9.12 9.81Days Supply Receivables 23.38 18.28 17.96 44.23 40.00 37.22Inventory Turnover 4.20 5.27 4.89 3.10 4.03 4.11Days Supply Inventory 86.95 69.23 74.64 117.78 90.61 88.76Working Capital Turnover 58.69 12.01 8.79 5.10 5.39 6.34Gross Profit Margin 15.06% 15.62% 19.27% 25.53% 24.59% 24.27%Operating Expense Ratio 9.07% 9.51% 11.63% 15.56% 14.96% 16.73%Net Profit Margin 2.55% 3.07% 3.91% 7.43% 5.58% 4.61%Asset Turnover 1.52 1.16 0.94 0.76 0.88 0.97Return on Assets 3.88% 3.56% 3.67% 5.67% 4.92% 4.46%Return on Equity 16.04% 18.18% 16.77% 16.76% 13.20% 11.48%Debt to Equity Ratio 3.14 2.61 2.26 1.94 1.68 1.57Times Interest Earned 3.54 3.88 5.49 1.55 1.45 2.87Debt Service Margin 1.28 10.52 1.40 1.52 9.49 2.53
2001 2002 2003 2004 2005 2006
Current Ratio #DIV/0! 1.46 1.61 1.71 1.81 1.62Quick Asset Ratio #DIV/0! 0.38 0.46 0.62 0.56 0.51Accounts Rec. Turnover #DIV/0! 15.92 17.58 10.65 11.69 9.81Days Supply Receivables #DIV/0! 24.50 21.29 36.10 32.80 37.22Inventory Turnover 5.87 5.24 6.08 5.97 6.11 4.11Days Supply Inventory 67.64 69.63 62.40 79.55 67.56 88.76Working Capital Turnover #DIV/0! 10.20 8.86 7.10 6.81 6.34Gross Profit Margin 11.82% 12.63% 12.58% 16.51% 15.53% 24.27%Operating Expense Ratio 6.41% 6.84% 7.38% 9.51% 9.45% 16.73%Net Profit Margin 1.87% 2.46% 2.88% 4.64% 3.88% 4.61%Asset Turnover 1.80 1.41 1.59 1.54 1.50 0.97Return on Assets 3.17% 3.31% 3.91% 4.99% 4.77% 4.46%Return on Equity 12.89% 17.75% 17.03% 15.33% 12.87% 11.48%Debt to Equity Ratio 1.57 3.64 2.71 2.09 1.70 1.57Times Interest Earned 2.36 3.31 4.43 2.89 1.85 2.87Debt Service Margin #DIV/0! 5.52 0.54 3.62 5.82 2.53
Bunge Ltd.
Conagra Food Inc.
Industry
Extended Ratio Analysis
2001 2002 2003 2004 2005 2006
Recurring NOPAT margin 3.68% 4.71% 2.76% 3.59% 2.01%EBITDA margin 3.78% 4.68% 4.09% 4.43% 3.28%Net Long-term Asset turnover #DIV/0! 4.79 6.39 5.94 4.97PP&E Turnover #DIV/0! 6.75 10.61 9.92 8.37Operating Cash Flow Ratio #DIV/0! 0.03 (0.01) 0.21 0.11Dividend Payout Ratio 0.06 0.15 0.10 0.11 0.12
IGR 0.09 0.15 0.16 0.12 0.11SGR 0.09 0.84 0.65 0.40 0.30
2001 2002 2003 2004 2005 2006
Recurring NOPAT margin 4.29% 4.53% 6.24% 7.46% 10.29% 11.09%EBITDA margin 7.61% 8.21% 9.53% 7.01% 7.63% 8.81%Net Long-term Asset turnover 2.75 1.64 1.32 1.19 1.39 1.61PP&E Turnover 6.45 7.38 7.04 6.31 6.71 6.84Operating Cash Flow Ratio 0.02 0.51 0.19 0.19 0.42 0.36Dividend Payout Ratio 0.67 0.62 0.66 0.66 0.86 1.06
IGR 0.05 0.07 0.06 0.06 0.02 -0.01SGR 0.22 0.25 0.19 0.17 0.05 -0.02
2001 2002 2003 2004 2005 2006
Recurring NOPAT margin 3.99% 4.62% 4.50% 5.53% 6.15% 11.09%EBITDA margin 5.69% 6.44% 6.81% 5.72% 5.45% 8.81%Net Long-term Asset turnover #DIV/0! 3.21 3.86 3.57 3.18 1.61PP&E Turnover #DIV/0! 7.07 8.82 8.12 7.54 6.84Operating Cash Flow Ratio #DIV/0! 0.27 0.09 0.20 0.26 0.36Dividend Payout Ratio 0.37 0.38 0.38 0.39 0.49 1.06
IGR 0.07 0.11 0.11 0.09 0.06 -0.01SGR 0.15 0.55 0.42 0.28 0.17 -0.02
Competitor Extended Ratio Info
2001 2002 2003 2004 2005 2006
taxes $68 $104 $201 $289 ($82)depreciation $163 $168 $184 $212 $278Long term assets $2,900 $3,466 $4,239 $4,882PPE net $2,056 $2,090 $2,536 $2,900Dividends $8 $37 $42 $51 $63
2001 2002 2003 2004 2005 2006
taxes $412.80 $460.00 $416.00 $319.30 $408.00 $309.70depreciation $407.40 $537.00 $375.00 $269.80 $286.90 $311.20Long term assets $9,118.00 $15,571.00 $15,071.00 $9,156.60 $8,268.00 $7,180.10PPE net $3,884.70 $3,449.90 $2,819.80 $1,731.20 $1,715.10 $1,691.80Dividends $429.00 $483.00 $509.00 $536.70 $550.30 $565.30
2001 2002 2003 2004 2005 2006
taxes $480.80 $564.00 $617.00 $608.30 $326.00 $309.70depreciation $570.40 $705.00 $559.00 $481.80 $564.90 $311.20Long term assets $9,118.00 $18,471.00 $18,537.00 $13,395.60 $13,150.00 $7,180.10PPE net $3,884.70 $5,505.90 $4,909.80 $4,267.20 $4,615.10 $1,691.80Dividends $437.00 $520.00 $551.00 $587.70 $613.30 $565.30
Conagra Food Inc.
Industry
Conagra Food Inc.
Bunge Ltd.
Industry
Bunge Ltd.

104
P/E; M/B; P/S; PEG2001 2002 2003 2004 2005 2006 2007 2008 2009 2010 2011 2012 2013 2014 2015 2016
pps $14.69 $14.00 $14.35 $18.87 $24.49 $36.61eps $0.61 $0.79 $0.70 $0.76 $1.61 $2.00 $1.56 $1.69 $1.84 $2.00 $2.17 $2.36 $2.56 $2.77 $2.99 $3.24dps 0.19 0.2 0.24 0.3 0.34 0.4 0.44 0.48 0.52 0.56 0.6 0.64 0.68 0.72 0.76 0.8bps $24.42 $22.15 $26.65 $29.76 $28.59 $32.44 $35.03 $37.83 $40.86 $44.13 $47.66 $51.47 $55.59 $60.04 $64.84 $70.03
2005 2006P/EP/B
Price/SalesPEG
Enterprise Value/EBITDA
$8,433,472 $9,806,880MVEBVL $8,661,452 $8,011,248 $10,113,682 $11,670,605 $10,164,633 $11,462,150 $13,005,529 $14,045,971 $15,169,649 $16,383,221 $17,693,878 $19,109,388 $20,638,140 $22,289,191 $24,072,326 $25,998,112
Cash $844,187 $676,068 $764,959 $540,207 $522,420 $1,112,853 $612,069 $636,552 $1,183,987 $651,193 $677,240 $1,259,667 $692,817 $720,530 $1,340,185 $737,102Sales $19,483,211 $22,611,894 $30,708,033 $36,151,394 $35,943,810 $36,596,111 $36,596,111 $36,596,111 $36,596,111 $36,596,111 $36,596,111 $36,596,111 $36,596,111 $36,596,111 $36,596,111 $36,596,111
# of shares outstanding 631,272 647,409 644,805 650,935 650,527 655,720 655,720 655,720 655,720 655,720 655,720 655,720 655,720 655,720 655,720 655,720stock price $14.69 $14.00 $14.35 $18.87 $24.49 $36.61
Interest Expense $398,131 $355,956 $359,971 $341,991 $326,580 $365,180 $357,968 $357,968 $357,968 $357,968 $357,968 $357,968 $357,968 $357,968 $357,968 $357,968EBIT $521,899 $718,937 $630,973 $718,011 $1,516,375 $1,855,250 $1,441,738 $1,570,301 $1,708,334 $1,856,484 $2,015,444 $2,185,950 $2,368,788 $2,564,795 $2,774,864 $2,999,947
Depreciation $572,390 $566,576 $643,615 $685,613 $664,652 $656,714 $689,550 $724,027 $702,306 $681,237 $715,299 $751,064 $728,532 $706,676 $742,010 $779,110
EBITDA $1,492,420 $1,641,469 $1,634,559 $1,745,615 $2,507,607 $2,877,144 $2,489,256 $2,652,296 $2,768,608 $2,895,689 $3,088,711 $3,294,982 $3,455,288 $3,629,439 $3,874,842 $4,137,026Enterprise Value $7,817,265 $7,335,180 $9,348,723 $11,130,398 $9,642,213 $10,349,297 $12,393,460 $13,409,419 $13,985,662 $15,732,028 $17,016,638 $17,849,721 $19,945,323 $21,568,661 $22,732,141 $25,261,010
Assets $15,416,273 $14,339,931 $17,182,879 $19,368,821 $18,598,105 $21,269,030 $22,970,552 $24,808,197 $26,792,852 $28,936,281 $31,251,183 $33,751,278 $36,451,380 $39,367,490 $42,516,889 $45,918,241Earnings $383,284 $511,093 $451,145 $494,710 $1,044,385 $1,312,070 $1,020,093 $1,111,056 $1,208,720 $1,313,543 $1,426,014 $1,546,655 $1,676,020 $1,814,704 $1,963,337 $2,122,593
BG Dps 0.385 0.42 0.48 0.56 0.62CAG Dps 0.888 0.953 1.004 1.053 1.092 0.813

105
Forward P/E (2006) Forward P/E (2006)# of shares Earnings PPS EPS P/E IND AVG. ADM Share Price PPS EPS P/E IND AVG. ADM Share Price
ADM 655,720 $1,312,070 $36.61 $2.00 $18.30 $49.57 ADM $36.61 $2.00 $18.30 $49.57CAG 509,540 $534,000 $25.96 $1.05 $24.77 $24.77 CAG $25.96 $1.05 $24.77 $24.77BG 119,780 - $64.57 - BG $64.57 -
Trailing P/E (2005)Trailing P/E (2005) # of shares Earnings PPS EPS P/E IND AVG. ADM Share Price PPS EPS P/E IND AVG. ADM Share PriceADM 650,527 $1,044,385 $24.49 $1.61 $15.25 $24.30 ADM $24.49 $1.61 $15.25 $24.30CAG 518,540 $641,500 $23.30 $1.24 $18.83 $15.14 CAG $23.30 $1.24 $18.83 $15.14BG 119,240 $530,000 $50.84 $4.44 $11.44 BG $50.84 $4.44 $11.44
P/B # of shares Earnings PPS BPS P/B IND AVG. ADM Share Price P/BADM 655,720 $21,269,030 $36.61 $32.44 $1.13 $35.84 PPS BPS P/B IND AVG. ADM Share PriceCAG 509,540 $11,970,400 $25.96 $23.49 $1.11 $1.11 ADM $36.61 $32.44 $1.13 $35.84BG 119,780 - $64.57 - CAG $25.96 $23.49 $1.11 $1.11
BG $64.57 -Price/Sales # of shares Sales PPS SPS P/S IND AVG. ADM Share PriceADM 655,720 $36,596,111 $36.61 $55.81 $0.66 $63.75 Price/SalesCAG 509,540 $11,579,400 $25.96 $22.73 $1.14 $1.14 PPS SPS P/S IND AVG. ADM Share PriceBG 119,780 ADM $36.61 $55.81 $0.66 $63.75
CAG $25.96 $22.73 $1.14 $1.14PEG # of shares Growth Rate PPS EPS PEG IND AVG. ADM Share Price BGADM 655,720 0.1994 $36.61 $2.00 $91.76 $29.15CAG 509,540 0.339 $25.96 $1.05 $73.07 $73.07 PEGBG 119,780 $64.57 - PPS EPS PEG IND AVG. ADM Share Price
ADM $36.61 $2.00 $91.76 $29.15Enterprise Value/EBITDA CAG $25.96 $1.05 $73.07 $73.07
BG $64.57 -ADM 11.94 19.82 $69.49
ADM CAGBVL $11,462,150 $7,320,000CASH $1,112,853 $332,000EBITDA $2,877,144 $1,020,200BVE $24,005,909 $13,227,658
ADM Share PriceForward P/E (2006) $49.57Trailing P/E (2005) $24.30P/B $35.84Price/Sales $63.75PEG $29.15Enterprise Value/EBITDA $69.49
Enterprise Value/Recurring NOPAT
19.38 15.74 $36.98
ADM CAGBVL $11,462,150 $7,320,000CASH $1,112,853 $332,000EBITDA $1,773,131 $1,284,000BVE $24,005,909 $13,227,658
Formula Data
Calculated Multiples ADM Share Price
Calculated Multiples
Formula Data
ADM Share Price

106
Long Run Residual Income Perpetuity
0.0778 Kd 0.0580 Ke 0.0953
2 3 4 5 6 7 8 9 102008 2009 2010 2011 2012 2013 2014 2015 2016
16.08 17.29 18.61 20.06 21.63 23.35 25.23 27.27 29.51$1.69 $1.84 $2.00 $2.17 $2.36 $2.56 $2.77 $2.99 $3.24
0.48 0.52 0.56 0.6 0.64 0.68 0.72 0.76 0.817.29 18.61 20.06 21.63 23.35 25.23 27.27 29.51 31.94
0.105 0.107 0.108 0.108 0.109 0.109 0.110 0.110 0.1100.076 0.077 0.078 0.079 0.079 0.080 0.081 0.082 0.083
Ke0.0500 0.0600 0.0685 0.0810 0.09 0.0953 0.1 0.11
0.06 (71.77) N/A 84.44 34.18 23.92 20.33 17.94 14.350.078817839 (15.14) (23.18) (42.28) 199.89 39.01 26.46 20.59 13.99
Growth 0.09 (6.72) (8.96) (12.51) (29.88) N/A 50.74 26.89 13.450.1 (2.39) (2.98) (3.79) (6.28) (11.93) (25.39) N/A 11.93
0.11 0.50 0.61 0.73 1.04 1.51 2.06 3.03 N/A
$36.61
Sensitivity Analysis
Overvalued < 32.95Fairly Valued +/- 10%
Observed Share Price

107
Residual Income
WACC (AT) 0.0778 Kd 0.0580 Ke 0.0953
0 1 2 3 4 5 6 7 8 9 10 112006 2007 2008 2009 2010 2011 2012 2013 2014 2015 2016 2017
EPS (Earnings Per Share) $1.56 $1.69 $1.84 $2.00 $2.17 $2.36 $2.56 $2.77 $2.99 $3.24DPS (Dividends Per Share) 0.44 0.48 0.52 0.56 0.6 0.64 0.68 0.72 0.76 0.8 0.84BPS (Book Value Equity per Share) $14.96 $16.07 $17.29 $18.61 $20.05 $21.63 $23.35 $25.22 $27.27 $29.50 $31.94Cash From Operations $1,417,322 $2,636,219 $1,449,921 $1,493,418 $2,777,758 $1,527,767 $1,573,600 $2,926,896 $1,609,793 $1,658,086Cash Investments $516,853 $250,001 $582,254 $1,356,070 $655,931 $317,274 $738,931 $1,720,970 $832,433 $402,648
EPS (Earnings Per Share) $1.56 $1.69 $1.84 $2.00 $2.17 $2.36 $2.56 $2.77 $2.99 $3.24Normal Earnings (Notice "Lag") $1.43 $1.53 $1.65 $1.77 $1.91 $2.06 $2.22 $2.40 $2.60 $2.81Residual Income $0.13 $0.16 $0.20 $0.23 $0.26 $0.30 $0.33 $0.36 $0.40 $0.43PV Factor 0.912991874 0.833554163 0.761028177 0.694812542 0.634358205 0.579163887 0.528771923 0.482764469 0.440760037 0.402410332PV of Residual Income $0.12 $0.14 $0.15 $0.16 $0.17 $0.17 $0.18 $0.18 $0.17 $0.17 0.171Total PV of Annual Residual Income $1.60 9.25%Continuing (Terminal) Value Perpetuity 1.796041714PV of Terminal Value Perpetuity 0.722745743 4.18%BPS (Book Value Equity per Share) 14.96 86.56%Estimated Price per Share (Nov 1 2006) $17.28 100.00%
Value PercentLogical Test for Growth in Perpetuity Ke
0.06 0.065 0.075 0.0953 0.1Observed Share Price (Nov 1 2006) 36.61 0 29.88 27.09 22.81 17.28 16.36
0.01 31.5 28.2 23.34 17.37 16.42Initial Ke Growth 0.02 33.92 29.82 24.07 17.49 16.48
0 0.03 37.96 32.35 25.11 17.65 16.56growth 0.04 46.04 36.9 26.76 17.85 16.68
$36.61
net income $1,020,093 $1,963,337 $2,122,593$1,111,056 $1,208,720 $1,313,543 $1,426,014 $1,546,655 $1,676,020 $1,814,704
Investments $516,853 $832,433 $402,648$250,001 $582,254 $1,356,070 $655,931 $317,274 $738,931 $1,720,970
Undervalued > 40.27
Sensitivity Analysis
Observed Share PriceOvervalued < 32.95Fairly Valued +/- 10%

108
AEG
WACC (AT) 0.0778 Kd 0.0580 Ke 0.0953
0 1 2 3 4 5 6 7 8 9 10 112006 2007 2008 2009 2010 2011 2012 2013 2014 2015 2016 2017
EPS (Earnings Per Share) $1.56 $1.69 $1.84 $2.00 $2.17 $2.36 $2.56 $2.77 $2.99 $3.24DPS (Dividends Per Share) 0.44 0.48 0.52 0.56 0.6 0.64 0.68 0.72 0.76 0.8 0.84BPS (Book Value Equity per Share) $14.96 $16.07 $17.29 $18.61 $20.05 $21.63 $23.35 $25.22 $27.27 $29.50 $31.94Cash From Operations $1,417,322 $2,636,219 $1,449,921 $1,493,418 $2,777,758 $1,527,767 $1,573,600 $2,926,896 $1,609,793 $1,658,086Cash Investments $516,853 $250,001 $582,254 $1,356,070 $655,931 $317,274 $738,931 $1,720,970 $832,433 $402,648
EPS (Earnings Per Share) $1.56 $1.69 $1.84 $2.00 $2.17 $2.36 $2.56 $2.77 $2.99 $3.24Normal Earnings (Notice "Lag") $1.43 $1.53 $1.65 $1.77 $1.91 $2.06 $2.22 $2.40 $2.60 $2.81Residual Income $0.13 $0.16 $0.20 $0.23 $0.26 $0.30 $0.33 $0.36 $0.40 $0.43PV Factor 0.912991874 0.833554163 0.761028177 0.694812542 0.634358205 0.579163887 0.528771923 0.482764469 0.440760037 0.402410332PV of Residual Income $0.12 $0.14 $0.15 $0.16 $0.17 $0.17 $0.18 $0.18 $0.17 $0.17 0.171Total PV of Annual Residual Income $1.60 9.25%Continuing (Terminal) Value Perpetuity 1.796041714PV of Terminal Value Perpetuity 0.722745743 4.18%BPS (Book Value Equity per Share) 14.96 86.56%Estimated Price per Share (Nov 1 2006) $17.28 100.00%
Value PercentLogical Test for Growth in Perpetuity Ke
0.06 0.065 0.075 0.0953 0.1Observed Share Price (Nov 1 2006) 36.61 0 29.88 27.09 22.81 17.28 16.36
0.01 31.5 28.2 23.34 17.37 16.42Initial Ke Growth 0.02 33.92 29.82 24.07 17.49 16.48
0 0.03 37.96 32.35 25.11 17.65 16.56growth 0.04 46.04 36.9 26.76 17.85 16.68
$36.61
net income $1,020,093 $1,963,337 $2,122,593$1,111,056 $1,208,720 $1,313,543 $1,426,014 $1,546,655 $1,676,020 $1,814,704
Investments $516,853 $832,433 $402,648$250,001 $582,254 $1,356,070 $655,931 $317,274 $738,931 $1,720,970
Undervalued > 40.27
Sensitivity Analysis
Observed Share PriceOvervalued < 32.95Fairly Valued +/- 10%

109
Discounted Dividends
WACC (AT) 0.0778 Kd 0.0580 Ke 0.0953
0 1 2 3 4 5 6 7 8 9 10 112006 2007 2008 2009 2010 2011 2012 2013 2014 2015 2016 2017
EPS (Earnings Per Share) $1.56 $1.69 $1.84 $2.00 $2.17 $2.36 $2.56 $2.77 $2.99 $3.24DPS (Dividends Per Share) 0.44 0.48 0.52 0.56 0.6 0.64 0.68 0.72 0.76 0.8 0.84BPS (Book Value Equity per Share) $14.96Cash From Operations $1,417,322 $2,636,219 $1,449,921 $1,493,418 $2,777,758 $1,527,767 $1,573,600 $2,926,896 $1,609,793 $1,658,086Cash Investments $516,853 $250,001 $582,254 $1,356,070 $655,931 $317,274 $738,931 $1,720,970 $832,433 $402,648
PV Factor 0.912991874 0.833554163 0.761028177 0.694812542 0.634358205 0.579163887 0.528771923 0.482764469 0.440760037 0.402410332PV of Dividends 0.402 0.400 0.396 0.389 0.381 0.371 0.360 0.348 0.335 0.322Total PV of Annual Dividends $3.70Continuing (Terminal) Value Perpetuity 8.814270724PV of Terminal Value Perpetuity $3.55Estimated Share Value at end of 2006 $7.25
Value of FirmBook Value of Liabilities KeEstimated Market Value of Equity 0.058 0.065 0.0953 0.1 0.11Number of Shares 0 11.45 10.84 7.25 6.86 6.14Observed Price per Share (end of 2006) 0.01 12.64 11.96 7.66 7.22 6.41Assume Dividend Perpetuity Grows at 2% per year Growth 0.02 14.32 13.54 8.19 7.67 6.74
for initial perpetuity 0.03 16.88 15.93 8.88 8.25 7.150.04 21.24 20.01 9.81 9.02 7.68
g 0
$36.61
net income $1,020,093 $1,963,337 $2,122,593$1,111,056 $1,208,720 $1,313,543 $1,426,014 $1,546,655 $1,676,020 $1,814,704
Investments $516,853 $832,433 $402,648$250,001 $582,254 $1,356,070 $655,931 $317,274 $738,931 $1,720,970
Undervalued > 40.27
Sensitivity Analysis
Observed Share PriceOvervalued < 32.95Fairly Valued +/- 10%
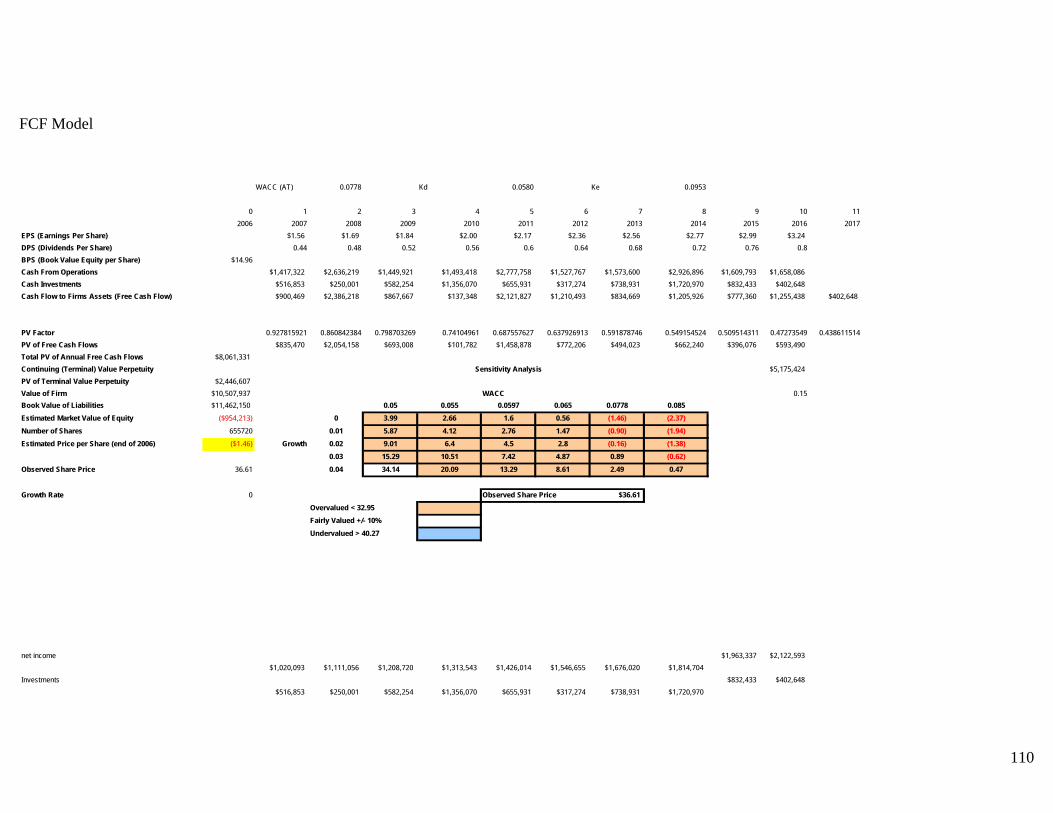
110
FCF Model
WACC (AT) 0.0778 Kd 0.0580 Ke 0.0953
0 1 2 3 4 5 6 7 8 9 10 112006 2007 2008 2009 2010 2011 2012 2013 2014 2015 2016 2017
EPS (Earnings Per Share) $1.56 $1.69 $1.84 $2.00 $2.17 $2.36 $2.56 $2.77 $2.99 $3.24DPS (Dividends Per Share) 0.44 0.48 0.52 0.56 0.6 0.64 0.68 0.72 0.76 0.8BPS (Book Value Equity per Share) $14.96Cash From Operations $1,417,322 $2,636,219 $1,449,921 $1,493,418 $2,777,758 $1,527,767 $1,573,600 $2,926,896 $1,609,793 $1,658,086Cash Investments $516,853 $250,001 $582,254 $1,356,070 $655,931 $317,274 $738,931 $1,720,970 $832,433 $402,648Cash Flow to Firms Assets (Free Cash Flow) $900,469 $2,386,218 $867,667 $137,348 $2,121,827 $1,210,493 $834,669 $1,205,926 $777,360 $1,255,438 $402,648
PV Factor 0.927815921 0.860842384 0.798703269 0.74104961 0.687557627 0.637926913 0.591878746 0.549154524 0.509514311 0.47273549 0.438611514PV of Free Cash Flows $835,470 $2,054,158 $693,008 $101,782 $1,458,878 $772,206 $494,023 $662,240 $396,076 $593,490Total PV of Annual Free Cash Flows $8,061,331Continuing (Terminal) Value Perpetuity $5,175,424PV of Terminal Value Perpetuity $2,446,607Value of Firm $10,507,937 WACC 0.15Book Value of Liabilities $11,462,150 0.05 0.055 0.0597 0.065 0.0778 0.085Estimated Market Value of Equity ($954,213) 0 3.99 2.66 1.6 0.56 (1.46) (2.37)Number of Shares 655720 0.01 5.87 4.12 2.76 1.47 (0.90) (1.94)Estimated Price per Share (end of 2006) ($1.46) Growth 0.02 9.01 6.4 4.5 2.8 (0.16) (1.38)
0.03 15.29 10.51 7.42 4.87 0.89 (0.62)Observed Share Price 36.61 0.04 34.14 20.09 13.29 8.61 2.49 0.47
Growth Rate 0 $36.61
net income $1,963,337 $2,122,593$1,020,093 $1,111,056 $1,208,720 $1,313,543 $1,426,014 $1,546,655 $1,676,020 $1,814,704
Investments $832,433 $402,648$516,853 $250,001 $582,254 $1,356,070 $655,931 $317,274 $738,931 $1,720,970
Overvalued < 32.95Fairly Valued +/- 10%Undervalued > 40.27
Sensitivity Analysis
Observed Share Price

111
Cost of Debt (WACC)
6/30/2005 % LT Liabilities Percent of Total Liabilities Interest Rate Computed Interest RateCurrent LiabilitiesShort-term debt 425,808.00 4.19% 5.25% 0.0022Accounts payable 3,399,352.00 33.44% 5.25% 0.0176Accrued expenses 1,318,766.00 12.97% 5.16% 0.0067Current maturities of long term debt 222,938.00 2.19% 6.96% 0.0015Total Current Liabilities 5,366,864.00 52.80%
Long-Term LiabilitesLong term debt 3,530,140.00 73.58% 34.73% 6.96% 0.0242Deferred Income Taxes 779,427.00 16.25% 7.67% 4.00% 0.0031Other 488,202.00 10.18% 4.80% 5.77% 0.0028Total Long Term Liabilities 4,797,769.00 100.00% 47.20%
0.0580 WACDTotal Liabilities 10,164,633.00 100.00% 0.0953 WACE
$11,462,150.00 MVDAverage Tax Rate 29.03% $24,005,909.20 MVE # of shares outstanding * share price
$35,468,059.20 655720 36.61
WACC 0.077801929

112
Cost of Equity Year 1 60 48 36 24SUMMARY OUTPUT Rf 5.16% 5.16% 5.16% 5.16%
R^2 0.1728 0.1219 0.1088 0.1017
Regression Statistics Beta 0.8732 0.8420 1.3868 1.6722Multiple R 0.432205444 Ke 7.02% 6.95% 8.11% 8.71%R Square 0.186801546Adjusted R Square 0.172780883Standard Error 0.072165478Observations 60
ANOVA
df SS MS F Significance FRegression 1 0.069385847 0.069385847 13.32330332 0.00056373Residual 58 0.302055658 0.005207856Total 59 0.371441506
Coefficients Standard Error t Stat P-value Lower 95% Upper 95% Lower 95.0% Upper 95.0%Intercept 0.023967093 0.009318099 2.572101166 0.012691924 0.005314892 0.042619294 0.005314892 0.042619294market premium 0.873249011 0.239239092 3.650110043 0.00056373 0.394359942 1.35213808 0.394359942 1.35213808 5 Year Rf 4.90% 4.90% 4.90% 4.90%
Regression Statistics R^2 0.1746 0.1240 0.1120 0.1026Multiple R 0.434261528 Beta 0.8754 0.8474 1.4100 1.6767R Square 0.188583074 Ke 6.67% 6.61% 7.75% 8.29%Adjusted R Square 0.174593127Standard Error 0.072086386Observations 60
ANOVA
df SS MS F Significance FRegression 1 0.070047581 0.070047581 13.47989913 0.000526826Residual 58 0.301393925 0.005196447Total 59 0.371441506
Coefficients Standard Error t Stat P-value Lower 95% Upper 95% Lower 95.0% Upper 95.0%Intercept 0.024875126 0.00931568 2.670242508 0.009817777 0.006227766 0.043522486 0.006227766 0.043522486market premium 0.875381233 0.238426164 3.671498213 0.000526826 0.398119417 1.35264305 0.398119417 1.35264305
SUMMARY OUTPUT 60 48 36 2410 Year Rf 5.11% 5.11% 5.11% 5.11%
Regression Statistics R^2 0.1777 0.1267 0.1163 0.1048Multiple R 0.437715873 Beta 0.8846 0.8574 1.4347 1.6878R Square 0.191595186 Ke 9.53% 9.40% 12.28% 13.55%Adjusted R Square 0.177657172Standard Error 0.071952463Observations 60
ANOVA
df SS MS F Significance FRegression 1 0.071166404 0.071166404 13.7462328 0.000469729Residual 58 0.300275101 0.005177157Total 59 0.371441506
Coefficients Standard Error t Stat P-value Lower 95% Upper 95% Lower 95.0% Upper 95.0%Intercept 0.025373909 0.009305182 2.726858041 0.008443758 0.006747565 0.044000254 0.006747565 0.044000254market premium 0.884615495 0.238595745 3.70759124 0.000469729 0.407014224 1.362216766 0.407014224 1.362216766
SUMMARY OUTPUT 60 48 36 247 Year Rf 5.80% 5.80% 5.80% 5.80%
Regression Statistics R^2 0.1771 0.1262 0.1154 0.1046Multiple R 0.43713813 Beta 0.8830 0.8553 1.4286 1.6865R Square 0.191089745 Ke 7.56% 7.50% 8.64% 9.16%Adjusted R Square 0.177143016Standard Error 0.071974953Observations 60
ANOVA
df SS MS F Significance FRegression 1 0.070978663 0.070978663 13.70140275 0.000478869Residual 58 0.300462843 0.005180394Total 59 0.371441506
Coefficients Standard Error t Stat P-value Lower 95% Upper 95% Lower 95.0% Upper 95.0%Intercept 0.025154402 0.009304823 2.703372401 0.008990801 0.006528775 0.04378003 0.006528775 0.04378003market premium 0.883023844 0.238555764 3.701540592 0.000478869 0.405502604 1.360545084 0.405502604 1.360545084

113
Altman Z-score Altman Z-score
2002 2003 2004 2005 2006Working Capital 2,283,320 3,274,385 3,588,759 4,343,837 5,661,510Retained earnings 1,187,357 1,863,150 2,183,751 3,011,015 4,081,490Market Value of Equity 8,629,962 9,214,263 13,799,822 15,944,417 24,005,909Book Value of Liabilities 8,011,248 10,113,682 11,670,605 10,164,633 11,462,150Sales 22,611,894 30,708,033 36,151,394 35,943,810 36,596,111Total Assets 14,339,931 17,182,879 19,368,821 18,598,105 21,269,030EBIT $718,937 $630,973 $718,011 $1,516,375 $1,855,250
2002 2003 2004 2005 2006Altman Z-scores 2.696 2.835 3.078 3.650 3.853

114
Works Cited
Archer Daniels Midland Company. October 30, 2006. <http://www.admworld.com> Bernard, Victor L., Healy, Paul M., Palepu, Krishna G. Business Analysis and Valuation Using Financial Statements. Ohio: Mason, South-Western, 2004. Cargill. October 30, 2006. <http://www.cargill.com> Conagra Foods. October 30, 2006. <http://www.conagrafoods.com/index.jsp> EdgarScan, October 30, 3006. <http://edgarscan.pwcglobal.com/servlets/edgarscan> Hoovers a D&B Company. October 30, 2006. <http://www.hoovers.com/free> Moore, Mark. Financial Statement Analysis. October 30, 2006 Class Handout. Morningstar. October 30, 2006. <http://www.morningstar.com> Scottrade. October 30, 2006. <http://scottrade.com> YahooFinance. <http://www.yahoo.com>