conocophillips valuation project - texas tech...
TRANSCRIPT

0
ConocoPhillips Valuation Project
Financially Korrect Inc. Brad Bryan
Jerry Peterson
Susannah Lee
Jay Messamore
Ryan Hartsell

1
Table of Contents:
1. ConocoPhillips Snapshot……………………………………………………………………2
2. Executive Summary………………………………………………………………………….3
3. Business and Industry Analysis………………………………………………………….5
a. Rivalry Among Existing Firms………………………..5
b. Threat of New Entrants………………………………..7
c. Threat of Substitutes……………………………………8
d. Bargaining Power of Buyers………………………….9
e. Bargaining Power of Suppliers………………………10
4. Value Chain Analysis……………………………………………………………………….11
5. Competitive Advantage……………………………………………………………………11
6. Identifying Key Accounting Policies…………………………………………………..12
7. Asses Accounting Flexibility……………………………………………………………..15
8. Accounting Strategy……………………………………………………………………….17
9. Quality of Disclosure……………………………………………………………………….20
10. Screening Ratios…………………………………………………………………………….21
11. Identify Potential Red Flags……………………………………………………………..26
12. Corrections to Accounting Distortions …………………………………………......27
13. Ratio Analysis and Forecasts……………………………………………………………28
14. Financial Ratio Analysis ………………………………………………………………….28
15. Cross Sectional Analysis………………………………………………………………….32
16. Financial Statement Forecast Analysis………………………………………………36
17. Valuation Analysis………………………………………………………………………….38
18. Summary of Valuations ………………………………………………………………….47
19. Appendix A……………………………………………………………………………………50
20. Appendix B……………………………………………………………………………………56
21. Appendix C……………………………………………………………………………………60
22. References…………………………………………………………………………………….70

2
Executive Summary Recommendation – Buy Date of Valuation 11/01/06
COP NYSE (11/01/06) $60.30
52 week range 54.90 - 72.50
Revenue (2005) 183.00B Book Value per Share $32.00 Market Capitalization $812,482,200.00 Return on Equity 25.66% Shares Outstanding $13,474,000.00 Return on Assets 12.64% Dividend & Yield 1.44 (2.10%) Ratios COP Avg Industry Comp Performance of COP Forward P/E 8.41 8.66 Trailing 3mo 6mo 12mo Forward PEG 0.26 0.65 Ret. On COP (0.12) (0.11) (0.07) Mkt/Bk 1.8844 Ret on S&P 500 0.08 0.05 0.14 Value Predictions: Cost of Capital Estimates R2 Beta Ke Actual Current Price (11/01) 60.30 Ke Estimated 0.11304 0.60462 0.08922 Residual Income Valuation 84.98 5-Year Beta (0.00596) 0.27731 0.06631 FCF Valuation 105.46 3-Year Beta 0.04029 0.81073 0.10365 AEG Valuation 71.13
2-Year Beta (0.00852) 0.62173 0.09042 Discounted Dividends Valuation 46.52
Published Beta EPS Forecast
Kd 0.0600 2005 Act 2006 Est'd 2007 Est'd 2008 Est'd
WACC 0.0817 EPS 8.21 6.63 7.56 8.24
Altman's Z-Score 2.2650
3
Executive Summary
ConocoPhillips’ is an integrated oil and gas company that recently merged to
form a successful partnership. The two companies consolidated in 2002, and now are a
formidable competitor in the industry. ConocoPhillips’ main competitors include large oil
producers such as: ExxonMobil, BP, and Chevron. Due to the large assets needed to
compete in this industry, ConocoPhillips’ threat of new competition is very minimal. The
oil and gas industry is very competitive with the current companies involved, and
ConocoPhillips must be very cautious when it comes to setting prices in this price
sensitive industry. This highly sensitive price market is the cause of ConocoPhillips to
become an integrated oil and gas company. By integrating its process from start to
finish, ConocoPhillips is able to keep production costs down to help achieve greater
profits in the end.
ConocoPhillips’ maintains a rather conservative accounting policy. Due to the
heavy reliance upon assumptions and estimations in the energy industry, managers
have the ability to fluff up their financial statements to make it appear as if the
company is very successful. ConocoPhillips stays away from this, and instead has a
very flexible accounting policy that allows for a more rational judgment about the
company’s current financial standing. Along with this conservative accounting strategy,
ConocoPhillips’ maintains a very transparent disclosure policy. This transparency allows
analysts to come to a more honest opinion about the company’s current value.
ConocoPhillips’ does not withhold the negative information about the company or any
potential shortcomings of the company. This open honesty shows management’s
confidence in the company and willingness to change what is wrong with itself.
After doing financial ratios on the company and other companies in the industry,
we were able to see how ConocoPhillips measured up to its competitors in the
integrated oil and gas business. Due to the merger of the two companies, many of the
ratios done varied significantly than what was going on in the industry. However, for
the most part ConocoPhillips is steadily recovering since the joining of the two
companies, and is near or above the industry average in many categories. For
example, before the merger, the two companies struggled with their inventory turnover,

4
and the companies were well below the industry average. However, after the union
between the two, ConocoPhillips has taken control of its inventory problem and is now
an industry leader in this category. Another financial aspect ConocoPhillips has been
recovering from after the merger is its creditworthiness. After the merger,
ConocoPhillips was near bankruptcy in terms of its Altman Z-score, but since then the
company has regained its worthiness. It appears that with time ConocoPhillips will be
able to recover from the amalgamation of the two companies.
After compiling financial data from the past five years, we forecasted financial
statements for the next ten years. In doing so, we were able to get a better
understanding of the position ConocoPhillips will be ten years from now. We
forecasted based upon the assumption that the company will continue to grow at the
rate it has been. The accuracy of these forecasts was of the utmost importance
because the valuation of the firm is based upon these forecasts.
By carefully forecasting future financial statements, we were then able to analyze
and do a variety of valuations on these statements. After this analysis, we came to the
judgment that the value of ConocoPhillips’ stock is undervalued by the market. All
valuation methods except for one, dividend growth method, showed ConocoPhillips to
be significantly undervalued. The dividend growth model is a very sensitive model that
is dependent upon very accurate growth rate forecasts; therefore, we believe that our
other valuation methods portray a more accurate assessment of the firm. The other
four valuation methods averaged an estimated value of $85.64 per share, which is well
above the observed price on November 1st 2006 of $60.30. Based upon these
valuations and forecasts, we believe that ConocoPhillips’ is considerably undervalued;
therefore, investors should purchase ConocoPhillips’ stock.

5
Stock Prices for past 5 years
Business and Industry Analysis
ConocoPhillips is an integrated energy company headquartered in Houston,
Texas, with operations in over 40 countries. Phillips Petroleum acquired Conoco Inc. on
August, 30 2002 to form ConocoPhillips, both Phillips Petroleum and Conoco Inc. has
over 100 years of history in the Oil and Gas industry. ConocoPhillips operates in four
core activities: petroleum exploration and production, petroleum refining and
marketing, natural gas gathering and processing, and chemicals and plastics
production. ConocoPhillips is the third largest integrated energy company in the United
States, based on market capitalization, and oil and gas proved reserves and production.
The integrated oil and gas industry is a $135 billion industry with competitors
that include Exxon Mobil, BP, and Chevron. With the rising prices of crude oil over the
past few years and strong demand from the U.S. and China markets, the industry is
experiencing sustained success. This success has enabled ConocoPhillips’ to experience
steady growth in the size of the company over the past five years. Since the merger
the company has increased its assets each year which has led to an exponentially larger
increase in the total sales for the company. This
increase in sales has since caused the stock price
to gradually rise since the collaboration of the two
companies.
ConocoPhillips currently has a market
capitalization of around $95 billion which is well
below the industry average.
Rivalry among existing firms
ConocoPhillips is one of 23 Integrated Oil and Gas companies. The Integrated Oil
and Gas Industry’s average sales in 2005 were $1.4 trillion. While 23 companies may
seem like a lot of competition, it is in fact relatively small when compared to the size of
the industry. ConocoPhillips’ average sales over the last 3 years were $142 billion; this
accounts for roughly 10% of the industry’s sales in 2005. It is also important to note
that ConocoPhillips’ sales are on the upturn, so this percentage is likely to increase.

6
Its main integrated oil competitors are Amerada Hess, ChevronTexaco,
ExxonMobil, Marathon, and Occidnetal. These companies deal in both up upstream and
downstream operations. Upstream operations involve exploration and production while
downstream operations include refining and marketing. ConocoPhillips has other
competitors whose entire business is focused on either downstream or upstream
operations. These competitors included Anadarko, Dynegy, Valero, and Halliburton just
to name a few. ConocoPhillips has a competitive advantage over these companies
because being involved in both downstream and upstream operations allows the
company to remain profitable when one operation lags. If prices or competition in one
operation becomes unfavorable, the other operation can cover the losses.
ConocoPhillips is the third largest integrated energy company in the United
States and second largest refiner in the United States. Worldwide, ConocoPhillips has
the fifth largest proved reserves and is the fourth largest refiner. ConocoPhillips
operates in more than 40 countries and has approximately 38,000 employees worldwide
and assets of $162 billion. Because of this, ConocoPhillips is one of the major players in
the 23 Integrated Oil and Gas companies and applies more pressure on competing firms
than it receives.
Because the energy business has very high demand and there are relatively few
competitors in the industry, existing firms do not engage in price wars. Instead, they
compete on non-price dimensions. One of the major non-price dimensions firms
compete on is the size and reach to which they can offer their products. In the Oil and
Gas Industry size is king. The larger your operations become, the higher probability
your firm will prosper. This is evident by the constant mergers and acquisitions that can
be observed in this industry. ConocoPhillips is no exception to this trend. Conoco and
Phillips66 merged in 2002 to create ConocoPhillips and have since acquired several
companies. ConocoPhillips also offers products other than oil and gas. They produce
Asphalts, Fuels, Lubricants, and Chemicals and Plastics. They also specialize in removal
of sulfur from oil. The degree of differentiation for ConocoPhillips and its competitors is
low, so their customers are ready to switch from one competitor to the other based on
price.

7
ConocoPhillips is among one of the largest integrated oil and gas companies
based in the U.S., with operations world wide. ConocoPhillips has competitors in both
the integrated and segmented energy industry, but has a competitive advantage over
most of these companies due to their size, vertical integration, and scope of operations.
Because existing firms do not engage in price wars, firms focus on increasing the size
and reach to which they can offer their products and offer other products such as
asphalts and chemicals. The degree of differentiation for ConocoPhillips and its
competitors is low, so their customers are ready to switch from one competitor to the
other based on price.
Threat of new entrants
The threat of new entrants is very minimal because the barriers to entry in this
industry restrain most prospects. The chances of another player of significant influence
entering the Market any time soon is highly unlikely. The make-up and operations of
this industry should remain around the same in the relevant future, which make
projection of what competition will be in the future rather easy. The existing energy
companies are so large and powerful that it would make it very difficult for a new
company to compete.
There are different barriers of entry to look at in this industry. One barrier to
entry, for example, is the hard to come by expertise that is needed to complete certain
jobs. Specialized workers are needed to operate equipment and determine key drilling
decisions, which would make it difficult for new companies to find the resources
necessary for exploration and production. Another barrier is the amount of money
needed to compete with existing oil companies. The machinery requirements alone for
a single drilling location can cost up to $1,000,000.
The threat of new entrants is again reduced by the practice of mergers and
acquisitions. Larger oil and gas companies regularly buy out smaller or bankrupt
companies to increase the scope of their business operations. These acquisitions would
range from actions such the merger of Chevron and Texaco, for example, to the
purchase of a small drilling or chemicals company by a large corporation. By the time a

8
new entrant begins to gain market share it will more than likely be bought out by one
of the major players.
New entrants will furthermore be at an extreme cost disadvantage because of
the economies of scale. New entrants would be forced to invest in a large capacity
which might not be utilized right away or to enter with less than optimum capacity.
Either way, a new entrant forced to invest this inefficiently would be at an extreme
disadvantage. With competing energy companies with assets totaling in the billions, it
would be near impossible for a new entrant to invest in enough assets to be able to
compete.
ConocoPhillips, along with its competitors, have established channels of
distribution that would act as another barrier. The large companies in this industry have
distribution centers, forms of transportation, and buyers and sellers all over the globe.
The large quantity at which these companies are doing business would make is difficult
for any new entrant to attract significant attention and find buyers and suppliers.
Simply put, the firms that are currently in the oil and gas company are far too
large and powerful for any new entrant to have a probable chance at surviving long
enough to compete. The expertise that is required for many operations of the business
are hard to come by and are already being employed by current players. The high cost
that it would take to become a new player in the oil and gas industry is another barrier
to entry. In addition, the competitive natures of the industry will more than likely lead
to the acquisition of any entering firm.
Threat of substitutes
The threat from substitutes consists of two components: product substitution
and technology substitution. Currently, the oil and gas industry is facing a rising threat
from alternative energy technologies replacing fossil fuels. The alternative energy
threat is small currently, but is a technology that must be considered when. The threat
of product substitution in the oil and gas industry currently is low, because without new
technology everything will remain linked to fossil fuels.

9
With ConocoPhillips being in the energy industry there are a number of
substitutes that the company needs to be wary of. The largest threat for the company
is the new energy conserving technologies that are being developed. These
technologies are present in a number of ways, some of which include more fuel efficient
vehicles or dual power vehicles. As new technologies arise there is the possibility they
will benefit the environment; however, this then causes need for concern for future
revenues within the industry. Due to the high costs of these new technologies that are
being introduced to replace oil and gas products, the immediate threat of these
technologies is not great; however, as these new technologies become more efficient
both in use and to produce, the impact of these technologies will be felt by the entire
oil and gas industry.
Another substitute that causes concern for the oil and gas industry is an increase
in the awareness and appeal of alternative fuels, such as ethanol, natural gas,
hydrogen, electricity and so on. These alternative fuels come strongly recommended
and are backed by many environmental groups to help try and stop the deterioration of
the environment. Other programs that serve as substitutes for the integrated oil and
gas industry can be classified as anything that leads to a lesser amount of fuel
consumption. The use of carpooling to work, as well as the HOV, lane both can be
included as substitutions. Mass transit systems, such as buses, trains, etc. also lead to
a lesser consumption of fossil fuel products.
Alternative fuel products are a threat to the oil and gas industry in the long run.
The alternative oil and gas threat has not been seriously felt by the industry yet;
however, oil and gas companies are making plans to prepare for the rise of the
alternative fuel threat. With consumption of fossil fuels at or near an all-time high over
the past 3 years, the threat of substitutions does not play a major factor in the
profitability of the industry.
Bargaining Power of Buyers
When considering the bargaining power of buyers, one must consider two
important factors: price sensitivity and comparitive bargaining power. Price sensitivity is

10
the extent on which ConocoPhillips cares to bargain on price and the bargaining power
is how influential ConocoPhillips can be in forcing the price down. Keeping these two
factors in check will ultimately lead to success in the oil and gas market
With the refinements of oil and gas, end products of this refinement are
undifferentiated. In a perfect case, buyers are more sensitive when the product they
are consuming is undifferentiated with little substitute. But the sensitivity of buyers is
one of unique case in the oil and gas field. As Americans, consumers have an extreme
dependence on oil and gas. The price sensitivity of consumers is at an all time high.
Due to low alternatives and low switching costs (Chevron/Texaco, Shell, etc.);
consumers are very dependent on current prices. The oil and gas industry’s lack of
bargaining is a direct result of their dependence on this raw material. The price
fluctuations that are experienced day to day at the pump are a cost that consumers
must pay in order to commute or engage in daily life. With little alternative to fossil
fuels and the increasing of China’s economy, the number of buyers is reaching all time
highs. The high numbers of buyers in combination with ample resources is the driving
force pushing these prices.
The bargaining powers of buyers in the oil and gas field are limited. Bargaining
power is the cost of one party not doing business with the other party. Consumers
(buyers) are without transportation if they choose to not do business. One level of
bargaining power that buyers have is legislation. With acts of Congress, legislation and
bills, and social pressure, buyers have the ability to put pressure on the oil and gas
industry to reduce their price per barrel down. Another option that consumers have is
to take part in the upcoming trend of total electric or hybrid vehicles. Less dependence
on gas would equal a consumption drop for oil and gas producers. This drop in
consumption would reduce revenue and drive prices down.
All in all, ConocoPhillps must maintain this fine line of price sensitivity and
bargaining power. With such power being limited in the oil and gas industry, any
adjustment towards the positive that ConocoPhillips could make would enhance their
overall productivity and output. This increased productivity will provide beneficial in
investors in the long run.

11
Bargaining Power of Suppliers
The bargaining power of suppliers is the exact same as the bargaining power
buyers turned 180 degrees. With this holding true, ConocoPhillips as well as their
suppliers have to find an agreed upon medium with which to exchange. This medium is
the key to success.
Since ConocoPhillips is an integrated oil and gas company, meaning it operates in
both the upstream and downstream portions of the industry, most of its suppliers are
countries with oil reserves. A major supply concern for ConocoPhillips is the politics in
oil producing countries. A large portion of ConocoPhillips proved oil reserves come from
foreign countries. Therefore, ConocoPhillips is highly affected by the prices of oil set by
organizations such as OPEC. ConocoPhillips is its own supplier for most of the major
assets the company uses to explore, produce, refine, and marketing. ConocoPhillips
strives hard to have open lines of communication with its suppliers to eliminate
problems. ConocoPhillips seeks suppliers that can uphold its core values and provide
the quality and service needed for the best cost. Additionally, ConocoPhillips recently
purchased one of its suppliers, Burlington Resources, and will help further cut costs.
In total, if ConocoPhillips can maintain the balance between itself and it's
suppliers, it will have lower costs and a leading edge in the industry . This leading edge
could enhance the value of ConocoPhillips not only to itself, but also to its shareholders
and investors. This investing increase could push ConocoPhillips to new heights
Value Chain Analysis/Key Success Factors for the Industry:
The Oil & Gas industry is a highly competitive market. The core products and
services in which this industry markets are Crude Oil, Natural Gas, Jet Fuels, and
Gasoline products. These stated products are commodities in which cost leadership
competitive advantage may be necessary for optimal performance for companies within
the oil and gas business. In order for a company to succeed in the energy industry,
they must obtain several key success factors. The industry’s companies must have
economies of scale and scope, efficient production, and little brand advertising.
Gasoline is a common need of automobile owners will always purchase gasoline

12
regardless of more emphasis on brand advertisement or not. In addition, Oil and gas
commodities are produced in mass quantities. In order for companies to compete for
cost leadership, the increased mass production with higher demands, the more efficient
(cheaper costs) production is necessary for maximized profits.
Competitive Advantage
One of the keys to ConocoPhillips success and its cost leadership strategy is its
efficient production by being able to operate in both the upstream and downstream
production of oil. By having both segments of the production process, ConocoPhillips is
able to cut down on the risk associated with price volatility. Either upstream or
downstream has to make up the difference for the lagging behind of the other.
Currently, with the merger of the two large companies, ConocoPhillips is able to handle
the risks associated with the market due to the size and assets of the company. By
having the upstream portion of the production process, they are able to sell the
unrefined good to a number of different refineries. When supplying crude oil to the
companies own refineries, the efficiency of production are increased. ConocoPhillips
was able to achieve both ends of the production by having the assets needed to be a
leader in both upstream and downstream production. This process would be hard to
duplicate due to the assets needed to explore and produce oil reserves. Because of the
dependency on oil and its by-products, the industry is unlikely to change.
Identifying Key Accounting Policies
ConocoPhillips is an integrated energy company with investments across several
businesses. In order for companies who develop and produce commodities, such as
ConocoPhillips, companies compete under a cost leadership strategy (as stated as a key
success factor). ConocoPhillips constantly strives to maintain an economy of scale and
scope, in addition to many other key success factors. Under accounting policies every
public company, regardless of industry, is required to submit financial statements which
require companies to estimate value and functions of the business. Under their
Management Discussion and Analysis, ConocoPhillips discuss five key areas of critical

13
accounting policies all of which are linked to key success factors of a commodity based
business. Aside from the basic accounting policies, ConocoPhillips has many policies
unique to the energy business. These key areas are divided in functions they
participate in for which they make estimations and value judgments. The five areas
are: [1] Oil and Gas Accounting (actual commodity accounting), [2] Impairment of
Assets, [3] Asset Retirement Obligations and Environmental Costs, [4] Business
Acquisitions, and [5] Projected Benefit Obligations. As each component is discussed,
understand ConocoPhillips’ goal is to improve through sustainable growth. They are still
a growing company and thought mergers, acquisitions and even asset development add
value to ConocoPhillips.
ConocoPhillips core business functions are focused upon the oil and gas
products. As a commodity business, ConocoPhillips is always trying to cut costs in order
to maintain cost leadership (KSF), as costs may be lowered, there must be some way to
keep record of the changes in value. There are special accounting rules that are unique
to the oil and gas industry. Prior to the discovery of proved reserves, attainment of
geological and geophysical seismic information is an expensed as incurred, similar to
research and development costs. Leasehold acquirement costs are capitalized on the
balance sheet until the reserves of oil or gas have been proven. Leasehold acquisition
costs are determinant upon exploration and drilling efforts as the probabilities for
proved reserves are calculated by management. The probability determinants are
heavily weighted in importance as pretax leasehold impairment expenses would be
dramatically affected. The probability percentage is divided by the contractual period of
the leasehold to determine a periodic leasehold impairment charge that is then reported
as an exploration expense. Expenses are important because if they are too high,
income will be understated as ConocoPhillips could potentially pay fewer taxes.
ConocoPhillips is also involved in a lot of exploration to seek out their raw materials for
their finished product. Crude oil, also known as petroleum, is a raw material which is
later sent to the refineries to be processed in to several finished products. These
finished products include: Gasoline, Jet fuel, Natural Gas, Power, and Pet Coke
(asphalt). As stated in the Management Discussion and Analysis, they claim “for

14
exploratory wells drilling costs are temporarily capitalized, or “suspended,” on the
balance sheet, pending a determination on whether potentially economic oil and gas
reserves have been discovered by the drilling effort.” So, wellheads and drilling projects
are not included on the balance sheet until they succeed and discover product. If a
well did not produce a sufficient amount of or any product, they well costs are
expensed as a ‘dry hole’ and reported as an exploration expense on the income
statement. Contrasting to the leasehold acquisition costs, there is no impairment
assessment (depreciation) of the suspended exploratory costs. Exploration is a key
success factor in the business because if they find more raw material for their goods,
than they increase their supply as it also drives the costs of goods sold down.
However, when exploration does not result successfully, the accounting policies of
ConocoPhillips will expense the costs.
ConocoPhillips has many long term assets which will deteriorate as those
depreciations must be accounted for. However, keep note ownership of long term
assets become cost efficient for ConocoPhillips. Although there exist dangers and
scrutiny of low maintenance on refineries, the lower maintenance costs continues to
lower costs. Lower cost is a large business driver especially in commodity industries.
For example, ConocoPhillips has not built a refinery since the 1970s; their refineries
have been around for a significant time period as those refineries (assets) should be
depreciating in value. Long-lived assets used in operations are assessed for impairment
occasionally only if expected future cash flows are significantly decreasing. If the
pretax cash flows are less than the carrying value of the asset group, they will begin to
use the fair value of the asset. ConocoPhillips’ oil and gas reserves are critical to the
business because they are the major assets and products of the company.
ConocoPhillips and every energy company in the oil and gas industry is always under
much scrutiny for environmental and health hazards. ConocoPhillips purpose (mission
statement) is to “responsibly deliver energy to the world”. Not only are there laws
involved with energy emissions from refineries, ConocoPhillips is making an additional
effort to exceed the environmental performance of other companies. ConocoPhillips
undergo large asset retirement obligations and environmental costs which must all be

15
accounted for. Their largest obligations involve removal and disposal of the offshore oil
and gas platforms as those costs are accrued at the installation of the asset. There are
several environmental laws, especially in Alaska, for cleaning of refineries as well as the
underground storage tanks in the U.S. These are all included in the costs of goods.
As a growing business, ConocoPhillips have gone through several mergers and
business acquisitions over the years. mergers and acquisitions of companies allows
ConocoPhillips to run increase efficient production, increasing cost leadership (KSF). In
2001, Conoco Company and Phillips Petroleum 66 merged as one company,
ConocoPhillips. Conoco and Phillips 66 merged in order to maintain their sustainable
growth and increase a significant part of the market share in the energy industry. As a
result of the merger, they recorded the intangible assets such as trademarks, air
emission permit credits, and permit to operate refineries with an indefinite useful life so
they were not amortized. The first step in their mergers, they calculate and compare
the fair value of any reporting units including any goodwill. Many acquisitions are
recorded as goodwill they conduct tests for impairments. ConocoPhillips participates in
a company contribution in their benefit plans. Projected benefit obligations are
recorded as amounts for such obligations (liabilities) on the Balance Sheet as it is also a
benefit expense on the income statement.
Although ConocoPhillips may have several solid accounting policies, some of the
estimations, such as probability of successful reserves, are left up to manager’s
discretion. All of the five areas of the critical accounting policies can be updated and
re-estimated yearly. All of the oil and gas accounting, impairment of assets, business
acquisitions, projected benefit obligations and asset retirement obligations accounting
policies are very clear concerning the process of accounting; however, the components
requiring judgment of manager’s may raise questions.
Assess Accounting Flexibility:
ConocoPhillips has some noticeable amount of accounting flexibility due some
special accounting rules unique to the oil and gas industry. ConocoPhillips, fortunately,
does an outstanding job at disclosing accounting information. The Oil and Gas industry

16
is a unique commodity trading business. As mentioned previously in Key Success
Factors, commodity trading businesses must perform under a cost leadership strategy.
Many cost leadership businesses may have issues with disclosing information in order to
privatize their secrets of efficient production. Because of the amount of accounting
flexibility related to ConocoPhillips’ key success factors the accounting information is
very informative.
Many of the costs relating to exploration and production of oil are estimated by
management, leaving room for flexibility. Acquisition costs that are relatively small are
estimated by management based on a percentage probability the prospect will fail to
find proved oil and gas reserves. The percentage probability is reassessed throughout
the contractual period of the lease and will be adjusted to 100 percent by the end of
the contract if the leasehold is expected to be abandoned or will be adjusted to zero
percent if there is an oil or gas discovery. The percentage probability was about 72
percent and amortized over almost 3 years. If the percentage probability were raised
by 5 percent the impairment expense would increase by $6 million. This leaves
significant room for flexibility when reporting exploration expense for ConocoPhillips.
According to the annual report, proved oil and gas reserves are based on
subjective judgments by engineers. There are authoritative guidelines that must be
met when reporting proved reserves; however, these numbers are inherently imprecise.
A red flag is raised in this area because the subjective judgment is the denominator in
the unit-of-production calculation of depreciation and amortization of the capitalized
costs for that asset. ConocoPhillips annual report states that, “If the judgmental
estimates of proved reserves had been lower by 5 percent pretax depreciation,
depletion and amortization would have been increased by about $131 million.”
ConocoPhillips uses outside actuarial firms to assist in the determination of
projected benefit plan obligations. Of the numerous judgments made on uncertain
future events, the most sensitive element is the judgment on benefit expense. High
quality bonds are used as discount rates are used to determine the benefit expense. A
decrease of 1 percent in the discount rate would increase annual benefit expense by
$105 million.

17
The largest asset retirement obligation is the disposal of offshore platforms,
production facilities in Alaska, and the asbestos reduction at refineries. Many of these
obligations are many decades in the future and involve vague descriptions about which
regulations must be met.
Business acquisitions inherently involve judgmental decisions on the fair value of
individual assets and most importantly goodwill and intangible assets. For determining
the fair value of most assets, ConocoPhillips uses on outside agency, which leaves less
room for flexibility. ConocoPhillips has an alarming amount of room for flexibility in
determining the fair market value of the goodwill from the companies it acquires.
Overall, ConocoPhillips does a fair job at reporting the reasons and expectations of its
valuing of intangible assets.
As mentioned above, the Exploration and Production segments record
depreciation on a unit-of-production basis, therefore depreciable life is varying in this
segment. In the refining and manufacturing segment, facilities are depreciated on a
straight line basis over 25 years, pipeline assets are depreciated over a 45 year life,
service stations and fixed improvements have a 30 year life. Inventories are accounted
for using the first in, first out (FIFO) method, which could lead to ConocoPhillips
reporting a higher net income. ConocoPhillips method for amortizing goodwill over an
estimated time period leaves room for flexibility.
While flexibility does exist in the accounting policies of ConocoPhillips, great care
seems to be made at disclosing the relevant information. Consistency and care are
made when using judgment to make decisions on the key success factors. The strict
guidelines stated when using judgment that affects accounting numbers eases the
concern over the amount of flexibility.
Accounting Strategy
As all companies, ConocoPhillips is required to prepare its financial statements in
conformity with generally accepted accounting principles. Adhering to these principles
requires managers to select accounting policies and make estimates and assumptions
that affect the reported amounts of assets, liabilities, revenues and expenses. It is

18
important to understand that accounting in the energy industry involves making many
estimations of values to future dates. Certain accounting policies that must adhere to
generally accepted accounting policies involve judgments and uncertainties to a degree
that it is likely for different amounts to have been reported if analyzed under different
conditions and assumptions. ConocoPhillips uses accounting flexibility to communicate
the firm’s economic situation and presents its financial status to the best of their ability.
ConocoPhillips uses a conservative approach to its accounting strategy. For example,
they do not record the exploratory drilling sites they own as assets until oil has been
proven to be at that location.
The acquisition of geological and geophysical seismic information, prior to the
discovery of proved reserves, is expensed as incurred. This can be compared to the
research and development expenses of other companies. Leasehold acquisitions costs
and exploratory well costs are capitalized on the balance sheet; pending determination
of whether proved oil and gas reserves have been discovered on the prospect. This is
similar to how other comparable companies account for the components mentioned
above.
As stated in its 2005 10-k, “individual assets are grouped for impairment
purposes based on a judgmental assessment of the lowest level for which there are
identifiable cash flows that are largely independent of the cash flows of other groups of
assets – generally on a field-by-field basis for exploration and production assets, at an
entire complex level for downstream assets, or at a site level for retail stores.” This
means that ConocoPhillips arranges its assets into similar groups, and then evaluates
them for impairment. They choose to do it this way because the business functions of
their assets are so different it would be inaccurate to write down assets as one large
group. The fair value of these assets are usually based on the present values of
expected future cash flows using discount rates in accordance with the risk associated
for that asset group.
When Acquiring companies such as Tosco corporation and Burlington resources,
as well as the merger of Conoco and Phillips, ConocoPhillips chooses to record
intangible assets for trade names and trademarks, air emission permit credits, and

19
permits to operate refineries at indefinite lives and are so not amortized. The recorded
intangible assets for trade names and trademarks, air emission permit credits, and
permits to operate refineries due to the stated mergers and acquisition above total
around $14 billion. During these mergers and acquisitions, a material amount of
goodwill was recoded, which under the accounting rule for goodwill is not amortized.
This means the company believes the intangible assets gained from these transaction
will not depreciate over time and keep their value. In accordance with accounting rules,
ConocoPhillips will have to review goodwill yearly for impairments.
ConocoPhillips uses the equity method for accounts of majority owned, controlled
subsidiaries and variable interest entities when they are the primary beneficiary. They
realize a weighted-average ownership share of a company’s net income each period
and recognize it as equity earnings on their financial statements. This is important to
ConocoPhillips accounting because the more they own of a company, the more earnings
are recognized on their statements. ConocoPhillips has increased its overall ownership
of their subsidiaries over recent years, such as their investment in Lukoil which now
reaches 16.1 percent. As a result, ConocoPhillips’ equity earnings in their financial
statements have been increasing. This has helped contribute to the increase in
ConocoPhillips value over recent years.
Since the merger of Conoco and Phillips in 2002, ConocoPhillips has made no
changes to their accounting policies. After analyzing the financial statements over the
last 5 years, it appears as if there have been no abnormal adjustments to
ConocoPhillips revenue and expenses from quarter to quarter or year to year. This
illustrates that ConocoPhillips Accounting practices have more than likely been
materially correct and honest, which is no surprise as they follow a conservative
accounting strategy. An increase in revenues and expenses is apparent over the past 5
years, but this is probably due to the company’s expansion.
Top executives are offered incentives to increase performance. The
compensation committee of the board of directors decides the appropriate structure of
incentives and amount of compensation for each executive by comparing their
performance to the others. In addition to salary, the top executives are offered long

20
term incentive in the form of stock options and restricted stock units under the
performance share program. The criteria evaluated for these incentives are based on
total shareholder return, improvements in return on capital, reduction of debt,
increased revenue, and overall financial performance.
ConocoPhillips uses their accounting strategy to communicate the firm’s
economic situation and presents its financial status to the best of their ability. It
recognizes its expenses in exploration and capitalizes it expenses that lead to the
discovery of proved oil reserves. It assesses its assets in functionality groups as to
properly value assets and record impairments, which give a clear picture of the
company’s true value. They have been acquiring new companies and recognizing
intangible assets and goodwill at indefinite lives. This has increased the company’s
assets and net income. ConocoPhillips also chooses to offer their executives strong
incentive plans that will improve the company’s financial performance.
Quality of Disclosure
The way a company discloses its information about its financial and accounting
data has a strong impact on the image the company portrays to its potential and
current investors. ConocoPhillips does a detailed job in disclosing its policies both
qualitatively and quantitatively. ConocoPhillips goes into great detail concerning exactly
what the company is doing and what its future plans are; therefore, investors are able
to obtain a fairly good understanding of the true value of the company.
ConocoPhillips operates in many different business segments, and they disclose
specific information about what is going on in each segment. They release information
regarding what percentage of each segment is reflected in the total assets portion of
the balance sheet as well as what contributions each segment adds to net income.
After the segmentation, ConocoPhillips then breaks down each segment to the different
geographical regions and departments that make up the segment.
In the disclosures, the company does reflect where potential negative outcomes
towards the company could arise. For example, ConocoPhillips shows that if they are
unable to find more reserves, the future crude oil and natural gas production would

21
decline. This would then cause a decrease in cash flows and results from operations.
They also state that the success of the company is directly related to the price of crude
oil, natural gas, and refining costs, and that decreases in the price of these would cause
negative operating results. However, the figure that the company has tied in with this
negative information does not include any quantitative data about the effects of this
potentially harmful data. The managers do not disclose information on neither the
probability of these possible negative effects nor the potential harm they could cause
the company. Nevertheless, by ConocoPhillips disclosing this negative information
shows that the company is not trying to embellish the information disclosed by
releasing only positive data to the public.
In ConocoPhillips’ financial statements they have a very detailed disclosure that
states all there procedures as far as stating how they handle foreign currency
conversion, asset retirement obligations, and goodwill. As a company ConocoPhillips is
very transparent based on the information in they release in their disclosures, which
allows for an easier judgment to be made about the proper value of the company.
Screening Ratios
The sales manipulation diagnostics listed below include three net sales
manipulations to help identify potential red flags in reporting sales. The core expense
manipulation listed below includes four core expense manipulations that will help
identify red flags.
Net Sales / Cash from Sales
1.05
1.10
1.15
1.20
1.25
1.30
2001 2002 2003 2004 2005

22
Net Sales / Cash from Sales
ConocoPhillips net sales to cash from sales ratio is decreasing steadily over the
past five years. Cash from sales is determined by subtracted the next year’s accounts
receivable and the current years account receivable from the current year’s net sales.
This diagnostic checks for unexplained increases in sales. Since, the trend decreasing
over the entire period no red flag is seen.
Net Sales / Net Accounts Receivables
0.00
5.00
10.00
15.00
20.00
25.00
2001 2002 2003 2004 2005
Net Sales / Accounts Receivables
Net sales to accounts receivables for ConocoPhillips fluctuates slightly over the
five year time period but remains in close range. The dip in ratio in 2002 is most likely
due to a dramatic increase in accounts receivable for the year. The net sales to
accounts receivable is looking for any asset distortions. The overall stability of the ratio
reduces any concerns over the yearly noise and eliminates any concern for a red flag.
Net Sales / Inventories
0.00
10.00
20.00
30.00
40.00
50.00
60.00
2001 2002 2003 2004 2005

23
Net Sales / Inventories
ConocoPhillips’ net sales to inventories have been steadily increasing over the
last five years. Concern is raised over sales manipulation when net sales are increasing
at a rate that significantly outpaces inventory growth. Upon closer examination the
significant net sales growth can be attributed to the dramatic rise in oil prices over the
last five years, which is typical of the oil and gas industry. The stability of the growth is
encouraging for ConocoPhillips.
Net Sales / Assets
0.000.200.400.600.801.001.201.401.601.80
2001 2002 2003 2004 2005
Net Sales / Assets
The net sales to assets ratio diagnostic is checking for a decreasing ratio that
would suggest a core expense manipulation. The fact that net sales to assets is
increasing over the time period would remove any red flag potential. Furthermore, the
fact that the net sales to assets ratio increases with net sales to inventories would be
ease concerns even more.

24
CFFO / OI
0.000.050.100.150.200.250.300.350.400.450.50
2001 2002 2003 2004 2005
Cash Flows from Operating Activities / Operating Income
Cash flows form operations is another core expense manipulation that would
raise concerns if dramatic changes were noticed. The slight decrease in the ratio can
be attributed to the faster growth in operating income. The increase in operating
income has already been explained in previous ratios by the increase in sales. The
slight movements in the ratio combined with the knowledge of the increase in net sales
raises no red flags.
CFFO / NOA
0.00
0.05
0.10
0.15
0.20
0.25
0.30
0.35
2001 2002 2003 2004 2005

25
Cash Flows from Operating Activities / Net Operating Assets
The overall increase in the cash flows from operations to net operating assets is
consistent with previous diagnostics. The decrease in 2002 is consistent, but more
obvious, with the net sales to assets model. The CFFO / NOA model should be close to
sales to assets and their consistency should ease concerns over any possible red flags.
The overall increase in the diagnostic reflects favorably on ConocoPhillips.
Pension Expense / SGA
0.00
0.20
0.40
0.60
0.801.00
1.20
1.40
1.60
1.80
2001 2002 2003 2004 2005
Pension Expense / SG&A
Pension expenses to SG&A expenses over the five year period remained mostly
stable. The slight decrease in the ratio is attributed with the slightly larger growth in
SG&A expenses. The overall stability reduces concerns over any core expense
manipulations. With no dramatic changes in the diagnostic no red flags are warranted.
Screening Ratio Conclusion
Overall the manipulation diagnostics warrants no red flags. The only possible
red flags noticed would be the increase in sales over the last five years. With the nearly
195% percent growth in crude oil prices since 2001, most of the increase in sales can
be answered. The excellent disclosure of information helps to further reduce concerns

26
over red flags. The manipulation diagnostic turns up no red flags and shows
ConocoPhillips performing well over the last five years.
Identify Potential Red Flags:
Throughout the past five years of evaluation, ConocoPhillips’ statements show
little deviation from one year to the next and in turn raise few red flags. These
statements are analogous with regards to evaluation techniques and inventory
accounting.
With regards to inventory, ConocoPhillips exercises the LIFO system for sale of
crude oil, petroleum products, and Canadian Syncrude inventories. This practice is on
par with other competitive firms in this industry. Also similar is ConocoPhillips’ FIFO
evaluation of marketing merchandise (t-shirts, mugs, umbrellas, etc.) This evaluation
method is also common among competitors. These methods have been used over the
previous four years and haven’t deviated thus resulting in accurate picture.
ConocoPhillips does not amortize goodwill. Instead, they evaluate goodwill at
least once a year and adjust goodwill according to fair market value. If goodwill is less
than the hypothetical purchase price, goodwill is then written down to the new amount.
ConocoPhillips acquired about $12,000 of goodwill from the merger of the two firms in
2002. In 2004, ConocoPhillips wrote off, for the first time, goodwill acquired through
the 2002 merger of Conoco and Phillips 66. If not, goodwill is not changed until the
next evaluation. What provides some comfort is the evaluation is at least once per year.
If goodwill tends to shift according to fair market value, the shift will be caught in a
subsequent evaluation. Other intangibles are depreciated with the straight line method.
A major factor in the operations of ConocoPhillips is the derivatives market.
This market is where one potential red flag arises. Due to the high volume of futures,
options, and other derivative trading that occurs, ConocoPhillips has the ability to hold
certain derivatives for the trading market. The gains or losses from trading activities
are recorded in sales or operating revenues. Similar to Enron, ConocoPhillips has the
ability to increase revenues without actually increasing profits, thus providing a false

27
picture. Statistical analysis of ConocoPhillips has proven against this fact, but the
option is always there which is a potential red flag.
Another red flag that arises is ConocoPhillips’ Pretax Leasehold Impairment
Expense or as reported on the Income Statement as Property Impairments. This
expense account is a potential red flag because it is evaluated by “exploratory
experience and management’s judgment.” Their judgment is based on whether they
believe exploration for oil and gas will prove to be successful (finding oil or gas) or if
exploration will be abandoned. If management “estimates” the failure percentage to be
low, the impairment expense will be less resulting in higher earnings and vice versa.
This substantial expense account is solely based on judgment and in turn is subject to
personal biases.
Although ConocoPhillips is equally comparable year after year, there are a few
red flags that exist. The red flags not only exist with accounting policy but also with
management’s judgment. Due to similar faults in the oil and gas industry, these red
flags should appear relatively quickly.
Corrections to Accounting Distortions:
After looking through ConocoPhillips’ financial statements, there were few
accounting policies that seemed to cause drastic concern. The company has not made
serious changes to their accounting procedures within the last few years. In several
cases the managers are given the duty to estimate values and probabilities.
One example that could be a potential accounting problem is the manager’s
compensation and incentive plans are based upon the performance shown on the
financial statements, a slight biased in the estimations could cause need for concern.
For example, the company’s use of estimations in their determining of potential oil and
gas reserve failure is one that could lead to a serious flaw on their financial statements.
If the manager was to understate the impairment of assets expense, this would cause
the net income of the company to be overstated. This would then cause the retained
earnings showing up in owner’s equity to be overstated as well, which leads to an

28
overstatement of the assets. The company would understate the impairment to show
shareholders an increase in value.
To correct this overstatement of assets, there would need to be a decrease in
assets to correct the asset portion, followed by an adjustment made to the equity
portion to reflect the after-tax cost of impairment. Tax effect adjustments would be
shown in then be shown in company’s deferred tax liability.
Since we could find few immediate threats shown by ConocoPhillips and their
accounting policies, only a few hypothetical situations would cause the need for
corrections to be made. By using less estimation in the future the company could cut
down on the need for potential adjustments to be made.
Ratio Analysis and Forecast
The purpose for the Ratio Analysis and Forecast section is to provide a window in
which to view ConocoPhillips in the past, present, and future based on factors of
liquidity, profitability, and capital structure. It will also show comparisons between
Exxon, Chevron, and BP as well as the industry average. The 10 year forecast of the
Income Statement, Balance Sheet, and Statement of Cash Flows will provide an
equitable evaluation of ConocoPhillips’ future financial performance. With the section
being divided into two sections: Financial Ratio Analysis section (trend and cross
sectional analysis) and the Forecasting Methodology Section, it will provide a
comprehensive and full future evaluation of ConocoPhillips.
Financial Ratio Analysis
The purpose of liquidity analysis is to provide the investor an idea of if the firm
can meet its liability demands. The purpose of the profitability analysis is to determine
how the firm is doing with the sales generated. The capital structure analysis lets
investors know how the firm raises capital. The financial ratio analysis is most
beneficial when comparing firms to other firms and industries.

29
Liquidity Analysis
2001 2002 2003 2004 2005 Current Ratio
(CA/CL) 1.35 0.85 0.80 0.96 0.92
Quick Asset Ratio
(QA/CL) 0.28 0.37 0.39 0.65 0.66
Accounts Receivable Turnover (Sales/AR)
22.27 13.06 21.00 15.58 15.36
Days Sales Outstanding (365/ARTO)
16.39 27.95 17.38 23.43 23.77
Inventory Turnover
(COGS/INV) 5.59 9.85 17.05 24.60 33.55
Day’s Supply of Inventory
(365/INVTO)
65.29 37.07 21.41 14.84 10.88
Working Capital
Turnover (Sales/CA-CL)
14.93 (29.90) (37.28) (242.33) (104.96)
Liquidity Analysis (contd.)
ConocoPhillips (COP) has recently had a large merger with Philips66 and has
recently acquired Burlington Resources. These two factors have affected COP’s liquidity
due to the lag time attributed to the lengthy process of closing such acquisitions. The
current ratio and quick asset ratio are on the rebound as well as their accounts
receivable turnover. COP has made a fine effort to turnover their inventory and
decrease their day’s supply of inventory which, as a result, has improved over the
industry average. The last thing affecting COP is working capital turnover. The
increasing of current liabilities in relation to current assets has had a negative affect for

30
COP from 2002 to 2004 but shows an improvement and the end of 2005. This
improvement is related to the large number of sales recognized in that year.
Profitability Analysis
2001 2002 2003 2004 2005 Gross Profit
Margin (GP/Sales)
34.67% 25.66% 29.00% 28.75% 27.20%
Operating Expense
Ratio (Operating
Expense/Sales)
3.67% 4.44% 2.65% 2.07% 1.59%
Net Profit Margin
(NI/Sales) 6.64% (0.52%) 4.45% 5.94% 7.38%
Asset Turnover (Sales/TA)
0.71 0.74 1.27 1.47 1.71
Return On Assets (NI/TA)
4.72% (0.38%) 5.67% 8.75% 12.64%
Return On Equity (NI/OE)
11.58% (1.00%) 13.62% 19.03% 25.66%
There are 4 major factors that contribute to the overall profitability of COP.
These 4 are: Operating Efficiency, Asset Productivity, Return on Assets, and Return on
Equity. The Operating Efficiency of COP has been on the decline over the past 5 years.
The Gross Profit Margin has slipped from 2001 to 2005 at almost 7.5%. The Net Profit
Margin has also fell with the exception of 2005 showing a slight increase. Mergers and
acquisitions as well as a high proportion of total sales derived from less profitable
product line could be attributed to this decline. Asset productivity has been a positive
factor for COP. With a steady increase over the past 5 years, current asset turnover
shows that each $1 of assets has produced $1.71 of sales. This trend is also seen by
the return on assets with the exception of 2002 in which the merger occurred which

31
resulted in a Net Loss for the year. The final factor affecting profitability is return on
equity. Again, despite the Net Loss experienced in 2002, ROE has increased extensively
from 2002 to 2005.
Capital Structure Analysis
2001 2002 2003 2004 2005
Debt To Equity Ratio (Total
Liability/Owner’s Equity)
1.41 1.57 1.37 1.15 1.01
Times Interest Earned
(EBIT/Interest Expense)
10.77 3.03 10.98 27.36 48.15
Debt Service Margin
(OPCF/NP) 80.89 5.86 6.50 18.92 10.03
The Capital Structure of COP refers to the sources of financing used to acquire
assets. When considering Capital Structure, an investor must consider two things: the
amount of debt to owner’s equity and the ability to pay the principal and interest on
debt. COP has shown improvement over the 5 year trend in relation of debt to equity.
At the end of 2005, COP has $1.01 of liabilities to every $1.00 of equity. This shows
that they have a slightly larger liability in comparison to owner’s equity. Times interest
earned relates to the amount of income from operations to cover interest charges on
debt. The debt service margin relates to cash provided by operations to cover the
installment payments on the principal. COP has managed to maintain positive numbers
in both respects showing that COP at the end of 2005 has $48.15 of income from
operations to pay every $1.00 of interest expense. Similarly, at the end of 2005 COP
has $10.03 of cash provided by operations to cover each $1.00 of long-term debt. In
respect to these two numbers, COP has the ability to cover the interest and the
principal of their debt incurred.

32
Sustainable and Internal Growth Rate
SGR = IGR (1 + Debt/Equity) IGR = ROE (1 – Dividend Payout Ratio)
The sustainable and internal growth rates are two ways to evaluate COP’s ratios
in a comprehensive manner. The sustainable growth rate is a rate in which a firm can
grow while keeping its profitability and financial policies unchanged. The internal
growth rate is the highest level of growth achievable without obtaining outside
financing. The 5 year trend represented by these ratios indicates that COP has the
ability to grow in the up coming years to a certain point. As usual, growth will
eventually succumb to outside factors at some point and reach its maximum point. The
SGR and IGR will help to provide an accurate forecast for COP in the upcoming years.
Cross-Sectional Analysis
The integrated oil and gas industry has a number of large companies in the
market that are fiercely competing for market share. After doing ratio analysis over a
few companies in the industry for the past five years, ConocoPhillips’ financial stance
varies with what is going on in the industry. ConocoPhillips’ is becoming better in some
areas, while struggling with others.
Internal Growth Rate
2001 2002 2003 2004 2005 Average
ROE 11.58% -1.00% 13.62% 19.03% 25.66% 13.78%
DPR 24.26% 231.86% 23.66% 15.16% 12.11% 61.41%
IGR 8.77% 1.32% 10.40% 16.15% 22.55% 11.84%
Sustainable Growth Rate
2001 2002 2003 2004 2005 AVG
IGR 8.77% 1.32% 10.40% 16.15% 22.55% 11.84%
D/E 1.41 1.57 1.37 1.15 1.01 1.30
SGR 21.14% 3.39% 24.65% 34.72% 45.33% 25.84%

33
Current Ratio
0.50
0.70
0.90
1.10
1.30
1.50
1.70
COP 1.35 0.85 0.80 0.96 0.92
Industry 0.96 0.96 1.09 1.28 1.31
BP 0.82 0.83 0.85 0.91 0.97
Chevron 0.89 0.89 1.21 1.52 1.37
ExxonMobil 1.18 1.15 1.20 1.40 1.58
2001 2002 2003 2004 2005
Inventory Turnover Ratio
0.00
10.00
20.00
30.00
40.00
COP 5.59 9.85 17.05 24.60 33.55
Industry 16.54 15.21 18.04 20.66 22.06
BP 15.15 11.41 12.81 13.21 12.39
Chevron 20.54 20.72 26.93 31.65 31.05
ExxonMobil 13.92 13.48 14.39 17.12 22.75
2001 2002 2003 2004 2005
ConocoPhillips’ ability to pay off there debt differs from what is going on in the
industry. The industry
average of current assets over
current liabilities over the past five
years has been steadily
increasing; however,
ConocoPhillips proportion of
current assets over current
liabilities took a major
decrease during the merger in
2001, but they have started to turn it around with what the industry is doing.
ConocoPhillips’ relationship of the amount of cash or other easily converted assets to its
current liabilities is increasing as is the industry, but it is just at a much smaller rate
than its competitors. Overall, ConocoPhillips ability to payoff its debt is not preferable
in many industries, but in this large industry the amount of assets on hand is often
times not enough to cover its liabilities.
In the integrated oil and gas
industry, companies’ ability to
collect on receivables over
the past five years has been
around thirty six days to
collect, where as
ConocoPhillips’ has been
able to keep there accounts
receivable turnover well
below the industry average, at an average of around twenty two days. ConocoPhillips’ is
starting to decrease its efficiency with accounts receivable as its accounts receivable
turnover has started to move towards the average of the industry. Since the merger of
Conoco with Phillip’s, the company has been able to drastically decrease the amount of
days that inventory is on hand, in 2001 the company was the worst in the industry in
34
terms of inventory turnover. However, during the last five years the company has been
able to not only catch up with the industry, but has surpassed its competitors and is
now the leader. ConocoPhillips’ working capital turnover is a major cause for concern
for the company due to the greater amount of liabilities than assets. ConocoPhillips has
a negative working capital turnover since the merger; however, the company’s
competitors also maintain negative working capital turnover ratios, but not near as
severe as ConocoPhillips. In the integrated oil and gas industry, ConocoPhillips has
become the most efficient of the companies in both its inventories and accounts
receivables; nevertheless, the company does need to work on its working capital by
either decreasing its liabilities or increasing sales to get back to a positive number.
ConocoPhillips gross profit margin has been around thirty percent of its sales over the
last five years, where as the industry averages just above that by averaging around
thirty-five percent. Operating costs in the integrated oil and gas industry are a very
miniscule part of a company’s total sales; therefore, the ratio between the two is very
low. ConocoPhillips maintains a lesser ratio than the other companies at an average of
around .03 to the industry average of .07. This shows how the company is minimizing
its operating costs as it is increasing its sales. ConocoPhillips net income margin took a
decline whenever the merger took place, but has been steadily increasing ever since.
However, ConocoPhillips is still trailing its Competitors in terms of net income margin.
ConocoPhillips was not the only company that showed losses in 2002, both Chevron and
Exxon had a decrease from the year before. ConocoPhillips return on assets and return
on equity has constantly remained below the industry average throughout the past five

35
Debt to Equity
0.60
0.80
1.00
1.20
1.40
1.60
1.80
COP 1.41 1.57 1.37 1.15 1.01
Industry 1.13 1.30 1.24 1.14 1.12
BP 1.16 1.41 1.54 1.45 1.49
Chevron 1.28 1.45 1.24 1.06 1.01
Exxon 0.96 1.05 0.94 0.92 0.87
2001 2002 2003 2004 2005
years. This shows how the company is struggling to capitalize on its assets and equity
to generate income. Recently the company has shown considerable improvement in
both categories and is starting to gain ground on its competitors in these areas. As a
whole, ConocoPhillips went through a decline in profits during 2002, but is slowly
rebounding back and has been able to catch up with its competitors in terms of
profitability.
The capital structure of ConocoPhillips’ consists of a great amount of outstanding
liabilities. Over the past five years the company has primarily used debt to finance its
assets, which is shown in the debt to equity ratio. However, ConocoPhillips’
competitors also primarily use debt to finance there operations, but not to the same
extent that ConocoPhillips’ does. In more recent years the company has decreased the
amount of debt used and is now at below what the industry average is. The industry
average for times interest earned over the past five years is 52.63 times, where as
ConocoPhillips average for that same time frame was 20.06 times. This shows that
ConocoPhillips is not near as successful with its income from operations in relation to its
interest expense. However, the company is starting to gain ground and become more
like its competitors in recent years. ConocoPhillips’ is very successful in terms of its
ability to provide cash from operations to pay off its annual principal payments.
ConocoPhillips has maintained its debt service margin above the industry mean for the
last five years. In terms
of the company’s capital
structure, ConocoPhillips
had a substantial amount
of debt five years ago,
but they have been able
to decrease that amount
and become more
efficient with their use of
debt. Taken as a whole,

36
the company was struggling in all areas five years ago, but has made steady
improvement since to now become a leader in the integrated oil and gas industry.
Financial Statement Forecast Analysis
After compiling all the data for the financial statements and ratios, trends,
growth, and averages were looked for to forecast into the future. Using growth
analysis we could look at the balance sheet and see that total assets had grown at a
reasonable rate in 2005, and according to Value Line analyst estimates, a rate that
should be maintained over the next 2 years. Based on analyst estimates that
ConocoPhillips and the Oil and Gas Industry would see less growth in the 5 to 10 year
time period, we reduced the growth rate for total assets to eight percent. Noticing that
inventory averaged a sustainable 4.4% of total assets over the last 3 years, inventory
growth could be forecasted for the next 10 years. Using other liquidity, leverage, and
capital structure ratios most of the remaining balance sheet data could be forecasted.
Using the average Inventory Turnover ratio, Cost of Goods Sold could be
forecasted by multiplying the average inventory turnover by the forecasted inventory
for the year being estimated. The average Total Asset Turnover ratio could be used to
forecast Sales. According to Value Line analyst estimates, Sales are expected to dip in
the year. The dip in sales makes sense, considering the recent drop in oil prices. With
Sales and Cost of Goods Sold forecasted Gross Profit could be found for the entire ten
year time period. Continuing to use averages and financial ratios the remainder of the
income statement could be forecasted.

37
Because the Oil and Gas industry is so volatile and profitability is partially
determined by such factors as the weather and foreign politics, developing a reliable
growth rate for extended time periods is difficult. The large degree of uncontrollable
volatility makes using averages to forecast data a weakness to our forecasting method.
The skyrocketing oil prices over the last five years have created growth rates that can
not possibly be continued for the next 10 years. Using a technical analysis of charts it
appears as though that prices have reached a plateau and using recent growth rates
should be more reliable than rates from earlier years. Since Total Assets are the
foundation for the Common Sized Balance Sheet, using adjusted growth rates for Total
Assets will allow for reasonable growth rates to be used over the ten year time period.
A major weakness to this method is that Sales have been so volatile over the past 5
years, that forecasting further out than two years becomes a guessing game. The
tremendous growth in the industry makes forecasting using recent growth unreliable.
Using averages over the last five years and reducing growth rates to more reasonably
sustainable amounts helps to take out some of the inherent risks associated with
forecasting a company in such a volatile industry.

38
Valuation Analysis
To value ConocoPhillips, a variety of valuation models were used to determine if
ConocoPhillips is overvalued, undervalued, or fairly valued. The first method used to
value ConocoPhillips was the Method of Comparables model. Next, the cost of debt and
equity was determined to estimate a weighted average cost of capital. After, finding
the cost of capital, the dividend discount, free cash flow, residual income, abnormal
earnings growth, and long-run ROE/RI perpetuity models were used to determine the
intrinsic value of ConocoPhillips.
Method of Comparables
The first and easiest valuation model used was the Method of Comparables
model. This model is easy
to use because the model
does not require the use of
forecasting, estimating cost
of capital, or finding present
values. We used the earnings per share, book value per share, and dividends per share
for the years 2004 and 2005. We compared competitors BP, and Chevron to find the
value of ConocoPhillips.
We used the 2004
price per share divided
by the 2004 earnings per
share to determine the
2004 P/E trailing. We
then used the 2004 price and 2005 estimated earnings to determine the P/E forward.
The average was taken of both competitors to determine the industry average. After
finding the industry average ConocoPhillips’ corresponding multiple was used to
determine the price of ConocoPhillips.
2004 EPS BPS DPS PPS
ConocoPhillips 4.93 25.92 0.75 43.42
BP 4.14 23.71 1.66 57.93
Chevron 6.28 21.47 1.54 52.51
2005 EPS BPS DPS PPS
ConocoPhillips 8.21 32.00 0.99 58.18
BP 5.48 24.82 2.09 64.22
Chevron 6.54 28.07 1.75 56.77

39
After computing the average price-to-earnings per share trailing and forward for
the industry and multiplying the average by the earnings per share, the price for
ConocoPhillips was found to be overvalued. The industry average price-to-book was
found and multiplied by ConocoPhillips’ book value to determine that the price per share
was overvalued. The industry average dividend per share was used to determine that
the price per share for ConocoPhillips is undervalued. The overall reliability for the
Method of Comparables model was found to be less than desirable and inconsistent.
Comparables (COP)
P/E Trailing
P/E Forecast P/B D/P P/S
2004 Avg. 11.18 10.20 2.44 0.03 0.72 2005 Avg. 10.20 8.66 2.30 0.03 0.76 COP Price
(2004) $55.13 $50.31 $63.37 $25.79 $67.72 COP Price
(2005) $83.73 $71.13 $73.75 $31.39 $94.03
Cost of Capital
The cost of capital and the factors that make it up are some of the most
important calculations because they are the discount rates used to find present values
on some of the most important models. The cost of equity is found by using the CAPM
model. Beta is estimated by running a regression of ConocoPhillips returns and S&P
500 returns. The cost of debt is found by using a weighted formula. Finally, the
weighted average cost of capital is found by using an equation and both costs of equity
and debt.
Cost of Equity
The cost of equity is found using the capital asset pricing model. The CAPM
model uses market risk premium, risk free rate, and beta to determine the cost of
equity. The market risk premium was estimated to be 7% based on the arithmetic
mean return over the period of 1926-2002. The risk free rate was found to be 4.69%,

40
using 5-year treasury maturity rates. Beta was found by doing a regression of market
returns and ConocoPhillips returns.
Rf R^2 Beta Ke
60 0.0469 0.113037669 0.604624 0.089224
48 0.0469 -0.005963538 0.277305 0.066311
36 0.0469 0.040292202 0.810727 0.103651
24 0.0469 -0.008523918 0.621729 0.090421
After running the regression for two, three, four, and five years the data was
analyzed to determine an appropriate cost of equity. The 3-year cost of equity best
reflects the current state of the firm. The 3-year beta reflects most analyst estimates
and the cost of equity of 10.36% produces the most reliable results in future valuation
models. Valuation models used in valuing ConocoPhillips will rely heavily on the cost of
equity assumption.
Cost of Debt
Using financial statements from the past five years to determine average interest
rates on each component of liabilities for ConocoPhillips a cost of debt could be
determined. Weights were found for each component of liabilities by dividing the
number by total liabilities. Adding together the weights of each component multiplied
by the average interest gave a total for cost of debt of 5.99%.
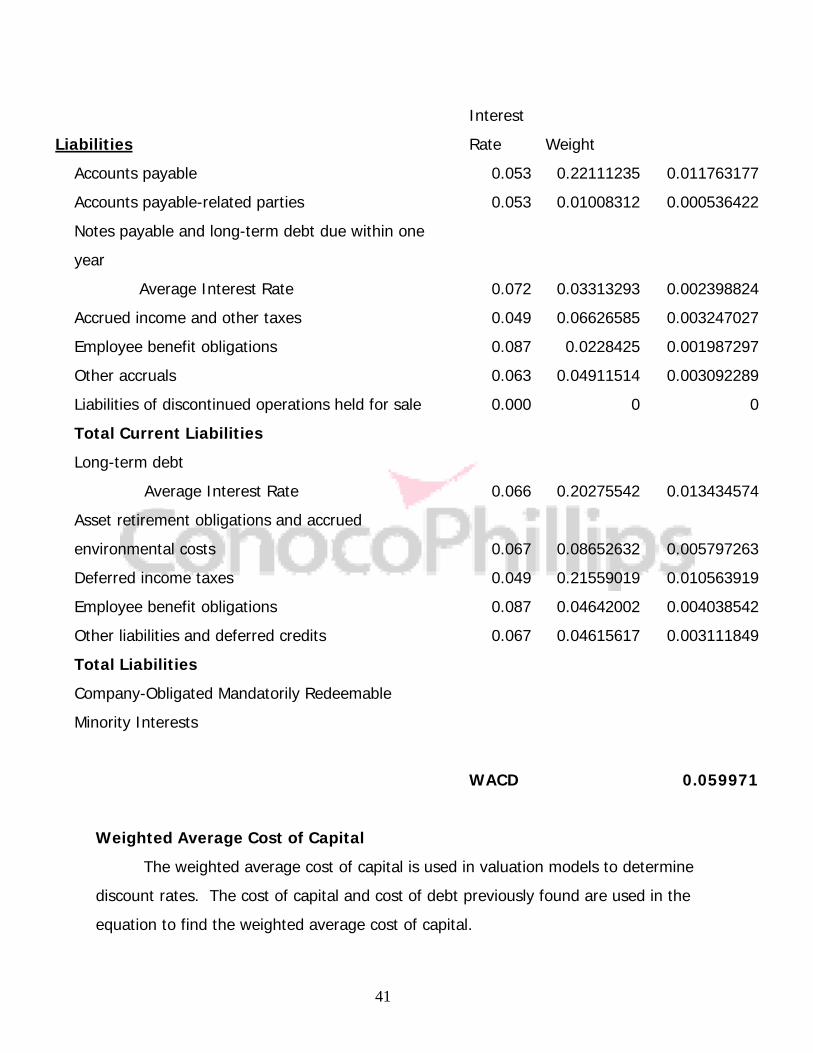
41
Weighted Average Cost of Capital
The weighted average cost of capital is used in valuation models to determine
discount rates. The cost of capital and cost of debt previously found are used in the
equation to find the weighted average cost of capital.
Liabilities
Interest
Rate Weight
Accounts payable 0.053 0.22111235 0.011763177
Accounts payable-related parties 0.053 0.01008312 0.000536422
Notes payable and long-term debt due within one
year
Average Interest Rate 0.072 0.03313293 0.002398824
Accrued income and other taxes 0.049 0.06626585 0.003247027
Employee benefit obligations 0.087 0.0228425 0.001987297
Other accruals 0.063 0.04911514 0.003092289
Liabilities of discontinued operations held for sale 0.000 0 0
Total Current Liabilities
Long-term debt
Average Interest Rate 0.066 0.20275542 0.013434574
Asset retirement obligations and accrued
environmental costs 0.067 0.08652632 0.005797263
Deferred income taxes 0.049 0.21559019 0.010563919
Employee benefit obligations 0.087 0.04642002 0.004038542
Other liabilities and deferred credits 0.067 0.04615617 0.003111849
Total Liabilities
Company-Obligated Mandatorily Redeemable
Minority Interests
WACD 0.059971

42
Value Debt
Value Equity WACC BT
= Value Firm
(Kd) +
Value Firm
(Ke)
Value Debt
Value Equity WACC AT
= Value Firm
(Kd)(1-Tax Rate) +
Value Firm
(Ke)
The value of debt was taken directly off of ConocoPhillips’ balance sheet. The
value of equity was found by taking the total common stockholders equity off of the
balance sheet. The value of the firm was found to be the value of total assets on the
balance sheet. The cost of debt and equity were computed in earlier calculations. The
tax rate was found to be 43%. After inputting all appropriate numbers into the
formula, the before-tax WACC and after-tax WACC were found to be 8.17% and 6.88%
respectively.
Discounted Dividend Method
The estimated value of ConocoPhillips using the Discounted Dividend Model is
$46.50 a shares. This is significantly lower than the current market price of $60.30 per
share. Overall our valuation of the ConocoPhillips is slightly undervalued, so using only
dividends to predict the value of the firm is not accurate. This is because other factors
such as residual income and abnormal earnings have more of an effect on the value of
the firm than does dividends. It is also important to note that this valuation is reached
by assuming a growth rate of 5 percent, but if a 7 percent growth rate is assumed the
estimated value of the firm is slightly higher than the market value of the firm. This
growth rate could vary likely happen if ConocoPhillips continues to grow at the rate that
it has over the last 5 years. Furthermore, the Discounted Dividend Valuation of
ConocoPhillips is very sensitive to the growth rate. When assuming a Cost of Equity
around 11 percent, the estimated value of ConocoPhillips jumps from $41.84 a share to
$157.59 a share assuming a growth rate of 5 to 10 percent. This illustrates that the
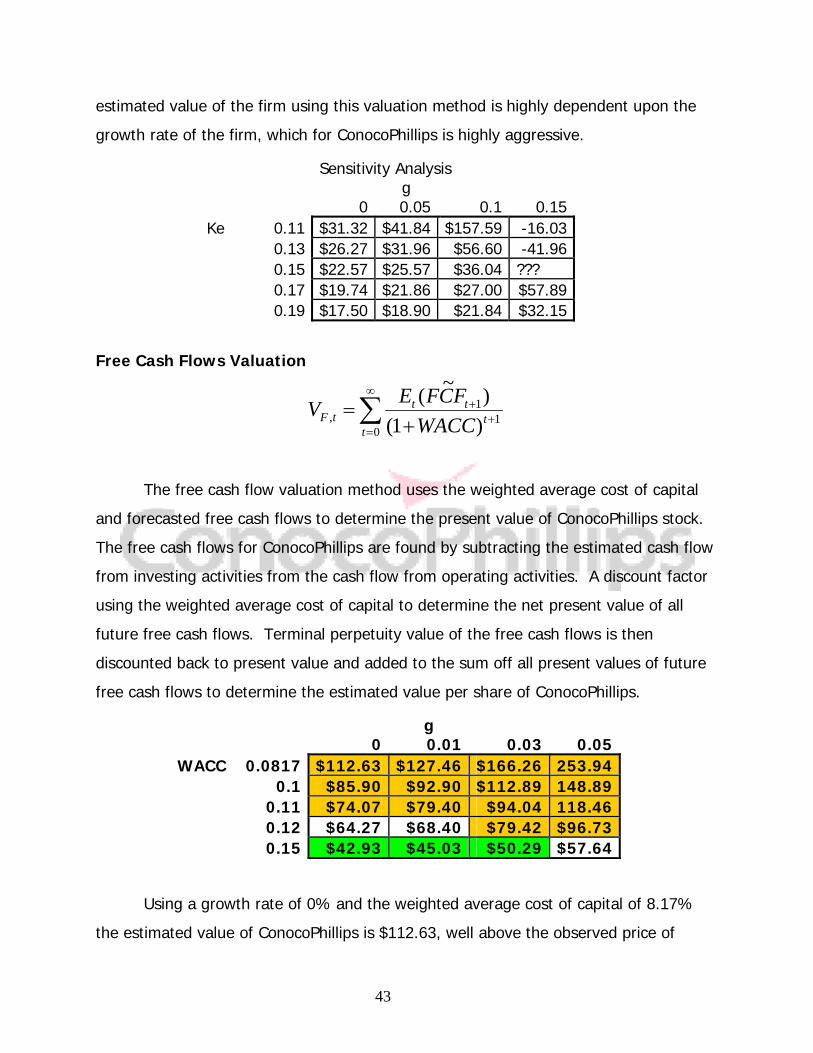
43
estimated value of the firm using this valuation method is highly dependent upon the
growth rate of the firm, which for ConocoPhillips is highly aggressive.
Sensitivity Analysis g 0 0.05 0.1 0.15
Ke 0.11 $31.32 $41.84 $157.59 -16.03 0.13 $26.27 $31.96 $56.60 -41.96 0.15 $22.57 $25.57 $36.04 ??? 0.17 $19.74 $21.86 $27.00 $57.89 0.19 $17.50 $18.90 $21.84 $32.15
Free Cash Flows Valuation
∑∞
=+
+
+=
01
1, )1(
)~(t
ttt
tF WACCFCFEV
The free cash flow valuation method uses the weighted average cost of capital
and forecasted free cash flows to determine the present value of ConocoPhillips stock.
The free cash flows for ConocoPhillips are found by subtracting the estimated cash flow
from investing activities from the cash flow from operating activities. A discount factor
using the weighted average cost of capital to determine the net present value of all
future free cash flows. Terminal perpetuity value of the free cash flows is then
discounted back to present value and added to the sum off all present values of future
free cash flows to determine the estimated value per share of ConocoPhillips.
Using a growth rate of 0% and the weighted average cost of capital of 8.17%
the estimated value of ConocoPhillips is $112.63, well above the observed price of
g 0 0.01 0.03 0.05 WACC 0.0817 $112.63 $127.46 $166.26 253.94
0.1 $85.90 $92.90 $112.89 148.89 0.11 $74.07 $79.40 $94.04 118.46 0.12 $64.27 $68.40 $79.42 $96.73 0.15 $42.93 $45.03 $50.29 $57.64

44
$60.30. This model shows that ConocoPhillips is currently undervalued and that the
model is very sensitive to cost of capital adjustments and growth rates. The high
sensitivity to both cost of capital and growth rates makes this model unreliable for
valuing ConocoPhillips.
Residual Income Method
The estimated value of ConocoPhillips using the Residual Income Method is
$84.98 a shares. This is higher than the current Market Price of $60.30 a share. This
higher price is mainly due to the increase in forecasted net income over the next 10
years and the present value of the terminal value, which is projected to be high. The
estimated price using this method is very sensitive to both the cost of equity and the
growth rate. When holding the growth rate constant, the estimated price of
ConocoPhillips has a $20 to $100 difference assuming a cost of equity between 11 and
15 percent. The same holds true when holding the cost of equity constant and changing
the growth rate. It is important to note that assuming a growth rate of 0 percent or
more and a cost of equity of 11 percent, which is above our estimated cost of equity,
the estimated price per share is higher than the actual price per share in most cases.
The growth rate of ConocoPhillips will more than likely be above 0 percent; this means
ConocoPhillips is an undervalued company.
Sensitivity Analysis g 0 0.05 0.1 0.15Ke 0.11 65.32 74.78 178.9 22.72 0.13 51.167 53.64 64.36 21.48 0.15 41.285 41.19 40.89 ??? 0.17 34.09 33.05 30.51 15.26 0.19 28.74 27.37 24.54 14.65

45
Long Run ROE Method
The Long Run ROE method is not effective for the Valuation of ConocoPhillips.
This is because the LR ROE Method assumes that it is not possible for average return
on equity to stay around 10 percent over a period of 10 years. We believe and have
projected that ConocoPhillips will be able to maintain this 10 over the majority of the
next 10 years as it has for the past 5 years. Although it is not possible to get a material
number using the assumptions that used in to this method, it can be assumed that the
actual price per share of ConocoPhillps is undervalued when considering the forecasted
growth rate of book value.
Abnormal Earnings Growth
The Abnormal Earnings Growth is a valuation model helps determine actual value of a
company with the usage of dividend payments forecasted from future earnings. The
AEG is said to determine the additional growth of the dividends and at the rate of
reinvestment. ConocoPhillips pays
dividends consistently every year;
however, the amount of the dividends
is left to speculation. The continuing
terminal value calculated to zero
simply because the changes of the
predicted AEGs slowly became closer
to zero. ConocoPhillips pays
dividends as the results were all fairly
similar to the results of other valuation models.
The recent actual share price was listed on November 1, 2006 as $60.30. After the
calculations of cost of equity and using the growth rate of 5%, the value per share
resulted as $71.13. This higher estimated value means investors should buy
ConocoPhillips stock as this firm is undervalued.
Core EPS 6.6268
Total PV of AEG 0.7457
Continuing Terminal Value 0
Total PV of AEG 0.7457
Total Average EPS 7.3725
Capitalization Rate (perpetuity) 0.103651
Ke 0.103651
g 0.05
Value Per Share (End of 2005) 71.12805

46
After calculation of the Sensitivity Analysis, it can be assumed that growth rate has no
effect on the value of ConocoPhillips.
The perpetuity of the Abnormal
Earnings Growth is seen to become
zero in the long run, determining no
growth. Even with a 5% growth rate
or a 10% growth rate, there is no
change in price. Once the Cost of
Equity changes, the value of the firm
is inversely related meaning as cost of equity increases, value decreases.
The Abnormal Earnings Growth valuation model does an excellent job with valuing the
firm even though there is no growth due to zero perpetuity AEG. The firm is shown as
undervalued, very sensitive to cost of capital changes, and insensitive to any growth
rates.
Credit Information
To determine the creditworthiness of a company bankers and financial analysts
often times use the Altman Z-score to determine this information. This formula puts
different weights on variety of ratios that determine the creditworthiness of a company.
These ratios include profitability, volatility, and leverage ratios that help determine how
the company is doing financially and the company’s ability to repay its debt. A
company that has a Z-score below 1.8 is said to be going bankrupt, a company that has
a Z-score between 1.8 to 2.7 is considered to be a slight credit risk, and companies
over 2.7 on the Z-score is said to be credit worthy.
Sensitivitiy Analysis
g
ke 0 0.05 0.1 0.15
0.103651 71.12805 71.12805 71.12805 71.12805
0.123651 55.09364 55.09364 55.09364 55.09364
0.143651 44.07269 44.07269 44.07269 44.07269
0.163651 36.15105 36.15105 36.15105 36.15105
0.183651 30.2601 30.2601 30.2601 30.2601

47
At this time ConocoPhillips’ has a Z-score of 2.27 which is
considered to be a slight credit risk. In 2002, when the Conoco
and Phillip’s merged together, the company had a Z-score of .89,
which is considered by bankers to be near bankruptcy. Since
the merger, ConocoPhillips has increased its Z-score significantly
and was once again credit worthy in 2005. ConocoPhillips’
ability to continually increase this Z-score was due to the increase in sales over the past
few years. The company’s equity to debt ratio is very small and is not causing a large
change in the Z-score. The main cause of change in ConocoPhillips’ Z-score is the
relationship between sales and total assets. As this ratio increases the Z-score has an
improvement of relatively the same amount.
As long as the company continues to keep the amount of sales greater than the
amount of total assets, it appears that the company will continue to be a creditworthy
company. By maintaining a creditworthy Z-score, bankers will be more likely to give
ConocoPhillips loans that will allow the company to continue its growth in the
competitive integrated oil and gas industry.
Summary of Valuations
Two of the assessments used for ConocoPhillips proved to be accurate, one was
valuated too high, and the other was inaccurate and didn’t apply to the overall
evaluation. The most accurate valuations used were Abnormal Earnings Growth (AEG)
and the Residual Income (RI) model leaving Discounted Dividends (DD) and as the
least accurate. Our valuation of Long Run Return on Equity (LR ROE) proved to be
invalid for reasons discussed later in this section. The AEG and RI intrinsic valuations
reveal on the most accurate basis that ConocoPhillips is an undervalued company. The
estimated value per share produced by these two methods was $71.13 and $84.98
respectively. The current market price per share for ConocoPhillips at the time of
valuation is $61.77. By establishing an accurate cost of equity, we feel that the price
per share is a fair estimate of what ConocoPhillips’ per share value is worth. The DD
method was our least accurate due to factors attributed to the growth rate associated
Z-Score 2001 1.40 2002 0.89 2003 1.76 2004 2.24 2005 2.80 2006 2.27

48
with discounted dividends. The growth rate and DD are very sensitive to each other
resulting in an exaggerated increase in share price. The shift in the growth rate, even
just by small amounts, resulted in values that were either too low or too high. A middle,
more reasonable number could not be obtained due to the extreme sensitivity that our
model and the growth rate shared. Our LR ROE valuation proved to be inaccurate due
to the fact that it assumes that return on equity of 10 percent is not feasible for a
period of 10 years. For the past 5 years, ConocoPhillips has maintained a return on
equity at or above 10 percent and we feel that our evaluation accurately shows that
ConocoPhillips will maintain this growth a further 10 years.
The valuations used within this report are all subject to the quality of accounting
disclosures revealed by ConocoPhillips. It is ConocoPhillips’ responsibility to the investor
as well as the SEC to disclose accounting policies as accurately as possible. Although we
have evaluated the disclosures of ConocoPhillips and find them to be with few flaws, it
does not guarantee that ConocoPhillips has accurately depicted their financial
statements.
In conclusion, we feel that our valuations of ConocoPhillips as a firm, its
accounting policies, financial statements, the industry in which it resides, and the
corporate summaries disclosed accurately depict ConocoPhillips as an undervalued
company. Using our most accurate measurement to date, we came up with an overall
intrinsic valuation of $71.13. We feel that this $9.36 overstatement of price per share
provides an excellent buying opportunity for those who are ready to invest.

49
APPENDIX Table of Contents
Appendix – Ratios
Appendix A
Income Statement
Balance Sheet
Statement of Cash Flows
Common Size Balance Sheet
Common Size Income Statement
Appendix B
ConocoPhillips Ratio Analysis
BP Ratio Analysis
ChevronTexaco Ratio Analysis
ExxonMobil Ratio Analysis
Industry Ratio Analysis
Appendix C
Weighted Average Cost of Capital
Cost of Debt
Cost Equity
Method of Comparables
Discounted Dividends
Discounted Free Cash Flows
Residual Income Valuation
Long Run Return on Equity Valuation
Abnormal Earnings Growth
Z-Score

50

51

52

53

54

55
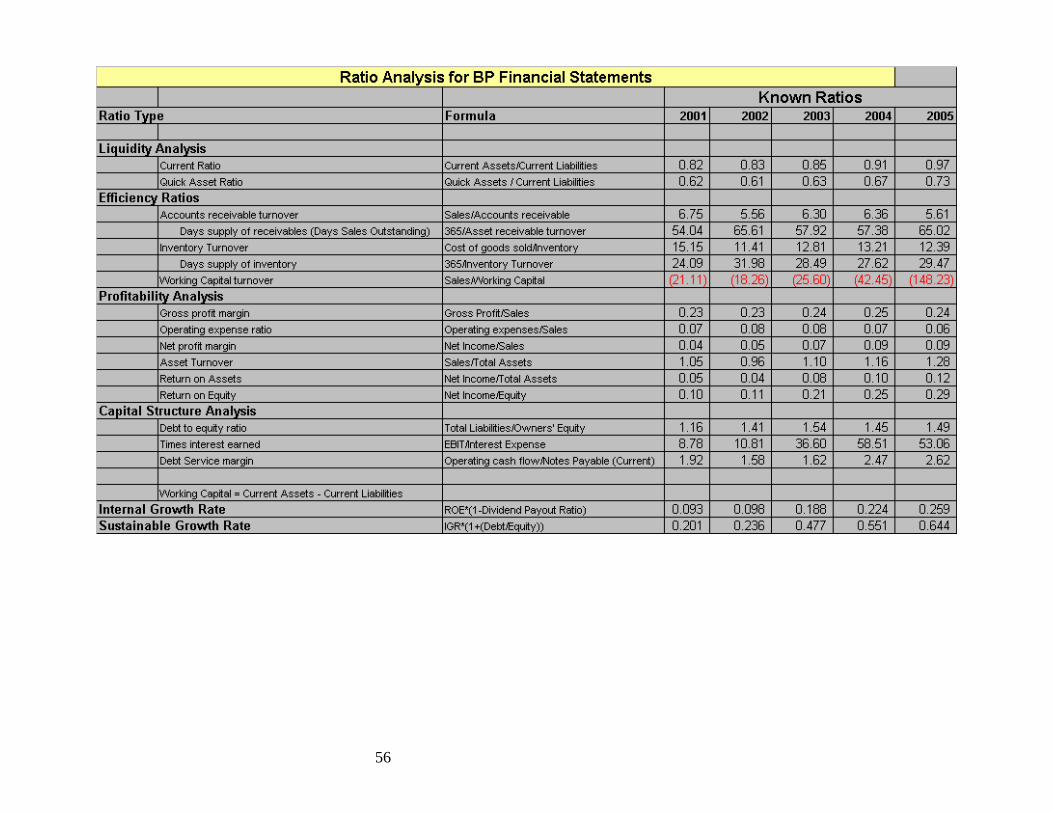
56

57

58

59

60

61

62

63

64

65

66

67

68

69
References
1. ConocoPhillips Website- Company information

70
www.conocophillips.com
2. Yahoo! Finance- Current and past stock prices for company and competitors
finance.yahoo.com
3. Value Line- Detailed Stock Information
www.valueline.com
4. Chevron’s Homepage- Competitor Information
www.chevron.com
5. ExxonMobil Homepage- Competitor Information
www.exxonmobil.com
6. BP’s Homepage- Competitor information
www.bp.com
7. Dr. Moore’s Homepage and previous evaluations
http://mmoore.ba.ttu.edu
8. Big Charts- historical stock prices
www.bigcharts.com
9. Price Water House- 10-k information
http://edgarscan.pwcglobal.com
10. E-Trade Financial
etrade.com
11. Securities and Exchange Commission Website
sec.gov
12. St. Louis Federal Reserve- Current Risk Free Rates
stlouisfed.org
13. Google- General Information
google.com