synoptic aspects of the central chile rainfall variability associated with the southern oscillation
TRANSCRIPT

INTERNATIONAL JOURNAL OF CLIMATOLOGY, VOL. 11,63-76 (1991) 55 1.5 13.755 1.577.36(83)
SYNOPTIC ASPECTS OF THE CENTRAL CHILE RAINFALL VARIABILITY ASSOCIATED WITH THE SOUTHERN
OSCILLATION
JOSE RUTLLANT AND HUMBERTO FUENZALIDA
Department of Geophysics, University of Chile, Casilla 2777. Santiago, Chile
Received 18 August 1988 Revised 2 February 1990
ABSTRACT
Central Chile winter (June, July, August (JJA)) rainfall shows positive anomalies during the developing stage of warm events of the Southern Oscillation. Conversely, cold events correspond quite closely to dry conditions.
A synoptic characterization of major storms during the most recent warm events is presented. Dry months during cold- event years are described in terms of average 500-hPa contour anomaly fields. Significant departures from this general behaviour are also discussed.
It is found that major winter storms associated with warm events are related to blocking highs frequently located around the Bellingshausen Sea (9OOW) within hemispheric circulation anomaly patterns where zonal wavenumbers 4 and 3 dominate. This phenomenon seems consistent with observed teleconnection wavetrains stemming from the anomalous atmospheric heat source above the equatorial Pacific during ENS0 events. Cold years, often immediately preceding or following a warm event, bring dry conditions in the study area owing to a well-developed south-east subtropical anticyclone with enhanced zonal westerly flow at middle latitudes.
Frequency distributions of 500-hPa daily blocking indices (BI) at 90°W, derived from 1980 to 1987 European Centre for Medium Range Weather Forecasts hemispheric analyses, show a significant departure towards positive BI values for the available warm-event winters; the opposite being also true. However, the JJA rainfall variability at Santiago (33.53) also seems to be related to the regional strength of the south-east Pacific anticyclone, as represented by seasonal 500-hPa geopotential anomalies at Puerto Montt, Chile (413"s).
KEY WORDS Circulation patterns Blocking Southem Oscillation Central Chile rainfall
1 . INTRODUCTION
The apparent relationship between the phases of the Southern Oscillation (SO) and rainfall anomalies in central Chile (30-35"s) has been reported by several authors. Rubin (1955), while taking into consideration pressure anomalies in the Southern Hemisphere, found that the precipitation in central Chile stays below normal during the positive phase of the SO, namely when the south-east Pacific subtropical anticyclone is stronger than average. The strength and position of the aforementioned anticyclone has also been related by Pittock (1980) to the interannual rainfall variability in the central part of Chile. Quinn and Neal (1983), in an attempt to relate long series of annual precipitation in Santiago (33*5"S, 70.7"W) and in Valparaiso (33.0°S, 71.6"W) with an El Niiio index, obtained a good correspondence of the interannual rainfall variability with area averaged sea-surface temperatures in the south-eastern tropical Pacific. More recently, Aceituno (1987) has correlated the pressure, temperature, wind, and precipitation fields with a Southern Oscillation Index (SOI), concluding that the tendency to positive rainfall anomalies in central Chile during the negative phase of the SO is associated with a weak and northerly displaced southeast Pacific subtropical anticyclone; together with an overall increase in baroclinicity at the subtropical latitudes produced by tropospheric cooling in the southern part of South America and a corresponding warming in tropical latitudes. At present, the Chilean rainfall anomaly seems to have gained a place in the world-wide sequence of major climatic anomalies related
0899-84 1 8/9 1/0 10063-1 4$07.OO 0 1991 by the Royal Meteorological Society
64 J. RUTLLANT AND H. FUENZALIDA
to a typical El NiiiolSouthern Oscillation (ENSO) episode (Rasmusson, 1987), although the limited geographical extent of the anomaly or the event-like structure of the heavy rainfall occurrences could have prevented its full appearance in a study by Ropelewski and Halpert (1987).
The middle and high latitude atmospheric response to the warm events in the central and eastern equatorial Pacific related to the SO has been explained through the concept of atmospheric teleconnectivity. It relates the anomalous heating of the atmosphere in the central equatorial Pacific with Rossby-like perturbation waves reaching middle and high latitudes through the action of the winter subtropical jet stream. Schematically, these waves would be formed downwind of a pair of upper tropospheric tropical anticyclonic anomalies generated as the divergent flow from the atmospheric heat source moves polewards. Although this wavetrain concept has been theoretically supported by Hoskins and Karoly (1981) in terms of simple physics, the relative independence of these global anomaly patterns with respect to the exact location of the heat source has led to the consideration of barotropic instability mechanisms (Simmons et al., 1983). The teleconnection composite anomaly patterns actually observed have been recorded by Horel and Wallace (1981) for the Northern Hemisphere and by Karoly (1986, 1989) for its southern counterpart. Some general circulation models have, however, partially succeeded in obtaining a reasonable representation of the observed anomaly fields (e.g. Lau, 1985).
A preliminary study on the synoptic aspects of the rainfall events in Santiago during the wet years 1972 and 1982 (Rutllant, 1987) indicated the importance of blocking to the south-west of South America, presumably tied with the teleconnection pattern described by Karoly (1986). The present study aims at the character- ization of the large-scale and synoptic-scale weather patterns associated with the interannual rainfall variability in the Santiago-Valparaiso area, and their comparison with average and composite patterns of the Southern Hemisphere circulation during the extremes of the SO.
2. INTERANNUAL VARIABILITY OF RAINFALL
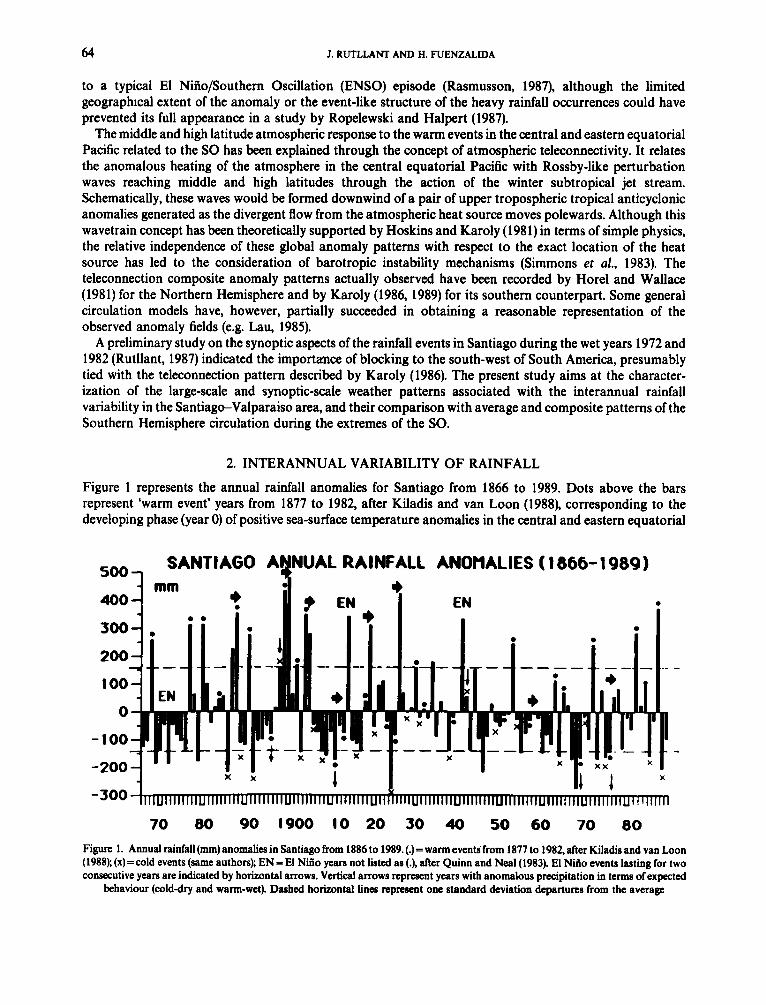
Figure 1 represents the annual rainfall anomalies for Santiago from 1866 to 1989. Dots above the bars represent ‘warm event’ years from 1877 to 1982, after Kiladis and van Loon (1988), corresponding to the developing phase (year 0) of positive sea-surface temperature anomalies in the central and eastern equatorial
70 80 90 1900 10 20 30 40 50 60 70 80
Figure 1. Annual rainfall (mm) anomalies in Santiago from 1886 to 1989. (.)=warm events from 1877 to 1982, after Kiladis and van Loon (1988); (x) = cold events (same authors) EN = El Ni5o years not listed as (.), after Quinn and Neal (1983). El Niao events lasting for two consecutive years are indicated by horizontal arrows. Vertical arrows represent years with anomalous precipitation in terms of expected
behaviour (cold-dry and warm-wet). Dashed horizontal lines represcnt one standard deviation departures from the average
CENTRAL CHILE RAINFALL VARIABILITY 65
Pacific associated with the negative phase of the Southern Oscillation. ‘Cold-event’ years during the positive phase of the SO, according to the same authors, are represented by x. The warm-event year of 1868, after van Loon and Shea (1985), and some cases not listed by Kiladis and van Loon but quoted as El Niiio (EN) years by Quinn and Neal (1983), are also included. El Niiio events lasting for two consecutive years, according to these authors, are indicated by horizontal arrows. One standard deviation above and below the average are indicated by dashed horizontal lines.
In general, a tendency towards the association between wet (dry) years and warm (cold) events is apparent. From a total of 23 wet years, with annual rainfall equal or larger than one standard deviation above the normal, 20 correspond to warm events (including the recent one in 1987) and only one to a cold event. In contrast, from a total of 28 years with annual rainfall equal or less than one standard deviation below the average (including the recent 1985 and 1988 cold events), 11 correspond to cold events and only three to warm events. The remaining 14 dry years include five that occurred prior to the first cold event reported by Kiladis and van Loon, and possible 2-year ‘anti-El-NiGo’ cases, equivalent to those reported by Quinn and Neal (1983) for EN events. The ‘anomalous’ tendency of the annual precipitation with respect to the afore- mentioned general behaviour during the warm events of 1896, 1911, 1969, and 1976, and during the cold events of 1898 and 1970, is indicated in Figure 1 by vertical arrows.
In addition to the almost certain influence of forcing mechanisms not related to the SO in explaining the interannual variability of the central Chile rainfall, some departures from the described behaviour could be explained. For instance 1969, not listed in Quinn and Neal (1983), was associated with noisy (SLP) positive anomalies of sea-level pressure (SLP) at Darwin, supposedly representative of the basin-wide anomalous warming (Deser and Wallace, 1987). Similarly, the 1976 case was characterized by warming along the South American coast, without a basin-wide counterpart.
Dry years not listed as cold events but immediately preceding or following warm events also deserve special consideration. In fact, only four out of 20 cold-event years in Kiladis and van Loon (1988) do not actually correspond to years immediately preceding or following a warm event. Therefore, it is plausible that some dry years could have featured opposite anomalies to those characterizing contiguous warm events, as will be discussed in section 6. For example, during the extremely dry 1968, the first half of the year presented negative departures in the SLP at Darwin (basin-wide cooling) and in the SST at Puerto Chicama, Peru (South American cooling), according to Deser and Wallace (1987).
3. CASE STUDY
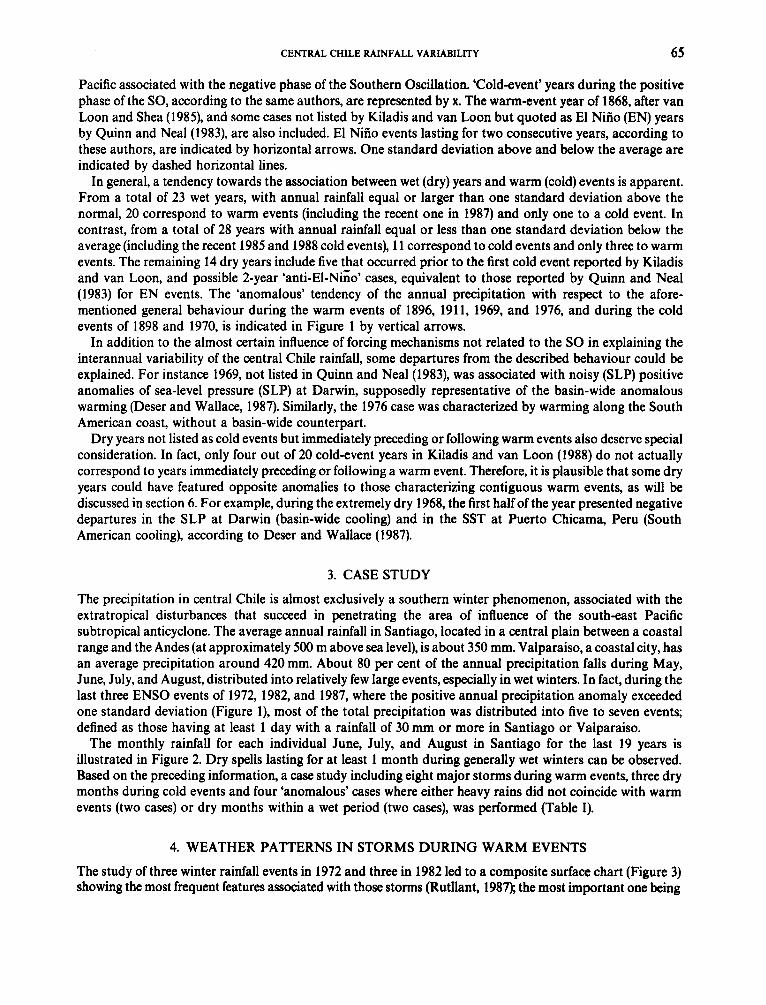
The precipitation in central Chile is almost exclusively a southern winter phenomenon, associated with the extratropical disturbances that succeed in penetrating the area of influence of the southeast Pacific subtropical anticyclone. The average annual rainfall in Santiago, located in a central plain between a coastal range and the Andes (at approximately 500 m above sea level), is about 350 mm. Valparaiso, a coastal city, has an average precipitation around 420 mm. About 80 per cent of the annual precipitation falls during May, June, July, and August, distributed into relatively few large events, especially in wet winters. In fact, during the last three ENS0 events of 1972, 1982, and 1987, where the positive annual precipitation anomaly exceeded one standard deviation (Figure l), most of the total precipitation was distributed into five to seven events; defined as those having at least 1 day with a rainfall of 30 mm or more in Santiago or Valparaiso.
The monthly rainfall for each individual June, July, and August in Santiago for the last 19 years is illustrated in Figure 2. Dry spells lasting for at least 1 month during generally wet winters can be observed. Based on the preceding information, a case study including eight major storms during warm events, three dry months during cold events and four ‘anomalous’ cases where either heavy rains did not coincide with warm events (two cases) or dry months within a wet period (two cases), was performed (Table I).
4. WEATHER PATTERNS IN STORMS DURING WARM EVENTS
The study of three winter rainfall events in 1972 and three in 1982 led to a composite surface chart (Figure 3) showing the most frequent features associated with those storms (Rutllant, 1987); the most important one being
66 J. RUTLLANT AND H. FUENZALIDA
400 SANTIAGO JJA RAINFALL ( 1970- 1989)
300 I
1970 1975 1980 1985
Figure 2. Santiago monthly rainfall for June, July and August of each year between 1970 and 1989
Table I. Case study
Year June July August
Rainfall episodes during warm events 1972 05-14 10-15
1982 09-19 04-17
1987 09-16 08-14
26-29
23-27
Dry month during cold events 1973 X
1975 X
1985 X
Other rainfall episodes 1974 24-30 1984 01-1 1
Dry months during warm events 1986 X 1987 X
a blocking anticyclone in the lower left of that figure, driving cyclonic trajectories through central Chile as a consequence of the flow separation. A deep continental trough with a closed low in north-west Argentina was also a frequent occurrence, separating the Pacific high from a well-developed Atlantic subtropical anticyclone. A stationary front was often located in north-east Argentina and a deep low pressure area was characteristic in the Antarctic peninsula sector.
The first case, between 5 and 14 June 1972; occurred within an 'hemispheric blocking event', as reported in Mo (1986). Analysis of the 500-hPa level, from the Southern Hemisphere Analysis Centre in Melbourne, Australia (SHAC), indicates a deep ridge in the Bellingshausen Sea area, especially about the end of the period, when a zonal wavenumber 3 dominates the hemispheric circulation. At the sudace, storm tracks O C C U K ~ between 30"s and 45"s.

CENTRAL CHILE RAINFALL VARIABILITY 67
Figure 3. Composite SLP chart with the most frequent features associated with rainfall events in 1972 and 1982 (from Rutllant, 1987)
The second storm in June 1972 (Table I) could not be classified as blocking owing to its short duration. However, a slowly moving warm high at 45"s and a weak south-east Pacific subtropical anticyclone produced the required configuration for the rainfall in central Chile. During that period, the Atlantic subtropical anticyclone was particularly well developed.
The most relevant feature in the storm that began on 10 August 1972, was a slowly moving anticyclone, located at about 160"E at the beginning of the month. It moved across the southern Pacific reaching the Atlantic on 19 August, after staying in the Bellingshausen Sea area between 6 and 15 August. The maximum intensity of the 500-hPa ridge occurred between 8 and 10 August, just ahead of the rainfall event.
In the South American sector, during the first storm of June 1982 (Table I), a large blocking anticyclone with central pressures exceeding 1035 hPa coincided with a deep ridge at 500 hPa, oriented in a north- west-south-east direction. The hemispheric circulation presented dominant zonal wavenumbers 3 and 4, with the main troughs located around 75"E, 160"W, and 45"W at the 50" latitude circle. A dominant wavenumber 4 at the 500-hPa level was particularly well developed during days 12, 13 and 14. After 14 June, the blocking anticyclone moved towards the Chilean coast, spreading over the southern part of the continent. A cut-off low in the Juan Fernandez Islands area was also present towards the end of the rainfall period.
The rainfall during the second case of June 1982 was concentrated between 27 and 29 June, when a diffluent flow regime formed again.
The first part of the rainy period in July 1982 responded once more to the typical blocking pattern to the south-west of the continent. From 13 July onwards, the system became disorganized, the bulk of the precipitation being mainly associated with a short wave trough.
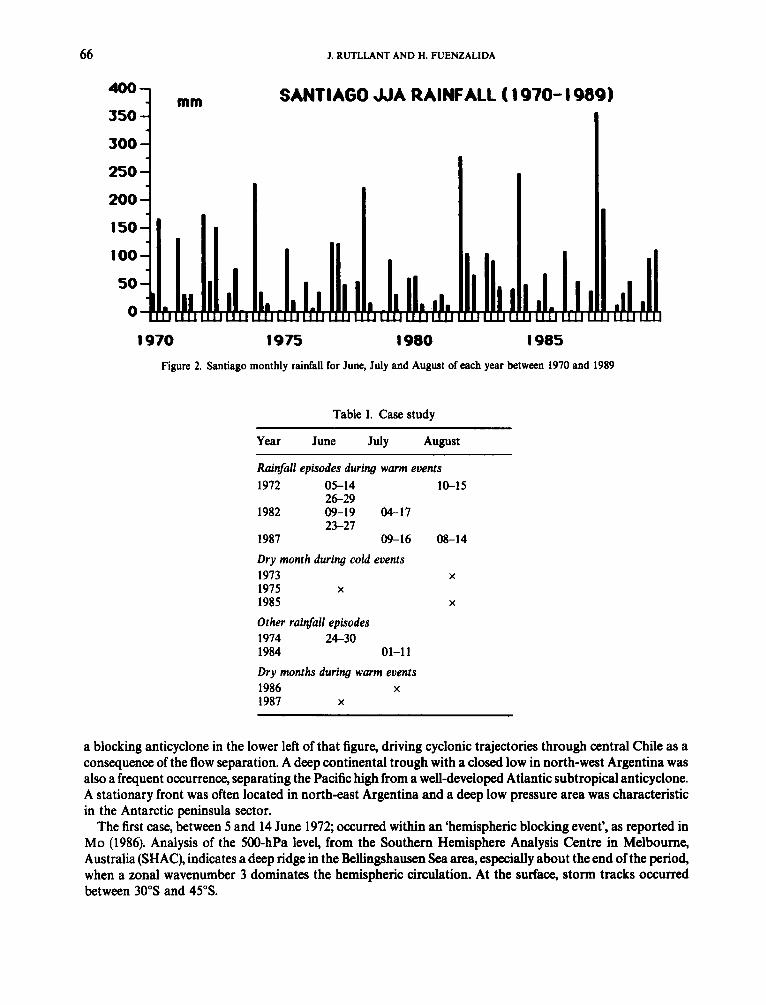
A similar configuration could be observed in the large storms that occurred in July and August 1987. The first one, from 9 to 17 July, accumulated more than 260 mm in Santiago producing severe flooding. The second major storm developed between 8 and 12 August, with heavy rainfall also spreading into southern Chile. The hemispheric nature of the circulation anomalies during July 1987 can be appreciated from Figure 4, where the monthly 500.hPa contour field anomalies show a distorted wavenumber 3 pattern with values
68 J. RUTLLANT AND H. FUENZALIDA
Figure 4. 500-hPa mean contour anomalies for July 1987 (adapted from Climate Diagnostics Bulletin, CAC/NWS, USA)
exceeding + 120 gpm to the south-west of South America. Also noticeable is the ‘dipole-like’ structure in the anomaly field west (+) and east (-) of the southern edge of South America.
Concerning the location of the blocking area described here, it is interesting to note that the position of these blocking highs does not correspond to the longitude of highest frequency of blocking occurrence. Trenberth and Mo (1985) have found that the most frequent blocking area is to the south-east of the continent. The possible relationship between the position of the blocking highs characterizing those storms and the teleconnection patterns during warm events is to be discussed in section 6.
5. DRY WEATHER PATTERNS DURING COLD EVENTS
August 1973 was a dry month in the winter following the warm event of 1972-1973. The total precipitation accumulated during that month in Santiago was only 1 mm while no rainfall was reported in Valparaiso. The most prominent feature in the SHAC daily surface analyses is a stable, strong south-east Pacific subtropical anticyclone, often extending to southern South America. The middle troposphere flow is characterized by a high zonal index with high frequency, low amplitude travelling waves, together with a tendency for the occurrence of north-west-south-east aligned ridges over the southern part of South America.
During June 1975, before the moderate warm event of 19761977, Santiago and Valparaiso accumulated 2 and 56 mm of rain, respectively, indicating that central Chile was only marginally affected by the winter cyclonic activity. Daily surface analyses of SHAC reveal frequent frontal passages, especially in the second half of the month. However, the systems moved rapidly, allowing for a net anticyclonic dominance in central Chile. The most relevant feature in the 500-hPa charts is the presence of a deep trough in the Bellingshausen Sea that extended northward in the second half of the month, bringing pre-trough conditions in south-central Chile.
Only 8 mm in Santiago and no rainfall in Valparaiso was recorded in August 1985, in the year preceding the recent warm event of 19861987. Figure 5 shows again the Bellingshausen negative anomaly in the mean surface chart for that month. Northwards, a positive anomaly can be related to an enhanced south-east Pacific subtropical anticyclone. However, the deepest anticyclonic anomaly in Figure 5 is located to the east of the southern tip of South America, conforming with the Bellingshausen low, a dipole-like structure with opposite signs and slightly shifted eastward with respect to the one described in the preceding section.
The mean sea-level anomaly pattern coincides with the middle tropospheric one, as shown in Figure 6.

CENTRAL CHILE RAINFALL VARIABILITY 69
Figure 5. Sea-level pressure mean anomalies for August 1985 (adapted from Daily Global Analyses, Operational Data Assimilation System, ECMWF, UK)
Figure 6. 500-hPa mean contour anomalies for August 1985 (adapted from Daily Global Analyses, Operational Data Assimilation System, ECMWF, UK)
6. SYNOPTIC PATTERN ANALYSIS FOR WET AND DRY WINTER YEARS
It has been mentioned already that from the 20 cold events reported by Kiladis and van Loon (1988), only four have occurred without an apparent connection with warm events (Figure 1). If, following these authors, the developing phase of warm events occurs in the ‘year O’, eight cold events coincide with a ‘year - 1’ and twelve with a ‘year + l’, bringing the full contrast of the SO cycle in a 2-year time span.

70 J. RUTLLANT AND H. FUENZALIDA
%
Figure 7. Sea-level pressure composite anomalies for MJJ in the years where warm events develop (year 0) (adapted from van Loon, 1986)
Figure 8. As in Figure 7, but for year - 1
Composite sea-level pressure anomalies in the southern winter during the occurrence of warm events in the central equatorial Pacific have been presented by van Loon (1986) for ‘year 0’ and ‘year - 1’. Figures 7 and 8, from van Loon, illustrate the fact that the dipole anomaly structure relative to the South American southern edge changes sign from ‘year - 1’ to ‘year 0’, the last one coinciding with the pattern described in section 4. According to the same author, the opposite happens during cold events, again including a change of sign in
CENTRAL CHILE RAINFALL VARIABILITY 71
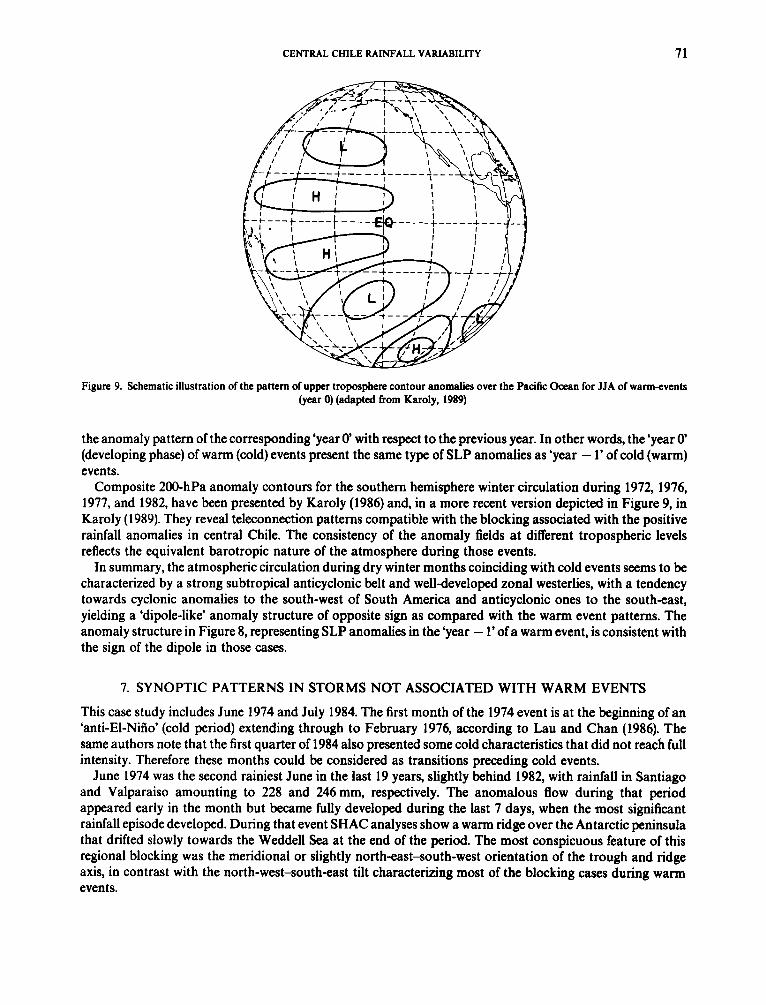
Figure 9. Schematic illustration of the pattern of upper troposphere contour anomalies over the Pacific Ocean for JJA of warm-events (year 0) (adapted from Karoly, 1989)
the anomaly pattern of the corresponding ‘year 0’ with respect to the previous year. In other words, the ‘year 0’ (developing phase) of warm (cold) events present the same type of SLP anomalies as ‘year - 1’ of cold (warm) events.
Composite 200-hPa anomaly contours for the southern hemisphere winter circulation during 1972, 1976, 1977, and 1982, have been presented by Karoly (1986) and, in a more recent version depicted in Figure 9, in Karoly (1989). They reveal teleconnection patterns compatible with the blocking associated with the positive rainfall anomalies in central Chile. The consistency of the anomaly fields at different tropospheric levels reflects the equivalent barotropic nature of the atmosphere during those events.
In summary, the atmospheric circulation during dry winter months coinciding with cold events seems to be characterized by a strong subtropical anticyclonic belt and well-developed zonal westerlies, with a tendency towards cyclonic anomalies to the south-west of South America and anticyclonic ones to the south-east, yielding a ‘dipole-like’ anomaly structure of opposite sign as compared with the warm event patterns. The anomaly structure in Figure 8, representing SLP anomalies in the ‘year - 1’ of a warm event, is consistent with the sign of the dipole in those cases.
7. SYNOPTIC PATTERNS IN STORMS NOT ASSOCIATED WITH WARM EVENTS
This case study includes June 1974 and July 1984. The first month of the 1974 event is at the beginning of an ‘anti-El-Niiio’ (cold period) extending through to February 1976, according to Lau and Chan (1986). The same authors note that the first quarter of 1984 also presented some cold characteristics that did not reach full intensity. Therefore these months could be considered as transitions preceding cold events.
June 1974 was the second rainiest June in the last 19 years, slightly behind 1982, with rainfall in Santiago and Valparaiso amounting to 228 and 246mm, respectively. The anomalous flow during that period appeared early in the month but became fully developed during the last 7 days, when the most significant rainfall episode developed. During that event SHAC analyses show a warm ridge over the Antarctic peninsula that drifted slowly towards the Weddell Sea at the end of the period. The most conspicuous feature of this regional blocking was the meridional or slightly north-east-south-west orientation of the trough and ridge axis, in contrast with the north-west-south-east tilt characterizing most of the blocking cases during warm events.
72 J. RUTLLANT AND H. FUENZALIDA
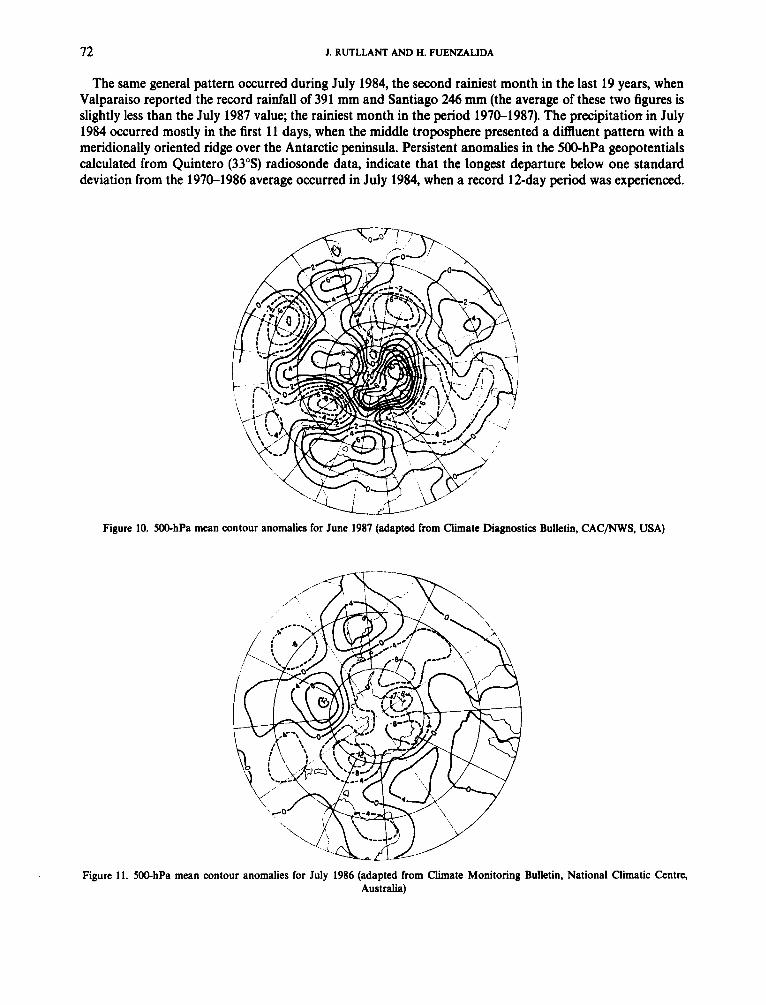
The same general pattern occurred during July 1984, the second rainiest month in the last 19 years, when Valparaiso reported the record rainfall of 391 mm and Santiago 246 mm (the average of these two figures is slightly less than the July 1987 value; the rainiest month in the period 1970-1987). The precipitation in July 1984 occurred mostly in the first 11 days, when the middle troposphere presented a diauent pattern with a meridionally oriented ridge over the Antarctic peninsula. Persistent anomalies in the 500-hPa geopotentials calculated from Quintero (33"s) radiosonde data, indicate that the longest departure below one standard deviation from the 1970-1986 average occurred in July 1984, when a record 12-day period was experienced.
Figure 10. 500-hPa mean Bulletin, CAC/NWS, USA)
Figure 11. 500-hPa mean contour anomalies for July 1986 (adapted from Climate Monitoring Bulletin, National Climatic Centre, Australia)
CENTRAL CHILE RAINFALL VARIABILITY 73
8. DRY CONDITIONS DURING WARM EVENTS
The months of July 1986 and June 1987 correspond to the driest July and to the second driest June in the 197CL1987 interval, respectively. In July 1986, the precipitation in Santiago and Valparaiso was 1 and 3 mm, respectively. The corresponding figures for June 1987 were 37 and 20 mm.
In the South American sector, 500-hPa anomaly contours for June 1987 (Figure 10) are in close qualitative agreement with those of July 1987 (Figure 4) only at high latitudes; the principal difference being in the intensity of the positive anomaly. However, between 30"s and 45"S, a significant anticyclonic anomaly centred just off the coast of central Chile brought rainless conditions.
Monthly mean 500-hPa height anomalies for July 1986 from the Climate Monitoring Bulletin of the World Meteorological Centre in Melbourne, Australia (Figure 11) indicate a similar pattern to that of June 1987, except that the positive anomaly affecting central Chile was centred over the continent.
25
20
15
I0
5
0
% .................................................................................... ...................................
............................................. ..... ...... ............... " " " ....................... ...............................................
..............................................................
.......................
25
20 %
15
10
-65 -55 -45 -35 -25 -15 -5 5 15 25 35 45 55 65
1, 1985)
5
0 -65 -55 -45 -35 -25 -15 -5 ' 5 15 25 35 45 55 65
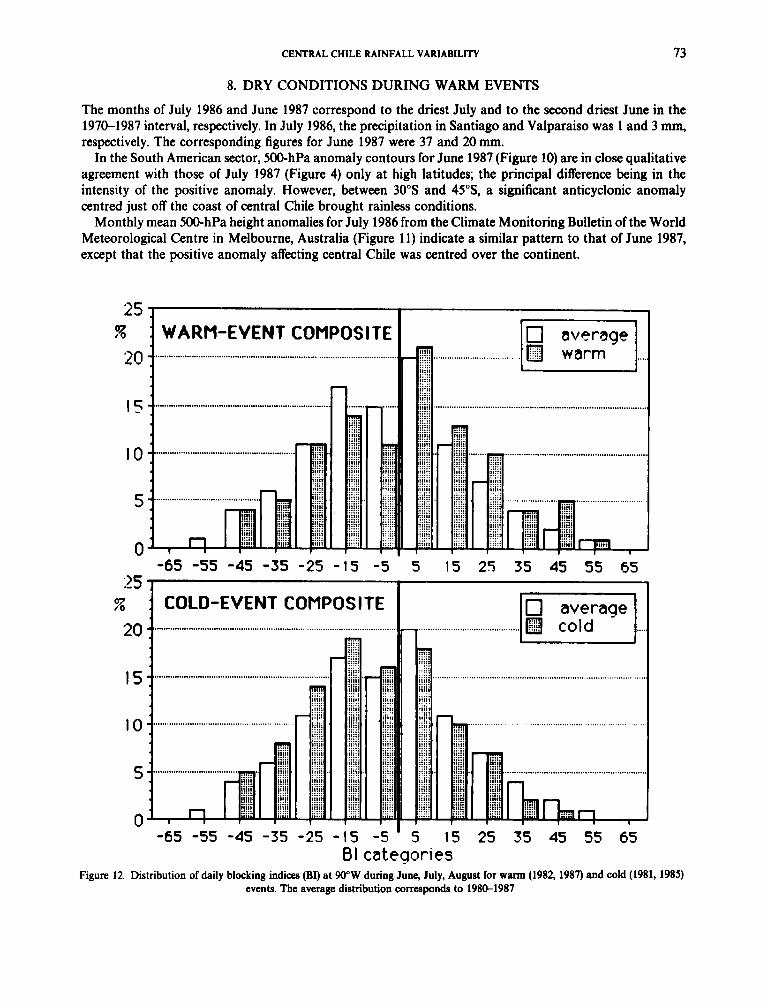
BI categories Figure 12. Distribution of daily blocking indices (BI) at 9O"W during June, July, August for warm (1982, 1987) and cold (198
events. The average distribution corresponds to 198&1987
74 J. RUTLLANT AND H. FUENZALIDA
* BI+/BI- (%I - AHSOO(gpm)
9. BLOCKING INDEX FREQUENCY DISTRIBUTION
The extension of the representativity of the preceding case study to seasonal conditions associated with warm and cold events of the SO was studied through a daily blocking index derived from 500-hPa hemispheric analyses issued by the European Centre for Medium Range Weather Forecasts (ECMWF), available for the period 1980-1987. Following the Australian Bureau of Meteorology, a blocking index has been defined as:
BI=0.5 (U(25)+ U(30)+ U(55)+ U(60)- U(40)- U(50)-2 x U(45)), where U is the zonal windspeed at the indicated latitudes. A smoothed BI value at the prevailing blocking longitude (Bellingshausen Sea: 90"W), has been obtained by averaging the corresponding values at 100°W and 80"W.
100
0
-100 (a1 79 80 81 82 83 84 85 86 87 88
year
lb1 79 80 81 82 83 84 85 86 87 88
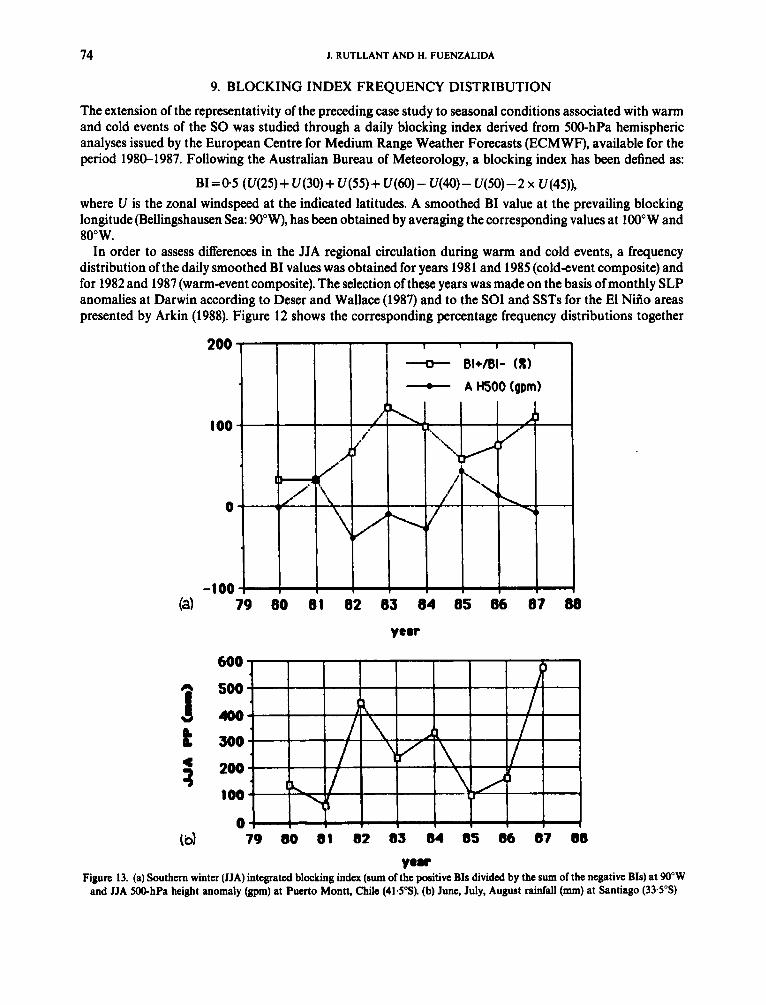
Figure 13. (a) Southern winter (JJA) integrated blocking index (sum of the positive BIs divided by the sum of the negative BIs) at W W and JJA 500-hPa height anomaly (gpm) at Puerto Montt, Chile (413"s). (b) June, July, August rainfall (mm) at Santiago (33.59)
year

CENTRAL CHILE RAINFALL VARIABILITY 75
with the 8-year average distribution (1980-1987). The significance of the departure towards positive values of the BIs during JJA for warm events (1982+ 1987) and conversely for cold events (1981 + 1985) was tested by a Monte Carlo technique, where the smoothed BI distribution for 200 random combinations of 184 days from a total sample of 736 days was obtained. Although the significance of both departures attained the 99 per cent level, the short period of available data and the neglect of persistence effects in the random sampling prevent firmer statistical conclusions.
The relationship between these BIs and the JJA rainfall at Santiago was studied by means of a seasonally integrated BI, defined as the JJA sum of the positive BI values divided by the sum of the negative ones. Figure 13 presents the yearly march of these values. It also includes the JJA average of the 500-hPa geopotential departures from the 1977-1987 average at Puerto Montt, Chile (41*5"S), as representative of the regional strength of the south-east edge of the subtropical Pacific anticyclone. The comparison of these parameters suggests that the winter rainfall in Santiago seems qualitatively related to a combination of the effect of blocking at the 90"W southern latitudes and the regional strength of the subtropical anticyclone, acting in the opposite direction. Again, longer times series would be needed to strengthen this relationship.
10. SUMMARY AND CONCLUSIONS
Major southern winter storms in central Chile during the developing phase of ENSO events seem to be mainly associated with blocking or slowly moving highs embedded in high latitude hemispheric circulation patterns where wavenumbers 3 and 4 prevail. The blocking area is located to the south-west of the continent, around the Bellingshausen Sea (9OOW).
These features seem to be consistent with the observed hemispheric teleconnection patterns described in Karoly's (1989) 200-hPa ENSO geopotential anomaly composites. The system behaves as if the blocking ridge amplifies and stays longer than normal in the Bellingshausen Sea area owing to a resonance effect with a wavetrain emerging from the central equatorial Pacific, similar to the patterns described by Horel and Wallace (1981) for the Northern Hemisphere.
In addition to the blocking anticyclone to the south-west of South America, the frequent cyclonic circulation to the south-east of the continent yields a dipole-like anomaly structure. This pattern is consistent with van Loon's (1986) SLP anomalies for the southern winter during the developing phase ('year 0') of a warm event.
Dry winter months during cold events correspond in general to a strong south-east Pacific subtropical anticyclone, with a middle latitude circulation dominated by anomalously strong zonal flow and short waves. Superimposed on these zonal patterns, a tendency for cyclonic anomalies in the Bellingshausen Sea area and for anticyclonic anomalies in the south-west Atlantic, yields a dipolar anomaly structure of opposite sign to the warm-event structure. The overall picture is also consistent with van Loon's SLP anomalies for the winter in the year immediately ahead of the warm event development ('year -1'). These pre-warm-event years correspond most of the time with cold events, as discussed in section 6.
Heavy rainstorms not associated with warm events seem to be connected with blocking in the Antarctic peninsula area, with a meridional or slightly north-east-south-west orientation of the trough-ridge system, as opposed to a preferred north-west-south-east orientation during warm-event storms.
Dry conditions within generally wet winters, as represented by July 1986 and June 1987, are associated with 500-hPa height anomaly patterns at high latitudes similar to those characterizing wet conditions (i.e. July 1987). However, alternating anomaly patterns at subtropical latitudes with a time-scale compatible with intraseasonal oscillations, seem to bring dry spells in central Chile within generally wet winters. This situation could also be related to an eastward displacement of the blocking ridge to the south-east of the continent, where most of the blocking highs occur (Trenberth and Mo, 1985).
The frequency distribution of daily 500-hPa blocking indices (BIs) at 90"W obtained from ECMWF hemispheric analyses for the period 1980-1987, indicate a significant tendency towards positive values during the JJA season of warm events, the opposite being true for cold events (Figure 12).
Qualitatively, the JJA rainfall at Santiago seems related to a combination of an integrated BI, defined as the seasonal sum of positive values of the BIs divided by the sum of the negative values; and to the regional

76 I. RUTLLANT AND H. FUENZALIDA
strength of the south-east edge of the subtropical anticyclone represented by the seasonal 500-hPa geopotential anomalies at Puerto Montt, Chile (41.5”S), as illustrated in Figure 13.
However, firmer statistical conclusions in the BI analyses cannot be drawn because of the small size of the sample and the neglect of persistence in the method for testing the significance of the departures.
ACKNOWLEDGEMENTS
The authors would like to thank L. Gallardo for her help in the microfilm synoptic data analysis, H. Salinas, R. Pizarro and Z. Salinas for the computer work and P. Aceituno for his helpful comments and suggestions. The anonymous referees also made a significant contribution to the completeness of this work.
Special thanks are also due to the Direccion Meteorolbgica de Chile (DMC), to the Climate Analysis Center of the National Weather Service (CAC/NWS NOAA, USA), to the European Centre for Medium Range Weather Forecasts (ECMWF, UK) and to the World Meteorological Centre in Melbourne, Australia, for providing the published data presented here.
This study has been partially supported by the Research Technical Office of the University of Chile, under Grant E 2830-8812 and by the National Fund for Science and Technology Development (FONDECYT, Chile), under Grant 89-1140. One of the authors (JR) would like to thank Professor Abdus Salam, the International Atomic Energy Agency and UNESCO for hospitality at the International Centre for Theoretical Physics, Trieste.
REFERENCES
Aceituno, P. 1987. On the interannual variability of South American climate and the Southern Oscillation. PhD Thesis. University of
Arkin, P. 1988. ‘The global climate for JuneAugust 1987: mature phase of an ENS0 warm episode persists’, J. Climate, 1, 3W324. Deser, C. and Wallace, J. M. 1987. ‘El Niiio events and their relation to the Southern Oscillation: 1925-1986, J. Geophys. Res., 92 (C13),
Horel, J. D. and Wallace, J. M. 1981. ‘Planetary scale atmospheric phenomena associated with the Southern Oscillation’, Mon. Wea. Rw.,
Wisconsin, Madison, 128 pp.
14, 189-14, 196.
109.813-829. Hoskins, B. J. and Karoly, D. J. 1981. ‘The steady linear response of a spherical atmosphere to thermal and orographic forcing’, J. Atmos.
Sci.. 38, 1179-1 196. Karoly, D. J. 1986. ‘Southern Hemisphere circulation features associated with El Niiio-Southern Oscillation events’, Preprints Second
Karoly, D. J. 1989. ‘Southern Hemisphere circulation features associated with El Niiio-Southern Oscillation events’, J. Climate, 2,
Kiladis, G. N. and van Loon, H. 1988. ‘The Southern Oscillation. Part VII: meteorological anomalies over the Indian and Pacific sectors
Lau, K. M. and Chan, P. H. 1986. ‘The 40-50 day oscillation and the El Niiio/Southern Oscillation: a new perspective’, Bull. Am.
Lau, N. C. 1985. ‘Modeling the seasonal dependence of the atmospheric response to observed El Niiios in 1962-1976: Mon. Wea. Rw.,
Mo, K. C. 1986. ‘Quasi-stationary states in the Southern Hemisphere’, Mon. Wea. Rev., 114, 808-823 Pittock, A. B. 1980. ‘Patterns of climatic variations in Argentina and Chile. Part I: precipitation 1931-1960’, Mon. Wea. Rev., 10%
Quinn, W. H. and Neal, V. T. 1983. ‘Long-term variations in the Southern Oscillation, El Niilo and the Chilean subtropical rainfall’, Fish.
Rasmusson, E. 1987. ‘The prediction of drought: a meteorological perspective’, Endeavour, 11,175-182 Ropelewski, C. F. and Halpert, M. S. 1987. ‘Global and regional scale precipitation patterns associated with the El Niiio/Southern
Rubin, M. J. 1955. ‘An analysis of pressure anomalies in the southern hemisphere’, Notos, 4, 11-16 Rutllant, J. 1987. ‘Synoptic aspects ofthe increase in rainfall in central Chile associated with warm events in the central equatorial Pacific’,
Conference on Geophysical Fluid Dynamics with special emphasis on El Niiio. Sao Jose dos Campos, Brazil, 13-1 7 July 1987. (Conference notes in press.)
Simmons, A. J., Wallace, J. M. and Branstator, G. W., 1983. ‘Barotropic wave propagation and instability, and atmospheric telwnnection patterns’, J. Atmos. Sci., 40, 1363-1392
Trenberth, K. E. and Mo, K. C. 1985. ‘Blocking in the southern hemisphere’, Mon. Wea. Rw., 113,3-21 Van Loon, H. 1986. The Southern Oscillation in the southern hemisphere south of 103, Preprints Second International Conference on
Van Loon, H. and Shea, D. J. 1985. ‘The Southern Oscillation. Part Tv: the precursors south of 15”s to the extremes of the oscillation’,
International Conference on Southern Hemisphere Meteorology, Wellington, New Zealand. pp. 41 1-413
1239-1252.
associated with the extremes of the oscillation’, Mon. Wea. Rev., 116, 120-128
Meteorol. Soc., 67, 533-534
113, 1970-1996
1347-1 361
bull., 81, 363-374
Oscillation’, Mon. Wea. Rev., 11% 16061626
Southern Hemisphere Meteorology, Wellington, New Zealand. pp. 4046
Mon. Wea. Rw., 113,2063-2074