susan k beverage global ob revmarch2012.pdf
TRANSCRIPT
Obesity Public Healthobr_949 258..274
Drinking to our health: can beverage companies cutcalories while maintaining profits?
S. Kleiman, S. W. Ng and B. Popkin
Department of Nutrition, University of North
Carolina at Chapel Hill, Chapel Hill, NC, USA
Received 12 July 2011; revised 14 September
2011; accepted 21 September 2011
Address for correspondence: Dr BM Popkin,
Carolina Population Center, University of North
Carolina, 123 W. Franklin Street, Chapel Hill,
NC 27516, USA. E-mail: [email protected]
SummaryCarbonated soft drinks and other beverages make up an increasing percentage ofenergy intake, and there are rising public health concerns about the links betweenconsumption of sugar-sweetened beverages and weight gain, obesity, and othercardiometabolic problems. In response, the food and beverage industry claims tobe reformulating products, reducing package or portion sizes and introducinghealthier options. Comparative analysis on various changes and their potentialeffects on public health are needed.
We conduct a case study using the two largest and most influential producersof sweetened beverages, The Coca-Cola Company and PepsiCo Inc., whotogether control 34% of the global soft drink market, examining their productportfolios globally and in three critical markets (the United States, Brazil andChina) from 2000 to 2010. On a global basis, total revenues and energy percapita sold increased, yet the average energy density (kJ 100 mL-1) sold declinedslightly, suggesting a shift to lower-calorie products. In the United States, bothtotal energy per capita and average energy density of beverages sold decreased,while the opposite was true in the developing markets of Brazil and China, withtotal per capita energy increasing greatly in China and, to a lesser extent, inBrazil.
Keywords: Calories, global beverage companies, portfolio, reformulation.
Acronyms and AbbreviationsSSB Sugar-sweetened beverage(s)CSD Carbonated soft drink(s)RTD Ready-to-drinkTCCC The Coca-Cola CompanyPepsiCo PepsiCo Inc.GMID Global Market Information Database (owned by Euromonitor)UPC Universal Product CodePLA Product Launch Analytics (owned by Datamonitor)
obesity reviews (2012) 13, 258–274
Introduction
Sugar-sweetened beverages (SSBs) and many other types ofcaloric beverages have been linked with increases in weight
and other cardiometabolic problems (1–4). Studies haveshown that beverages are less satisfying to the body’sappetitive sensations than solid foods, with calories fromSSB poorly compensated by reduction in other dietary
obesity reviews doi: 10.1111/j.1467-789X.2011.00949.x
258 © 2011 The Authorsobesity reviews © 2011 International Association for the Study of Obesity13, 258–274, March 2012
components. Adding a beverage to a meal increases thetotal energy intake from the meal, roughly in line with thecaloric content of the beverage, but at the expense of criti-cal nutrients (5–9). This has led to many scholars andorganizations placing reduced consumption of SSB asimportant for the promotion of healthy eating and preven-tion of excess weight gain, obesity, cancer, diabetes andheart disease (1,2,4,10–12). Studies across the globe haveshown marked increases in SSB consumption (3,13–15). Atthe same time, the beverage industry is claiming to reducemarketing of, and calories from, their products (16).
One of the critical issues ignored in the global literatureis the evolving mix and pattern of caloric beverages sold asthe food and beverage industry responds to various healthand consumer concerns. With SSB continuing to attractnegative publicity due to their connection with these con-cerns, consumers are increasingly replacing them with alter-natives (17). Although major beverage companies continueto rely on their flagship brands, such as Coke, Pepsi andtheir diet equivalents, to drive sales of carbonated softdrinks (CSDs), they have responded to public health con-cerns, sluggish sales growth and consumer preferences byexpanding their beverage portfolios and shifting produc-tion to new, healthier options, including lower-calorie CSDand non-carbonated beverages, such as bottled water, juicesand ready-to-drink (RTD) teas (18). This is no doubtfuelled in part by the fact that the volume share of CSDdeclined from 70 to less than 50% of the US non-alcoholicliquid refreshment market between 1988 and 2008, led bydeclines in full-calorie CSD (19). The US CSD business hasnot experienced year-on-year volume growth since 2004,and ‘diet’ brands are now estimated to make up more than30% of the US CSD market (20). Comparing dietary datafrom the US National Health and Nutrition ExaminationSurvey 1999–2002 and 2003–2006, the average intake offull-calorie CSD decreased among most age and gendergroups while, for many groups, average intake of diet CSD,as well as regular and low-calorie fruit drinks and fruit‘ades’, increased (19).
Major beverage industry companies, through affiliationssuch as the Healthy Weight Commitment Foundation, havevoluntarily pledged to reduce calories in the US market-place through a combination of product innovation,smaller portion sizes and marketing of low-calorie options(21). In addition, the International Food and Beverage Alli-ance has brought together global companies to support theWorld Health Organization’s strategy on diet, physicalactivity and health through research, product innovationand expanding access to nutritional information (16,22).Whether these ongoing voluntary efforts will have anyimpact is yet to be proven, and the track record for earliervoluntary attempts in the United States for tobacco control,seat belt provision, and changes to food and beverage mar-keting has been mixed (23–29). These are, by and large,
new voluntary initiatives, and it will take years before weknow whether there has been any impact, positive or nega-tive. In addition, the majority of these pledges are limited todeveloped countries to date; whether such efforts will beexpanded to the developing world remains to be seen.
Given these efforts, we set out to conduct a case studyusing the two largest global beverage companies, namelyThe Coca-Cola Company (TCCC) and PepsiCo Inc.(PepsiCo), who controlled a combined 69% of the globalCSD market, as well as a 34% market share for soft drinksoverall in 2010 (7). For the purposes of this paper, we relyon the definition of ‘soft drink’ put forth by Euromonitor,which includes the aggregation of (i) carbonates/CSD; (ii)fruit/vegetable juice; (iii) bottled water; (iv) functionaldrinks; (v) concentrates; (vi) RTD tea; (vii) RTD coffee; and(viii) Asian specialty drinks. Thus, although the term ‘softdrink’ may refer specifically to CSD in everyday use, the34% market share takes into account other beverage cat-egories, with CSD considered a subset of soft drinksoverall.
Specifically, we seek to answer: What have TCCC andPepsiCo, the largest and most influential beverage com-panies, accomplished? Has the energy sold per capitadecreased over the last 10 years? If so, was this trendlimited to the United States, or could it be seen in Brazil,China and the rest of the world? What sorts of substitu-tions or offsetting in the product portfolios within eachcompany and across countries might be occurring? In sum,have these companies shifted the energy content of theirglobal product portfolio, and what might this imply forpublic health?
Data and methods
Sales data
We collected sales data from 2000 to 2010 for all soft drinkbrands under parent companies TCCC and PepsiCo fromEuromonitor International’s Passport Global Market Infor-mation Database (GMID) (7). For volume sales, we usedthe number of 8-oz servings sold per year by each companyin each of our target geographic areas (the United States,Brazil, China, and globally), broken down by brand, witheach brand allocated to one or more Euromonitor softdrink categories (see Appendix I for beverage category defi-nitions). For the United States, Brazil and China, the totalnumber of 8-oz servings, including both on-trade and off-trade sales, was available, while for the global total, onlyoff-trade data were available. On-trade sales refer to thosefrom food service (e.g. in restaurants and hotels), whileoff-trade sales refer to those in retail locations, includingsupermarkets and convenience stores. For value sales, weused the off-trade value of retail sales per year by eachcompany in each geographic area, segregated by soft drink
obesity reviews Global beverage sales dynamics S. Kleiman et al. 259
© 2011 The Authorsobesity reviews © 2011 International Association for the Study of Obesity 13, 258–274, March 2012

category, and adjusted for inflation using the Organizationfor Economic Co-operation and Development’s ConsumerPrice Index indicator (7,30). On-trade value sales wereunavailable.
Data on caloric content
2010 Gladson Nutrition Database (US)This commercial database contains Universal Product Code(UPC) level data of branded and private label items frommanufacturers, distributors and retailers in the UnitedStates, including the nutrition facts panel, ingredient list,warnings, claims and manufacturer. Field data collectorsalso identify new or changed products. The database con-tains more than 170,000 UPCs and is updated withapproximately 2,000 new or changed UPCs per week(31,32).
2005–2009 Nielsen US HomescanThis commercial database contains household-level dataon consumer shopping and purchase behaviour (includingfood and beverages) at the UPC level from a nationallyrepresentative household sample that scans UPCs or saveslabels and receipts. The static US panel contains approxi-mately 60,000 households obtained through both targeted(based on demographic needs) and online recruitment(32,33).
Datamonitor Product Launch Analytics (Global)This database includes new products (at the UPC level)entering the global marketplace, including foods and bev-erages, and is updated continuously. A list of ingredientsand nutrition facts panel are included when available,although nutrition information has only been collected sys-tematically since 2009 (32,34).
Our first step in gathering caloric data was to compareTCCC and PepsiCo brands in the Euromonitor sales datato the list of products included in the Gladson NutritionDatabase. Some brand names found in the Euromonitorsales data, such as Coca-Cola with Lime, clearly denote onespecific product, but others, such as Odwalla, represent arange of products with different nutritional content. There-fore, we calculated a weighted average number of caloriesper 8-oz serving for each matched brand, with the weight-ing of multiple products under a given brand done accord-ing to the relative sales of each product from 2005 to 2009in Nielsen Homescan.
Although it is unlikely that the same beverage productwith the same name will have the same formulation acrossevery country in which it is sold, we assumed that they aresimilar enough to allow applying the aforementionedweighted average calories per 8-oz serving of a particularbrand sold in the United States to the same brand sold inother countries. For those brands not sold in the United
States and, therefore, missing from the Gladson NutritionDatabase, we attempted to match the brand name withproducts included in Datamonitor Product Launch Analyt-ics (PLA). Based on the available data for caloric contentand serving size, the number of calories per 8-oz servingequivalent was calculated for every product matched inDatamonitor PLA under a given brand and beverage cat-egory. The caloric content of the products was then aver-aged at the brand level, with the average value applied toany product under that brand that lacked calorie data.Then, the caloric content was averaged separately at thebeverage category level for TCCC and PepsiCo, with theaverage value applied to any product/brand for which wehad sales data but still lacked calorie data. Combining thesedata with the US averages resulted in a consolidated listof average calories per 8-oz serving for a specific brand,beverage category and parent company (either TCCC orPepsiCo).
Population data
The total world population, as well as that of the specificcountries under consideration (the United States, Brazil andChina), was available via the World Bank for the years2000–2009 and from the US Census Bureau (US and worldtotals), the Instituto Brasileiro de Geografia e Estatísticaand the National Bureau of Statistics of China for 2010(8,35–38).
Revenue and profit data
Net revenue for TCCC and PepsiCo for the years 2000–2010 was available in their respective annual reports, whilenet profit data were available in Euromonitor’s PassportGMID (7). Net revenue and profit for PepsiCo are reportedfor all divisions, including food and beverages. Revenueand profit data were only available on a global basis; thus,country-by-country breakdowns for the United States,Brazil and China were not obtainable. However, off-tradesales data were available for each country, although theseare not a true proxy for profits or total sales.
Created measures
Combining the sales data on the number of 8-oz servingssold per year by brand, beverage category, parent companyand geographic area, with the caloric data on the averagecalories per 8-oz serving of a given brand, and the popu-lation for each country in a given year, we were able tocalculate (i) the total volume sold per capita per year (inounces) for each company (TCCC or PepsiCo) and bever-age category; (ii) the total calories sold per capita per yearfor each company and beverage category; and (iii) thecalories per ounce sold per year for each company and
260 Global beverage sales dynamics S. Kleiman et al. obesity reviews
© 2011 The Authorsobesity reviews © 2011 International Association for the Study of Obesity13, 258–274, March 2012

beverage category. We then converted these values to mil-lilitres, kilojoules or kJ 100 mL-1 sold, where appropriate.
Descriptive trend analysis
Because the data set we constructed contains all aggregatemeasures with no variance, we were unable to conduct anystatistical tests on the changes in per capita volume orenergy sold by TCCC or PepsiCo during the period 2000–2010. Rather, we generated simple measurements of per-centage differences between (i) 2000 and 2005; and (ii)2005 and 2010 in order to examine these changes overtime.
Results
Energy and volume sold per capita from 2000to 2010
WorldwideOverall, TCCC and PepsiCo have both increased the energyand volume sold per capita over the last 10 years on a globalscale. The overarching upward trajectory, however, masks astatic trend in CSD and more volatile increases in othermajor beverage categories. Between 2000 and 2010, the percapita energy sold from CSD increased 5% for TCCC, from34.9 to 36.6 kJ person-1 d-1 (or 12,752–13,375 kJ person-1
year-1), while they decreased 1% for PepsiCo, from 18.2to 18.0 kJ person-1 d-1 (or 6,651–6,581 kJ person-1 year-1).Meanwhile, both bottled water (including flavoured andfunctional water) and sports and energy drinks showeddramatic increases over the same time period, with bottledwater sales increasing from 0.1 to 0.6 kJ person-1 d-1 (or22–229 kJ person-1 year-1) and sports and energy drinksales from 0.4 to 1.0 kJ person-1 d-1 (or 132–358 kJperson-1 year-1) for TCCC. PepsiCo’s brands mirrored thesechanges, with bottled water sales increasing from 0.0 to1.8 kJ person-1 d-1 (or 11–277 kJ person-1 year-1) andsports and energy drink sales from 0.0 to 1.4 kJ person-1 d-1
(or 18–513 kJ person-1 year-1) (see Table 1 panel A2 andFig. 1). Globally, across all beverage categories, the energysold per capita rose globally for both TCCC and PepsiCoduring this period, and beverage products from these twocompanies alone amounted to 65 kJ person-1 d-1 in 2010.
Per capita volume sales showed similar worldwide trendsover the last decade, with modest increases in sales of CSDalongside marked increases in bottled water, fruit/vegetablejuice, and sports and energy drinks. For TCCC brands,volume per capita sold in 2000 and 2010 increased from0.9 to 5.7 mL d-1 (or 311–2,070 mL year-1) for bottledwater, 26.6–28.9 mL d-1 (or 9,722–10,559 mL year-1) forCSD, 1.3-2.2 mL d-1 (or 456–798 mL year-1) for fruit/vegetable juice, and 0.4–1.1 mL d-1 (or 152–393 mLyear-1) for sports and energy drinks. Although per capita
CSD volume sales did not change much, PepsiCo brands inother beverage categories experienced similar growth involume per capita sold over the period 2000–2010, increas-ing from 0.3 to 2.7 mL d-1 (or 104–971 mL year-1) forbottled water, 0.9–1.3 mL d-1 (or 316–468 mL year-1) forfruit/vegetable juice, and 0.1–1.8 mL d-1 (or 25–672 mLyear-1) for sports and energy drinks. While CSD was thedominant beverage category in 2000 for both companies,representing 89% of per capita volume sold for TCCC and91% for PepsiCo, expansion and more rapid growth inother soft drink categories reduced the share of CSD by2010 to 74 and 68% for TCCC and PepsiCo, respectively.Table 1 panel A2 shows the global daily per capita volumesold across these soft drink categories for TCCC andPepsiCo from 2000 to 2010.
United States, Brazil and ChinaThe results for the United States, Brazil and China showdifferent trends in the beverage portfolios. Despite theglobal increase in energy and volume sold per capita from2000 to 2010, there is a clear decrease in energy andvolume sold per capita by TCCC and PepsiCo in the UnitedStates over the same time period (see Fig. 2). Trends inbottled water and sports and energy drinks mirrored theglobal trends, with large increases in per capita sales, butthis was offset by sizeable decreases in the CSD category.TCCC sold 177 kJ person-1 d-1 of CSD in the United Statesin 2010, down 24% from 232 kJ person-1 d-1 in 2000,while PepsiCo sold 154 kJ person-1 d-1 of CSD in 2010,down 28% from 214 kJ person-1 d-1 in 2000. Despite thesedeclines, across all beverage categories, the daily energysold per capita from these two companies alone stillamounted to 427 kJ person-1 d-1 in 2010 (see Table 1 panelB1). Per capita CSD volume sold over the same periodalso declined from 212 to 178 mL person-1 d-1 for TCCCand 160–126 mL person-1 d-1 for PepsiCo (see Table 1panel B2).
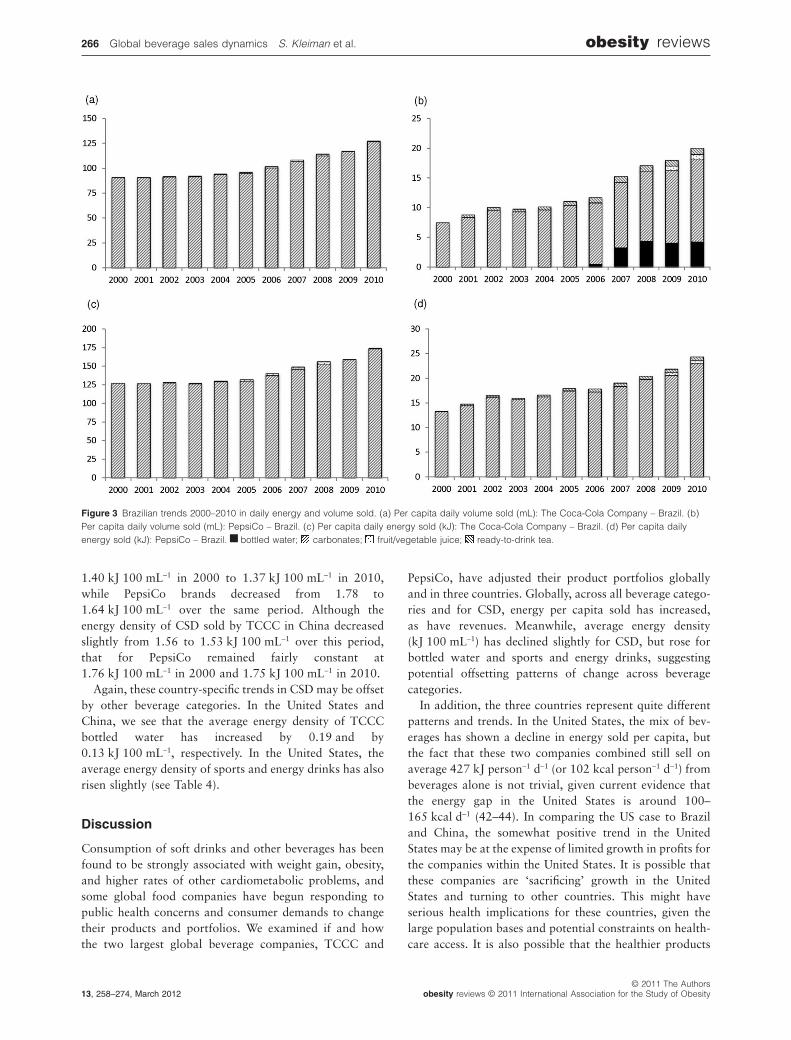
Meanwhile, in Brazil, daily energy per capita sold byTCCC increased 41% between 2000 and 2010, while dailyenergy per capita sold by PepsiCo rose 168%, largely dueto increases in energy from CSD. Energy from CSD sold byTCCC rose 36% from 127 kJ person-1 d-1 in 2000 to173 kJ person-1 d-1 in 2010. Energy from CSD sold byPepsiCo also rose in Brazil, to 23 kJ person-1 d-1 in 2010,up from 13 kJ person-1 d-1 in 2000 (see Table 1 panel C1and Fig. 3).
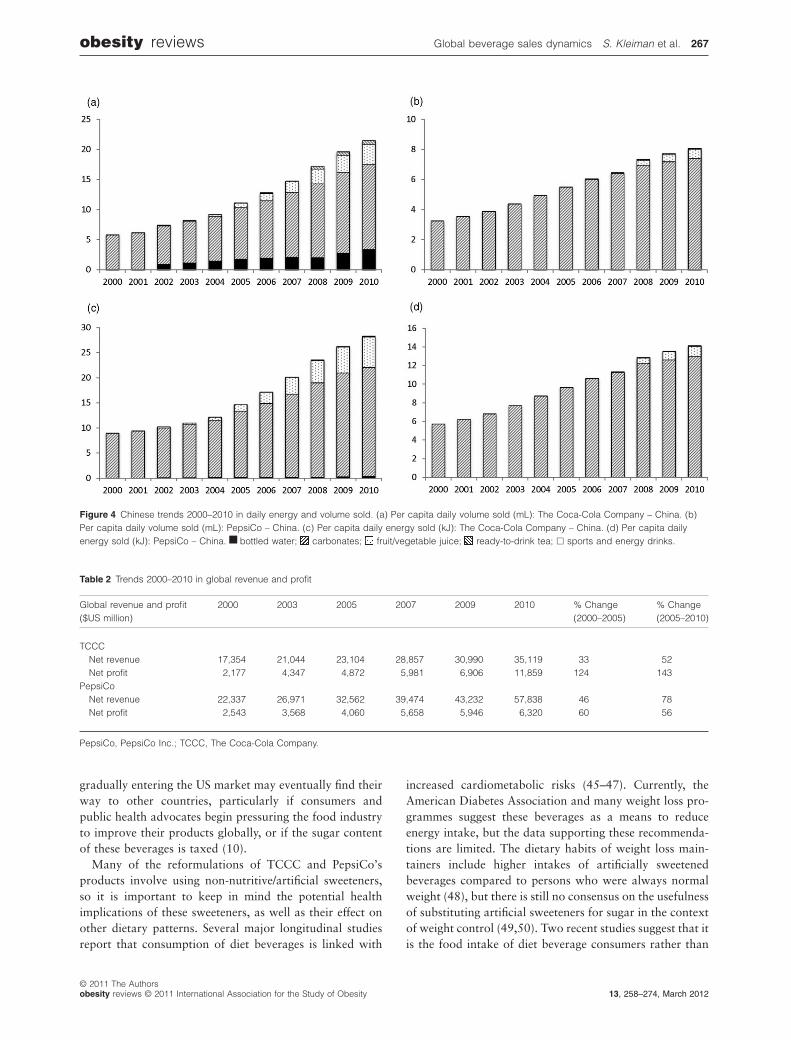
Likewise, in China, daily energy per capita sold byTCCC increased 215% between 2000 and 2010, whiledaily energy per capita sold by PepsiCo rose 147%, alsodriven by CSD. Energy from CSD sold by both TCCC andPepsiCo experienced an even stronger upward growthtrend in China between 2000 and 2010 (see Table 1 panelD1 and Fig. 4), increasing 141 and 127%, respectively, to22 kJ person-1 d-1 for TCCC brands and 13 kJ person-1 d-1
obesity reviews Global beverage sales dynamics S. Kleiman et al. 261
© 2011 The Authorsobesity reviews © 2011 International Association for the Study of Obesity 13, 258–274, March 2012
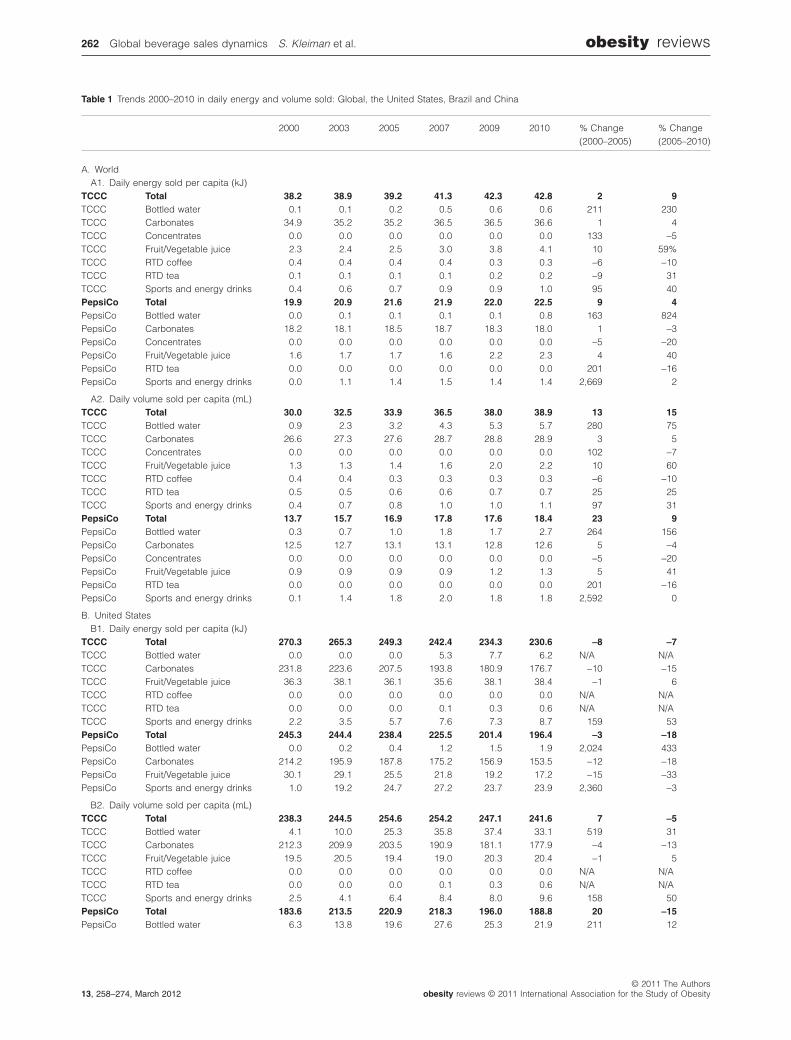
Table 1 Trends 2000–2010 in daily energy and volume sold: Global, the United States, Brazil and China
2000 2003 2005 2007 2009 2010 % Change(2000–2005)
% Change(2005–2010)
A. WorldA1. Daily energy sold per capita (kJ)
TCCC Total 38.2 38.9 39.2 41.3 42.3 42.8 2 9TCCC Bottled water 0.1 0.1 0.2 0.5 0.6 0.6 211 230TCCC Carbonates 34.9 35.2 35.2 36.5 36.5 36.6 1 4TCCC Concentrates 0.0 0.0 0.0 0.0 0.0 0.0 133 -5TCCC Fruit/Vegetable juice 2.3 2.4 2.5 3.0 3.8 4.1 10 59%TCCC RTD coffee 0.4 0.4 0.4 0.4 0.3 0.3 -6 -10TCCC RTD tea 0.1 0.1 0.1 0.1 0.2 0.2 -9 31TCCC Sports and energy drinks 0.4 0.6 0.7 0.9 0.9 1.0 95 40PepsiCo Total 19.9 20.9 21.6 21.9 22.0 22.5 9 4PepsiCo Bottled water 0.0 0.1 0.1 0.1 0.1 0.8 163 824PepsiCo Carbonates 18.2 18.1 18.5 18.7 18.3 18.0 1 -3PepsiCo Concentrates 0.0 0.0 0.0 0.0 0.0 0.0 -5 -20PepsiCo Fruit/Vegetable juice 1.6 1.7 1.7 1.6 2.2 2.3 4 40PepsiCo RTD tea 0.0 0.0 0.0 0.0 0.0 0.0 201 -16PepsiCo Sports and energy drinks 0.0 1.1 1.4 1.5 1.4 1.4 2,669 2
A2. Daily volume sold per capita (mL)TCCC Total 30.0 32.5 33.9 36.5 38.0 38.9 13 15TCCC Bottled water 0.9 2.3 3.2 4.3 5.3 5.7 280 75TCCC Carbonates 26.6 27.3 27.6 28.7 28.8 28.9 3 5TCCC Concentrates 0.0 0.0 0.0 0.0 0.0 0.0 102 -7TCCC Fruit/Vegetable juice 1.3 1.3 1.4 1.6 2.0 2.2 10 60TCCC RTD coffee 0.4 0.4 0.3 0.3 0.3 0.3 -6 -10TCCC RTD tea 0.5 0.5 0.6 0.6 0.7 0.7 25 25TCCC Sports and energy drinks 0.4 0.7 0.8 1.0 1.0 1.1 97 31PepsiCo Total 13.7 15.7 16.9 17.8 17.6 18.4 23 9PepsiCo Bottled water 0.3 0.7 1.0 1.8 1.7 2.7 264 156PepsiCo Carbonates 12.5 12.7 13.1 13.1 12.8 12.6 5 -4PepsiCo Concentrates 0.0 0.0 0.0 0.0 0.0 0.0 -5 -20PepsiCo Fruit/Vegetable juice 0.9 0.9 0.9 0.9 1.2 1.3 5 41PepsiCo RTD tea 0.0 0.0 0.0 0.0 0.0 0.0 201 -16PepsiCo Sports and energy drinks 0.1 1.4 1.8 2.0 1.8 1.8 2,592 0
B. United StatesB1. Daily energy sold per capita (kJ)
TCCC Total 270.3 265.3 249.3 242.4 234.3 230.6 -8 -7TCCC Bottled water 0.0 0.0 0.0 5.3 7.7 6.2 N/A N/ATCCC Carbonates 231.8 223.6 207.5 193.8 180.9 176.7 -10 -15TCCC Fruit/Vegetable juice 36.3 38.1 36.1 35.6 38.1 38.4 -1 6TCCC RTD coffee 0.0 0.0 0.0 0.0 0.0 0.0 N/A N/ATCCC RTD tea 0.0 0.0 0.0 0.1 0.3 0.6 N/A N/ATCCC Sports and energy drinks 2.2 3.5 5.7 7.6 7.3 8.7 159 53PepsiCo Total 245.3 244.4 238.4 225.5 201.4 196.4 -3 -18PepsiCo Bottled water 0.0 0.2 0.4 1.2 1.5 1.9 2,024 433PepsiCo Carbonates 214.2 195.9 187.8 175.2 156.9 153.5 -12 -18PepsiCo Fruit/Vegetable juice 30.1 29.1 25.5 21.8 19.2 17.2 -15 -33PepsiCo Sports and energy drinks 1.0 19.2 24.7 27.2 23.7 23.9 2,360 -3
B2. Daily volume sold per capita (mL)TCCC Total 238.3 244.5 254.6 254.2 247.1 241.6 7 -5TCCC Bottled water 4.1 10.0 25.3 35.8 37.4 33.1 519 31TCCC Carbonates 212.3 209.9 203.5 190.9 181.1 177.9 -4 -13TCCC Fruit/Vegetable juice 19.5 20.5 19.4 19.0 20.3 20.4 -1 5TCCC RTD coffee 0.0 0.0 0.0 0.0 0.0 0.0 N/A N/ATCCC RTD tea 0.0 0.0 0.0 0.1 0.3 0.6 N/A N/ATCCC Sports and energy drinks 2.5 4.1 6.4 8.4 8.0 9.6 158 50PepsiCo Total 183.6 213.5 220.9 218.3 196.0 188.8 20 -15PepsiCo Bottled water 6.3 13.8 19.6 27.6 25.3 21.9 211 12
262 Global beverage sales dynamics S. Kleiman et al. obesity reviews
© 2011 The Authorsobesity reviews © 2011 International Association for the Study of Obesity13, 258–274, March 2012
for PepsiCo brands in 2010. In addition, energy fromTCCC’s bottled waters, fruit/vegetable juices and RTD teashas also contributed to increases in daily energy sold percapita.
In both Brazil and China, daily per capita volume sales ofsoft drinks increased 269 and 147% for TCCC andPepsiCo, respectively, between 2000 and 2010. In Brazil,volume sold per capita for CSD rose 40 and 86% for
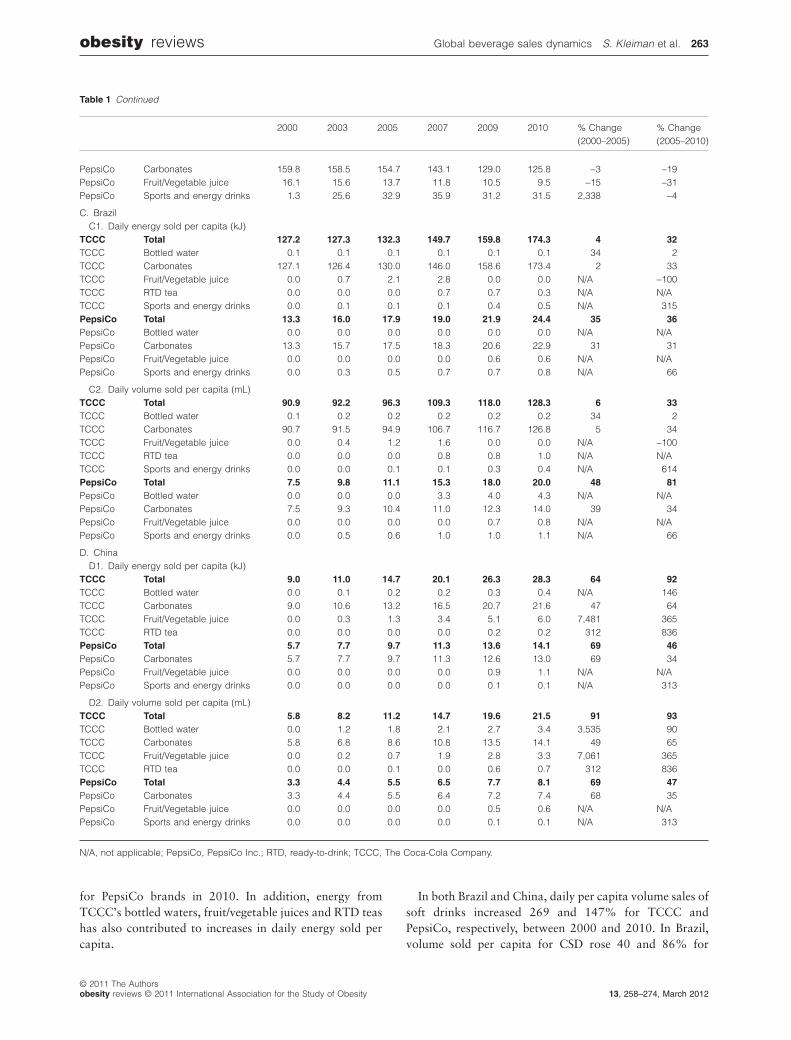
Table 1 Continued
2000 2003 2005 2007 2009 2010 % Change(2000–2005)
% Change(2005–2010)
PepsiCo Carbonates 159.8 158.5 154.7 143.1 129.0 125.8 -3 -19PepsiCo Fruit/Vegetable juice 16.1 15.6 13.7 11.8 10.5 9.5 -15 -31PepsiCo Sports and energy drinks 1.3 25.6 32.9 35.9 31.2 31.5 2,338 -4
C. BrazilC1. Daily energy sold per capita (kJ)
TCCC Total 127.2 127.3 132.3 149.7 159.8 174.3 4 32TCCC Bottled water 0.1 0.1 0.1 0.1 0.1 0.1 34 2TCCC Carbonates 127.1 126.4 130.0 146.0 158.6 173.4 2 33TCCC Fruit/Vegetable juice 0.0 0.7 2.1 2.8 0.0 0.0 N/A -100TCCC RTD tea 0.0 0.0 0.0 0.7 0.7 0.3 N/A N/ATCCC Sports and energy drinks 0.0 0.1 0.1 0.1 0.4 0.5 N/A 315PepsiCo Total 13.3 16.0 17.9 19.0 21.9 24.4 35 36PepsiCo Bottled water 0.0 0.0 0.0 0.0 0.0 0.0 N/A N/APepsiCo Carbonates 13.3 15.7 17.5 18.3 20.6 22.9 31 31PepsiCo Fruit/Vegetable juice 0.0 0.0 0.0 0.0 0.6 0.6 N/A N/APepsiCo Sports and energy drinks 0.0 0.3 0.5 0.7 0.7 0.8 N/A 66
C2. Daily volume sold per capita (mL)TCCC Total 90.9 92.2 96.3 109.3 118.0 128.3 6 33TCCC Bottled water 0.1 0.2 0.2 0.2 0.2 0.2 34 2TCCC Carbonates 90.7 91.5 94.9 106.7 116.7 126.8 5 34TCCC Fruit/Vegetable juice 0.0 0.4 1.2 1.6 0.0 0.0 N/A -100TCCC RTD tea 0.0 0.0 0.0 0.8 0.8 1.0 N/A N/ATCCC Sports and energy drinks 0.0 0.0 0.1 0.1 0.3 0.4 N/A 614PepsiCo Total 7.5 9.8 11.1 15.3 18.0 20.0 48 81PepsiCo Bottled water 0.0 0.0 0.0 3.3 4.0 4.3 N/A N/APepsiCo Carbonates 7.5 9.3 10.4 11.0 12.3 14.0 39 34PepsiCo Fruit/Vegetable juice 0.0 0.0 0.0 0.0 0.7 0.8 N/A N/APepsiCo Sports and energy drinks 0.0 0.5 0.6 1.0 1.0 1.1 N/A 66
D. ChinaD1. Daily energy sold per capita (kJ)
TCCC Total 9.0 11.0 14.7 20.1 26.3 28.3 64 92TCCC Bottled water 0.0 0.1 0.2 0.2 0.3 0.4 N/A 146TCCC Carbonates 9.0 10.6 13.2 16.5 20.7 21.6 47 64TCCC Fruit/Vegetable juice 0.0 0.3 1.3 3.4 5.1 6.0 7,481 365TCCC RTD tea 0.0 0.0 0.0 0.0 0.2 0.2 312 836PepsiCo Total 5.7 7.7 9.7 11.3 13.6 14.1 69 46PepsiCo Carbonates 5.7 7.7 9.7 11.3 12.6 13.0 69 34PepsiCo Fruit/Vegetable juice 0.0 0.0 0.0 0.0 0.9 1.1 N/A N/APepsiCo Sports and energy drinks 0.0 0.0 0.0 0.0 0.1 0.1 N/A 313
D2. Daily volume sold per capita (mL)TCCC Total 5.8 8.2 11.2 14.7 19.6 21.5 91 93TCCC Bottled water 0.0 1.2 1.8 2.1 2.7 3.4 3,535 90TCCC Carbonates 5.8 6.8 8.6 10.8 13.5 14.1 49 65TCCC Fruit/Vegetable juice 0.0 0.2 0.7 1.9 2.8 3.3 7,061 365TCCC RTD tea 0.0 0.0 0.1 0.0 0.6 0.7 312 836PepsiCo Total 3.3 4.4 5.5 6.5 7.7 8.1 69 47PepsiCo Carbonates 3.3 4.4 5.5 6.4 7.2 7.4 68 35PepsiCo Fruit/Vegetable juice 0.0 0.0 0.0 0.0 0.5 0.6 N/A N/APepsiCo Sports and energy drinks 0.0 0.0 0.0 0.0 0.1 0.1 N/A 313
N/A, not applicable; PepsiCo, PepsiCo Inc.; RTD, ready-to-drink; TCCC, The Coca-Cola Company.
obesity reviews Global beverage sales dynamics S. Kleiman et al. 263
© 2011 The Authorsobesity reviews © 2011 International Association for the Study of Obesity 13, 258–274, March 2012

TCCC and PepsiCo, respectively, while, in China, thegains were 145 and 127%. By 2010, TCCC sold127 mL person-1 d-1 in Brazil and 14.1 mL person-1 d-1 ofits CSD brands, while PepsiCo sold 14 mL person-1 d-1 inBrazil and 7.4 mL person-1 d-1 in China.
Companies’ wealth: total revenue from 2000to 2010
WorldwideIn tandem with continued sales volume growth, TCCC andPepsiCo have achieved increases in both net revenue andnet profit during the last decade (see Table 2). Aside from aslight downturn that mirrored the overall economic slow-down in 2008–2009, TCCC’s net revenue increased morethan 100% from 2000 to 2010, reaching $35,119 million,while PepsiCo’s net revenue rose 159% during the sameperiod, up to $57,838 million in 2010 (39,40). TCCC’sglobal profit showed even more remarkable gains, risingfrom $2,177 million in 2000 to $11,859 million in 2010,an increase of more than 400%. Likewise, PepsiCo’s netprofit rose by nearly 150% over the same period, up to$6,320 million by 2010 (7).
United States, Brazil and ChinaAlthough TCCC and PepsiCo grew in both revenue andprofit since 2000, the lack of available financial data atthe country level does not allow us to examine with cer-tainty, whether these trends are evident in the UnitedStates, Brazil and China. Thus, we employed off-tradevalue sales in each country as proxies for revenue/profitand examined changes at the country level (see Table 3).After growing by 4% in the first half of the decade,TCCC’s CSD sales in the United States fell 13% between2005 ($15,318 million) and 2010 ($13,348 million), for atotal decline of 9% over the period 2000–2010. PepsiCo’sCSD sales showed similar trends, increasing by 4% from2000 to 2005 and then falling 17% from $11,755 millionin 2005 to $9,792 million in 2010, for a total decline of13% (7).
Off-trade CSD value sales show rapid expansion in bothBrazil and China. In Brazil, although TCCC’s CSD sales fell17% between 2000 and 2005, they more than doubled by2010, reaching $5,686 million, for total growth of 72%over the decade. PepsiCo’s CSD sales grew steadily from2000 ($293 million) to 2010 ($675 million), increasing by131%. Likewise, sales of CSD in China increased 149% for
Figure 1 Global trends 2000–2010 in daily energy and volume sold. (a) Per capita daily volume sold (mL): The Coca-Cola Company – World. (b) Percapita daily volume sold (mL): PepsiCo – World. (c) Per capita daily energy sold (kJ): The Coca-Cola Company – World. (d) Per capita daily energysold (kJ): PepsiCo – World. bottled water; carbonates; fruit/vegetable juice; ready-to-drink tea.
264 Global beverage sales dynamics S. Kleiman et al. obesity reviews
© 2011 The Authorsobesity reviews © 2011 International Association for the Study of Obesity13, 258–274, March 2012

TCCC and 129% for PepsiCo from 2000 to 2010, reaching$3,539 million and $1,653 million, respectively (7).
Consumers’ health: average energy density ofbeverages sold from 2000 to 2010
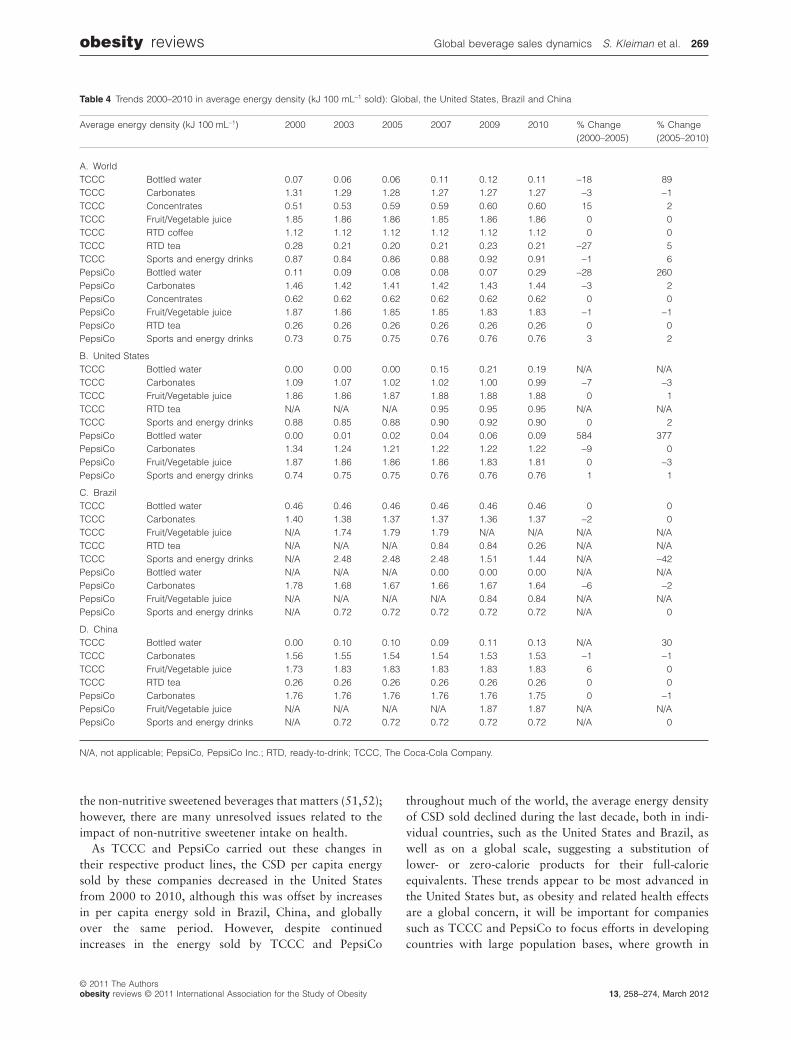
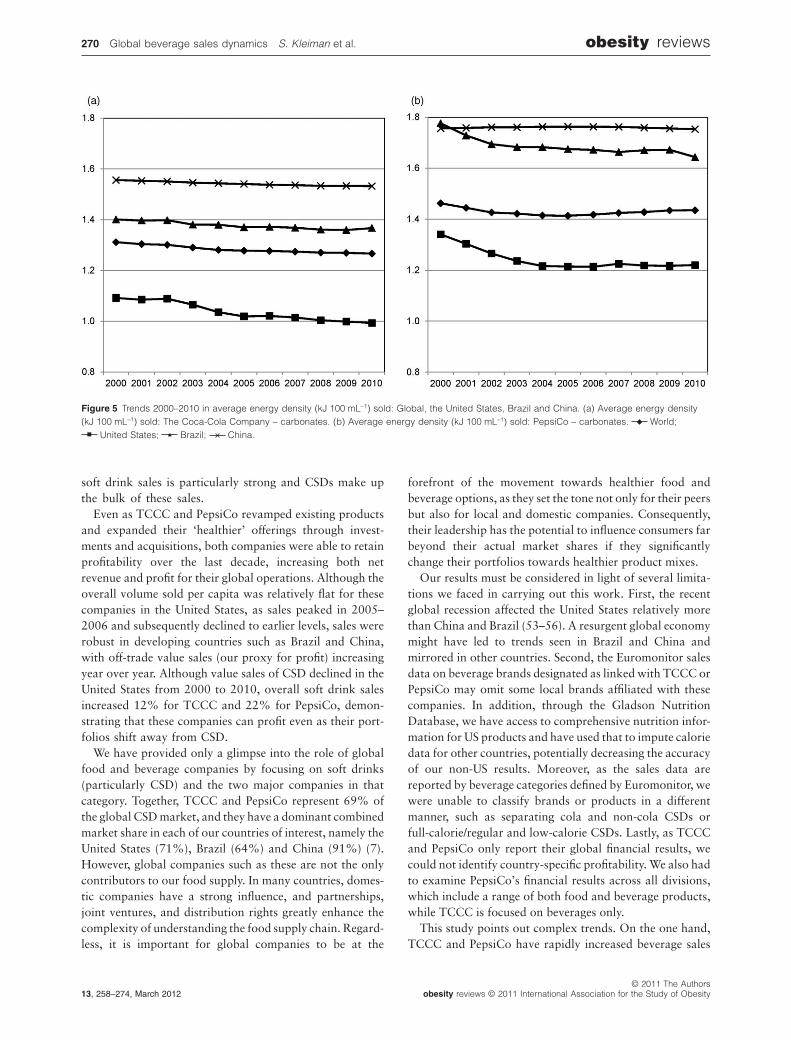
WorldwideWhile TCCC and PepsiCo’s energy per capita soldincreased globally over the last decade, with particularlystrong growth in developing countries such as Braziland China, the changes in the average energy density ofproducts sold are a better indicator of whether healthierbeverage products are, indeed, making an impact in themarketplace. We do so by examining changes in kJ 100mL-1 sold during this period (see Table 4 and Fig. 5).Worldwide, from 2000 to 2010, the average energy densityof CSD sold by TCCC fell from 1.31 to 1.27 kJ 100 mL-1,while that of PepsiCo’s CSD brands fell from 1.46 to1.44 kJ 100 mL-1, providing slight evidence of a shift tolower-energy CSD products, even as overall energy percapita sold continued to grow.
However, these trends in CSD are being offset by otherbeverage categories. Worldwide, the average energy density
of both bottled water and sports and energy drinks sold hasincreased over the last 10 years by 0.04 and0.18 kJ 100 mL-1 for TCCC and PepsiCo’s bottled waterbrands, as well as by 0.04 and 0.03 kJ 100 mL-1 for TCCCand PepsiCo’s sports and energy drink brands (see Table 4panel A).
United States, Brazil and ChinaIn tandem with the downtrend in the US CSD market,between 2000 and 2010, the average energy density ofTCCC’s CSD brands sold in the United States decreasedfrom 1.09 to 0.99 kJ 100 mL-1, while PepsiCo’s went from1.34 to 1.22 kJ 100 mL-1. Thus, while volume sales andrevenue growth in recent years have been elusive in the USCSD market, there is evidence of a shift from full-calorie tolower-calorie CSD. There is less evidence of a shift tolower-energy CSD in developing markets such as Brazil andChina, where growth in all major soft drink categories hasremained strong during the last decade. Although marketresearch shows that full-calorie CSDs continue to showstrong growth in Brazil (41), there was still a slight decreasein the energy density of CSDs sold from 2000 to 2010. ForTCCC brands, the energy density of CSD went from
Figure 2 US trends 2000–2010 in daily energy and volume sold. (a) Per capita daily volume sold (mL): The Coca-Cola Company – United States. (b)Per capita daily volume sold (mL): PepsiCo – United States. (c) Per capita daily energy sold (kJ): The Coca-Cola Company – United States. (d) Percapita daily energy sold (kJ): PepsiCo – United States. bottled water; carbonates; fruit/vegetable juice; ready-to-drink tea.
obesity reviews Global beverage sales dynamics S. Kleiman et al. 265
© 2011 The Authorsobesity reviews © 2011 International Association for the Study of Obesity 13, 258–274, March 2012
1.40 kJ 100 mL-1 in 2000 to 1.37 kJ 100 mL-1 in 2010,while PepsiCo brands decreased from 1.78 to1.64 kJ 100 mL-1 over the same period. Although theenergy density of CSD sold by TCCC in China decreasedslightly from 1.56 to 1.53 kJ 100 mL-1 over this period,that for PepsiCo remained fairly constant at1.76 kJ 100 mL-1 in 2000 and 1.75 kJ 100 mL-1 in 2010.
Again, these country-specific trends in CSD may be offsetby other beverage categories. In the United States andChina, we see that the average energy density of TCCCbottled water has increased by 0.19 and by0.13 kJ 100 mL-1, respectively. In the United States, theaverage energy density of sports and energy drinks has alsorisen slightly (see Table 4).
Discussion
Consumption of soft drinks and other beverages has beenfound to be strongly associated with weight gain, obesity,and higher rates of other cardiometabolic problems, andsome global food companies have begun responding topublic health concerns and consumer demands to changetheir products and portfolios. We examined if and howthe two largest global beverage companies, TCCC and
PepsiCo, have adjusted their product portfolios globallyand in three countries. Globally, across all beverage catego-ries and for CSD, energy per capita sold has increased,as have revenues. Meanwhile, average energy density(kJ 100 mL-1) has declined slightly for CSD, but rose forbottled water and sports and energy drinks, suggestingpotential offsetting patterns of change across beveragecategories.
In addition, the three countries represent quite differentpatterns and trends. In the United States, the mix of bev-erages has shown a decline in energy sold per capita, butthe fact that these two companies combined still sell onaverage 427 kJ person-1 d-1 (or 102 kcal person-1 d-1) frombeverages alone is not trivial, given current evidence thatthe energy gap in the United States is around 100–165 kcal d-1 (42–44). In comparing the US case to Braziland China, the somewhat positive trend in the UnitedStates may be at the expense of limited growth in profits forthe companies within the United States. It is possible thatthese companies are ‘sacrificing’ growth in the UnitedStates and turning to other countries. This might haveserious health implications for these countries, given thelarge population bases and potential constraints on health-care access. It is also possible that the healthier products
Figure 3 Brazilian trends 2000–2010 in daily energy and volume sold. (a) Per capita daily volume sold (mL): The Coca-Cola Company – Brazil. (b)Per capita daily volume sold (mL): PepsiCo – Brazil. (c) Per capita daily energy sold (kJ): The Coca-Cola Company – Brazil. (d) Per capita dailyenergy sold (kJ): PepsiCo – Brazil. bottled water; carbonates; fruit/vegetable juice; ready-to-drink tea.
266 Global beverage sales dynamics S. Kleiman et al. obesity reviews
© 2011 The Authorsobesity reviews © 2011 International Association for the Study of Obesity13, 258–274, March 2012
gradually entering the US market may eventually find theirway to other countries, particularly if consumers andpublic health advocates begin pressuring the food industryto improve their products globally, or if the sugar contentof these beverages is taxed (10).
Many of the reformulations of TCCC and PepsiCo’sproducts involve using non-nutritive/artificial sweeteners,so it is important to keep in mind the potential healthimplications of these sweeteners, as well as their effect onother dietary patterns. Several major longitudinal studiesreport that consumption of diet beverages is linked with
increased cardiometabolic risks (45–47). Currently, theAmerican Diabetes Association and many weight loss pro-grammes suggest these beverages as a means to reduceenergy intake, but the data supporting these recommenda-tions are limited. The dietary habits of weight loss main-tainers include higher intakes of artificially sweetenedbeverages compared to persons who were always normalweight (48), but there is still no consensus on the usefulnessof substituting artificial sweeteners for sugar in the contextof weight control (49,50). Two recent studies suggest that itis the food intake of diet beverage consumers rather than
Figure 4 Chinese trends 2000–2010 in daily energy and volume sold. (a) Per capita daily volume sold (mL): The Coca-Cola Company – China. (b)Per capita daily volume sold (mL): PepsiCo – China. (c) Per capita daily energy sold (kJ): The Coca-Cola Company – China. (d) Per capita dailyenergy sold (kJ): PepsiCo – China. bottled water; carbonates; fruit/vegetable juice; ready-to-drink tea; � sports and energy drinks.
Table 2 Trends 2000–2010 in global revenue and profit
Global revenue and profit($US million)
2000 2003 2005 2007 2009 2010 % Change(2000–2005)
% Change(2005–2010)
TCCCNet revenue 17,354 21,044 23,104 28,857 30,990 35,119 33 52Net profit 2,177 4,347 4,872 5,981 6,906 11,859 124 143
PepsiCoNet revenue 22,337 26,971 32,562 39,474 43,232 57,838 46 78Net profit 2,543 3,568 4,060 5,658 5,946 6,320 60 56
PepsiCo, PepsiCo Inc.; TCCC, The Coca-Cola Company.
obesity reviews Global beverage sales dynamics S. Kleiman et al. 267
© 2011 The Authorsobesity reviews © 2011 International Association for the Study of Obesity 13, 258–274, March 2012

Table 3 Trends 2000–2010 in off-trade revenue from soft drinks: Global, the United States, Brazil and China
Off-trade sales ($US million) 2000 2003 2005 2007 2009 2010 % Change(2000–2005)
% Change(2005–2010)
A. WorldTCCC Soft drinks total 70,685 74,191 81,423 92,195 97,059 103,630 15 27TCCC Bottled water 1,246 2,957 4,664 7,390 8,858 9,343 274 100TCCC Carbonates 55,390 56,312 60,857 67,818 69,076 73,353 10 21TCCC Concentrates 71 119 127 125 126 142 78 12TCCC Fruit/Vegetable juice 5,436 5,276 5,233 6,175 7,141 7,828 -4 50TCCC RTD coffee 3,570 3,408 3,531 3,120 3,546 3,619 -1 2TCCC RTD tea 2,970 2,910 3,186 3,139 3,653 3,996 7 25TCCC Sports and energy drinks 1,997 3,203 3,818 4,422 4,651 5,341 91 40PepsiCo Soft drinks total 28,540 35,328 40,509 44,996 44,015 46,047 42 14PepsiCo Bottled water 728 1,506 2,104 3,625 3,331 3,721 189 77PepsiCo Carbonates 23,263 23,656 26,182 28,026 27,761 28,709 13 10PepsiCo Concentrates 25 101 105 111 99 104 322 -1PepsiCo Fruit/Vegetable juice 4,223 4,283 4,453 4,784 5,549 6,071 5 36PepsiCo RTD tea 9 12 49 53 50 48 478 -2PepsiCo Sports and energy drinks 292 5,771 7,616 8,397 7,225 7,394 2,505 -3
B. United StatesTCCC Soft drinks total 18,445 19,074 20,341 21,713 21,128 20,583 10 1TCCC Bottled water 298 599 1,721 3,284 3,577 3,211 477 87TCCC Carbonates 14,700 15,115 15,318 14,663 13,833 13,348 4 -13TCCC Concentrates 3 2 2 2 1 1 -35 -45TCCC Fruit/Vegetable juice 3,029 2,728 2,211 2,386 2,524 2,570 -27 16TCCC RTD coffee N/A 4 N/A N/A N/A N/A N/A N/ATCCC RTD tea N/A N/A N/A 47 86 146 N/A N/ATCCC Sports and energy drinks 415 626 1,089 1,331 1,106 1,308 163 20PepsiCo Soft drinks total 15,265 20,626 22,079 22,621 19,325 18,568 45 -16PepsiCo Bottled water 550 1,164 1,466 2,354 1,907 1,680 166 15PepsiCo Carbonates 11,279 11,582 11,755 11,355 10,137 9,792 4 -17PepsiCo Concentrates N/A 35 35 40 41 43 N/A 21PepsiCo Fruit/Vegetable juice 3,178 3,045 2,652 2,485 2,162 1,980 -17 -25PepsiCo Sports and energy drinks 259 4,801 6,170 6,387 5,079 5,073 2,284 -18
C. BrazilTCCC Soft drinks total 3,317 2,145 2,863 4,199 4,606 5,853 -14 104TCCC Bottled water 4 3 3 5 6 7 -30 132TCCC Carbonates 3,313 2,113 2,743 3,952 4,486 5,686 -17 107TCCC Fruit/Vegetable juice N/A 27 109 177 N/A N/A N/A N/ATCCC RTD tea N/A N/A N/A 55 65 87 N/A N/ATCCC Sports and energy drinks N/A 3 8 9 49 73 N/A 822PepsiCo Soft drinks total 294 272 417 558 1,083 1,398 42 235PepsiCo Bottled water 1 N/A N/A 1 260 315 N/A N/APepsiCo Carbonates 293 233 347 435 513 675 18 95PepsiCo Fruit/Vegetable juice N/A N/A N/A N/A 181 244 N/A N/APepsiCo Sports and energy drinks N/A 39 70 121 130 165 N/A 134
D. ChinaTCCC Soft drinks total 1,435 1,754 2,276 3,289 5,028 5,314 59 133TCCC Bottled water 8 114 153 186 282 341 1,891 122TCCC Carbonates 1,419 1,586 1,882 2,461 3,467 3,539 33 88TCCC Fruit/Vegetable juice 2 48 218 631 1,057 1,186 8,983 444TCCC RTD tea 7 6 22 11 222 248 242 1,016PepsiCo Soft drinks total 721 949 1,135 1,352 1,865 1,896 58 67PepsiCo Carbonates 721 941 1,125 1,335 1,661 1,653 56 47PepsiCo Fruit/Vegetable juice N/A N/A N/A N/A 167 205 N/A N/APepsiCo Sports and energy drinks N/A 8 10 17 37 38 N/A 283
N/A, not applicable; PepsiCo, PepsiCo Inc.; RTD, ready-to-drink; TCCC, The Coca-Cola Company.
268 Global beverage sales dynamics S. Kleiman et al. obesity reviews
© 2011 The Authorsobesity reviews © 2011 International Association for the Study of Obesity13, 258–274, March 2012
the non-nutritive sweetened beverages that matters (51,52);however, there are many unresolved issues related to theimpact of non-nutritive sweetener intake on health.
As TCCC and PepsiCo carried out these changes intheir respective product lines, the CSD per capita energysold by these companies decreased in the United Statesfrom 2000 to 2010, although this was offset by increasesin per capita energy sold in Brazil, China, and globallyover the same period. However, despite continuedincreases in the energy sold by TCCC and PepsiCo
throughout much of the world, the average energy densityof CSD sold declined during the last decade, both in indi-vidual countries, such as the United States and Brazil, aswell as on a global scale, suggesting a substitution oflower- or zero-calorie products for their full-calorieequivalents. These trends appear to be most advanced inthe United States but, as obesity and related health effectsare a global concern, it will be important for companiessuch as TCCC and PepsiCo to focus efforts in developingcountries with large population bases, where growth in
Table 4 Trends 2000–2010 in average energy density (kJ 100 mL-1 sold): Global, the United States, Brazil and China
Average energy density (kJ 100 mL-1) 2000 2003 2005 2007 2009 2010 % Change(2000–2005)
% Change(2005–2010)
A. WorldTCCC Bottled water 0.07 0.06 0.06 0.11 0.12 0.11 -18 89TCCC Carbonates 1.31 1.29 1.28 1.27 1.27 1.27 -3 -1TCCC Concentrates 0.51 0.53 0.59 0.59 0.60 0.60 15 2TCCC Fruit/Vegetable juice 1.85 1.86 1.86 1.85 1.86 1.86 0 0TCCC RTD coffee 1.12 1.12 1.12 1.12 1.12 1.12 0 0TCCC RTD tea 0.28 0.21 0.20 0.21 0.23 0.21 -27 5TCCC Sports and energy drinks 0.87 0.84 0.86 0.88 0.92 0.91 -1 6PepsiCo Bottled water 0.11 0.09 0.08 0.08 0.07 0.29 -28 260PepsiCo Carbonates 1.46 1.42 1.41 1.42 1.43 1.44 -3 2PepsiCo Concentrates 0.62 0.62 0.62 0.62 0.62 0.62 0 0PepsiCo Fruit/Vegetable juice 1.87 1.86 1.85 1.85 1.83 1.83 -1 -1PepsiCo RTD tea 0.26 0.26 0.26 0.26 0.26 0.26 0 0PepsiCo Sports and energy drinks 0.73 0.75 0.75 0.76 0.76 0.76 3 2
B. United StatesTCCC Bottled water 0.00 0.00 0.00 0.15 0.21 0.19 N/A N/ATCCC Carbonates 1.09 1.07 1.02 1.02 1.00 0.99 -7 -3TCCC Fruit/Vegetable juice 1.86 1.86 1.87 1.88 1.88 1.88 0 1TCCC RTD tea N/A N/A N/A 0.95 0.95 0.95 N/A N/ATCCC Sports and energy drinks 0.88 0.85 0.88 0.90 0.92 0.90 0 2PepsiCo Bottled water 0.00 0.01 0.02 0.04 0.06 0.09 584 377PepsiCo Carbonates 1.34 1.24 1.21 1.22 1.22 1.22 -9 0PepsiCo Fruit/Vegetable juice 1.87 1.86 1.86 1.86 1.83 1.81 0 -3PepsiCo Sports and energy drinks 0.74 0.75 0.75 0.76 0.76 0.76 1 1
C. BrazilTCCC Bottled water 0.46 0.46 0.46 0.46 0.46 0.46 0 0TCCC Carbonates 1.40 1.38 1.37 1.37 1.36 1.37 -2 0TCCC Fruit/Vegetable juice N/A 1.74 1.79 1.79 N/A N/A N/A N/ATCCC RTD tea N/A N/A N/A 0.84 0.84 0.26 N/A N/ATCCC Sports and energy drinks N/A 2.48 2.48 2.48 1.51 1.44 N/A -42PepsiCo Bottled water N/A N/A N/A 0.00 0.00 0.00 N/A N/APepsiCo Carbonates 1.78 1.68 1.67 1.66 1.67 1.64 -6 -2PepsiCo Fruit/Vegetable juice N/A N/A N/A N/A 0.84 0.84 N/A N/APepsiCo Sports and energy drinks N/A 0.72 0.72 0.72 0.72 0.72 N/A 0
D. ChinaTCCC Bottled water 0.00 0.10 0.10 0.09 0.11 0.13 N/A 30TCCC Carbonates 1.56 1.55 1.54 1.54 1.53 1.53 -1 -1TCCC Fruit/Vegetable juice 1.73 1.83 1.83 1.83 1.83 1.83 6 0TCCC RTD tea 0.26 0.26 0.26 0.26 0.26 0.26 0 0PepsiCo Carbonates 1.76 1.76 1.76 1.76 1.76 1.75 0 -1PepsiCo Fruit/Vegetable juice N/A N/A N/A N/A 1.87 1.87 N/A N/APepsiCo Sports and energy drinks N/A 0.72 0.72 0.72 0.72 0.72 N/A 0
N/A, not applicable; PepsiCo, PepsiCo Inc.; RTD, ready-to-drink; TCCC, The Coca-Cola Company.
obesity reviews Global beverage sales dynamics S. Kleiman et al. 269
© 2011 The Authorsobesity reviews © 2011 International Association for the Study of Obesity 13, 258–274, March 2012
soft drink sales is particularly strong and CSDs make upthe bulk of these sales.
Even as TCCC and PepsiCo revamped existing productsand expanded their ‘healthier’ offerings through invest-ments and acquisitions, both companies were able to retainprofitability over the last decade, increasing both netrevenue and profit for their global operations. Although theoverall volume sold per capita was relatively flat for thesecompanies in the United States, as sales peaked in 2005–2006 and subsequently declined to earlier levels, sales wererobust in developing countries such as Brazil and China,with off-trade value sales (our proxy for profit) increasingyear over year. Although value sales of CSD declined in theUnited States from 2000 to 2010, overall soft drink salesincreased 12% for TCCC and 22% for PepsiCo, demon-strating that these companies can profit even as their port-folios shift away from CSD.
We have provided only a glimpse into the role of globalfood and beverage companies by focusing on soft drinks(particularly CSD) and the two major companies in thatcategory. Together, TCCC and PepsiCo represent 69% ofthe global CSD market, and they have a dominant combinedmarket share in each of our countries of interest, namely theUnited States (71%), Brazil (64%) and China (91%) (7).However, global companies such as these are not the onlycontributors to our food supply. In many countries, domes-tic companies have a strong influence, and partnerships,joint ventures, and distribution rights greatly enhance thecomplexity of understanding the food supply chain. Regard-less, it is important for global companies to be at the
forefront of the movement towards healthier food andbeverage options, as they set the tone not only for their peersbut also for local and domestic companies. Consequently,their leadership has the potential to influence consumers farbeyond their actual market shares if they significantlychange their portfolios towards healthier product mixes.
Our results must be considered in light of several limita-tions we faced in carrying out this work. First, the recentglobal recession affected the United States relatively morethan China and Brazil (53–56). A resurgent global economymight have led to trends seen in Brazil and China andmirrored in other countries. Second, the Euromonitor salesdata on beverage brands designated as linked with TCCC orPepsiCo may omit some local brands affiliated with thesecompanies. In addition, through the Gladson NutritionDatabase, we have access to comprehensive nutrition infor-mation for US products and have used that to impute caloriedata for other countries, potentially decreasing the accuracyof our non-US results. Moreover, as the sales data arereported by beverage categories defined by Euromonitor, wewere unable to classify brands or products in a differentmanner, such as separating cola and non-cola CSDs orfull-calorie/regular and low-calorie CSDs. Lastly, as TCCCand PepsiCo only report their global financial results, wecould not identify country-specific profitability. We also hadto examine PepsiCo’s financial results across all divisions,which include a range of both food and beverage products,while TCCC is focused on beverages only.
This study points out complex trends. On the one hand,TCCC and PepsiCo have rapidly increased beverage sales
Figure 5 Trends 2000–2010 in average energy density (kJ 100 mL-1) sold: Global, the United States, Brazil and China. (a) Average energy density(kJ 100 mL-1) sold: The Coca-Cola Company – carbonates. (b) Average energy density (kJ 100 mL-1) sold: PepsiCo – carbonates. World;
United States; Brazil; China.
270 Global beverage sales dynamics S. Kleiman et al. obesity reviews
© 2011 The Authorsobesity reviews © 2011 International Association for the Study of Obesity13, 258–274, March 2012
globally and in Brazil and China, with large increases in totalenergy sold over the last 10 years. On the other hand, itappears that these two largest market players are adjustingtheir product portfolios in ways that increase lower-calorieoptions for consumers, particularly within CSD. While thehealthier product trends are most visible in the United States,there is evidence that the changes are spreading to develop-ing countries as well. These trends are small compared to themajor adverse impact caloric beverages, be they fruit juice,sports and energy drinks, or CSD, have on health. This paperhas shown that it is possible for these global giants to bewealthier while providing a slightly healthier profile in theUnited States. Is it possible for global food and beveragecompanies to improve the nutritional quality of their pro-ducts globally without sacrificing profits? This is not known,and some have called for an increase in public–privatepartnerships (57) or checks and balances to support publichealth initiatives that may run counter to the underlyingprofit-maximizing interests of the food and beverage indus-try (58). Whether it is possible for these global companies totruly reduce total energy sold (and consumed) per capitamuch more significantly without serious regulatory changesand strong national and global legislative initiatives remainsa major public health concern.
Conflict of Interest Statement
None of the authors have conflicts of interest of any typewith respect to this manuscript.
Acknowledgements
The work presented in this paper was supported by fundsfrom the Robert Wood Johnson Foundation (Grant No.67506), the National Institutes of Health (R01 HL104580)and the University of North Carolina.
References
1. WCRF/AICR. A case for action. In: Marmot M, Atinmo T,Byers T, Chen J, Hirohata T, Jackson A et al. (eds). Food, Nutri-tion, Physical Activity, and the Prevention of Cancer: A GlobalPerspective. World Cancer Research Fund/American Institutefor Cancer Research Expert Report: Washington, DC, 2007,pp. 12–28.2. Malik VS, Popkin BM, Bray GA, Despres J-P, Hu FB.Sugar-sweetened beverages, obesity, type 2 diabetes mellitus,and cardiovascular disease risk. Circulation 2010; 121: 1356–1364.3. Malik VS, Popkin BM, Bray GA, Després J-P, Willett WC, HuFB. Sugar-sweetened beverages and risk of metabolic syndromeand type 2 diabetes: a meta-analysis. Diabetes Care 2010; 33:2477–2483.4. Vartanian LR, Schwartz MB, Brownell KD. Effects of softdrink consumption on nutrition and health: a systematic reviewand meta-analysis. Am J Public Health 2007; 97: 667–675.
5. Mattes RD. Dietary compensation by humans for supplementalenergy provided as ethanol or carbohydrate in fluids. PhysiolBehav 1996; 59: 179–187.6. DiMeglio DP, Mattes RD. Liquid versus solid carbohydrate:effects on food intake and body weight. Int J Obes Relat MetabDisord 2000; 24: 794–800.7. Mourao D, Bressan J, Campbell W, Mattes R. Effects of foodform on appetite and energy intake in lean and obese young adults.Int J Obes 2007; 31: 1688–1695.8. DellaValle DM, Roe LS, Rolls BJ. Does the consumption ofcaloric and non-caloric beverages with a meal affect energy intake?Appetite 2005; 44: 187–193.9. Flood J, Roe L, Rolls B. The effect of increased beverageportion size on energy intake at a meal. J Am Diet Assoc 2006;106: 1984–1990.10. Brownell KD, Farley T, Willett WC, Popkin BM, ChaloupkaFJ, Thompson JW et al. The public health and economic benefits oftaxing sugar-sweetened beverages. N Engl J Med 2009; 361: 1599–1605.11. U.S. Department of Agriculture and U.S. Department ofHealth and Human Services. Foods and food components toreduce. In Dietary Guidelines for Americans 2010, 7th edn. U.S.Government Printing Office: Washington, DC, 2010, p. 28. URLhttp://www.cnpp.usda.gov/DGAs2010-PolicyDocument.htm(accessed September 2011).12. Gidding SS, Lichtenstein AH, Faith MS, Karpyn A, MennellaJA, Popkin BM et al. Implementing American Heart AssociationPediatric and Adult Nutrition Guidelines: a scientific statementfrom the American Heart Association Nutrition Committee of theCouncil on Nutrition, Physical Activity and Metabolism, Councilon Cardiovascular Disease in the Young, Council on Arterioscle-rosis, Thrombosis and Vascular Biology, Council on Cardiovascu-lar Nursing, Council on Epidemiology and Prevention, andCouncil for High Blood Pressure Research. Circulation 2009; 119:1161–1175.13. Popkin BM, Nielsen SJ. The sweetening of the world’s diet.Obes Res 2003; 11: 1325–1332.14. Nielsen SJ, Popkin BM. Changes in beverage intake between1977 and 2001. Am J Prev Med 2004; 27: 205–210.15. Wang YC, Bleich SN, Gortmaker SL. Increasing caloric con-tribution from sugar-sweetened beverages and 100% fruit juicesamong us children and adolescents, 1988–2004. Pediatrics 2008;121: e1604–e1614.16. International Food and Beverage Alliance. A Global Commit-ment to Action on the Global Strategy on Diet, Physical Activityand Health. International Food and Beverage Alliance: Geneva.2008. URL https://www.ifballiance.org/sites/default/files/IFBA%20-%20DG%20Chan%28May%202008%29.pdf (accessedSeptember 2011).17. Fuhrman E. 2010 Soft Drink Report: CSDs struggle as con-sumer perception shifts. Beverage Industry, 2010.18. Euromonitor. Soft drinks global trends and opportunities.2010.19. Storey M. The shifting beverage landscape. Physiol Behav2010; 100: 10–14.20. Sicher J. Special issue: top-10 CSD results for 2010. BeverageDigest, 2011.21. Healthy Weight Commitment Foundation. Food and BeverageManufacturers Pledging to Reduce Annual Calories by 1.5 Trillionby 2015. Healthy Weight Commitment Foundation: Washington,DC, 2010. URL http://www.healthyweightcommit.org/news/Reduce_Annual_Calories/ (accessed September 2011).22. Popkin BM. Patterns of beverage use across the life cycle.Physiol Behav 2010; 100: 4–9.
obesity reviews Global beverage sales dynamics S. Kleiman et al. 271
© 2011 The Authorsobesity reviews © 2011 International Association for the Study of Obesity 13, 258–274, March 2012

23. Kraak VI, Story M, Wartella EA, Ginter J. Industry progress tomarket a healthful diet to American children and adolescents. AmJ Prev Med 2011; 41: 322–333.24. McGinnis JM. Societal resolve and the health of children. AmJ Prev Med 2011; 41: 355–356.25. Committee on Food Marketing and the Diets of Children andYouth. Findings, recommendations, next steps. In: McGinnis JM,Gootman JA, Kraak VI (eds). Food Marketing to Children andYouth: Threat or Opportunity? The National Academies Press:Washington, DC, 2006, pp. 373–388.26. Federal Trade Commission and DHHS. Perspective on mar-keting, self-regulation, & childhood obesity: a report on ajoint workshop of the Federal Trade Commission and DHHS.2006.27. Harris JL, Weinberg ME, Schwartz MB, Ross C, Ostroff J,Brownell KD. Trends in Television Food Advertising. Progress inReducing Unhealthy Marketing to Young People? Rudd Center forFood Policy & Obesity: New Haven, CT, 2010.28. Sharma LL, Teret SP, Brownell KD. The food industry andself-regulation: standards to promote success and to avoid publichealth failures. Am J Public Health 2010; 100: 240–246.29. Brownell KD, Warner KE. The perils of ignoring history: BigTobacco played dirty and millions died. How similar is Big Food?Milbank Q 2009; 87: 259–294.30. Barquera S, Campirano F, Bonvecchio A, Hernandez-BarreraL, Rivera J, Popkin B. Caloric beverage consumption patterns inMexican children. Nutr J 2010; 9: 47.31. Slining MM, Popkin BM. Empty Calories in the United States:Definition and Measurement. University of North Carolina atChapel Hill: Chapel Hill, NC, 2011.32. Ng SW, Popkin BM. Monitoring food and nutrients sold andconsumed in the United States: dynamics and challenges. J AmerDiet Assoc 2011; (in press).33. Merchant AT, Kelemen LE, de Koning L, Lonn E, Vuksan V,Jacobs R et al. Interrelation of saturated fat, trans fat, alcoholintake, and subclinical atherosclerosis. Am J Clin Nutr 2008; 87:168–174.34. Monteiro CA, Gomes FS, Cannon G. The snack attack. Am JPublic Health 2010; 100: 975–981.35. IBGE. 2010 Census: Brazilian Population Amounts to190,732,694 Persons. Instituto Brasileiro de Geografia e Estatís-tica: Rio de Janeiro, 2011.36. U.S. Census Bureau. United States 2010 Census. U.S. CensusBureau: Washington, DC, 2011.37. U.S. Census Bureau. International Database: WorldPopulation. U.S. Census Bureau: Washington, DC, 2011.URL http://www.census.gov/population/international/data/idb/worldpopinfo.php (accessed September 2011).38. Ma J. Press release on major figures of the 2010 NationalPopulation Census. National Bureau of Statistics of China. 2011.39. PepsiCo Inc. PepsiCo 2010 Annual Report. 2011. URL http://www.pepsico.com/Download/PepsiCo_Annual_Report_2010_Full_Annual_Report.pdf (accessed September 2011).40. The Coca-Cola Company. The Coca-Cola Company 2010 An-nual Review. 2011. URL http://www.thecoca-colacompany.com/ourcompany/ar/pdf/TCCC_2010_Annual_Review.pdf (accessedSeptember 2011).41. Euromonitor. Carbonates – Brazil. 2011.42. Hill JO, Wyatt HR, Reed GW, Peters JC. Obesity and theenvironment: where do we go from here? Science 2003; 299:853–855.43. Wang YC, Gortmaker SL, Sobol AM, Kuntz KM. Estimatingthe energy gap among US children: a counterfactual approach.Pediatrics 2006; 118: e1721–e1733.
44. Hall KD, Sacks G, Chandramohan D, Chow CC, Wang YC,Gortmaker SL et al. Quantification of the effect of energy imbal-ance on bodyweight. Lancet 2011; 378: 826–837.45. Dhingra R, Sullivan L, Jacques PF, Wang TJ, Fox CS, Meigs JBet al. Soft drink consumption and risk of developing cardiometa-bolic risk factors and the metabolic syndrome in middle-agedadults in the community. Circulation 2007; 116: 480–488.46. Lutsey P, Steffen L, Stevens J. Dietary intake and the develop-ment of the metabolic syndrome: the Atherosclerosis Risk inCommunities study. Circulation 2008; 117: 754–761.47. Nettleton J, Lutsey P, Wang Y, Lima J, Michos E, Jacobs D Jr.Diet soda intake and risk of incident metabolic syndrome and type2 diabetes in the Multi-Ethnic Study of Atherosclerosis (MESA).Diabetes Care 2009; 32: 688–694.48. Phelan S, Lang W, Jordan D, Wing RR. Use of artificialsweeteners and fat-modified foods in weight loss maintainers andalways-normal weight individuals. Int J Obes (Lond) 2009; 33:1183–1190.49. Mattes RD, Popkin BM. Nonnutritive sweetener consumptionin humans: effects on appetite and food intake and their putativemechanisms. Am J Clin Nutr 2009; 89: 1–14.50. Drewnowski A. Intense sweeteners and energy density offoods: implications for weight control. Eur J Clin Nutr 1999; 53:757–763.51. Duffey KJ, Steffen LM, Van Horn L, Jacobs DR Jr, PopkinBM. Dietary patterns matter: diet beverages and cardio-metabolicrisks in the longitudinal CARDIA Study. 2011.52. Tate D, Erickson K, Turner-McGrievy G, Polzein K, DiamondM, Stevens J et al. The Choose Healthy Options ConsciouslyEveryday (CHOICE) study: a randomized clinical trial examiningthe effect of altering caloric beverage choices on weight loss.Chapel Hill, NC. 2011.53. Liu J, Baskaran A, Muchie M. Global Recession and theNational System of Innovation in China: ‘A Blessing in Disguise?’.DIR Research Series. Research Center on Development and Inter-national Relations: Aalborg, Denmark. 2010.54. Kshetri N. Emerging economies and the global financial crisis:evidence from China and India. Thunderbird Int Bus Rev 2011;53: 247–262.55. Naude W. Paper U-WR. The financial crisis of 2008 and thedeveloping countries. World Institute for Development EconomicResearch (UNU-WIDER). 2009.56. Morales-Pita AE, Cihlar B, Richmond R, Stout D, Towner R.Recession in America and its worldwide repercussion. J EconOrgan Future Enterp 2009; 6: 2–22.57. Yach D, Khan M, Bradley D, Hargrove R, Kehoe S, MensahG. The role and challenges of the food industry in addressingchronic disease. Global Health 2010; 6: 10.58. Ludwig DS, Nestle M. Can the food industry play a con-structive role in the obesity epidemic? JAMA 2008; 300: 1808–1811.
Appendix I – Euromonitor SoftDrink Definitions
Soft Drinks
This is the aggregation of the following categories: carbon-ates, fruit/vegetable juice, bottled water, functional drinks,concentrates, RTD tea, RTD coffee and Asian specialtydrinks.
272 Global beverage sales dynamics S. Kleiman et al. obesity reviews
© 2011 The Authorsobesity reviews © 2011 International Association for the Study of Obesity13, 258–274, March 2012

� Bottled WaterThis sector includes sparkling water, spring water andpurified/table water. This is the aggregation of stillbottled water, carbonated bottled water, flavouredbottled water and functional bottled water.� Carbonated Bottled Water
Includes all carbonated bottled water, excluding fla-voured and/or functional carbonated water. Leadingbrands in off-trade volume include Aqua Minerale,Ferrarelle and IVESS.
� Flavoured Bottled WaterIncludes all flavoured bottled water, both carbonatesand still. Commonly fruit juice or essence has acontent of 1 mg L-1. In addition, flavoured bottledwater does not normally contain colourings. Theproduct can be either sugarized or sugar-free.Leading brands in off-trade volume include Levité,H2OH! and Be-Light.
� Functional Bottled WaterThis subsector utilizes production techniques furtherthan water purification processes. Functional bottledwater is therefore novel as the product is alteredand/or has been structurally changed to include vita-mins, minerals, fruits or herbs. The subsector can becategorized into two subdivisions, these can andoften do overlap. Firstly, nutraceutical or fortifiedwaters, where various types of fruit or herbal con-centrate or vitamin and mineral extracts are added tothe bottled water for nutrient value. The producttypically carries added calcium and vitamins, oradded herbs, such as ginseng, gingko biloba andelderflower. Secondly, sports or fitness waters, whichare altered, structured, electrolyzed or oxygenatedbottled water where many of the physical or chemicalcharacteristics of the water molecules are changed.Therefore, this enables the bottled water capable ofcarrying nutrients and oxygen into cells more effec-tively. Typically contains electrolytes, amino acids, aswell as added vitamins and minerals. Functionaldrinks are not included in this sector and are includedin functional drinks. Leading brands in off-tradevolume include Glaceau VitaminWater, PropelFitness Water and Dakara.
� Still Bottled WaterIncludes all bottled water that is not carbonated,flavoured and/or functional. Leading brands in off-trade volume include Aqua, Wahaha and Bonafont.
� Carbonates/Carbonated Soft Drinks (CSD)Euromonitor International defines carbonates as allnon-alcoholic drinks into which carbon dioxide gashas been dissolved and therefore the drink is carbon-ated. Carbonates are an aggregation of cola carbonatesand non-cola carbonates, whether regular or low
calorie. Euromonitor International included bothsweetened and/or carbonates containing artificialsweeteners.� Cola Carbonates
This is the aggregation of regular cola and low-calorie cola carbonates.
� ConcentratesThis is the aggregation of liquid concentrates andpowder concentrates. RTD concentrate volumes arecalculated by applying an average conversion ratio foreach country to ‘as sold’ liquid and powder volumes.The conversion ratios for liquid and for powder arespecific to each country and can be viewed alongside ‘assold’ volumes in the appendix of each country report.� Liquid Concentrates
Concentrates and syrups, or alternatively knownsquashes or dilutables, which are diluted with waterbefore consumption. Based commonly on fruit juices,however, are also available as other in other forms, forexample cola. Dilution ratios vary from country tocountry because of local preferences and availablebrands. Leading brands in off-trade volume includeRobinsons, Tucan and Brookes.
� Powder ConcentratesPowder concentrates, including granules and blocks/bars/cubes, are diluted with water before consump-tion. Please note that powdered ice teas are includedwithin this subsector. Leading brands in off-tradevolume include Tang, Nestea Instant Iced Tea Mixand Nestlé Orange-C.
� Fruit/Vegetable JuiceThis sector only includes still drinks. Carbonated vari-eties are represented in the non-cola carbonates sub-sector. Juice-flavoured milk drinks and fruit shakes areexcluded. However, fruit/vegetable drinks that containa minimum amount of milk are included within thissector. This sector is the aggregation of 100% juice,nectars (25–99% juice content), juice drinks (up to24% juice content) and fruit-flavoured drinks.� 100% Juice
This is the aggregation of not from concentrate100% juice, reconstituted 100% juice and frozen100% juice.
� Juice Drinks (Up to 24% Juice)Includes all still juice drinks made up of fresh juice orconcentrate, not exceeding 24% juice content.Leading brands in off-trade volume include MinuteMaid, Capri Sun and President.
� Fruit-flavoured Drinks (No Juice Content)Includes all still fruit-flavoured drinks that containno juice, fruit or pulp content. Leading brands inoff-trade volume include Tampico, Lala and Ami.
obesity reviews Global beverage sales dynamics S. Kleiman et al. 273
© 2011 The Authorsobesity reviews © 2011 International Association for the Study of Obesity 13, 258–274, March 2012

� Nectars (25–99% Juice)This is the aggregation of unfrozen nectars andfrozen nectars.
� RTD CoffeeIncludes packaged ready-to-drink coffee. This sectordoes not include coffee-flavoured milk drinks. Leadingbrands in off-trade volume include Georgia, Nescaféand Suntory Boss.
� RTD TeaThis is the aggregation of still RTD tea and carbonatedRTD tea.� Still RTD Tea
Non-carbonated packaged ready-to-drink tea – thisdoes not include leaf or powdered tea. Leadingbrands in off-trade volume include Master KongGreen Tea, Lipton and Nestea Lemon Tea.
� Carbonated RTD TeaCarbonated packaged ready-to-drink tea – this doesnot include leaf or powdered tea. Leading brands inoff-trade volume include Lipton Ice Tea Sparking,Rosynka and TEBS.
� Sports and Energy DrinksThis category is the aggregation of sports and energydrinks.� Energy Drinks
These are drinks that are designed to boost energylevels. They usually contain high levels of caffeineand the amino acid taurine. Other ingredients asso-ciated with stimulating properties, such as guaranaand ginseng, are also commonly used. Leadingbrands in off-trade volume include Red Bull,Monster and RockStar.
� Sports DrinksThe choice of sports drink usually depends on theprovision of fluids, carbohydrates or both. Includedinto this subsector are isotonic, hypotonic and hyper-tonic sports drinks. Isotonic are products that replacelost body fluids, electrolytes (sodium, potassium andchlorides) and glucose in similar concentrations toexisting body fluid without causing either swelling orshrinkage of cells. These products usually containabout 5–8% carbohydrates and are intended to beconsumed during exercise and/or heat exposure.Hypotonic – this product is a weaker solution thanyour body fluid. These drinks contain less carbohy-drate and therefore have lower osmolality (fewerdissolved particles than blood). These drinks help thebody to speed up water absorption and are best usedwhen you need urgent fluid replacement, as in afterexercise. These drinks are not the best for energy
replacement. Hypertonic – this drink is a strongersolution than your body fluid. These drinks aredesigned to replace and maintain energy levels duringexercise of at least 1 h. They are absorbed slowly andtherefore are not appropriate for fluid replacement.Leading brands in off-trade volume include Gato-rade, Powerade and Aquarius.
� Asian Specialty DrinksAsian specialty drinks are traditional drinks ornational specialties commonly found in Asia. This isthe aggregation of Asian still RTD tea, cereal-pulsebased, Asian juice drinks and other Asian specialtydrinks.� Asian Still RTD Tea
Common flavours within this sector include the fol-lowing: chrysanthemum RTD tea (combinationsinclude ginseng, lotus root and luo han kuo), herbalRTD tea (commonly with added fruit flavour orAsian health products), winter melon RTD tea, greenRTD tea (sometimes fruit flavour is added), blackRTD tea (sometimes added fruit flavour), OolongRTD tea and packaged bubble tea. Leading brandsin off-trade volume include Master Kong Green Tea,Oi Ocha and Wong Lo Kat Herbal Tea.
� Asian Juice DrinksFruit drinks that are common to Asia. Examplesinclude longan, lychee, kalamansi, coconut (withand without pulp), water chestnut, sour plum, reddate and dragon fruit. Please note that only pack-aged variants are included within this subsector.Asian juice drinks and juice drinks excluding Asianprovide analysis on the juice drinks market in Asiancountries. Leading brands in off-trade volumeinclude Coconut Palm Coconut Juice, President andI-Mer Sour Plum Juice.
� Cereal/Pulse-based DrinksInclude packaged barley, lemon barley, rice, taho andsoya bean-based drinks. Please note that soy milk isnot included within this subsector. Leading brands inoff-trade volume include Yeo’s Soya Bean Drink,Vitasoy Soya Bean Milk.
� Other Asian Specialty DrinksTraditional Asian speciality drinks not coveredunder Asian still RTD tea, cereal–pulse based andAsian juice drinks, which examples include the fol-lowing products: Bandung (rose syrup with milk),bird’s nest, tamarind juice, ginger, lemon grass,roselle, zalaka, jelly drinks including grass jelly(cincau) and sugar cane. Leading brands in off-tradevolume include Lolo Almond Juice, Calpis Waterand Kaki Tiga.
274 Global beverage sales dynamics S. Kleiman et al. obesity reviews
© 2011 The Authorsobesity reviews © 2011 International Association for the Study of Obesity13, 258–274, March 2012