surveying the technology landscape: teachers’ use of
TRANSCRIPT
Mathematics Education Research Journal 2008, Vol. 20, no. 3, 102-130
Surveying the Technology Landscape: Teachers’ Use of Technology in Secondary
Mathematics Classrooms
Merrilyn Goos and Anne Bennison The University of Queensland
For many years, education researchers excited by the potential for digital technologies to transform mathematics teaching and learning have predicted that these technologies would become rapidly integrated into every level of education. However, recent international research shows that technology still plays a marginal role in mathematics classrooms. These trends deserve investigation in the Australian context, where over the past 10 years secondary school mathematics curricula have been revised to allow or require use of digital technologies in learning and assessment tasks. This paper reports on a survey of mathematics teachers’ use of computers, graphics calculators, and the Internet in Queensland secondary schools, and examines relationships between use and teachers’ pedagogical knowledge and beliefs, access to technology, and professional development opportunities. Although access to all forms of technology was a significant factor related to use, teacher beliefs and participation in professional development were also influential. Teachers wanted professional development that modelled planning and pedagogy so they could meaningfully integrate technology into their lessons in ways that help students learn mathematical concepts. The findings have implications not only for resourcing of schools, but also for designing professional development that engages teachers with technology in their local professional contexts.
For some time education researchers have recognised the potential for mathematics learning to be transformed by the availability of digital technologies such as computers, graphics calculators, and the Internet (see Arnold, 2004; Forster, Flynn, Frid, & Sparrow, 2004; Goos & Cretchley, 2004 for recent reviews of Australasian research). These technologies offer new opportunities for students to communicate and analyse their mathematical thinking by enabling fast, accurate computation, collection, and analysis of data, and exploration of the links between numerical, symbolic, and graphical representations (Hennessy, Fung, & Scanlon, 2001). In the 1980s and 1990s researchers predicted that technology would become rapidly integrated into every level of education (e.g., Churchhouse et al., 1986; Kaput, 1992). Also at this time, mathematics curriculum policy in Australia began to promote the use of technology to support students’ learning and develop their understanding of mathematical concepts (Australian Association of Mathematics Teachers, 1996; Australian Education Council, 1990). The intent of these national policy documents is reflected in the
Surveying the Technology Landscape 103 various Australian state and territory curriculum statements and syllabuses that now permit, encourage, or require use of digital technologies in secondary school mathematics.
Despite the early optimism for the future of technology integration in mathematics education, research in many countries has found that technology still plays a marginal role in mathematics classrooms and that educational policies, access to technology resources, and institutional support are insufficient conditions for ensuring effective integration of technology into teachers’ everyday practice (e.g., Cuban, Kirkpatrick, & Peck, 2001; Hoyles, Lagrange, Son, & Sinclair, 2006; Ruthven & Hennessy, 2002; Wallace, 2004). To date, however, there has been only limited research to investigate Australian teachers’ use of digital technologies in mathematics classrooms and factors that support or inhibit their effective integration into classroom practice.
This paper reports on a state wide survey of Queensland secondary school mathematics teachers that formed part of a larger study investigating teachers’ pedagogical practices and beliefs related to use of digital technologies in mathematics education (Goos, 2005a, 2005b). The main impetus for this survey came from the revision of the Queensland senior secondary (Years 11 and 12) Mathematics A, B, and C syllabuses in 2001. Mathematics A concentrates on applications for daily living and is described in the syllabus as the mathematics required for intelligent citizenship. Mathematics B and C are more advanced calculus and statistics subjects that prepare students for entry to university science and engineering courses. The original versions of these syllabuses, written in 1992, encouraged the use of technology wherever appropriate to support students’ learning. In response to the increasing availability of computers and especially graphics calculators, the revised syllabuses made it mandatory to incorporate these resources into a school’s learning and assessment programs for Mathematics B and C (Queensland Board of Senior Secondary School Studies, 2000a, 2000b). Since Queensland uses school-based assessment rather than external examinations at the end of Year 12, compliance with the syllabuses’ technology mandate is checked via accreditation of each school’s work program and monitoring of students’ assessment portfolios by experienced teachers sitting on district and state review panels under the aegis of the Queensland Studies Authority. The revised syllabuses were to be implemented for the first time with Year 11 students in 2002, and then with Years 11 and 12 students from 2003. The timing of our survey was intended to capture teachers’ experiences and perceptions during this transition period.
In reporting on our analysis of the survey data this paper aims to: 1. describe the teacher characteristics and school contexts of survey
respondents;
104 Goos & Bennison
2. determine how often survey respondents use digital technologies in their mathematics teaching
and how confident they feel in its use; and 3. identify factors associated with frequency of technology use.
Theoretical Framework Early research on technology-enriched mathematics teaching and learning examined the effects of technology use on students’ mathematical achievements and attitudes and their understanding of mathematical concepts, often using quasi-experimental designs that compared technology and non-technology users (e.g., see Penglase & Arnold, 1996, for a review of ‘first wave’ research on graphics calculators). However, these studies were based on the assumption that the same instructional objectives and methods are valid for both pen and paper and technology-enriched tasks, and they did not distinguish between the use of technology and the context of that use. Little attention was given to issues of pedagogy and the nature of teachers’ professional learning within and beyond the school environment (Windschitl & Sahl, 2002). To address some of these issues we have collaborated with various colleagues over several years in a series of studies informed by sociocultural theories of learning (see Galbraith & Goos, 2003; Goos, 2005a; Goos, 2005b; Goos, Galbraith, Renshaw, & Geiger, 2003). Sociocultural theories view learning as the product of interactions with other people and with material and representational tools offered by the learning environment. Because it acknowledges the complex, dynamic, and contextualized nature of learning in social situations, this perspective can offer rich insights into conditions affecting innovative use of technology in school mathematics.
In our research program we adapted Valsiner’s (1997) zone theory, originally designed as an explanatory structure in the field of child development, to apply to interactions between teachers, students, technology, and the teaching-learning environment. This framework extends Vygotsky’s (1978) concept of the Zone of Proximal Development (ZPD) – often defined as the gap between a learner’s present capabilities and the higher level of performance that could be achieved with appropriate assistance – to incorporate the social setting and the goals and actions of participants. Valsiner (1997)describes two additional zones: the Zone of Free Movement (ZFM) and Zone of Promoted Action (ZPA). The ZFM structures an individual’s access to different areas of the environment, the availability of different objects within an accessible area, and the ways the individual is permitted or enabled to act with accessible objects in accessible areas. The ZPA represents the efforts of a more experienced or knowledgeable person to promote the development of new skills. When we consider teachers’ professional learning, the ZFM can be interpreted as constraints within the
Surveying the Technology Landscape 105 school environment, such as student characteristics, access to resources and teaching materials, and curriculum and assessment requirements, while the ZPA represents opportunities to learn from pre-service teacher education, colleagues in the school setting, and professional development.
Previous research on technology use by mathematics teachers has identified a range of factors influencing uptake and implementation. These include: skill and previous experience in using technology; time and opportunities to learn (pre-service education, professional development); access to hardware and software; availability of appropriate teaching materials; technical support; institutional culture; knowledge of how to integrate technology into mathematics teaching; beliefs about the role of technology in learning; and beliefs about mathematics and how it is learned (Fine & Fleener, 1994; Forgasz & Prince, 2001; Manoucherhri, 1999; Simonsen & Dick, 1997; Walen, Williams, & Garner, 2003). In terms of the theoretical framework outlined above, these different types of knowledge and experience represent elements of a teacher’s ZPD, ZFM, and ZPA, as shown in Table 1.
Table 1 Factors Affecting Technology Usage
Valsiner’s Zones Elements of the Zones Zone of Proximal Development
Skill/experience in working with technology Pedagogical knowledge (technology integration) Pedagogical beliefs (technology; mathematics)
Zone of Free Movement Access to hardware, software, teaching materials Support from colleagues (including technical support) Institutional culture Curriculum & assessment requirements Students (perceived abilities, motivation, behaviour)
Zone of Promoted Action
Pre-service education (university program) Practicum and beginning teaching experience Professional development
Zone theory provided us with a framework for the case study component of our research, in which we analysed relationships between individual teachers’ settings, actions, and beliefs, and how these changed over time or across school contexts (e.g., see Goos, 2005a, 2005b; Goos & Bennison, 2007). To provide a backdrop for these case studies we designed a survey to collect information on the status of technology integration in Queensland secondary schools at a time when technology use was about to become mandatory for some senior mathematics subjects. Consistent with
106 Goos & Bennison
our overall theoretical perspective, we used zone theory to form categories and questions that guided analysis of teachers’ survey responses.
Towards a Survey Methodology The design of our survey was informed by Australasian studies conducted over the last 10 years that have investigated mathematics teachers’ use of computers, graphics calculators, and the Internet. Generally these studies have surveyed teachers to explore issues such as access, use, attitudes, and professional development, and the relationships between these. Table 2 provides a summary and comparison of the survey methods used in the representative set of studies discussed in this section.
Thomas (1996) developed a questionnaire to study New Zealand secondary mathematics teachers’ use of and attitudes towards computers. Information was sought on frequency of use, the kinds of mathematics topics that involved teaching with computers, types of software available, and reasons for both use and non-use of computers. The major obstacle reported by teachers was lack of access to computers and software, while lack of training and lack of confidence were also identified as significant barriers inhibiting use. Ten years later Thomas (2006) administered a similar survey to determine whether teacher perceptions and patterns of use had changed. Although many more computers were now available in schools, access remained an obstacle to increased use by secondary mathematics classes, and a substantial proportion of teachers reported attitudes that suggested they remained unconvinced of the benefits of computers for students’ learning.
In a similar study carried out in Australia, Forgasz (2002) surveyed Year 7 to 10 teachers in Victoria to find out how computers were being used in mathematics classrooms and to identify factors that acted as facilitators or hindrances to use. All schools participating in this study had computing resources available for classes, and most teachers felt confident or at least willing to “have a go” at using computers for teaching mathematics. Most had used computers with their mathematics classes, but only infrequently (e.g., for just one topic). A large proportion of these teachers had participated in professional development in computer education, but most of these wanted more training. As in Thomas’s (1996, 2006) New Zealand studies, the main obstacles discouraging these Australian teachers from using computers in teaching mathematics related to lack of access to computer laboratories and software, lack of skill and confidence, and uncertainty about whether computers help students learn mathematics.
Surveying the Technology Landscape 107
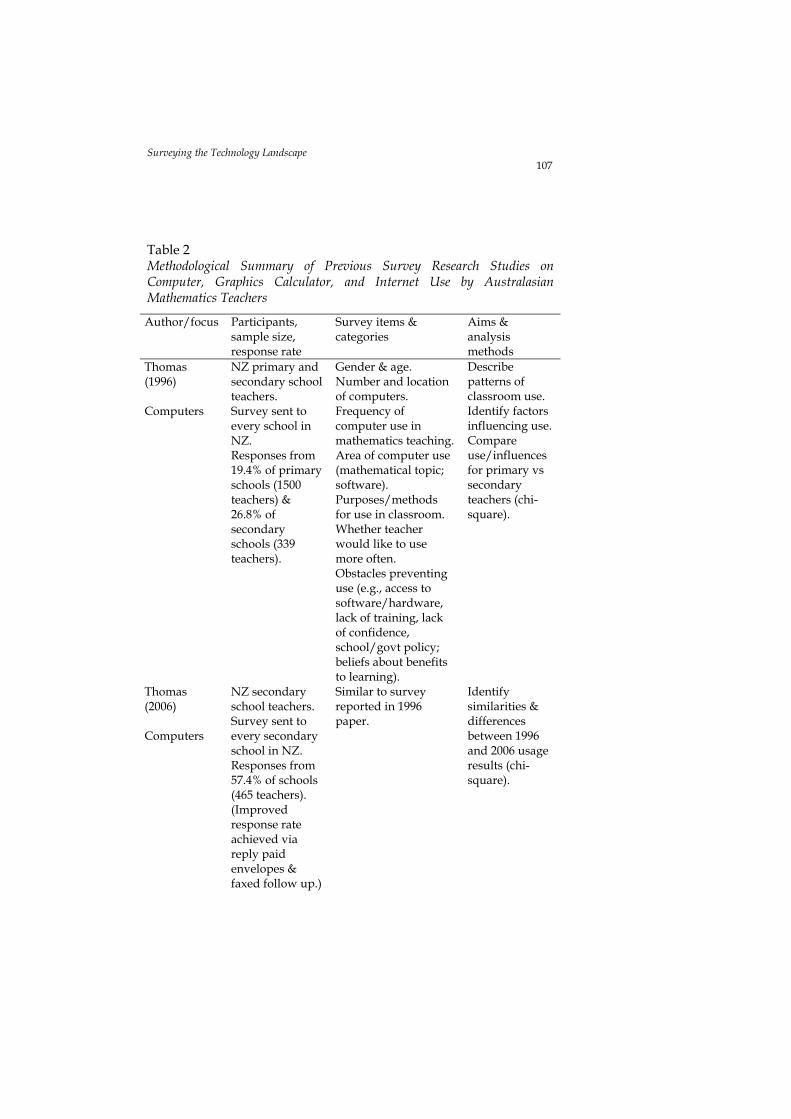
Table 2 Methodological Summary of Previous Survey Research Studies on Computer, Graphics Calculator, and Internet Use by Australasian Mathematics Teachers
Author/focus Participants, sample size, response rate
Survey items & categories
Aims & analysis methods
Thomas (1996) Computers
NZ primary and secondary school teachers. Survey sent to every school in NZ. Responses from 19.4% of primary schools (1500 teachers) & 26.8% of secondary schools (339 teachers).
Gender & age. Number and location of computers. Frequency of computer use in mathematics teaching. Area of computer use (mathematical topic; software). Purposes/methods for use in classroom. Whether teacher would like to use more often. Obstacles preventing use (e.g., access to software/hardware, lack of training, lack of confidence, school/govt policy; beliefs about benefits to learning).
Describe patterns of classroom use. Identify factors influencing use. Compare use/influences for primary vs secondary teachers (chi-square).
Thomas (2006) Computers
NZ secondary school teachers. Survey sent to every secondary school in NZ. Responses from 57.4% of schools (465 teachers). (Improved response rate achieved via reply paid envelopes & faxed follow up.)
Similar to survey reported in 1996 paper.
Identify similarities & differences between 1996 and 2006 usage results (chi-square).
108 Goos & Bennison
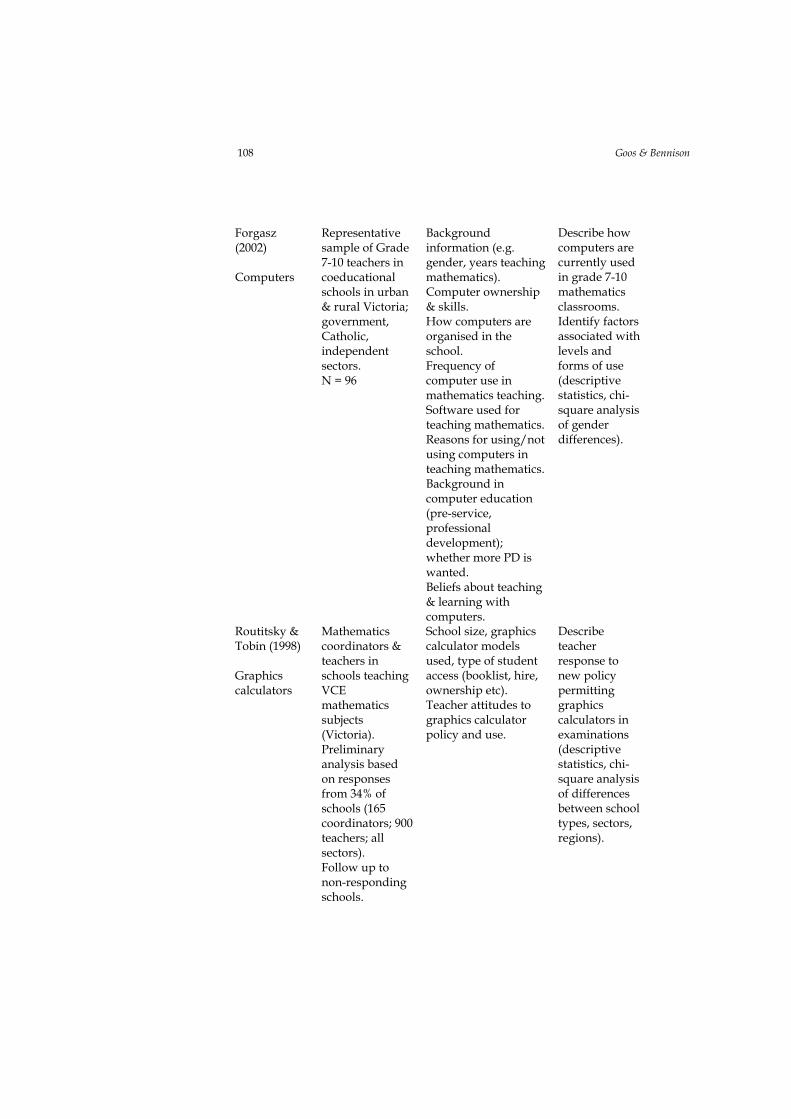
Forgasz (2002) Computers
Representative sample of Grade 7-10 teachers in coeducational schools in urban & rural Victoria; government, Catholic, independent sectors. N = 96
Background information (e.g. gender, years teaching mathematics). Computer ownership & skills. How computers are organised in the school. Frequency of computer use in mathematics teaching. Software used for teaching mathematics. Reasons for using/not using computers in teaching mathematics. Background in computer education (pre-service, professional development); whether more PD is wanted. Beliefs about teaching & learning with computers.
Describe how computers are currently used in grade 7-10 mathematics classrooms. Identify factors associated with levels and forms of use (descriptive statistics, chi-square analysis of gender differences).
Routitsky & Tobin (1998) Graphics calculators
Mathematics coordinators & teachers in schools teaching VCE mathematics subjects (Victoria). Preliminary analysis based on responses from 34% of schools (165 coordinators; 900 teachers; all sectors). Follow up to non-responding schools.
School size, graphics calculator models used, type of student access (booklist, hire, ownership etc). Teacher attitudes to graphics calculator policy and use.
Describe teacher response to new policy permitting graphics calculators in examinations (descriptive statistics, chi-square analysis of differences between school types, sectors, regions).
Surveying the Technology Landscape 109
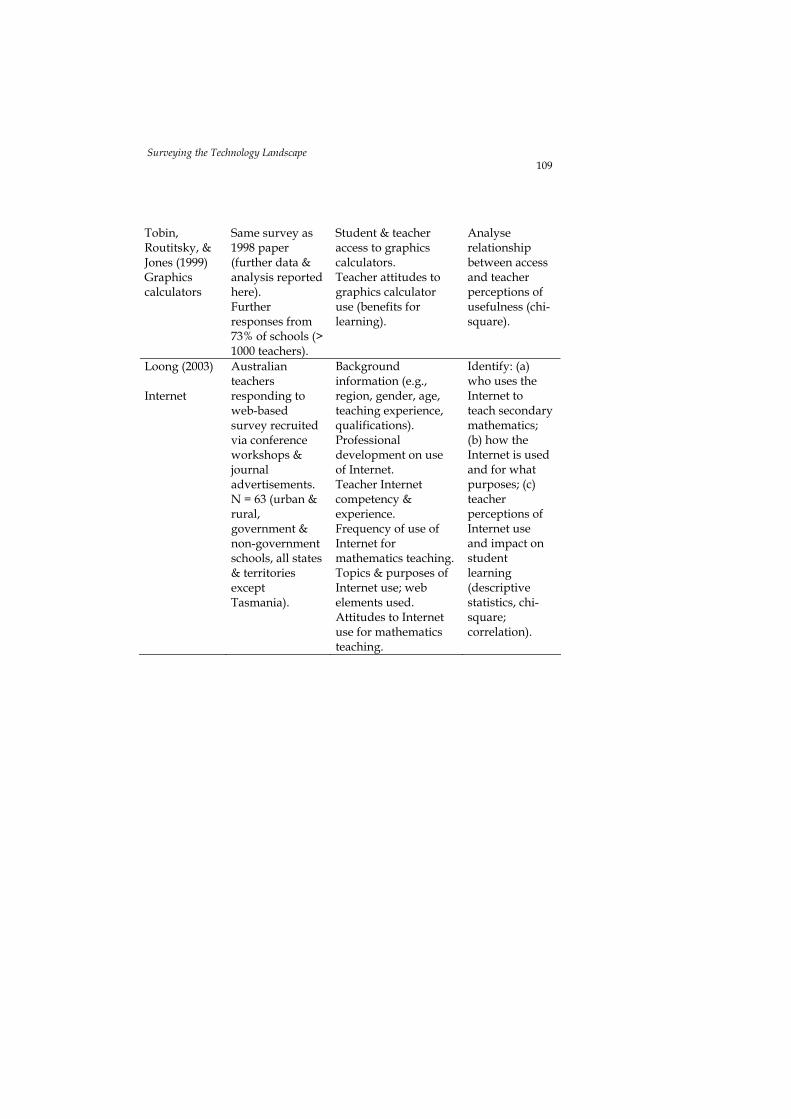
Tobin, Routitsky, & Jones (1999) Graphics calculators
Same survey as 1998 paper (further data & analysis reported here). Further responses from 73% of schools (> 1000 teachers).
Student & teacher access to graphics calculators. Teacher attitudes to graphics calculator use (benefits for learning).
Analyse relationship between access and teacher perceptions of usefulness (chi-square).
Loong (2003) Internet
Australian teachers responding to web-based survey recruited via conference workshops & journal advertisements. N = 63 (urban & rural, government & non-government schools, all states & territories except Tasmania).
Background information (e.g., region, gender, age, teaching experience, qualifications). Professional development on use of Internet. Teacher Internet competency & experience. Frequency of use of Internet for mathematics teaching. Topics & purposes of Internet use; web elements used. Attitudes to Internet use for mathematics teaching.
Identify: (a) who uses the Internet to teach secondary mathematics; (b) how the Internet is used and for what purposes; (c) teacher perceptions of Internet use and impact on student learning (descriptive statistics, chi-square; correlation).
110 Goos & Bennison
Graphics calculators began to appear in Australian secondary school classrooms in the early 1990s; however, their use by students in high stakes assessment at the end of Year 12 remained problematic for some time. In Victoria, the Board of Studies lifted the ban on students using graphics calculators in the Year 12 external examination in 1997, and Western Australia permitted their use in the corresponding examinations from 1998. The impact of this decision on schools was closely examined in the late 1990s, particularly in relation to student access and teacher beliefs about the benefits for student learning. Tobin, Routitsky, and Jones (1999; see also Routitsky & Tobin, 1998) conducted a state wide survey of Victorian secondary schools towards the end of 1997 to assess how teachers viewed graphics calculator use. The aims were to determine the level of ownership or access by students, and to investigate teacher attitudes towards and use of graphics calculators in various mathematics subjects and topics. At the time of the survey about 80% of schools had class sets of calculators, and this and other results suggested strong teacher support for the policy of introducing graphics calculators. Teachers’ perceptions of usefulness generally depended on the level of access to the calculators in classrooms.
Very little research has been conducted on Australasian mathematics teachers’ use of the Internet for instructional purposes (Goos & Cretchley, 2004). Loong (2003) carried out a small scale study that distributed a web-based survey via a conference and a journal, and drew responses from 63 secondary mathematics teachers from around Australia. The survey asked about frequency of Internet use, ways in which teachers and their students used the Internet for mathematics learning, teachers’ competency, and their professional development experiences. Respondents tended to use the Internet for finding information such as articles about research or professional issues, or as a source of data for students to analyse in mathematics lessons. No statistically significant relationships were found between use and competency, professional development, or years of teaching experience.
Survey research is useful to gain an overview of who is using technology, and how and why they are using it, especially at a time when there are new external pressures to incorporate technology into teaching practice. This was the context in which we designed and carried out the surveys of Queensland secondary school mathematics teachers that we describe below. Previous Australasian studies usually focused on documenting use of one type of technology – either computers, graphics calculators, or the Internet. We decided to investigate teachers’ use of each of these resources because our theoretical framework was not limited to a particular type of technology and all were permitted or mandated by the Queensland mathematics syllabuses introduced in 2002/2003.
Surveying the Technology Landscape 111
Research Design and Methods
Participants and Procedures All secondary schools listed in the Schools Directory of the Education Queensland website in August 2002 were sent a School Technology Survey and Teacher Technology Surveys in September 2002. Surveys were sent to the Head of the Mathematics Department in each school. The accompanying letter asked these people to complete the School Technology Survey and a Teacher Technology Survey and to distribute Teacher Technology Surveys to all teachers currently teaching mathematics in their schools. The letter also invited them to make additional copies of the survey if required. A Reply Paid envelope was enclosed for the return of the surveys. Letters to teachers asked them to complete the survey and return it via the school envelope, or individually if desired.
Instruments We designed the two surveys based on instruments used in previous Australasian studies (Table 2) and on international research on factors known to influence mathematics teachers’ use of technology (as described earlier). The School Technology Survey collected information on the mathematics subjects offered by the school, the number of teachers currently teaching mathematics, and the availability of technology. For example, respondents were asked to indicate what type of software was available for teaching mathematics, whether students had access to graphics calculators and if so whether this was via class sets, a hire scheme, or personal ownership (or some combination of these).
The Teacher Technology Survey investigated teaching practice with respect to three types of technology: computers (software packages, both general and mathematics specific), the Internet, and graphics calculators, under the general headings of Use, Access, Experience, Attitudes, and Professional Development (19 items; 18 asked for a response from the choices provided, one was open ended). The survey also collected demographic information such as gender, tertiary qualifications, years of teaching experience, and current mathematics teaching assignment.
In the section on Use, the survey asked teachers to indicate, for the classes they currently teach, how often they used computers, the Internet, graphics calculators, and graphics calculator peripherals such as screen projection units and data logging equipment. They were then asked to say how often they used technology for specified reasons (e.g., to enable difficult or time-consuming calculations; to introduce or develop a concept), and to identify the mathematics topics for which they used technology (e.g., algebra, calculus, geometry, statistics, etc). The section about Access asked
112 Goos & Bennison
how often students were allowed to use computers and graphics calculators for assessment tasks, and how often teachers were able to get access to computer laboratories and class sets of graphics calculators when they wanted them.
Items in the section on Experience with technology sought information on how long teachers had been using computers, the Internet, and graphics calculators in teaching mathematics and how confident they felt in using these forms of technology. Attitudes towards technology were investigated by having teachers indicate the extent to which they agreed with statements about advantages and disadvantages using a Likert-type scale based on scores of 1 (Strongly Disagree) to 5 (Strongly agree), with a score of 3 corresponding to Undecided.
Teachers were asked about their Professional Development experiences with computers, the Internet, and graphics calculators in mathematics teaching: whether they have had professional development in these areas, how it was delivered, and how useful they found it. They were also invited to describe what they saw as their current need for professional development in using technology to teach mathematics (open response).
Both instruments were piloted with a group of 10 secondary school mathematics teachers, some of whom were Heads of Department. Many of these teachers also distributed copies of the Teacher Technology Surveys to colleagues in their schools. Pilot respondents considered that the items were generally clearly worded and the time taken to complete the surveys was reasonable. The surveys were then distributed to schools as described previously.
Response Rate Surveys were sent to all 456 secondary schools in Queensland (257 government, 199 non-government) in all 33 Education Districts. Altogether 89 School Technology Surveys were returned (20% response rate), with the same response rate for government and non-government schools. There were 485 Teacher Technology Surveys returned by teachers in 127 schools (28% response rate). Again, the same response rate was recorded for government and non-government schools (283 and 203 teachers respectively). Responses were received from schools in all Education Districts except Chinchilla and Torres Strait Islands. The response rate is acceptable for a mail survey with no pre-notice or reminder follow up to non-respondents (Kaplowitz & Hadlock, 2004) and comparable to that achieved by Thomas (1996) in a similar census survey of New Zealand secondary schools. Nevertheless, although the distribution of responses by education sector and geographical region gives us confidence that the sample is representative of schools and teachers throughout the state, given
Surveying the Technology Landscape 113 the nature of the surveys it is possible that teachers who responded were more interested in technology than those who did not respond.
Results We begin our discussion of the findings by describing the technology context in the sample of schools and characteristics of the teachers who returned surveys in terms of gender, current teaching assignment, and experience. Teacher attitudes towards technology are summarised, together with information on their technology-related professional development experiences and levels of confidence in using computers, graphics calculators, and the Internet for teaching mathematics. We then report on how often teachers said they used each type of technology, by year level and mathematics subject, and examine factors related to technology use.
School Technology Contexts As the year in which the data were collected was the first in which the new Senior Mathematics syllabuses were implemented, it is useful to look at the number of Year 11 Mathematics B and C classes in each school, since these are the subjects for which use of higher technologies was now mandated. A total of 82 out of the 89 schools in the sample offered Year 11 Mathematics B, with most of these schools (86.5%) having between one and four classes. Only 68 schools offered Year 11 Mathematics C, and almost all of these (65 schools) had only one class. As students in these classes must also study Mathematics B, the majority of schools returning surveys had three or more Year 11 classes needing access to computers or graphics calculators in order to satisfy syllabus requirements. (In subsequent years this figure would increase as the syllabus moved into full implementation in both Years 11 and 12.)
The range of software available in schools that responded to the survey was limited. Spreadsheet programs were almost universally available (82 schools, 97.6%); however, fewer than two-thirds of schools had access to graphing software and there was even more limited access to other mathematics specific software such as dynamic geometry (24 schools, 28.6%), statistical programs (15 schools, 17.9%), and computer algebra (15 schools, 17.9%) programs.
Most schools reported using graphics calculators (77, 86.5%); however, student access was more often than not via class sets (65 schools, 73.0%) rather than hire schemes (28 schools, 31.5%) or personal ownership (22 schools, 24.7%). Two-thirds of teachers using class sets reported having good access, saying they could obtain calculators often or always when needed. It is clear from these figures that schools were using a combination of approaches to providing students with graphics calculators. Nevertheless it is of some concern that significant numbers of students in these schools
114 Goos & Bennison
did not have continuous personal access to this inexpensive, portable technology, especially when one-third of teacher respondents stated that they could never or only rarely get access to computer laboratories for their mathematics classes when they wanted to.
Teacher Characteristics Of the 485 teachers who returned surveys, 55.2% were male and 44.8% female. Around half were teaching a junior secondary class, 30-35% a senior secondary Mathematics B class, and 13-14% a Mathematics C class. Thus at least one-third of respondents taught classes for which higher technologies were now a mandatory part of learning and assessment experiences, as prescribed by the Senior Mathematics B and C syllabuses. Most (79.4%) respondents had specialised in mathematics in their pre-service teacher education program, with the remainder having no formal qualifications for teaching secondary mathematics (including 4.3% who had a primary school teaching qualification). Participants were asked to state the number of years they had been teaching. More than half (57.3%) had been teaching for more than 15 years and probably would not have been introduced to educational uses of computers in their pre-service programs, and the great majority who had been those teaching for more than 5 years (84.6%) would not have learned how to use graphics calculators before starting their teaching careers. This places a premium on effective professional development that focuses not only on the procedural aspects of learning to use technology, but also on how to integrate technology into classroom practice in ways that enhance students’ mathematics learning.
There were differences in teachers’ levels of experience in using the three types of technology to teach mathematics. When asked to indicate for how long they had been using technology in teaching mathematics, only 12.3% said they had been using the Internet with mathematics classes for more than five years, while 26.6% had been using graphics calculators and 42.7% computers for a similar period of time.
Teacher Attitudes Teachers’ responses to statements about the advantages and disadvantages of using technology are summarised in Tables 3 and 4.
Surveying the Technology Landscape 115
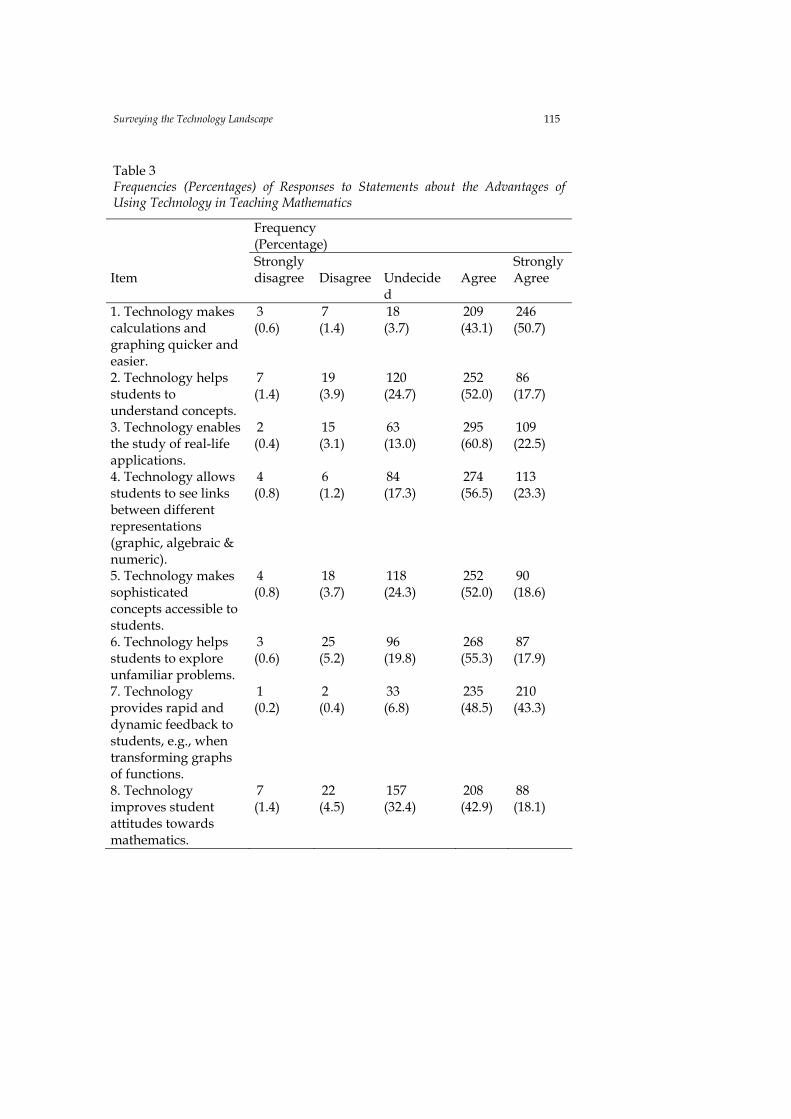
Table 3 Frequencies (Percentages) of Responses to Statements about the Advantages of Using Technology in Teaching Mathematics
Frequency (Percentage)
Item
Strongly disagree
Disagree
Undecided
Agree
Strongly Agree
1. Technology makes calculations and graphing quicker and easier.
3 (0.6)
7 (1.4)
18 (3.7)
209 (43.1)
246 (50.7)
2. Technology helps students to understand concepts.
7 (1.4)
19 (3.9)
120 (24.7)
252 (52.0)
86 (17.7)
3. Technology enables the study of real-life applications.
2 (0.4)
15 (3.1)
63 (13.0)
295 (60.8)
109 (22.5)
4. Technology allows students to see links between different representations (graphic, algebraic & numeric).
4 (0.8)
6 (1.2)
84 (17.3)
274 (56.5)
113 (23.3)
5. Technology makes sophisticated concepts accessible to students.
4 (0.8)
18 (3.7)
118 (24.3)
252 (52.0)
90 (18.6)
6. Technology helps students to explore unfamiliar problems.
3 (0.6)
25 (5.2)
96 (19.8)
268 (55.3)
87 (17.9)
7. Technology provides rapid and dynamic feedback to students, e.g., when transforming graphs of functions.
1 (0.2)
2 (0.4)
33 (6.8)
235 (48.5)
210 (43.3)
8. Technology improves student attitudes towards mathematics.
7 (1.4)
22 (4.5)
157 (32.4)
208 (42.9)
88 (18.1)

116 Goos & Bennison
The responses of those who returned the survey indicated that they were convinced of the advantages of technology in performing calculations more quickly and easily (Item 1, 94% Agree or Strongly Agree) and in providing dynamic feedback to students (Item 7, 93% Agree or Strongly Agree). To a lesser extent teachers also supported the notion that technology enables the study of real life applications (Item 3, 83% Agree or Strongly Agree) and allows students to link graphical, algebraic, and numeric representations (Item 4, 80% Agree or Strongly Agree). However a substantial proportion of teachers was unsure whether technology erodes students’ basic mathematical skills (Item 14, 26.8%). There was also uncertainty as to whether technology can help students to learn concepts (Item 2, 25% Undecided; Item 5, 24% Undecided), explore unfamiliar problems (Item 6, 20% Undecided), or improve student attitudes towards mathematics (Item 8, 32% Undecided). Most teachers who responded to the survey indicated that there was a lack of time to investigate the potential of using technology (Item 10, 83% Agree or Strongly Agree) and this as well as difficulty in accessing technology (see below) may be the reason for their uncertainty. Many respondents felt that it is time consuming to teach students how to use technology (Item 16, 36% Agree or Strongly Agree), and it was interesting to note that some (9 teachers) qualified this response by adding that it was worth spending the time to do this. In fact, a greater proportion (45.4%) disagreed with this statement.
Table 4 Frequency (Percentages) of Responses to Statements about the Disadvantages of Using Technology in Teaching Mathematics
Frequency (Percentage)
Item
Strongly disagree
Disagree
Undecided
Agree
Strongly Agree
9. It is difficult to get access to computer laboratories.
17 (3.5)
94 (19.4)
37 (7.6)
194 (40.0)
135 (27.8)
10. There is not enough teacher time to investigate the potential of using technology.
8 (1.6)
36 (7.4)
32 (6.6)
223 (46.0)
180 (37.1)
11. There are not enough teaching resources, e.g., software.
14 (2.9)
109 (22.5)
119 (24.5)
157 (32.4)
77 (15.9)
12. There are not 105 186 65 89 32
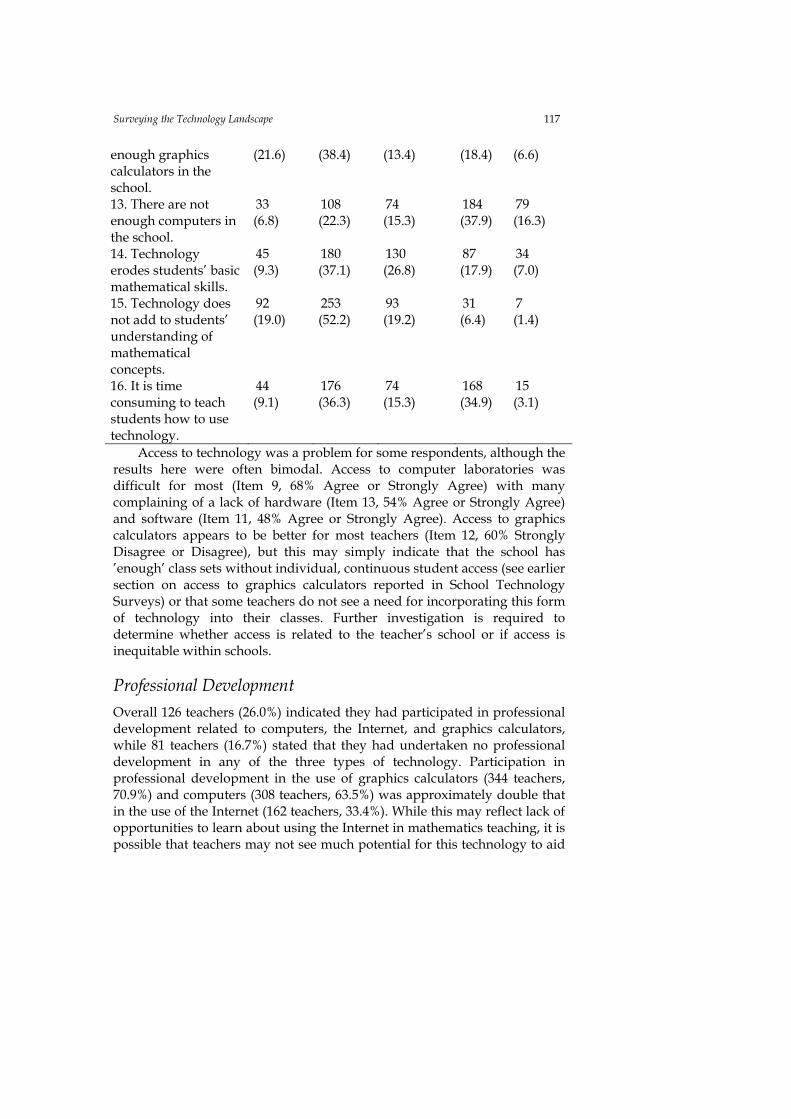
Surveying the Technology Landscape 117 enough graphics calculators in the school.
(21.6) (38.4) (13.4) (18.4) (6.6)
13. There are not enough computers in the school.
33 (6.8)
108 (22.3)
74 (15.3)
184 (37.9)
79 (16.3)
14. Technology erodes students’ basic mathematical skills.
45 (9.3)
180 (37.1)
130 (26.8)
87 (17.9)
34 (7.0)
15. Technology does not add to students’ understanding of mathematical concepts.
92 (19.0)
253 (52.2)
93 (19.2)
31 (6.4)
7 (1.4)
16. It is time consuming to teach students how to use technology.
44 (9.1)
176 (36.3)
74 (15.3)
168 (34.9)
15 (3.1)
Access to technology was a problem for some respondents, although the results here were often bimodal. Access to computer laboratories was difficult for most (Item 9, 68% Agree or Strongly Agree) with many complaining of a lack of hardware (Item 13, 54% Agree or Strongly Agree) and software (Item 11, 48% Agree or Strongly Agree). Access to graphics calculators appears to be better for most teachers (Item 12, 60% Strongly Disagree or Disagree), but this may simply indicate that the school has ’enough’ class sets without individual, continuous student access (see earlier section on access to graphics calculators reported in School Technology Surveys) or that some teachers do not see a need for incorporating this form of technology into their classes. Further investigation is required to determine whether access is related to the teacher’s school or if access is inequitable within schools.
Professional Development Overall 126 teachers (26.0%) indicated they had participated in professional development related to computers, the Internet, and graphics calculators, while 81 teachers (16.7%) stated that they had undertaken no professional development in any of the three types of technology. Participation in professional development in the use of graphics calculators (344 teachers, 70.9%) and computers (308 teachers, 63.5%) was approximately double that in the use of the Internet (162 teachers, 33.4%). While this may reflect lack of opportunities to learn about using the Internet in mathematics teaching, it is possible that teachers may not see much potential for this technology to aid

118 Goos & Bennison
mathematics learning, or they may feel adequately equipped to use the Internet without explicit instruction.
Responses to the open ended question “What do you see as your current needs for professional development in this area?” were offered by 392 teachers (81% of the sample). A content analysis resulted in identification of nine response categories. Three of these categories referred to the type of technology (computers; Internet; graphics calculators), one to a perceived lack of any need for PD, two to constraints that detracted from the value of PD (time; access), and three to the desired focus for PD (how to use specific software or hardware; how to meaningfully integrate technology into mathematics learning experiences; how to design assessment tasks that meaningfully integrate technology). Because teachers were free to write whatever they wanted to, the content of their responses could fall into more than one category.
Teachers who were specific about the type of technology for which they needed professional development mentioned computers (144; 36.7% of those who responded to this question; 29.7% of the sample) and graphics calculators (117; 29.8% of those who responded to this question; 24.1% of the sample) about twice as often as the Internet (65; 16.6% of those who responded to this question; 13.4% of the sample).
A small proportion (29; 7% of those who responded to this question; 6% of the sample) stated that they required no professional development. Usually this was because they felt competent with technology, but some teachers in this category also explained that their real needs were related to access and time. For example, one teacher pointed out that it was “pointless to do PD without having regular access to a computer lab and appropriate software.” Time was an issue for 20% of the teachers who responded to this question: Their most pressing need was more time to develop resources, plan lessons and curriculum units, and explore and evaluate the technology, preferably in collaboration with colleagues. Many expressed the desire to simply “play” with the technology to gain a better understanding of its potential uses.
Access to computers appears to be a significant problem for many teachers (79; 12.0% of those who responded to this question; 9.7% of the sample), both for classroom and personal use. This was clearly expressed by one teacher who wrote: “I am in a staffroom of fourteen teachers and four aides who share two computers. Only one is attached to a printer or the net. Net access is intermittent. Two labs of 20 computers are fully taken up by computer studies etc.”
The most striking aspect of responses to this question was the large number of teachers (130; 33% of those who responded to this question; 27% of the sample,) who wanted professional development on how to effectively integrate technology into the teaching and assessment of mathematics, especially in the context of the syllabus or school work program. Although
Surveying the Technology Landscape 119 there were a few teachers who needed basic instruction on how to use hardware or software, most were interested in learning about planning “activities that combine technology with mathematical concepts” in order to meaningfully incorporate technology into lessons.
Confidence in Using Technology to Teach Mathematics The majority of teachers who responded to the survey felt reasonably confident in using technology to teach mathematics. More teachers expressed lack of confidence in using graphics calculators (28.0%) than the Internet (23.9%) or computers (18.8%). Teachers may be more comfortable using computer-based applications because they are accustomed to using computers in other subject areas, for planning and administrative tasks, and in their daily lives outside school; on the other hand, graphics calculators are used specifically for mathematics teaching and it takes time and effort to learn how to use them effectively. This observation may explain respondents’ greater uptake of professional development on the use of graphics calculators for mathematics teaching than for computers and the Internet (see above); although uptake may also reflect availability of professional development targeting the various types of technology.
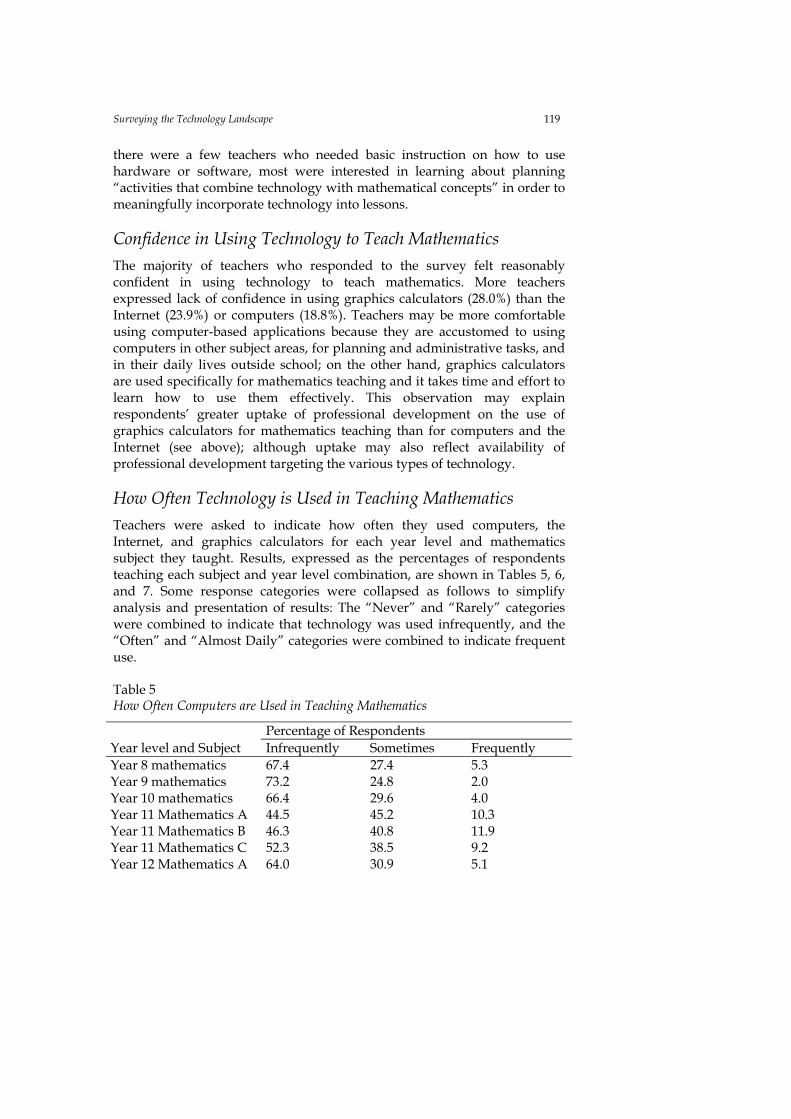
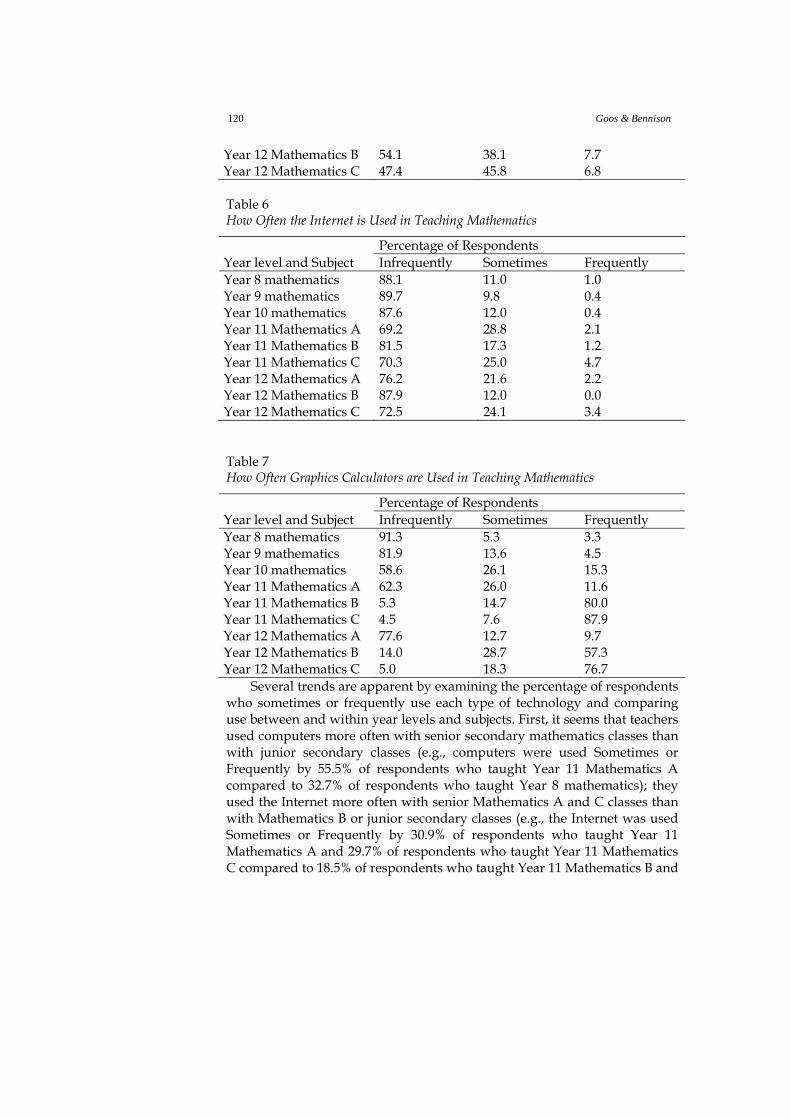
How Often Technology is Used in Teaching Mathematics Teachers were asked to indicate how often they used computers, the Internet, and graphics calculators for each year level and mathematics subject they taught. Results, expressed as the percentages of respondents teaching each subject and year level combination, are shown in Tables 5, 6, and 7. Some response categories were collapsed as follows to simplify analysis and presentation of results: The “Never” and “Rarely” categories were combined to indicate that technology was used infrequently, and the “Often” and “Almost Daily” categories were combined to indicate frequent use.
Table 5 How Often Computers are Used in Teaching Mathematics
Percentage of Respondents Year level and Subject Infrequently Sometimes Frequently Year 8 mathematics 67.4 27.4 5.3 Year 9 mathematics 73.2 24.8 2.0 Year 10 mathematics 66.4 29.6 4.0 Year 11 Mathematics A 44.5 45.2 10.3 Year 11 Mathematics B 46.3 40.8 11.9 Year 11 Mathematics C 52.3 38.5 9.2 Year 12 Mathematics A 64.0 30.9 5.1
120 Goos & Bennison
Year 12 Mathematics B 54.1 38.1 7.7 Year 12 Mathematics C 47.4 45.8 6.8
Table 6 How Often the Internet is Used in Teaching Mathematics
Percentage of Respondents Year level and Subject Infrequently Sometimes Frequently Year 8 mathematics 88.1 11.0 1.0 Year 9 mathematics 89.7 9.8 0.4 Year 10 mathematics 87.6 12.0 0.4 Year 11 Mathematics A 69.2 28.8 2.1 Year 11 Mathematics B 81.5 17.3 1.2 Year 11 Mathematics C 70.3 25.0 4.7 Year 12 Mathematics A 76.2 21.6 2.2 Year 12 Mathematics B 87.9 12.0 0.0 Year 12 Mathematics C 72.5 24.1 3.4
Table 7 How Often Graphics Calculators are Used in Teaching Mathematics
Percentage of Respondents Year level and Subject Infrequently Sometimes Frequently Year 8 mathematics 91.3 5.3 3.3 Year 9 mathematics 81.9 13.6 4.5 Year 10 mathematics 58.6 26.1 15.3 Year 11 Mathematics A 62.3 26.0 11.6 Year 11 Mathematics B 5.3 14.7 80.0 Year 11 Mathematics C 4.5 7.6 87.9 Year 12 Mathematics A 77.6 12.7 9.7 Year 12 Mathematics B 14.0 28.7 57.3 Year 12 Mathematics C 5.0 18.3 76.7
Several trends are apparent by examining the percentage of respondents who sometimes or frequently use each type of technology and comparing use between and within year levels and subjects. First, it seems that teachers used computers more often with senior secondary mathematics classes than with junior secondary classes (e.g., computers were used Sometimes or Frequently by 55.5% of respondents who taught Year 11 Mathematics A compared to 32.7% of respondents who taught Year 8 mathematics); they used the Internet more often with senior Mathematics A and C classes than with Mathematics B or junior secondary classes (e.g., the Internet was used Sometimes or Frequently by 30.9% of respondents who taught Year 11 Mathematics A and 29.7% of respondents who taught Year 11 Mathematics C compared to 18.5% of respondents who taught Year 11 Mathematics B and

Surveying the Technology Landscape 121 12.0% of respondents who taught Year 8 mathematics); and they used graphics calculators more often with senior Mathematics B and C classes than with Mathematics A or junior secondary classes (e.g., 94.7% of respondents who taught Year 11 Mathematics B used graphics calculators Sometimes or Frequently compared to 37.6% of respondents who taught Year 11 Mathematics A and 8.6% who taught Year 8 mathematics).
Second, computers were generally the most commonly used technology in the junior secondary years (although graphics calculators are being introduced in many Year 10 classes) and in senior Mathematics A (e.g., 32.7% of respondents who taught Year 8 mathematics used computers Sometimes or Frequently while only 8.6% used graphics calculators Sometimes or Frequently, results for those who taught Year 11 Mathematics A were 55.5% and 37.6% respectively), while graphics calculators were the dominant technology in Mathematics B and C (e.g., in Year 11 Mathematics B graphics calculators were used Sometimes or Frequently by 94.7% of respondents while computers were used Sometimes or Frequently by only 52.7% of respondents). These trends may reflect the allocation of scarce resources, in the form of access to computer laboratories and graphics calculators, to senior secondary classes that are deemed to have priority because of syllabus requirements. It is also possible that graphics calculators are most useful for the algebra/calculus/statistics topics taught in Mathematics B and C while computers and the Internet are most useful for the geometry/statistics/financial topics taught in Mathematics A.
A third trend is that there was generally more frequent use of technology in Year 11 than Year 12 mathematics classes (e.g., graphics calculators were used Frequently by 80.0% of respondents who taught Year 11 Mathematics B classes but by only 57.3% of respondents who taught Year 12 Mathematics B). A possible reason for this trend in Mathematics B and Mathematics C is that the revised syllabuses, which mandated technology use, were being implemented only in Year 11 at the time the survey was completed.
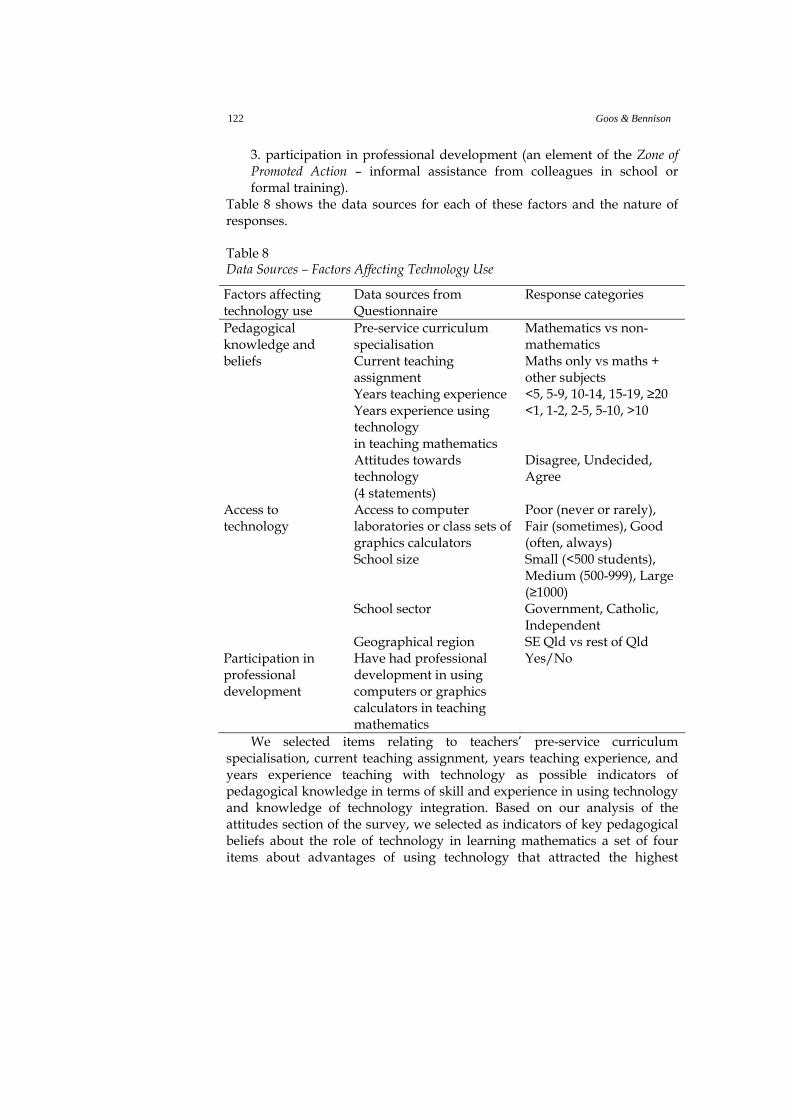
Factors Related to Technology Use in Mathematics Teaching Drawing on our zone theoretical framework, we investigated possible relationships between mathematics teachers’ use of technology and three sets of factors known to affect this use:
1. pedagogical knowledge and beliefs (elements of the Zone of Proximal Development – skill and previous experience in using technology, knowledge of how to integrate technology into mathematics teaching, beliefs about the role of technology in learning mathematics); 2. access to hardware and software (an element of the Zone of Free Movement – availability of sufficient technology resources);
122 Goos & Bennison
3. participation in professional development (an element of the Zone of Promoted Action – informal assistance from colleagues in school or formal training).
Table 8 shows the data sources for each of these factors and the nature of responses.
Table 8 Data Sources – Factors Affecting Technology Use
Factors affecting technology use
Data sources from Questionnaire
Response categories
Pedagogical knowledge and beliefs
Pre-service curriculum specialisation Current teaching assignment Years teaching experience Years experience using technology in teaching mathematics Attitudes towards technology (4 statements)
Mathematics vs non-mathematics Maths only vs maths + other subjects <5, 5-9, 10-14, 15-19, ≥20 <1, 1-2, 2-5, 5-10, >10 Disagree, Undecided, Agree
Access to technology
Access to computer laboratories or class sets of graphics calculators School size School sector Geographical region
Poor (never or rarely), Fair (sometimes), Good (often, always) Small (<500 students), Medium (500-999), Large (≥1000) Government, Catholic, Independent SE Qld vs rest of Qld
Participation in professional development
Have had professional development in using computers or graphics calculators in teaching mathematics
Yes/No
We selected items relating to teachers’ pre-service curriculum specialisation, current teaching assignment, years teaching experience, and years experience teaching with technology as possible indicators of pedagogical knowledge in terms of skill and experience in using technology and knowledge of technology integration. Based on our analysis of the attitudes section of the survey, we selected as indicators of key pedagogical beliefs about the role of technology in learning mathematics a set of four items about advantages of using technology that attracted the highest

Surveying the Technology Landscape 123 proportion of Uncertain responses from teachers. We included items where teachers reported their levels of access to computer laboratories and class sets of graphics calculators, together with other indicators of the institutional context that may indirectly influence access, such as school size, location, and education sector. Participation in professional development was indicated by items asking teachers whether they had experienced professional development on how to use computers, the Internet, and graphics calculators to teach mathematics. Relationships between frequency of use and factors affecting use were analysed by conducting chi-square tests of the frequency distributions obtained by cross-tabulating responses to items measuring how often technology is used with responses to the three sets of items listed in Table 8.
We decided to focus our analysis on technology use in Year 11 mathematics and Year 8 mathematics. Year 11 mathematics was chosen because it was this group of students with whom teachers were implementing the revised syllabuses, with their technology requirements, for the first time; Year 8 mathematics was chosen because it is students’ introduction to secondary school mathematics. Where questionnaire items referred to particular types of technology we selected responses relating to use of graphics calculators in Year 11 Mathematics B and computers in Year 11 Mathematics A and Year 8 mathematics, as these were the most commonly used technologies respectively (as explained above). Use of technology in Mathematics C classes was not included in this analysis due to the small enrolments in this subject compared with Mathematics A and B (refer to information provided in the section on school technology contexts). Results are presented in Tables 9 and 10.
Table 9 Analysis of Relationship between Graphics Calculator Use (Year 11 Mathematics B), Pedagogical Knowledge and Beliefs, Access, and Professional Development
Factors affecting use How often graphics calculators used
Pedagogical knowledge and beliefs Pre-service curriculum specialisation χ2 (2) = 2.38, p = 0.305 Current teaching assignment χ2 (2) = 10.61, *p = 0.050 Years teaching experience χ2 (8) = 12.34, p = 0.137 Years experience using graphics calculators in teaching mathematics
χ2 (8) = 7.03, p = 0.533
Attitudes towards technology: Technology helps students to understand concepts. Technology makes sophisticated concepts accessible to students.
χ2 (4) = 15.42, *p = 0.004 χ2 (4) = 9.18, p = 0.057

124 Goos & Bennison
Technology helps students to explore unfamiliar problems. Technology improves student attitudes towards mathematics.
χ2 (4) = 13.05, *p = 0.011 χ2 (4) = 7.2, p = 0.124
Access to technology Access to class sets of graphics calculators χ2 (4) = 64.52, *p < 0.001 School size χ2 (4) = 4.46, p = 0.334 School sector χ2 (4) = 12.93, *p = 0.012 Geographical region χ2 (2) = 3.63, p = 0.163 Professional development PD on use of graphics calculators in teaching mathematics
χ2 (2) = 13.57, *p = 0.001
For graphics calculators, the hypothesis of independence between frequency of use and factors affecting use was rejected for factors related to current teaching assignment, attitudes towards technology (understanding concepts, exploring unfamiliar problems), access, school sector, and professional development. Inspection of the relevant contingency tables comparing observed with expected cell proportions suggested the following relationships. Teachers who frequently used graphics calculators in Year 11 Mathematics B lessons were more likely than others to be teaching only mathematics, to have good access to class sets (i.e., could obtain them often or always when needed), to have participated in professional development on the use of graphics calculators in teaching mathematics, and to be working in an independent school rather than a government or Catholic school. These teachers were also more likely than infrequent users to agree with statements about technology supporting concept learning and exploration of unfamiliar problems. It is not clear whether frequent use of graphics calculators in the classroom led teachers to develop these beliefs, or teachers already convinced of the benefits of technology simply embraced graphics calculators when they became available.
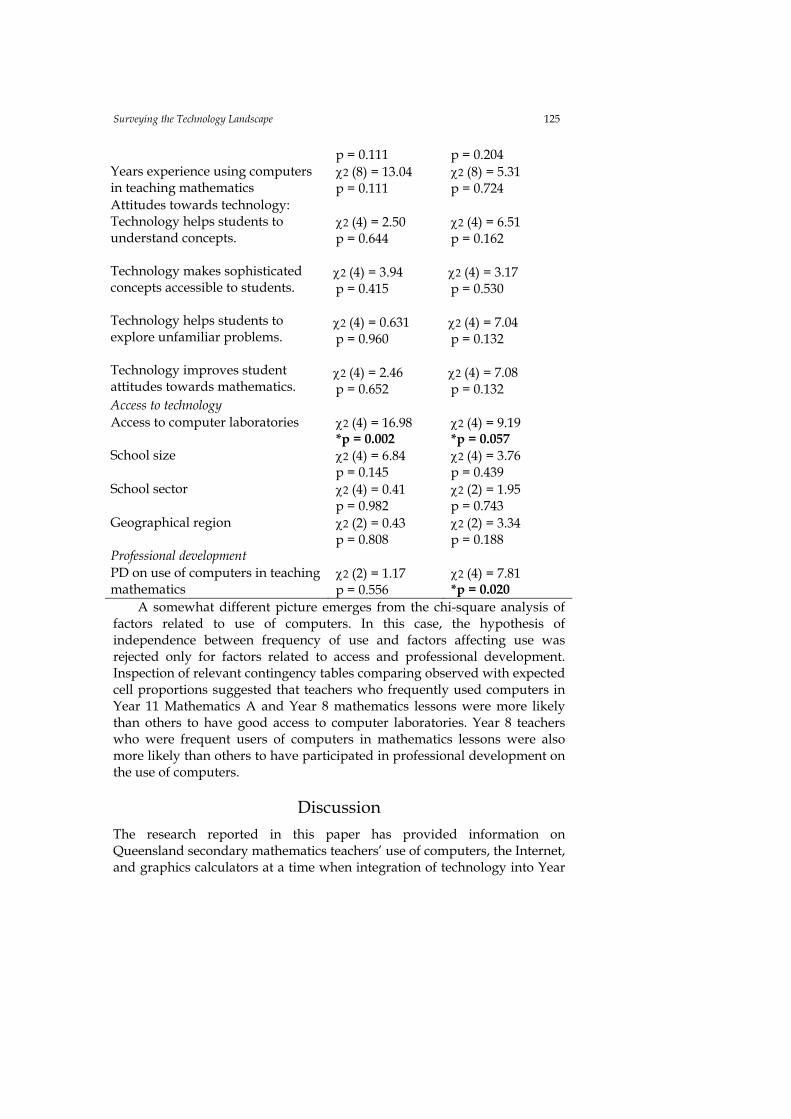
Table 10 Analysis of Relationship between Computer Use (Year 11 Mathematics A and Year 8 mathematics), Pedagogical Knowledge and Beliefs, Access, and Professional Development
How often computers used Factors affecting use Year 11 Maths A Year 8 mathematics
Pedagogical knowledge and beliefs Pre-service curriculum specialisation
χ2 (2) = 2.51 p = 0.285
χ2 (2) = 0.104 p = 0.949
Current teaching assignment χ2 (2) = 0.362 p = 0.834
χ2 (2) = 0.688 p = 0.709
Years teaching experience χ2 (8) = 13.04 χ2 (8) = 10.95
Surveying the Technology Landscape 125
p = 0.111 p = 0.204 Years experience using computers in teaching mathematics
χ2 (8) = 13.04 p = 0.111
χ2 (8) = 5.31 p = 0.724
Attitudes towards technology: Technology helps students to understand concepts. Technology makes sophisticated concepts accessible to students. Technology helps students to explore unfamiliar problems. Technology improves student attitudes towards mathematics.
χ2 (4) = 2.50 p = 0.644 χ2 (4) = 3.94 p = 0.415 χ2 (4) = 0.631 p = 0.960 χ2 (4) = 2.46 p = 0.652
χ2 (4) = 6.51 p = 0.162 χ2 (4) = 3.17 p = 0.530 χ2 (4) = 7.04 p = 0.132 χ2 (4) = 7.08 p = 0.132
Access to technology Access to computer laboratories χ2 (4) = 16.98
*p = 0.002 χ2 (4) = 9.19 *p = 0.057
School size χ2 (4) = 6.84 p = 0.145
χ2 (4) = 3.76 p = 0.439
School sector χ2 (4) = 0.41 p = 0.982
χ2 (2) = 1.95 p = 0.743
Geographical region χ2 (2) = 0.43 p = 0.808
χ2 (2) = 3.34 p = 0.188
Professional development PD on use of computers in teaching mathematics
χ2 (2) = 1.17 p = 0.556
χ2 (4) = 7.81 *p = 0.020
A somewhat different picture emerges from the chi-square analysis of factors related to use of computers. In this case, the hypothesis of independence between frequency of use and factors affecting use was rejected only for factors related to access and professional development. Inspection of relevant contingency tables comparing observed with expected cell proportions suggested that teachers who frequently used computers in Year 11 Mathematics A and Year 8 mathematics lessons were more likely than others to have good access to computer laboratories. Year 8 teachers who were frequent users of computers in mathematics lessons were also more likely than others to have participated in professional development on the use of computers.
Discussion The research reported in this paper has provided information on Queensland secondary mathematics teachers’ use of computers, the Internet, and graphics calculators at a time when integration of technology into Year

126 Goos & Bennison
11 and 12 mathematics was becoming mandatory. The findings are generally consistent with results of similar survey research carried out in Australia and New Zealand.
One set of findings relates to teacher characteristics and school contexts. Although schools appeared to be providing access to software and graphics calculators, simply having these resources available does not mean that teachers and students are able to use them whenever appropriate or necessary. At the time of the survey, fewer than one-third of schools operated graphics calculator hire schemes, and fewer than one-quarter required students to purchase their own calculators. Also, as Thomas (2006) found in his survey of New Zealand teachers, many respondents to our survey indicated that it was difficult to book their classes into computer laboratories because of the high demand from other subject areas. However, as Cuban et al. (2001) and Wallace (2004) pointed out, it is a mistake to assume that simply supplying schools with hardware and software will increase teachers’ use of technology and encourage more innovative teaching approaches. Teachers who responded to our survey cited lack of time and meaningful professional development as major obstacles. Although in general they supported some potential benefits of technology for students’ mathematics learning, many were unsure about whether its use helped students to explore mathematical concepts or unfamiliar problems (cf Forgasz, 2002; Thomas, 2006). It was not surprising, then, to find that the most pressing need for professional development identified by teachers centred on how to integrate technology into classroom teaching in ways that improve students’ understanding of mathematical concepts.
A second set of findings is concerned with how often teachers responding to our survey use these technologies and how confident they feel in doing so. In the absence of any technology-related syllabus requirements for junior secondary mathematics, it was perhaps not surprising to find that each type of technology was used more frequently in Years 11 and 12 than in Years 8, 9, and 10. Graphics calculators were a priority for senior Mathematics B and C classes, reflecting the impact of syllabus and assessment changes that were previously experienced in Victoria with removal of the ban on graphics calculator use in external examinations (Routitsky & Tobin, 1998; Tobin, Routitsky, & Jones, 1999). Computers were the most commonly used type of technology in Mathematics A, a subject usually taken by students who are not intending to study mathematics at university, and with junior mathematics classes. However, teachers found it difficult to gain access to computer laboratories for mathematics classes and this seems to disadvantage Mathematics A students in particular: Around one half of teachers reported that they never or rarely used computers with Year 11 and 12 Mathematics A classes, but only 5 to 15 % said they never or rarely used graphics calculators with senior Mathematics B and C classes. A substantial majority of respondents

Surveying the Technology Landscape 127 felt confident or very confident in teaching mathematics with these three types of technology, but more so with computers (cf Forgasz, 2002) than the Internet or graphics calculators.
A third set of findings is concerned with factors influencing technology use. We applied a zone theoretical framework (based on the work of Valsiner, 1997) to classify factors identified in previous research in terms of teachers’ Zone of Proximal Development (indicated by pedagogical knowledge and beliefs), Zone of Free Movement (representing constraints in the school environment, such as access to technology), and Zone of Promoted Action (participation in professional development), and we found some evidence of similar influences in our own study. Current teaching assignment (a possible indicator of pedagogical knowledge) and beliefs about technology helping students to understand concepts and explore unfamiliar problems were related to graphics calculator use in Year 11 Mathematics B. Access was important in relation to how often teachers used computers (for Year 11 Mathematics A and Year 8 mathematics) and graphics calculators (for Year 11 Mathematics B) with their classes; in fact, for teachers of Year 11 Mathematics A this was the only factor linked to frequency of use of computers. Relevant professional development was related to use of graphics calculators in Year 11 Mathematics B and use of computers by teachers of Year 8 mathematics. These interpretations need to be treated with caution as our survey did not directly measure pedagogical knowledge, teachers may have had varying views on the meaning of response options to some items (Never, Rarely, Sometimes, Often, Almost Daily), and the data we gathered relied on self-report from teachers in only 28% of Queensland secondary schools. Nevertheless, the findings are consistent with teacher case studies we have conducted in related research (Galbraith & Goos, 2003; Goos, 2005a, 2005b) and also with previous survey research that reported relationships between computer and graphics calculator use and teacher access, beliefs about the benefits of technology for students’ learning, and participation in professional development (Forgasz, 2002; Tobin et al., 1999; Thomas, 1996, 2006).
The results also lead us to ask how mathematics teachers might best be supported in using technology effectively with their classes, especially when implementing senior syllabuses that require technology to be used in learning and assessment tasks. A proactive approach to increasing teachers’ comfort with and use of technology needs to address issues of access to computers and graphics calculators, but this alone is unlikely to succeed without appropriate professional development. Teachers’ own perceptions of their professional development needs in this area centred on finding enough time and getting enough help from colleagues so they could explore planning and pedagogy to integrate technology into their everyday classroom practice. These findings have clear implications for resourcing of schools with respect to equipment and in-service education, and point to the
128 Goos & Bennison
need for further research that investigates how and under what conditions teachers learn to effectively integrate technology into their practice.
Acknowledgment. This research was funded by a Discovery Grant from the Australian Research Council. Earlier versions of this paper were presented at the 2004 and 2006 annual conferences of the Australian Association for Research in Education.
References Arnold, S. (2004). Mathematics education for the third millennium: Visions of a
future for handheld classroom technology. In I. Putt, R. Faragher, & M. McLean (Eds.), Mathematics education for the third millennium: Towards 2010 (Proceedings of the 27th annual conference of the Mathematics Education Research Group of Australasia, pp. 16-28). Sydney: MERGA.
Australian Association of Mathematics Teachers (1996). Statement on the use of calculators and computers for mathematics in Australian schools. Retrieved 14 September 2007 from http://www.aamt.edu.au/documentation/statements
Australian Education Council (1990). A national statement on mathematics for Australian schools. Melbourne: Curriculum Council.
Churchhouse, R. F., Cornu, B., Howson, A. G., Kahane, J. P., van Lint, J. H., Pluvinage, F. (Eds.) (1986). The influence of computers and informatics on mathematics and its teaching. ICMI Study Series (Vol. 1). Cambridge, UK: Cambridge University Press.
Cuban, L., Kirkpatrick, H., & Peck, C. (2001). High access and low use of technologies in high school classrooms: Explaining the apparent paradox. American Educational Research Journal, 38(4), 813-834.
Fine, A. E., & Fleener, M. J. (1994). Calculators as instructional tools: Perceptions of three preservice teachers. Journal of Computers in Mathematics and Science Teaching, 13(1), 83-100.
Forgasz, H. (2002). Teachers and computers for secondary mathematics. Education and Information Technology, 7(2), 111-125.
Forgasz, H., & Prince, N. (2001). Computers for secondary mathematics: Who uses them and how? Proceedings of the 2001 annual conference of the Australian Association for Research in Education, Fremantle, WA. Retrieved 10 June 2003 from http://www.aare.edu.au/01pap/for01109.htm.
Forster, P., Flynn, P., Frid, S., & Sparrow, L. (2004). Calculators and computer algebra systems. In B. Perry, G. Anthony, & C. Diezmann (Eds.), Research in mathematics education in Australasia 2000-2003 (pp. 313-336). Flaxton, Qld: Post Pressed.
Galbraith, P., & Goos, M. (2003). From description to analysis in technology aided teaching and learning: A contribution from zone theory. In L. Bragg, C. Campbell, G. Herbert, & J. Mousley (Eds.), Mathematics education research: Innovation, networking, opportunity (Proceedings of the 26th annual conference of the Mathematics Education Research Group of Australasia, pp. 364-371). Sydney: MERGA.
Goos, M. (2005a). A sociocultural analysis of the development of pre-service and beginning teachers’ pedagogical identities as users of technology. Journal of Mathematics Teacher Education, 8(1), 35-59.
Surveying the Technology Landscape 129 Goos, M. (2005b) A sociocultural analysis of learning to teach. In H. Chick & J.
Vincent (Eds.), Proceedings of the 29th conference of the International Group for the Psychology of Mathematics Education (Vol. 3, pp. 49-56). Melbourne: PME.
Goos, M. & Bennison, A. (2007). Technology-enriched teaching of secondary school mathematics: Factors influencing innovative practice. In J. Watson & K. Beswick (Eds.), Mathematics: Essential research, essential practice (Proceedings of the 30th annual conference of the Mathematics Education Research Group of Australasia, pp. 315-324). Adelaide: MERGA.
Goos, M., & Cretchley P. (2004). Teaching and learning mathematics with computers, the internet, and multimedia. In B. Perry, G. Anthony, & C. Diezmann (Eds.), Research in mathematics education in Australasia 2000-2003 (pp. 151-174). Flaxton, QLD: Post Pressed.
Goos, M., Galbraith, P., Renshaw, P., & Geiger, V. (2003) Perspectives on technology mediated learning in secondary school mathematics classrooms. Journal of Mathematical Behavior, 22, 73-89.
Kaplowitz, M.D., Hadlock, T.D., & Levine, R. (2004). A comparison of web and mail survey response rates. Public Opinion Quarterly, 68(1), 94-101.
Hennessy, S., Fung, P., & Scanlon, E. (2001). The role of the graphic calculator in mediating graphing activity. International Journal of Mathematical Education in Science and Technology, 32(2), 267-290.
Hoyles, C., Lagrange, J., Son, L. H., & Sinclair, N. (2006, December). Digital technologies and mathematics teaching and learning: Rethinking the terrain (Proceedings of the 17th ICMI Study Conference, Hanoi).
Kaput, J. J. (1992). Technology and mathematics education. In D. A. Grouws (Ed.), Handbook of research on mathematics teaching and learning, New York: MacMillan.
Loong, E. (2003). Australian secondary school teachers’ use of the Internet for mathematics. In L. Bragg, C. Campbell, G. Herbert, & J. Mousley (Eds.) Mathematics education research: Innovation, networking, opportunity (Proceedings of the 26th annual conference of the Mathematics Education Research Group of Australasia, pp. 484-491). Sydney: MERGA.
Manoucherhri, A. (1999). Computers and school mathematics reform: Implications for mathematics teacher education. Journal of Computers in Mathematics and Science Teaching, 18(1), 31-48.
Penglase, M. & Arnold, S. (1996). The graphics calculator in mathematics education: A critical review of recent research. Mathematics Education Research Journal, 8, 58-90.
Queensland Board of Senior Secondary School Studies (2000a). Mathematics B Senior Syllabus 2001. Brisbane: Author.
Queensland Board of Senior Secondary School Studies (2000b). Mathematics C Senior Syllabus 2001. Brisbane: Author.
Routitsky, A., & Tobin, P. (1998). A survey of graphics calculator use in Victorian secondary schools. In C. Kanes, M. Goos, & E. Warren (Eds.), Teaching mathematics in new times ((Proceedings of the 21st annual conference of the Mathematics Education Research Group of Australasia, pp. 484-491). Gold Coast: MERGA.
Ruthven, K. & Hennessy, S. (2002). A practitioner model of the use of computer-based tools and resources to support mathematics teaching and learning. Educational Studies in Mathematics, 49, 47-88.
130 Goos & Bennison
Simonsen, L. M., & Dick, T. P. (1997). Teachers’ perceptions of the impact of graphing calculators in the mathematics classroom. Journal of Computers in Mathematics and Science Teaching, 16(2/3), 239-268.
Thomas, M. O. J. (1996). Computers in the mathematics classroom: A survey. In P. Clarkson (Ed.), Technology in mathematics education (Proceedings of the 19th annual conference of the Mathematics Education Research Group of Australasia, pp. 556-563). Melbourne: MERGA.
Thomas, M. O. J. (2006). Teachers using computers in mathematics: A longitudinal study. In J. Novotna, H. Moraova, M. Kratka, & N. Stehlikova (Eds.), Proceedings of the 30th annual conference of the International Group for the Psychology of Mathematics Education (Vol. 5, pp. 265-272). Prague: PME.
Tobin, P., Routitsky, A., & Jones, P. (1999). Graphics calculators in Victorian secondary schools: Teacher perceptions of use. In J. Truran & K. Truran (Eds.) Making the difference (Proceedings of the 22nd annual conference of the Mathematics Education Research Group of Australasia, pp. 502-506). Sydney: MERGA.
Valsiner, J. (1997). Culture and the development of children’s action: A theory of human development. (2nd ed.) New York: John Wiley & Sons.
Vygotsky, L. (1978). Mind in society: The development of higher psychological processes. Cambridge, MA: Harvard University Press.
Walen, S., Williams, S., & Garner, B. (2003). Pre-service teachers learning mathematics using calculators: A failure to connect current and future practice. Teaching and Teacher Education, 19(4), 445-462.
Wallace, R. (2004). A framework for understanding teaching with the Internet. American Educational Research Journal, 41, 447-488.
Windschitl, M., & Sahl, K. (2002). Tracing teachers’ use of technology in a laptop computer school: The interplay of teacher beliefs, social dynamics, and institutional culture. American Educational Research Journal, 39, 165-205.