survey iii” kii and fgd report - world...
TRANSCRIPT

i
Federal Democratic Republic of Ethiopia Ministry of Capacity Building
in Collaboration with
PSCAP Donors
"Woreda and City Administrations Benchmarking
Survey III”
KII and FGD Report Survey of Service Delivery Satisfaction Status
Final
Addis Ababa July, 2010

i
ACKNOWLEDGEMENT
The survey work was lead and coordinated by Berhanu Legesse (AFTPR, World Bank) and Ato
Tesfaye Atire from Ministry of Capacity Building. The Demand side (Focus Group Discussion and
Key informant Interview) has been designed and analysis was produced by Catherine Butcher while
the data was collected by WAAS International Pvt. Ltd. Co. firm with quality control from Mr.
Sebastian Jilke. The survey was sponsored through PSCAP’s multi-donor trust fund facility financed
by DFID and CIDA and managed by the World Bank. All stages of the survey work was evaluated
and guided by a steering committee comprises of representatives from Ministry of Capacity
Building, Central Statistical Agency, the World Bank, DFID, and CIDA.
Large thanks are due to the Regional Bureaus of Capacity Building and all PSCAP executing
agencies as well as PSCAP Support Project team in the World Bank and in the participating donors
for their inputs in the Production of this analysis. Without them, it would have been impossible to
produce.
Our particular thanks go to the men, women and younger people from woredas and municipalities
and to representatives of civil society organisations who shared their experiences of services and
governance to provide the perspectives included in this report. It is their perspectives that shape this
study. We have tried to remain faithful to their views but the interpretation is, of course, solely the
author’s responsibility.

ii
Table of Contents Acronyms .............................................................................................................................................................. v 1 Introduction ................................................................................................................................................ 6
1.1 Structure of the report ........................................................................................................................ 7 2 Objectives of Focus Group Discussions and Key Informant Interviews ...................................................... 7
2.1 Main topic areas of FGDs and KIIs ....................................................................................................... 8 3 Methodology .............................................................................................................................................. 9
3.1 Selection of sample sites – FGDs ......................................................................................................... 9 3.2 Selection of sample sites – KIIs .......................................................................................................... 10 3.3 Undertaking the Focus Group Discussions ........................................................................................ 10 3.4 Undertaking the key informant interview ......................................................................................... 10 3.5 Data storage and retrieval ................................................................................................................. 11 3.6 Quality control ................................................................................................................................... 11
4 Results: Focus Group Discussions ............................................................................................................. 11 4.1 Basic Particulars of Focus Group Discussions .................................................................................... 11 4.2 Measures of health service quality ................................................................................................... 12 4.3 Fairness of treatment ........................................................................................................................ 20 4.4 Extra payments .................................................................................................................................. 24 4.5 Health facilities: improving or getting worse? .................................................................................. 26 4.6 Measures of service quality more generally ..................................................................................... 31 4.7 Action taken if not satisfied with a service ........................................................................................ 44 4.8 Consultations ..................................................................................................................................... 49 4.9 Sharing of information....................................................................................................................... 56
5 Results: Key Informant Interviews ............................................................................................................ 62 5.1 Basic Particulars of Key Informant Interviewees ............................................................................... 62 5.2 Resource sharing ............................................................................................................................... 63 5.3 Public information sharing ................................................................................................................ 66 5.4 Consultation ...................................................................................................................................... 70 5.5 Service Provision ................................................................................................................................ 77 5.6 The Registration process for CSOs ..................................................................................................... 80 5.7 Accountability and complaint procedures ........................................................................................ 81 5.8 Final comments from Key Informants ............................................................................................... 84
6 Case Studies and comparison across jurisdictions ................................................................................... 86 7 Discussion and conclusions ....................................................................................................................... 89
7.1 Health ................................................................................................................................................ 89 7.2 Education ........................................................................................................................................... 91 7.3 Agriculture ......................................................................................................................................... 91 7.4 Police services .................................................................................................................................... 92 7.5 Justice services .................................................................................................................................. 93 7.6 Complaints procedures ..................................................................................................................... 93 7.7 Common themes arising – service quality ......................................................................................... 94 7.8 Access to information on government activities ............................................................................... 94 7.9 Consultation: ..................................................................................................................................... 96 7.10 Information sharing and consultation: common themes .............................................................. 98 7.11 Key findings from interviews with Civil Society Organisations ...................................................... 99
Focus Group Discussion Checklist .................................................................................................................. 102 KEY INFORMANT QUESTIONNAIRE .................................................................................................................. 110 1. Basic Information concerning Civil Society Organization and its location .............................. 110
iii
2. Resources & Working Relationships ..................................................................................... 112 3. Public Information ................................................................................................................. 113 4. Consultation .......................................................................................................................... 115 5. Service Provision .................................................................................................................. 118 6. The Registration Process for CSOs ...................................................................................... 119 7. Accountability & Complaint Procedures ................................................................................. 120
List of Tables
Table 1: Location of FGDs and KIIs by Region ........................................................................................ 9
Table 2: Age of FGD participants ......................................................................................................... 11
Table 3: Measures of good service (health) identified by FGD participants ....................................... 12
Table 4: Measures of good service (health) identified by FGD participants: Municipal and rural areas...................................................................................................................................................... 13
Table 5: Measures of poor service (health) identified by FGD participants ........................................ 20
Table 6: Perception of FGD participants on fairness of treatment at government health facilities ... 21
Table 7: Extra payments ...................................................................................................................... 24
Table 8: Extra payments ...................................................................................................................... 25
Table 9: Improving or getting worse? .................................................................................................. 27
Table 10: Summary of reasons given by FGDs for improvement ........................................................ 27
Table 11: Top five reasons given by men for seeing improvements in health facility ........................ 28
Table 12: Top five reasons given by women for seeing improvements in health facility ................... 28
Table 13: Top five reasons given by youth for seeing improvements in health facility ...................... 28
Table 14: Comparison of reasons for improvement: municipalities with rural area .......................... 30
Table 15: Summary of reasons given by FGDs for improvement ........................................................ 30
Table 16: Services identified as of the best quality: municipalities and rural areas ........................... 32
Table 17: Services identified as of the best quality: men, women and youth .................................... 33
Table 18: Statements made in relation to services identified as of the best quality .......................... 34
Table 19: Services identified as of the lowest quality: municipalities and rural areas ....................... 38
Table 20: Services identified as of the lowest quality: men, women and youth ................................. 39
Table 21: Statements made in relation to services identified as of the lowest quality ...................... 41
Table 22: If not satisfied with a service, what can you do ................................................................... 44
Table 23: If not satisfied with a service, what can you do – actions/reasons provided ...................... 46
Table 24: If not satisfied with a service, explanations given by a sample of FGDs ............................. 47
Table 25: Consulted or not consulted? ................................................................................................ 49
Table 26: Topics of consultation .......................................................................................................... 49
Table 27: Say or influence in running services ..................................................................................... 52
Table 28: Say or influence in setting development priorities .............................................................. 55
Table 29: Information availability ........................................................................................................ 58
Table 30: Access to information by specific groups of people ............................................................ 60
Table 31: Characteristics of CSOs whose representatives were interviewed ..................................... 63
Table 32: Support to CSOs (in general) by Woreda or City Governments in past year ....................... 63
Table 33: Support to respondents’ CSOs by Woreda or City Governments in past year .................... 64
Table 34: Support to Woredas or City Governments from CSOs in past year ..................................... 65
Table 35: Support to woredas or city governments from CSOs by Region ......................................... 66
Table 36: Information perceived as available by CSOs and means of availability ............................... 67
Table 37: Other methods of information availability .......................................................................... 67

iv
Table 38: Information perceived as available by CSOs ........................................................................ 69
Table 39: Levels of satisfaction with information provided ................................................................ 69
Table 40: Comments from KIs against their assessed level of satisfaction ......................................... 70
Table 41: Consultation on development needs and quality of services .............................................. 71
Table 42: Use of CSO views on development needs and quality of services ...................................... 72
Table 43: Numbers of CSOs consulted on preparation of strategic plans ........................................... 73
Table 44: Perceived reasons for lack of consultation on preparation of strategic plans and number of CSOs in each category.............................................................................................................. 74
Table 45: Dissemination of consultations with CSOs and communities ............................................. 76
Table 46: Methods used for dissemination of consultation findings .................................................. 76
Table 47: Numbers of CSOs cooperating in the design or planning of jurisdiction-provided services77
Table 48: Reasons for no cooperation in designing & planning services ............................................ 78
Table 49: Failure to keep promises: yes, sometimes, no, don’t know ................................................ 81
Table 50: Failure to keep promises: what can the CSO do? ................................................................ 81
Table 51: Failure to keep promises: what can the CSO do? ................................................................ 83
Table 52: Final comments – on the survey as a whole ........................................................................ 85

v
Acronyms
BPR Business process re-engineering CRC Citizen Report Card CSO Civil Society Organisation CSA Central Statistical Agency DA Development Agent DLDP District Level Decentralisation Programme EA Enumeration Area FG Focus Group FGD Focus Group Discussion FDRE Federal Democratic Republic of Ethiopia GoE Government of Ethiopia KI Key Informant KII Key Informant Interview MCH Maternal & Child Health MOCB Ministry of Capacity Building P1 Participant 1 PSCAP Public Sector Capacity Building Programme SNNP Southern nations, nationalities and peoples SSQ Supply side questionnaire
1
Executive Summary
Introduction
The report below summarises data collected using two instruments, Focus Group Discussions (FGDs) and KII (Key Informant Interviews) as part of the Woreda and City Benchmarking Survey (WCBS) undertaken in the first half of 2010 across Ethiopia. The current round of data collection is known as WCBS III and follows two previous data collections in 2005 and 2008. The WCBS was initiated through a high level Government of Ethiopia (GoE) and Bilateral and Multilateral Donors agreement to jointly undertake four rounds of a benchmarking survey over the lifetime of the Public Sector Capacity building Programme (PSCAP). Collection of data using FGD and KII methodology contributes to the demand-side component of WCBS III. Together with data collected using a structured survey, the Citizen Report Card, see a separate report covering this component (Yaron, 2010), demand-side instruments are designed to collect, collate and analyse experiences, views and perceptions from the perspective of citizens and the representatives of Civil Society Organisations (CSOs) in relation to service delivery and governance at the local administration level. Specifically the aims of the FGDs are to:
1. Assess, from the perspective of citizens, including those from potentially marginalised groups, indicators of quality in service provision and citizen involvement
2. Obtain greater depth, detail and voice on aspects of particular interest, e.g. service delivery and citizen participation.
The aims of the KIIs are to:
1. Gain perspectives from a stakeholder group (civil society organisations) not covered in detail by other instruments but seen as having an important role in improving access to services and citizen involvement
2. Gain information in specific areas where key informants are likely to have specialised knowledge - the relationship between administrations and civil society organisations (CSOs)
3. Provide further depth to and allow for some cross-checking of responses from the supply
side questions for topics relating to CSOs and governance. The approach and content of the FGDs and KIIs have been restructured since their use in WCBS II. Therefore qualitative results from WCBS III will not generally be comparable with the qualitative instruments used in WCBS II. However where comparisons can be made these have been included. 70 FGDs composed of 30 FGDs held with men, 30 FGDs with women and 10 FGDs with young people involving 678 citizens were held in jurisdictions in 9 regional states across Ethiopia.

2
Jurisdictions included both municipal and rural areas. 175 KIIs were also conducted in the same regions with CSO representatives purposively selected to include a range of smaller and larger CSOs. Health Issues relating to the health service were discussed in detail in FGDs. Following discussion of what were the characteristics of a good health service, just over two thirds of FGDs concluded that health services were improving. In rural areas, reduced distance to nearest facility was seen as a key indicator of service quality and its improvement. Distance to health facility was important to users for a number of reasons: reduced time and effort, reduced transport costs, greater likelihood of being understood in one’s own language, and a greater of likelihood of being treated fairly. In municipalities and rural areas, other reasons given for improved service were increased number of health professionals, a better overall service, improved mother and child care, improvements to health facility infrastructure, improved house to house services (especially appreciated by women) and improved availability of family planning services (especially appreciated by younger participants), and in some places increased supplies of medical drugs available through government sources. Shortage of medical supplies was an area of major concern to FGD participants and shortages were said to impact on poorer and more rural users in particular. A further area of concern was the time government medical staff gave to their private patients and pharmacies, and at least in some cases, a belief that scarce resources such as drugs and night-time care were diverted to private practices. Despite overall improvements, just over half of the FGDs believed that there was partiality of treatment at government health facilities which negatively impacted on poor, uneducated and rural users in particular. One in ten FGDs believed that informal payments were made to obtain better treatment. In 2008, it is reported with regards to health services, that “there are no corrupt practices in general”. This would appear to suggest an increase in corrupt practices in terms of informal payments in the current round of data collection but care is needed in interpretation of 2008 and 2010 comparisons. However from the KIIs carried out in 2008, additional payments were perceived as more likely at hospitals. This is in line with perceptions expressed in FGDs in 2010. Education There were no specific questions relating to education in the FGDs. However during discussions, it was clear that primary schools were a service rated highly by participants, particularly women and youth. Where caveats were added, these concerned the quality of education with some concerns expressed relating to lack of teachers, books and library facilities. Overall, education was included among the best services by three quarters of all FGDs and is in line with 2008 FGD findings. Education was the service mentioned most frequently as being of “best quality”. Agriculture From the FGDs it can be seen that inputs such as fertilisers, improved seeds and veterinary drugs are valued. However the combination of drought and high fertiliser costs meant that outputs were

3
low in comparison to inputs resulting in a lower value being placed on the services provided, in some instances. Police services The provision of police services presented a mixed picture. FGDs in areas that had experienced unrest (Gambella and parts of Somali), and FGDs with women, and to a lesser extent with youth, gave greater appreciation of the police service than men. However where police services exist, participants perceived that there was a lack of police personnel in times of need and there are sufficient examples of corruption and aggressive behaviour on the part of police officers to cause concern.
Justice services Responses to justice services also present a mixed picture. About a quarter of all FGDs included justice services among the best services in their area, many saying it had improved in recent years. However a third of FGDs included justice services amongst the worst services in their locality. Aspects of the justice service appreciated by participants were the rotation of courts to the local area and reduced times in obtaining a verdict. Conversely, negative perceptions included long delays, and the belief that “justice” was not possible without the payment of bribes.
Complaints procedures If not satisfied with a service, three quarters of FGDs believed some action could be taken. A similar finding was given in 2008 where the majority of FGDs believed accountability systems did exist. The most common actions given (2010) were to appeal to a higher authority or use alternative providers. However a quarter of FGDs believed there was little or nothing could be done in the case of unsatisfactory service provision. Reasons included lack of response from previous actions or that problems experienced were already known by kebele officials. A small percentage feared retribution in the case of a complaint. Representatives of CSOs were asked if the administration failed to keep their promises, if there was anything they could do. Just over half said there was little or nothing that could be done while 41% thought there was something that could be done. In 2008, a similar figure (45%) believed a satisfactory outcome to complaints was likely. In 2010 a small percentage feared retribution if appeals were made. Service quality – common themes arising A number of common themes emerge from results. Where low satisfaction with services is expressed the following common elements are expressed:
Lack of perceived fairness where some are treated before or better than others
Discussion of problems with no response or feedback
Delays in service or response,
Lack of understanding of the process, and lack of explanation.
4
Access to information Received information was considerably higher for FGD participants on taxation than for strategic plan or budgets, with two thirds of rural FGDs saying they were informed about taxation, and slightly lower figures in municipalities. Knowledge of both the strategic plan and budget were low among focus groups, at 9% and 23% respectively. Some FGDs struggled with the concept that this information might be available to them as citizens. The poor, the youth and those not affiliated with the dominant political party believed that information was less likely to reach them. KIIs with CSO representatives show that just over a fifth of respondents had access to budget information and just over a third had access to the strategic plan. This is considerably higher than results from 2008, although it should be noted that KII results from 2008 include the views of citizens as well as representatives of CSOs. Overall when KIs were asked in 2010 to assess their level of satisfaction with the information provided, the largest category of response overall was “very dissatisfied” at a quarter of KIs. Just under half of all KIs were very dissatisfied or quite dissatisfied and just under a third were very satisfied or quite satisfied, the majority of these fell into the “quite satisfied” category. There was a clear desire for more information in approximately half of those interviewed. A fifth of KIs were unsure or did not know, mainly because the idea of woredas and city governments making information available to them was a new concept. This implies weak working relationships with these CSOs and the local administration. Consultation on development needs and strategic plans Just under a third of FGDs believed they had a say or influence in setting development priorities, and this fell to below a quarter for rural residents, women and the youth. Responses ranged from a feeling of confidence based on previous experiences at one extreme, to a feeling of being ignored due to decision makers seeing local people as ignorant or that local opinions were not welcome at the other extreme. The electoral system was rarely seen as a means of influencing the development in the kebele. Just under half the representatives of CSOs had been consulted by the administration on development needs, a similar figure to those who had been consulted on the quality of public services. Consultation with CSOs appeared to be quite specific in nature, often relating to a single topic, and may be associated with a request for resources. Considerably fewer CSOs were consulted in relation to strategic plan preparation and the main forum for consultation was in council meetings. Few administrations had specific platforms, CSO fora or other institutionalised instruments for working with CSOs - a similar finding to 2008 KII results. Access to information and consultation – common themes arising Discussions on information sharing and consultation show that women and youth are more likely to be excluded from meetings and other forms of consultation than men. Women tended to be more

5
accepting of this situation, often blaming their own lack of knowledge or burden of household duties. Youth on the other hand showed greater frustration with their lack of involvement. FGDs frequently expressed realism about lack of resources available to local administrations. However lack of any response to their appeals for services would appear to be a source of frustration and disempowerment of local communities. Where discussion with FGs indicated poor information sharing with citizens on the part of the administration, this on the whole, was reflected in similar findings with CSOs. Pastoralists and to a lesser extent women and youth appeared to be groups that administrations found particularly hard to engage with. In these areas there would appear to be little evidence from the current study that local administrations are able to cooperate with CSOs to increase engagement with these groups. Differences between Regions From the data provided by FGD participants and KIs, two regions stand out. Tigray is a region where across many indicators of good governance, reasonable levels of achievement are attained. Levels of satisfaction among respondents were generally higher than for other regions. Respondents from Somali, on the other hand frequently expressed their lack of consultation, their lack of understanding of the administration, and their lack of satisfaction with levels of corruption and services provided. The remaining regions lie somewhere in between, in terms of governance as measured with qualitative results, though there are indications that Oromiya and SNNP fare somewhat worse than Amhara in this respect. Working relationships with Civil Society Organisations Although not all CSOs involved in the current study were membership organisations, those involved represented 49,000 members and ranged from organisations with no paid staff to those with 125 paid staff. Across a range of indicators, results would indicate considerable difference in working relationships between local administrations and CSOs as perceived by KIs. However although there are examples of close working relationships between CSOs and the administration, these would seem to be the exception rather than the norm. In those areas where little cooperation was detected, main reasons given by KIs were as follows:
Weak working relationships / no history of working closely together
A lack of suitable platforms for consultation or working with CSOs
A lack of realisation on the part of the administration, of the potential benefits
Lack of capacity within the local administration. In a small percentage of responses, prejudice against CSOs was given as a reason and there was a feeling, at least among some CSOs that such negativity was greater at local rather than higher levels of government.

6
1 Introduction
The report below summarises data collected as part of the Woreda and City Benchmarking Survey (WCBS) undertaken in the first half of 2010 across Ethiopia. The WCBS was initiated through a high level Government of Ethiopia (GoE) and Bilateral and Multilateral Donors agreement to jointly undertake four rounds of a benchmarking survey over the lifetime of the Public Sector Capacity building Programme (PSCAP). The first round of WCBS was carried out in 2005 and established a baseline in a limited number or selected Woreda and Cities or municipal entities. It focused on assessing existing financial, administrative and technical capacities in Woreda and City governments. A second round of data collection was carried out two years later (2008) and as well as looking at issues covered in the first round of data collection was extended to include data from the demand side of governance and service delivery. WCBS II collected data on citizens’ perceptions regarding performance and service delivery. Demand-side data collection during WCBS II deployed a structured survey and qualitative approaches to capture perceptions. The qualitative approaches consisted of Focus Group Discussions and Key Informant Interviews. In 2009 a third round of data collection was instigated and a third round of data collection and analysis was undertaken in the first half of 2010. The third round has again involved supply- and demand-side instruments with the latter employing both quantitative and qualitative tools for data collection. Under WCBS III, the number of jurisdictions covered has been expanded. 378 jurisdictions are covered with a supply-side instrument questionnaire which looks at local administrations’ perceptions of issues associated with financial autonomy, institutional capacity and coordination and service delivery by the local administration. A sub-set of these jurisdictions are covered under the demand-side instruments, the first of which is the Citizen Report Card. The Citizen Report card involves 68 jurisdictions, 10,567 citizens and uses a questionnaire to collate citizens’ perceptions on service delivery and access and, as importantly, citizens’ capacity to effectively demand service improvements. Also on the demand side, two further tools have been employed to add qualitative information from the perspective of citizens on aspects covered by the supply-side questionnaire and demand-side Citizen Report card. The two tools employed are Focus Group Discussions (FGDs) conducted with groups of men, women and young people, and Key Informant Interviews (KIIs) conducted with representatives of Civil Society Organisations (CSOs). Results from FGDs and KIIs are the focus of the report below. As well as expanding the number of jurisdictions covered, changes have been made to all instruments to improve their usability and the information generated. On the supply-side a number of questions were split for better documentation and new topics include policing and local courts. A number of changes across sectors have been made to the CRC to ensure that it remains focused and succinct. For further details see reports for each of these instruments. The FGDs and KIIs have been changed considerably as compared with WCBS II. Those involved in WCBS II found the qualitative results of less value than anticipated due to the lack of relation between the instruments. For this reason questions and discussion topics in the FGDs and KIIs have been more

7
closely related to those of other instruments than occurred in the previous round and the approach and content of the FGDs and KIIs have been restructured since their use in WCBS II. Therefore qualitative results from WCBS III will not generally be comparable with the qualitative instruments used in WCBS II. However where comparisons can be made these have been included1. The demand-side data (CRCs, FGDs and KIIs) are designed to collect quantitative and qualitative data on the views, opinions and perceptions of citizens with regard to service delivery and governance at the local administration level. This allows supply-side data to be set in context in terms of local needs and expectations, and is important in validation of results supply-side data.
1.1 Structure of the report
The report below summarises the objectives of FGD and KII data collection before describing the methodology employed in data collection and storage. The section on methodology is followed by presentation of results for i) Focus Group Discussions, and ii) Key Informant Interviews. Within the results sections: Sections 4 (Focus Group Discussions) and 5 (key Informant Interviews), a summary of data that has been quantified is presented together with quotes from respondents. Section 6 combines findings for both the FGDs and KIIs for a number of illustrative jurisdictions followed by Section 7 which discusses the results and draws conclusions.
2 Objectives of Focus Group Discussions and Key Informant Interviews
In common with other qualitative methodologies used in conjunction with more quantitative instruments, the FGDs and and KIIs are intended to add greater contextual detail to the other instruments deployed in WCBS III. They are intended to add “voice” from the perspective of local people in a way that is more difficult using formal questionnaires. More specifically, objectives are as follows: Focus Group Discussions:
1. To assess, from the perspective of citizens, including those from potentially marginalised groups, indicators of quality in service provision and citizen involvement
2. To obtain greater depth, detail and voice on aspects of particular interest, e.g. service delivery and citizen participation.
In providing information on indicators, results can be used to triangulate other instruments, particularly the demand-side CRC. By generating indicators from local people’s perspective, those indicators used in the CRC can be assessed to see if they are line with what local people articulate as important as measures of success.
1 The two documents relating to 2008 data are:
1) Woreda-City Baseline and Benchmarking Survey (2008). Summary of Focus Group Discussion Reports by Mesfin
Tafesse, 2009. This is a short report 12 pages.
2) Results of Key Informant Interviews (Summary Report and Reports by Individual Jurisdictions) by Mesfin Tafesse,
2009. The 2008 KII data was collected from representatives of CSOs and members of the public while in 2010 the
respondent group was more clearly defined as representatives of CSOs. The nature of the summary reports and such
differences therefore make comparisons difficult.

8
In providing greater depth, the results have the potential to add caveats and explanation to instances of “success” or “failure” detected with instruments. In addition, by using respondents’ own words, the FGDs and KIIs give a “human face” to findings. Key Informant Interviews: Specific objectives of the KIIs are as follows:
1. To gain perspectives from a stakeholder group (civil society organisations) not covered in detail by other instruments but seen as having an important role in improving access to services and citizen involvement
2. To gain information in specific areas where key informants are likely to have specialised knowledge - the relationship between administrations and civil society organisations (CSOs)
3. To provide further depth to and allow for some cross-checking of responses from the supply
side questions for topics relating to CSOs and governance.
2.1 Main topic areas of FGDs and KIIs
Within the inevitable constraints of time and resources, including those of participants, neither the FGDs nor KIIs can cover all areas of potential interest. Therefore an early focus was essential. In looking at indicators, the FGDs therefore focused on one service, health, in detail, before discussing service delivery more generally. Health was chosen over other services as a sector that involves most, if not all of the population, and having aspects that affect different sectors of the population in different ways, i.e. men, women and youth are likely to have different health needs. Health also provided an example of a service where other actors are involved in delivery, including the private sector. In looking at services more generally, questions were purposively open-ended and avoided top-down imposition of services to discuss. This allowed FGD participants to raise those services and issues that were important to them. The FGDs then focused on consultation carried out by woreda and city administrations. FG discussion was facilitated around topics of influence and empowerment to gain insights as to whether local people felt they had a say in services that affect them. Good consultation depends on those consulted having adequate information to make informed decisions and the next set of discussion areas covered in the FGDs look at what information is provided by local administrations. The FGD checklist of topics used to guide areas of discussion therefore covers four main headings as follows:
A. Measures of service quality – health B. Measures of services more generally C. Exploration of who, how and when local people are consulted by woreda / city government
and kebele officers D. Public information distribution and access.
The full FGD checklist is given in ANNEX 1.

9
The KIIs look at working relationships between CSOs and administrations and use a combination of open and closed questions. Questions fall under main headings as follows:
1. Basic information concerning Civil Society Organisations and their locations 2. Resources and working relationships 3. Public information 4. Consultation 5. Service provision 6. The registration process for CSOs 7. Accountability and complaint procedures.
The main question areas within the CRC and SSQ related to discussion topics in FGDs and KIIs are given in ANNEX 3.
3 Methodology
3.1 Selection of sample sites – FGDs
A total of 70 FGDs were conducted in 30 jurisdictions throughout the regions of Ethiopia. 30 FGDs were conducted with men, 30 with women and 10 with the youth. Jurisdictions selected were a sub-sample of those jurisdictions selected for the CRC which in turn was a sub-set of jurisdictions selected for conducting Supply-side questionnaires. Selection used a combination of purposive and random methods. Within this sub-set at least 2 FGDs (one with men and one with women) were to be conducted in each of the following regions: Affar, Amhara, Benishangul Gumuz, Gambella, Oromiya, Somali, SNNP, Tigray. Where FGDs were conducted with the youth, these were selected to provide a country-wide distribution. To take into account differences in populations, the total number of FGDs undertaken in a region was broadly proportionate to the populations of that region. Thus regions with larger populations included larger number of FGDs. Within regions, jurisdictions were selected to include both rural and urban jurisdictions. Within the list of rural and urban jurisdictions from the CRC, jurisdictions were selected at random. The resulting locations by region are given in Table 1.
Table 1: Location of FGDs and KIIs by Region
Ad
dis A
bab
a
Affar
Am
hara
Ben
ishan
gul
Gu
mu
z
Gam
bella
Oro
miya
SNN
P
Som
ali
Tigray
Total
No. of FGDs (urban)
0 0 4 0 0 6 5 5 2 22
No. Of FGDs (rural)
0 3 7 3 3 16 9 2 5 48
No. of KIIs
5 5 30 5 5 55 35 15 20 175

10
Selections of kebeles within jurisdictions were at random and selection of households within kebeles was also at random. FGDs were made up of 6 to 14 men, women or young people2.
3.2 Selection of sample sites – KIIs
A total of 175 KIIs were conducted with representatives of Civil Society Organisations in 35 jurisdictions distributed. As with the FGDs, jurisdictions were selected from a sub-set of those jurisdictions covered by the CRC and to broadly reflect the populations of each region. Within jurisdictions, CSOs were purposively selected to obtain 5 CSOs per jurisdiction of which two were “kebele-level” CSOs and three were “woreda-level” CSOs. Selection also purposively included a range of sectors covered by the CSOs. Kebele-level CSOs were more local in nature and were defined as those that worked in less than three kebeles. Woreda-level CSOs were those that worked in three or more kebeles. Final selection is given in Table 1 above.
3.3 Undertaking the Focus Group Discussions
Following three days training and familiarisation and two days piloting3, FGDs were undertaken by five teams of local consultants conversant in the language of the area. Each team was made up of a three members: a FGD facilitator, a note-taker/recorder and an observer. Teams conducting FGDs with women included at least one female team member, usually two. Each FGD lasted two to three hours and a small stipend equivalent to the cost of a meal was given to participants to compensate them for their time. Following introductions and explanations, FGD teams facilitated discussions and recorded the discussion in writing and using electronic recorders. Discussion was recorded in as far as possible verbatim. The degree of accordance among participants was also recorded using a sliding scale of 1 to 10. Although obviously a blunt instrument, this gave an indication of the amount of agreement within the FG. Where disagreement is high in the focus group this is highlighted in Section 4, the results section for FGDs. The teams produced field reports immediately after the FGD highlighting key observations from the discussion, and produced jurisdiction reports soon after.
3.4 Undertaking the key informant interview
Following two days training and familiarisation and two days piloting, KIIs were undertaken by experienced interviewers conversant in the language of the area. Each KII lasted approximately 50 minutes. Following introductions and explanations, interviewers recorded the interview on pre-prepared sheets and produced jurisdiction reports soon after conducting the interviews.
2 FGDs held with young people included male and female participants between the ages of 16 and 29
3 Teams were also provided with a written FGD guide and survey manual outlining expected approaches and conduct

11
3.5 Data storage and retrieval
Data from the FGDs and KIIs were stored in specifically designed databases which included fields for recorded transcriptions of the discussions / interviews and fields for storing coded data. Although the main value of qualitative data is seen as in the recorded transcriptions, coding of data allowed interviews / discussions to summarise in quantitative form. Coding was completed by those team members who had been involved in data collection. In analysing results comparisons were made between focus group discussions held with male, female and youth participants, and between focus group discussions held with residents of municipalities and other areas, the majority of the latter being rural or semi-rural4. During data collection municipalities were categorised as i) municipalities with state functions and ii) municipalities without state functions. However as data was collected from only five municipalities without state functions, numbers were assessed as too small to give meaningful results as a stand-alone category. Hence, in the following analysis no differentiation has been made between municipalities with state functions and those without.
3.6 Quality control
Spot checks were made in the field of FG and KI discussion / interview techniques and data recording by a governance specialist independent of the consultancy firm contracted to collect and record data, design appropriate databases and data entry. During database entry, 10 per cent of data were checked at this stage for accuracy of entry.
4 Results: Focus Group Discussions
Results from 70 FGDs held with men, women and young people are summarised below.
4.1 Basic Particulars of Focus Group Discussions
678 people participated in the FGDS, of whom 280 took part in men’s FGDs, 304 took part in women’s FGDs and 93 took part in FGDs held with young people. The gender of 80 of the participants in youth FGDs was recorded. Of these, 36% were female.
Table 2: Age and sex of FGD participants
Men (n=280) Women (n=304) Young People (n=93)
Average age (yrs)
Minimum age (yrs)
Maximum age (yrs)
Average age (yrs)
Minimum age (yrs)
Maximum age (yrs)
Average age (yrs)
Minimum age (yrs)
Maximum age (yrs)
40 18 75 35 18 70 21 16 29
When asked their occupation 44% of participants described themselves as farmers, 17% as housewives, 10% as students, 4% as pastoralists, 3% as job seekers or unemployed, 2% as government employees, and 2% as daily labourers. Other professions included carpenters, masons
4 Jurisdictions outside of municipalities are referred to as rural throughout the report. However it is recognised that some
of these may be peri-urban in nature. However for brevity they are referred to as “rural”.

12
and construction workers, small business persons, merchants and traders, priests and retired persons. Individuals from 26 ethnic groups took part in the FGDs.
4.2 Measures of health service quality
A series of topics were discussed with FGD participants looking at their experience of health facilities from a number of different perspectives including measures of quality, fairness of treatment, perception of improvements to services. Topics discussed are given in ANNEX 1, see Topic A, and results are summarised below.
FGD participants were asked: if they went to a government health service what aspects would allow them to say that the service was 1) a good service, 2) a less than good service. FGD questions and prompts facilitated participants to identify indicators relating to health services and discussions around measures of health service quality provided insight into issues of service provision of relevance to citizens and allowed a comparison of citizen-generated indicators with those used in other survey instruments. Those indicators given most frequently by FGD participants are given in Table 3 below. Table 3 presents indicators FGD participants used to identify measures of a good health service and are grouped under 14 categories. Differences between municipal and other areas are summarised in Table 4.
Table 3: Measures of good service (health) identified by FGD participants
Indicator identified No. (& %) of FGDs identifying (70 FGDs)
No. (& %) of male FGDs identifying (30 FGDs)
No. (& %) of female FGDs identifying (30 FGDs)
No. (& %) of youth FGDs identifying (10 FGDs)
Availability of medical supplies
44 (63%)
22 (73%)
15 (50%)
8 (70%)
Proximity / short distance
37 (53%)
14 (47%)
16 (53%)
7 (70%)
“Additional” services 35 (50%)
10 (33%)
19 (63%)
5 (50%)
Preventative services and health education
29 (41%)
10 (33%)
13 (43%)
6 (60%)
Professionalism, work ethics and attitude
29 (41%)
14 (47%)
10 (33%)
5 (50%)
Availability of health professionals
27 (39%)
13 (43%)
9 (30%)
5 (50%)

13
Availability of medical equipment
25 (36%)
11 (37%)
11 (37%)
3 (30%)
Upgraded and/or clean buildings
19 (27%)
10 (33%)
7 (23%)
2 (20%)
Emergency care and priorities
18 (26%)
9 (30%)
8 (27%)
1 (10%)
Affordability 12 (17%)
5 (17%)
4 (13%)
3 (30%)
Free 10 (14%)
8 (27%)
1 (3%)
2 (20%)
Efficiency, speed and management
9 (13%)
4 (13%)
4 (13%)
1 (10%)
Availability of ambulance or emergency communications
8 (11%)
6 (20%)
2 (7%)
0 (0%)
Availability of road & transport
5 (7%)
(7%) q
3 (10%)
2 (7%)
0 (0%)
Table 4: Measures of good service (health) identified by FGD participants: Municipal and rural areas
Indicator identified FGDs - Municipal Administration (n=19)
FGDs - Rural woreda administrations (n=51)
Availability of medical supplies
8 (42%)
36 (70%)
Proximity / short distance 5 (26%)
32 (63%)
“Additional” services 13 (68%)
22 (43%)
Preventative services and health education
4 (21%)
25 (49%)
Professionalism, work ethics and attitude
9 (47%)
20 (39%)
Availability of health professionals
7 (37%)
20 (39%)
Availability of medical equipment
7 (37%)
18 (35%)
Upgraded and/or clean 6 13

14
buildings (31%) (25%)
Emergency care and priorities
6 (31%)
12 (23%)
Affordability 5 (26%)
7 (14%)
Free 4 (21%)
6 (12%)
Efficiency, speed and management
3 (16%)
6 (12%)
Availability of ambulance or emergency communications
4 (21%)
4 (8%)
Availability of road & transport
1 (5%)
4 (8%)
Overall differences in indicators between male, female and youth FGDs were small with the possible exceptions of “additional services” and cost. Additional services including maternity services, of particular importance to women and family planning services were important indicators for the youth groups. In comparing municipal and other areas, “Additional services” are also cited more frequently in municipal areas than in rural areas. Expectations of the health service would appear to be higher in municipal areas with greater numbers of participants seeing the presence of laboratory diagnosis and X-ray as indicators of good service. As would be expected, in rural areas, proximity of health facilities is given greater importance – in municipal areas health facilities are generally within a reasonable distance. Availability of medical supplies is a measure mentioned by 63% of FGDs overall and was of particular importance to rural citizens, where alternatives primarily through private pharmacies were less available. These differences are discussed further in Sections 4.2.1 to 4.2.6 below. Perceptions of a well-run health service were summarised by the statement below:
“The service is seen as good when there is availability of in-date medicines, good health workers who carry out good examinations; when there is a good health professional and proper medicine is given to the right person; when there is a well-equipped laboratory, a good building with neat rooms, a clean latrine and water and well-trained health workers who are tidy and teach others; when there are bedrooms and the facility is located near our village” (male participants, Siraro woreda, Oromiya)
4.2.1 Medical supplies
Over all discussions, availability of medical supplies (medicines, drugs, chemicals, syringes) was mentioned by two thirds of the FGDs and was the most frequent measure of good service. This is expressed by a participant from Affar as follows:
“A good service of a health facility is measured by the stock of its pharmacy. All medicines prescribed by the physician should be available at the government pharmacy” (Male participants, Awash Woreda, Affar Region)

15
In identifying measures of good service, lack of medical drugs through government sources was a major concern to FGD participants. Drugs available at government health facilities are seen to be more affordable by the poor and more likely to be available without incurring other extra expenses such as travel. There is a perception that government health services are of particular benefit to the poor as alternatives available to them are few. Lack of drugs (and other facilities) provided through government sources reduced the benefits of other health services provided, especially to the poor. However limited availability of pharmaceutical drugs at government health centres was perceived as the norm. During discussions, the relationship between government health and private health services was questioned, see comment from Oromiya below:
“The government has built a good health centre here. When you go there, they give you examination service, but they tell you to buy drugs from other centres. … But how can drugs that are available in the private pharmacy be absent in that of government? I couldn’t afford.” ( Male participant, Arsi Negele Woreda, Oromiya Region).
This questioning was expressed either as a conflict of interest for health professionals, in terms of allocation of medical drugs or time, or in terms of misuse of government resources, see the statements below:
The “other thing which is affecting the quality of health facilities is that the doctors working at government centres have their own private clinics or they also work privately. This is creating a conflict of interest; they give more weight to their clinics than the governmental. This can be seen in their attendance, especially at night shift. At private clinics there is a doctor twenty four times seven” (Female Participants, City Woreda, Tigray).
“The physicians who work at the government health centre also work privately. Those patients who are their customers at their private clinic have more access to deal with them at the governmental health centre also. They give them priority”. (Youth Participants, City Woreda, Tigray) “The government health service is good especially for the poor or those with no income. But they have no supply of medicine, to the most part they advise us to buy from outside. This is bad for the poor… It seems that pharmacies in Arsi Negele town have a relationship with the government health centre. I think the latter might get some kind of benefit from the former. Even the health centre sometimes refuse to sell drugs that are available in its store” ( Youth participants, Arsi Negele Woreda, Oromiya Region). “If drugs are not available in government stores, where do the private ones get them? Government employees (health workers) themselves also work in the private one”. (Women participants, Arsi Negele, Oromiya).
In terms of gender differences, women participants placed less importance on the availability of medical supplies and drugs through government sources than male and youth FGDs (50% as compared as compared with 73% and 70% for men and youth respectively). As assessed by number of mentions, “additional services” and door-to-door services and health education were more important to women.

16
In terms of differences between those areas that fell under municipal administrations (either with or without state functions) and other woreda administrations, those in rural areas gave greater emphasis to availability of medical supplies, mainly medical drugs, having fewer alternative options and /or likely to incur greater expense in travelling to alternative drug retailers.
4.2.2 Proximity to health services
Proximity of health services was also important across all FGDs, and as noted above and perhaps not surprisingly, particularly in rural areas. Women FGDs and particularly the youth gave greater emphasis to this aspect. Proximity is obviously important in terms of easy access to the facility and the cost of reaching the facility. A higher priority given by youth FGs to proximity is associated with the money saved in terms of transport costs. Youth FGDs also gave greater priority to treatment cost with higher percentages of youth groups saying the service should be affordable. However proximity of service is also seen as important in terms of being treated with respect and (sometimes) in one’s own language. Rural FGs also frequently expressed a perception that rural people received sub-standard service outside their own localities; see also Section on fairness of treatment, Section 4.3 below.
“In previous times we were obligated to tell our problems in either Amharic or English, and we had difficulty to express our problems” (Male participants, Kedida Woreda, SNNP Region)
4.2.3 Availability of “additional services”
Availability of “additional services” was also important, mentioned in half of all FGDs. Additional services included maternity and genecology units, laboratory services, ophthalmology and X-ray among others. Women and youth mentioned this as a measure of good quality health services more frequently than men. 12 (40% of women’s FGDs) specifically included family planning and maternity-related services as measures of a good health service. 4 (40%) of youth FGDs mentioned sexual health and contraceptive services. It is noteworthy that services related to HIV were mentioned only in FGDs with the youth. Additional services were also more often cited in municipal areas, possibly reflecting the higher expectations of urban dwellers.
4.2.4 Preventative medicine and health education
Preventative medicine and health education were mentioned in just over 41% of all FGDS. This includes various activities carried out by government health facilities including education programmes, house to house campaigns on, for example hygiene and sanitation, programmes on family planning, on disease prevention and on mother and child health. In general there was support for this service, see statement below:
“A good service of a health facility is measured by its ability to help mothers. If it gives family planning and guidance, if it enables women to give birth, if it distributes contraceptives to women which are friendly to their health, its service is a good service” (Female participants, Habru Woreda, Amhara Region)
17
“There was no health post here, but now we have a health post and it is developing. Now we are getting birth control pill, we are able to space between births, we learn about the use of breast feeding and preparing a balanced diet for our kids” (Female participants, Antsoki Woreda, Amhara Region) A health service that gives family planning and guidance, counselling and distribution of birth control contraceptives is giving a good service” ( Youth participants, Tahtay Woreda, Tigray). “The good thing is they consult, advise the youth and distribute condoms for free” (Youth participants, Arsi Negele Woreda, Oromiya Region).
“The health extension workers teach us about health, environmental sanitation and hygiene, a place for a latrine, hygiene of cooking utensils and cleaning the compound” (Female participants, Kedida Woreda, SNNP Region).
House to house services were particularly appreciated by women. Preventative services and health education were given greater prominence in rural areas with approximately half the FGDs giving preventive and health education services as a measure of a quality health service. In municipalities a fifth of FGDs gave this as an indication of good quality.
However there was also some minor criticism of health posts that were seen as only able to provide preventative services and health education, and not able to provide adequate treatment.
4.2.5 Professionalism, work ethics and attitude of health staff
The attitude of health personnel was clearly an aspect of importance to FGD participants as assessed by the number of mentions and the detail provided around the issue, and was actually mentioned on more occasions than, for example availability of medical professionals or medical equipment. The attitude of health professionals to potential patients was mentioned as a measure of good service quality by 41% of all FGDs.
“When they are properly welcoming, recognise and treat human beings, health workers are next to God in healing man from disease” (Youth participants, Hawassa Woreda, SNNP Region) “The other thing which makes a health facility the best is the ethical standard of health professionals. Staff members of a health centre should be co-operative, devoted and honest for their patients” (male participants, Habru Woreda, Amhara Region)
Youth (50%) and male respondents mentioned (47%) the attitude of health professionals as a measure of good quality more frequently than women (33%) Municipality residents also gave

18
greater emphasis to this aspect than those in more rural areas5. However rural residents frequently related that they were treated with less respect in urban facilities.
4.2.6 Other measures identified
A number of further measures were identified by approximately a third to a quarter of all FGDs. These were as follows:
Availability of health professionals
Availability of medical equipment
Upgraded and/or clean buildings
Emergency medical care and prioritisation (24 hour availability of emergency services, the prioritisation of critically ill or injured persons, priority for women in labour)
Aspects relating to cost.
The availability of health professionals, equipment and infrastructure appropriate to a health facility would be expected as measures of health service quality. However some of the explanations behind these measures of quality are illuminating. With regards to availability of professionals, although availability was seen in terms of numbers of staff or on occasion their frequent absences6, again the tensions between private and government health services were raised. FGD participants raised the issue of medical staff spending time in their private practice and resulting in their unavailability at government centres. This is illustrated by a number of statements below:
“The most important aspect of the government health facility is the absence of doctors from their government post. Because they work at private clinics they are not available at the hospital. This is seriously affecting the quality of the health service”. (Female participants, Awash Fentale Woreda, Affar)
“One thing that is affecting the quality of the health facility … is that doctors working at government centres have their own private clinics or they also work privately. This is creating a conflict of interest, they give (more) weight to their clinics than the governmental. This can be seen by their attendance, especially at the night shift” ((Male participants, City Woreda, Tigray) “As a result of the free market system, private clinics are functioning everywhere….. That is good (but) the point is, the professionals who work at government institutions (are) either owners or shareholders of these private clinics. …. He /she will be more interested in the private than the governmental sector. Those patients who could not get much time with their physician at the governmental health sector will have more time at his/her private clinic; this will make patients flow to the private clinics. Moreover physicians will prescribe medicines which are available at their pharmacies” (Male participants, City Woreda, Tigray).
5 An aspect of this topic is explored further under the question “Do you think all types of person are treated fairly at a health facility
or do you think some people are treated better than others?” See Section 4.3 below. 6 for example in town, away from kebele where the health facility is located

19
Availability of medical professionals was a concern expressed more frequently by male (43%) and youth (50%) participants than women (30%) though little difference was detected between municipality residents and others.
A primary concern under equipment was the availability of laboratory equipment allowing laboratory diagnosis and the presence of laboratory-based diagnosis for malaria and other diseases. This was expressed by male, female and youth participants in municipalities and other areas.
“The service of a health facility is a less than good service of it does not have a laboratory and X-ray service. To ask a patient how she feels is not enough for examination. Other than what the patient describes, the physician should have information from her blood film, stool examination and x-ray readings. The result of these activities is precise, they cannot be biased or lie like the patient sometimes does. Thus, if the physician examines a patient depending only on the words of her, he or she might be mistaken and can prescribe a medicine which could not help his or her patient. In such cases, examination without the aid of laboratory or X-ray results makes the service of a health facility a less than good service” (Female participants, Awash Fentale, Afar Region)
Availability of ambulance services and emergency communications was also a concern raised, particularly by male participants (20%) as compared with female participants (7%) and in municipalities (21%) as compared with other areas (8%).
Aspects relating to cost – expressed either as free treatment for all, free treatment for particular groups or affordable prices were raised by participants and particularly by youth participants. It was raised by 17% of all FGDs when discussing measures of health service quality, and just under a third (30%) of youth FGDs.
“There is no free medical care. A citizen should have access to free treatment. If no money no treatment. This is affecting the quality of health facility”. (Female Participants, City Woreda, Tigray Region)
During discussions around this issue, the unavailability of medical drugs at government health centres was again raised. The added expense of purchasing drugs at higher costs from private suppliers was again a concern.
“Since the poor, those with no money, are told to buy drugs from other stores, medicine should be supplied…… There is free HIV (blood) test in our city.” (Youth participants, Arsi Negele (municipality), Oromiya)
Others indicated that for the poor, the cost of accessing health services was beyond their means and sick persons were either not receiving treatment due to cost or relying on “visits to holy places” in the hope of a cure.

20
4.2.7 Measures of poor quality service
To triangulate measures of good quality identified, FGD participants were asked about measures that would indicate that a health service was less than good. The most frequently given measures of poor service are given in Table 5 below. A similar pattern of findings occurred with shortage or lack of medical supplies, particularly medical drugs cited most frequently as an indicator of poor service. This corresponds with the most frequently cited indicator of good quality service. Lack of professionalism, work ethics and a poor attitude among health staff was also cited by over half of the FGDs, a not dissimilar number to the number of mentions during discussion on measures of good health. Proximity of health facilities also gave a similar finding. However lack of preventative and education services was mentioned much less frequently as a measure of poor quality service than they were for good quality. Reasons for this are not totally clear but it appears that preventative and education services are appreciated where they exist, particularly by women, but are not seen as a core element of a good health service. Absence of “additional services” – maternity and family planning services was again highlighted as an indicator of the quality of health services by female and youth FGDs.
Table 5: Measures of poor service (health) identified by FGD participants
Indicator identified No. (& %) of FGDs identifying (70 FGDs)
No. (& %) of male FGDs identifying (30 FGDs)
No. (& %) of female FGDs identifying (30 FGDs)
No. (& %) of youth FGDs identifying (10 FGDs)
Shortage / lack of medical supplies
50 (71%)
23 (77%)
19 (63%)
8 (80%)
Lack of professionalism, work ethics and a poor attitude
40 (57%)
15 (50%)
19 (63%)
6 (60%)
Lack of proximity 32 (46%)
15 (50%)
14 (45%)
4 (40%)
Absence of “additional” services
27 (39%)
2 (7%)
13 (43%)
6 (60%)
Absence of preventative & health education service
6 (9%)
2 (7%)
2 (7%)
2 (20%)
4.3 Fairness of treatment
FGD participants were asked whether they thought all types of person were treated fairly at government health facilities or whether they thought some people were treated better than others. Overall, approximately half of all participants thought all persons were treated fairly and half thought some people were treated better than others, see Table 6. However men’s perception of
21
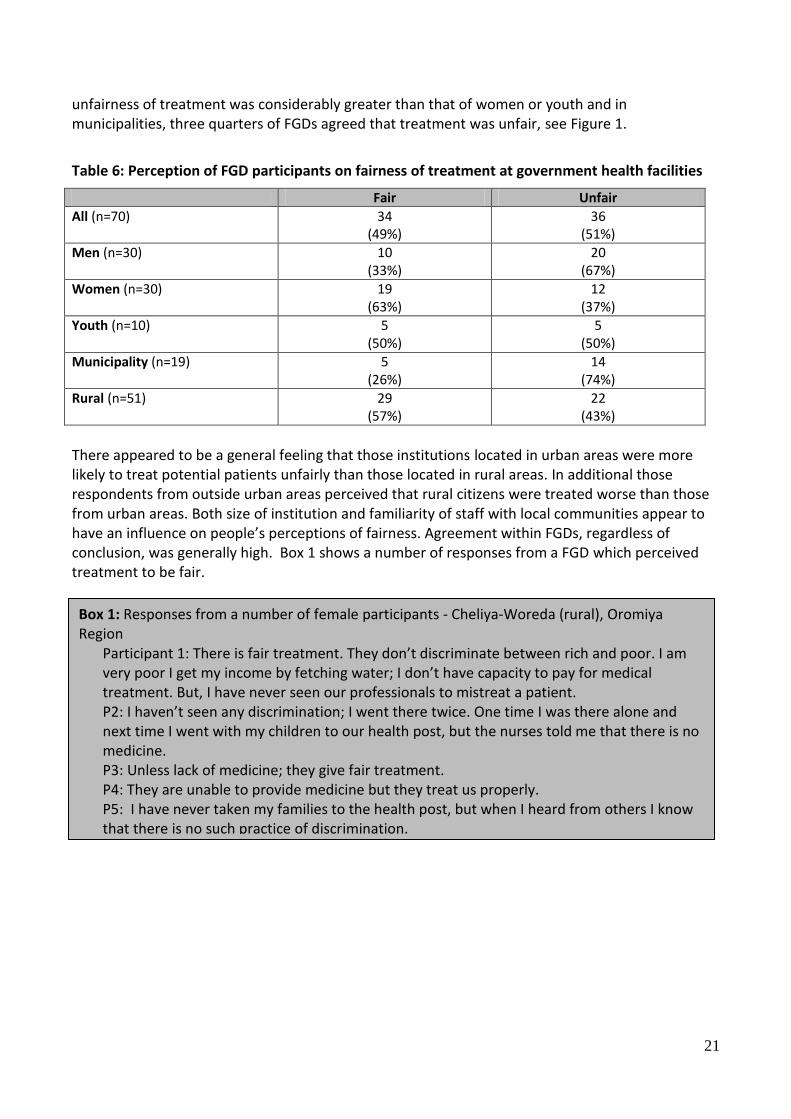
unfairness of treatment was considerably greater than that of women or youth and in municipalities, three quarters of FGDs agreed that treatment was unfair, see Figure 1.
Table 6: Perception of FGD participants on fairness of treatment at government health facilities
Fair Unfair
All (n=70) 34 (49%)
36 (51%)
Men (n=30) 10 (33%)
20 (67%)
Women (n=30) 19 (63%)
12 (37%)
Youth (n=10) 5 (50%)
5 (50%)
Municipality (n=19) 5 (26%)
14 (74%)
Rural (n=51) 29 (57%)
22 (43%)
There appeared to be a general feeling that those institutions located in urban areas were more likely to treat potential patients unfairly than those located in rural areas. In additional those respondents from outside urban areas perceived that rural citizens were treated worse than those from urban areas. Both size of institution and familiarity of staff with local communities appear to have an influence on people’s perceptions of fairness. Agreement within FGDs, regardless of conclusion, was generally high. Box 1 shows a number of responses from a FGD which perceived treatment to be fair. [this needs to be corrected]
Box 1: Responses from a number of female participants - Cheliya-Woreda (rural), Oromiya Region
Participant 1: There is fair treatment. They don’t discriminate between rich and poor. I am very poor I get my income by fetching water; I don’t have capacity to pay for medical treatment. But, I have never seen our professionals to mistreat a patient. P2: I haven’t seen any discrimination; I went there twice. One time I was there alone and next time I went with my children to our health post, but the nurses told me that there is no medicine. P3: Unless lack of medicine; they give fair treatment. P4: They are unable to provide medicine but they treat us properly. P5: I have never taken my families to the health post, but when I heard from others I know that there is no such practice of discrimination.

22
A number of further statements below illustrate why the treatment was seen as fair.
There is “no such thing as (no unfair service). No difference is considered - you are served based on the order of your card (registration card). No one has got unfair primary (first) service except if there is an emergency when everyone lets them get service first”. (Women participants, municipality, Arsi Negele woreda, Oromiya) “There is no partial treatment. All patients are treated equally. The poor and the rich are treated alike. They treat all similarly. The urban dwellers and the remote villagers are equally treated”. All were said to have agreed unanimously. (Women participants, Melka Belo-Woreda (rural), Oromiya) “They treat us fairly. There is not lopsided treatment except shortages of medicine”. (Male Participants, Wantawa Woreda (rural), Gambella).
Where treatment was seen as unfair, there was considerable strength of feeling reflected in discussion around this topic. A number of reasons were provided. The main causes of unfair treatment were seen as:
• Urban dwellers were treated better than those from rural areas
Figure 1: Perceptions of treatment fairness: men, women, municipalities, rural.

23
• Those who had relatives or other connections received better treatment • Those whose dress was more expensive, newer or cleaner were treated better than
those with old or worn clothing • Those who spoke the language of the staff received better treatment • Men received better treatment • Those who paid extra money received better treatment • Those who are also patients at private clinics received preferential treatment.
Participants’ statements below reflect the mood of those who felt treatment was unfair.
“There is one thing I saw - those who have better cloth are given priority service. But the poor cannot get instant service. At Yergalem hospital, I have seen an old women begging them for service in the Sidama language (but) they just ignored her, and gave priority to the rich men. Those who have relatives in the centre don’t spend any time to get service. They directly get service, they (the service providers) don’t listen to the poor … there is a person who died because of this reason. The poor are not given instant service, but this is given to the rich and those in power. It is one who has a relative in the centre that is given priority compared to the one who needs emergency service. One time they give priority service to higher government officials rather than to a farmer who needed emergency service. They don’t explain to the poor the type of the disease he is caught from”. (Youth participants, Hawassa City (Municipality with state functions, SNNP Region) “Yes, some are better treated than others. The physicians who work at the government health centre also work privately. Those patients who are their customers at their private clinic have more access to deal with them at the governmental health centre also. They give them priority. Some are better treated especially those who are frequently seen in their clinic, if they go to the health centre with another patient, their patient will get a fair treatment because of their contact with the physician at his private clinic. The rural man and urban man are not equal in treatment … We are uneducated and they are not co-operative thus we do not have a fair treatment. There is unjust treatment they differentiate between urban and rural. A good example is, one day when I took my relative to the hospital and he died there before we got treatment but they refused to give me his corpse. My relative who lives in the urban area came and then they allowed us to take the corpse. There is mistreatment. The urban dwellers are better treated than the rural”. (Male participants, Tahtay Koraro-Woreda (rural), Tigray Region) “At times there is partiality. Those from far away villages suffer to get the health workers’ attention and treatment. Acquaintances and relatives get priority in treatment. Those in close proximity to the health post are favoured more than others. A patient, unfamiliar to any of the health workers is denied proper treatment. Late comers get treatment in advance by contacting staff members privately. The town people (urbanities) get better treatment than rural villagers; (they) consider the rural villagers as illiterate. I went early in the morning and was the first to arrive at the health post. I couldn’t get medical attention till about the end of the day, for they were giving priority to the town people. Partiality

24
(favouritism) is practiced openly.” (Male participants, Fogera-Woreda (rural), Amhara Region).
Several groups of women felt men were treated better than men. One (male) participant also gave an example of poor treatment when it became known that his wife had visited another (governmental) health facility beyond their immediate area without official referral. Where participants perceived they had received inferior treatment, it was generally in terms of waiting times, with others being seen before them. Other aspects of poorer treatment were failure to prescribe drugs, inferior beds and lack of explanation. The point in health service procedures where unfairness occurred differed from FGD to FGD. A small majority believed that it was administrators and receptionists who favoured certain groups of people. However a substantial minority believed registration was fair but there was unfairness in the medical treatment received from health professionals.
4.4 Extra payments
Participants were asked whether during their last visit (to a government health facility) they had to make any extra payments for any reason. This question was originally phrased more bluntly asking participants whether they ever had to pay bribes. However, FGD team leaders felt such a question was overly sharp in the context of Ethiopia and the question was modified prior to piloting. However answers given did not relate to participants’ last visit to a health facility but to whether payments were made more generally (although the question asked about last visit). Overall 10 (14%) FGDs said that extra payments were made to health service staff, and 60 (86%) FGDs said no extra payments were made. The largest proportion of FGDs saying extra payments were made were those made up of 1) municipality citizens in contrast to those residing outside municipalities; 2) male and youth participants, see Table 7 and Figure 2. In 2008, with regards to health services, it is reported that “there are no corrupt practices in general7”. This would appear to suggest an increase in corrupt practices in the current round of data collection. However it should be noted that the questions involved differ and care should also be taken in interpretation as the higher number of mentions in 2010 may reflect a higher willingness to articulate malpractice rather than an increase in incidences per se. In either case the 2010 data indicates participants perceived informal payments to be relatively frequent, at least in the case of urban men. From the KII carried out in 2008, additional payments were perceived as more likely at hospitals. This is in line with perceptions expressed in 2010.
Table 7: Extra payments
Extra payments - Yes No extra payments made
All (n=70) 10 (14%)
60 (86%)
Men (n=30) 7 (23%)
23 (77%)
Women (n=30) 1 (3%)
29 (97%)
7 Tafesse, 2009.

25
Youth (n=10) 2 (20%)
8 (80%)
Municipality (n=19) 7 (37%)
12 (63%)
Rural (n=51) 3 (6%)
48 (94%)
It is noteworthy that “extra payments” were reported in 3 regions only and that two of these Oromiya and Somali Regions accounted for the majority of reports, see Table 8 below.
Table 8: Extra payments
Extra payments - Yes No extra payments made
All (n=70) 10 (14%)
60 (86%)
Affar Region (n=3) 0 (0%)
3 (100%)
Amhara Region (n=11) 0 (0%)
0 (100%)
Benishangul Gumuz (n=3) 0 (0%)
3 (100%)
Oromiya (n=22) 5 (23%)
17 (77%)
SNNP (n=14) 1 (7%)
13 (93%)
Somali Region (n=7) 4 (57%)
3 (43%)
Tigray (n=7) 0 (0%)
7 (100%)
Figure 2: Percentage of FGDs reporting that extra payments were made to access health facilities: municipalities and rural.

26
The following statements reflect responses associated with no payment of “extras”.
“We don’t experience such a thing. In former times, security guards at Kuyera Hospital … used to take payments from visitors of patients but this is not exercised these days. Nowadays (there is) no such shortcut” (Female participants, Arsi Negele woreda (municipality), Oromiya) “There is no such payment in government health facilities, no such kind of bribery…. We pay only for medical treatment” (Female participants, Melka Belo-Woreda (rural), Oromiya)
The following statements reflect responses associated with “Yes”, extra payments are made.
“Does it mean a bribe? It is not fair to deny the truth. It is exercised at hospital level. The doctor himself takes bribes. If you give an incentive to one doctor he could help in normal delivery, otherwise he will operate” (Male participants, Arsi Negele woreda (municipality), Oromiya) “Extra payment is not made public but it is made indirectly – that is always the norm or usual. For example, if the price of medicine costs 5 Birr they will raise the price to 15 Birr” (Male participants, Ambo City Administration, Oromiya) “For emergency care they ask us to pay. The hospital and health centre guards are corrupted. They ask illegal payment at the entrance” (Male participants, Habro Woreda (rural), Oromiya) “No proper treatment is provided unless money is given in a sort of bribery. The professionals won’t serve an expectant mother properly unless they are tipped in advance. If they are tipped they don’t make you buy gloves from outside. Participant 1: I have visited a hospital but I don’t know about the prevalence of bribery. Participant 2: I went to the big hospital and gave a bribe to get treatment ahead of another patient” (Youth participants, Jijiga (municipality with state functions), Somali Region)
A small number of FGDs also indicated that although they had no direct experience of making “extra” payments, they were aware of it happening but as it was rarely done openly, it was difficult to comment. Therefore there is a perception of it happening even if individuals are reluctant or unable to give examples from their own direct experience.
4.5 Health facilities: improving or getting worse?
FGD participants were asked whether they thought the quality of government health facilities was improving or getting worse. Despite a number of criticism and caveats, the majority (69%) of FGDs believed that health facilities were improving with similar percentages between men and women and differences between municipal (63%) and other areas (71%) relatively small. Youth FGDs gave the highest proportion of positive responses with 90% of youth FGDs believing the quality of health facilities was improving.

27
Table 9: Improving or getting worse?
Yes: Improving No: Getting worse
All (n=70) 48 (69%)
22 (31%)
Men (n=30) 19 (63%)
10 (33%)
Women (n=30) 20 (67%)
10 (33%)
Youth (n=10) 9 (90%)
1 (10%)
Municipality (n=19) 12 (63%)
7 (37%)
Rural (n=51) 36 (71%)
15 (29%)
In terms of Regions, every FGD in Affar, Benishangul Gumuz, Gambella thought health services were improving. In Tigray, the majority (6 FGDs, 86%) thought health services were improving. In Amhara and SNNP, two thirds of groups thought health services were improving while in Oromiya and Somali a smaller percentage saw improvement, 59% and 57% respectively.
4.5.1 Reasons given to explain improvements in health services
Participants were asked to give the reasons behind their responses. The number of FGDs perceiving health facilities to be improving and providing reasons was 48. Reasons for perceived improvement are summarised in Table 10 below.
Table 10: Summary of reasons given by FGDs for improvement
Reasons for assessing that health facility quality has improved All (n=48)
Improved service (general) 24 (50%)
Proximity (closer) 20 (42%)
Increased numbers of health professionals 11 (23%)
Better education of the public on disease prevention 10 (21%)
Availability of MCH 10 (21%)
Improved (increased) size of facility 9 (19%)
Better supplies of medicine 9 (19%)
House to house service 9 (19%)
Availability of family planning and contraceptives 7 (15%)
Availability of vaccines for polio & other diseases 7

28
(15%)
Positive changes in epidemic and disease prevention 6 (12%)
Efficiency of professionals 6 (12%)
Improved availability of water or electricity 5 (10%)
Improved supplies of medical equipment 5 (10%)
Presence of guest doctors 1 (2%)
Table 11: Top five reasons given by men for seeing improvements in health facility
Reasons for assessing that health facility quality has improved Male FGDs (n=19)
Improved service (general) 12 (63%)
Proximity (closer) 10 (53%)
Better education of the public on disease prevention 6 (32%)
Increased supplies of medicines 2 (10%)
Increases in medical equipment 2 (10%)
Table 12: Top five reasons given by women for seeing improvements in health facility
Reasons for assessing that health facility quality has improved Female FGDs (n=20)
Improved service (general) 7 (35%)
Proximity (closer) 6 (30%)
House to house services 6 (30%)
Increased supplies of medicines 6 (30%)
Increased numbers of health professionals 5 (25%)
Table 13: Top five reasons given by youth for seeing improvements in health facility
Reasons for assessing that health facility quality has improved Youth FGDs (n=9)
Improved service (general) 5 (56%)
Availability of family planning and contraceptives 4 (44%)
Proximity (closer) 4 (44%)
Increased numbers of health professionals 4 (44%)

29
Availability of MCH 2 (22%)
Women gave greater emphasis to house to house service in particular, reflecting an appreciation of services provided in the home. The youth gave greater emphasis to availability of family planning, advice and contraceptives. Male FGDs gave greater emphasis to health education on disease prevention than the other two groups. The statements below are typical of statements made to explain why participants saw the quality of health services as improving.
“It is improving because formerly there was no adequate medical service in our kebele. Although it can’t be said (to be) fully improved, it is somewhat better than before. There was no pit hall (latrine/toilet) usage before- defecation and urination happened on the fields. But now a-days, we use toilets because we have been practically implementing the health lessons we are taught. Malaria was claiming many lives before. It was a deadly killer because there was no vaccination. These days there is no malaria. Children are also vaccinated against various diseases and the government conducts constant follow ups. The health of mothers and children is improving as a result of the monthly vaccination. In former times, people were dying from epidemics. No one dies from epidemics these days in relation to the past, it has improved greatly. This is despite the absence of adequate medical equipment. The health post is upgraded to a building from a grass-thatched hut though it lack of equipment. These days we are capable of maintaining our personal sanitation due to the health lessons we are constantly taught. As compared to the previous time, it is better. However the absence of adequate medicine supplies, lack of medical equipment and the unavailability of well-qualified and skilled physicians are the major problems that have not yet been alleviated”. (Male participants, Were Jarso-Woreda (rural), Oromiya Region).
“It is improving, for example, pregnant mothers during delivery service they get surgery partially. There is fistula service delivery. Before, examination rooms were very few but currently they are expanding, and also there is endemic disease for Arbaminch rural areas called “VOLVO “for this they prepared an isolated class. It is some how getting better because it is related with BPR /Business process re-engineering. It is good that they are explaining. For the hospital there is a person taken as social worker to collect the suggestions of people and (suggestions) are combined. For women they provide good delivery service. At every aspect it is improving but there still exists unfair treatment.” (Female participants, Arba Minch (Municipality with state functions, SNNP Region) “It is improving because it has solved the problem of mothers and kids. Now, there are free pre and post natal treatments, distribution of contraceptives and babies’ vaccination. It is improving. It is improving because formerly we do not have any health professional here but now we have and when it up-grades to a health station, we will have more.

30
It is improving but it needs controlling. Is it only malaria and pain killer tablets that the government provides? It is improving because its accessibility has saved us from transportation costs when before transport had to be hired” (Youth participants, Tahtay Koraro-Woreda, Tigray Region)
. In comparing municipalities with rural areas, similar numbers of FGDs said quality of health facilities was improving: 63% compared to 71% respectively. However reasons for improvement differed between municipalities and other areas. Unsurprisingly proximity was given as a reason more frequently in rural areas. However rural areas gave increased supply of medicines as a reason in just over one fifth of FGDs while municipality FGDs only gave this as a reason in one FGD (8%). On the other hand municipality FGDs gave availability of MCH as a reason in a third of FGDs, this was under one fifth in rural FGDs. Rural FGDs gave greater weight to the availability of family planning services – 17% of rural FGDs as compared with only one FGD (8%) in municipality FGDs.
Table 14: Comparison of reasons for improvement: municipalities with rural area
Municipalities (n=12) Rural (n=36)
Proximity 4 (33%)
16 (44%)
Improved service 8 (67%)
16 (44%)
Increased supply of medicines 1 (8%)
8 (22%)
Increased numbers of health professionals
2 (17%)
9 (25%)
House to house service 2 (17%)
7 (19%)
Availability of MCH 4 (33%)
6 (17%)
Availability of family planning and contraceptive
1 (8%)
6 (17%)
Improvement in size 2 (17%)
7 (19%)
4.5.2 Reasons given to explain worsening of health services
Overall 24 (34%) FGDs concluded, after some discussion, that the quality of health services was getting worse. The most frequently sited reasons are given in Table 15.
Table 15: Summary of reasons given by FGDs for improvement
Reasons for assessing that health facility quality has improved All (n=24)
Inefficient health professionals / lack of health professionals 15 (62%)
Lack of medicines and medical supplies 13 (54%)
Lack of manners among health facility staff 6 (25%)
Lack of general service 6 (25%)

31
“No, it is not improving for example, if any patient went to the health post; the available medicine in the pharmacy is malaria and pain killer only. No curable medicine, thus, it is getting worse. It is not improving; there is no vital medicine that can be procured from governmental drug stores. Even those who have free medical care could not get medicines at the governmental health centres. We are purchasing medicines from private drug vendors. We say that government health service is not improving as there is no laboratory service; this also makes the service worse. In search of treatment we used to go to the zonal referral hospital. The doctors working in the government health centre also work privately. It is easier to get them at the private clinic than in the hospital. The private clinic has a private pharmacy and medicines are available there. Thus, a professional working for private and government health have a conflict of interest and as this affects the quality of service, and then it is getting worse….” (Male participants, Habru Woreda (rural) Amhara)
A third of FGDs held with women concluded that quality was getting worse, a similar figure to that of men. One FGD who generally thought that the quality of health care was improving noted that kebele officials discriminated against female-headed households, a situation they compared with support given by the NGO World Vision who were perceived as not discriminating in such a way.
Reasons given for worsening of quality were broadly similar across municipalities and rural areas, see statements below:
“At the beginning time of its establishment it (the health facility) didn’t provide any service, but since the past two years it have started delivering service. It is getting worse because there is no medical examination; we are not getting treatment, so that our children and the society at large have health problems. They always advise us to refer to the next health institution. It is getting worse; we are looking for private clinics to get treatment. There is no medicine available at the health post…. They haven’t delivered any medicine, we go to Goben to get medicines. The establishment of the health post pleased us, but we didn’t get any benefit from it. So, we don’t appreciate the government for this. The construction of the building is worth less without delivering a service”. (Female participants, Cheleya Woreda (rural), Oromiya region). “The health facilities are improving but the problem is unavailability of skilled health professionals. The problem at in-door service, particularly at ward level is improved. However the significant problem is unavailability of doctors. There are also nurses at the hospital who are inhospitable”. (Male participants, Ambo City (Municipality with state functions, Oromiya).
4.6 Measures of service quality more generally
Following discussions about health, focus group discussion was broadened out to talk about services more generally: FGD participants were asked which services were of the best quality and why, followed by a discussion on services of lowest quality and whether they believed there were courses of action open to them if they were not satisfied.
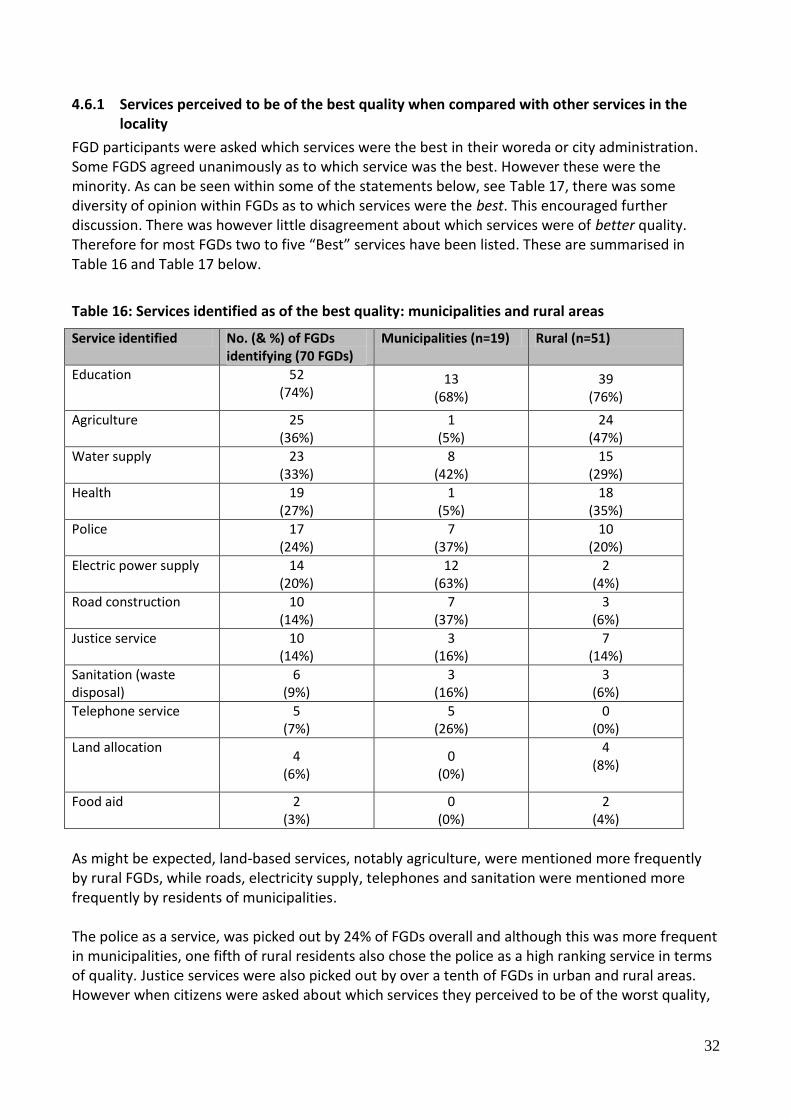
32
4.6.1 Services perceived to be of the best quality when compared with other services in the locality
FGD participants were asked which services were the best in their woreda or city administration. Some FGDS agreed unanimously as to which service was the best. However these were the minority. As can be seen within some of the statements below, see Table 17, there was some diversity of opinion within FGDs as to which services were the best. This encouraged further discussion. There was however little disagreement about which services were of better quality. Therefore for most FGDs two to five “Best” services have been listed. These are summarised in Table 16 and Table 17 below.
Table 16: Services identified as of the best quality: municipalities and rural areas
Service identified No. (& %) of FGDs identifying (70 FGDs)
Municipalities (n=19) Rural (n=51)
Education 52 (74%)
13 (68%)
39 (76%)
Agriculture 25 (36%)
1 (5%)
24 (47%)
Water supply 23 (33%)
8 (42%)
15 (29%)
Health 19 (27%)
1 (5%)
18 (35%)
Police 17 (24%)
7 (37%)
10 (20%)
Electric power supply 14 (20%)
12 (63%)
2 (4%)
Road construction 10 (14%)
7 (37%)
3 (6%)
Justice service 10 (14%)
3 (16%)
7 (14%)
Sanitation (waste disposal)
6 (9%)
3 (16%)
3 (6%)
Telephone service 5 (7%)
5 (26%)
0 (0%)
Land allocation 4
(6%) 0
(0%)
4 (8%)
Food aid 2 (3%)
0 (0%)
2 (4%)
As might be expected, land-based services, notably agriculture, were mentioned more frequently by rural FGDs, while roads, electricity supply, telephones and sanitation were mentioned more frequently by residents of municipalities. The police as a service, was picked out by 24% of FGDs overall and although this was more frequent in municipalities, one fifth of rural residents also chose the police as a high ranking service in terms of quality. Justice services were also picked out by over a tenth of FGDs in urban and rural areas. However when citizens were asked about which services they perceived to be of the worst quality,

33
see 4.6.2 below, these services also scored highly. This indicates the importance of the police and justice services to local people but also their highly variable quality in responding to the needs of local people.
Table 17: Services identified as of the best quality: men, women and youth
Service identified Male FGDs (n=30) Female FGDs (n=30) Youth FGDs (n=10)
Education 11 (37%)
23 (77%)
9 (90%)
Agriculture 18 (60%)
10 (33%)
4 (40%)
Water supply 9 (30%)
10 (33%)
3 (30%)
Health 8 (27%)
8 (27%)
3 (30%)
Police 4 (13%)
7 (23%)
3 (30%)
Electric power supply
5 (17%)
7 (23%)
1 (10%)
Road construction 0 (0%)
7 (23%)
2 (20%)
Justice service 7 (23%)
3 (10%)
0 (0%)
Sanitation (waste disposal)
4 (13%)
2 (7%)
0 (0%)
Telephone service 2 (7%)
1 (3%)
1 (10%)
Land allocation 1 (3%)
2 (7%)
1 (9%)
Food aid 1 (3%)
1 (3%)
0 (0%)
Overall, education was included among the best services by three quarters of all FGDs and was the service mentioned most frequently. This is in line with 2008 FGD findings8. Youth emphasised education in particular, the service they are likely to have had most contact with. They were consistent in seeing education as one of the best services. Women also mentioned education almost twice as frequently as male FGDs. Agriculture on the other hand was perceived as the best quality service by male FGDs almost twice as often as by women. At least one FGD said the agriculture service did not take women’s activities seriously. Around a third of all FGDs cited water among the best service, regardless of gender. Both women (23%) and youth (30%) placed the police service higher than their male counterparts (14%) although no youth FGD mentioned the justice service as among the services they saw as giving best quality. In the reasons given, women in particular stressed a feeling of vulnerability especially at night. In the youth FGDs, in one FGD it was the girls who said the police provided a
8 Tafesse, 2009

34
good service and in a second FGD in Jijiga City, the police were praised for being able to differentiate between an Ethiopian Somali and a Somalian. In Gambella, both the male and youth groups highlighted the police force’s work in providing security in a border zone. However one youth FGD, unprompted raised their thoughts on the police special force who they saw as beating and robbing people arbitrarily. However they said after public protest, some officers had been fired. Perhaps surprisingly women (23%) and youth (20%) FGDs gave greater emphasis to road construction as a service they perceived as being of high quality, in contrast to men (0%). Road construction was frequently associated with the safety net programme that had provided employment and road improvement.
Table 18: Statements made in relation to services identified as of the best quality
Service identified Statements
Education “The education sector is the best of all. Everyone has got the chance to learn. Classrooms are expanded from time to time. The education sector is of the best quality but despite the improvement of quality of education the number of dropouts and absentees every year is a common phenomenon. The education service is very fine. Our children are attending schools to become civilized and educated. So education is the best of all. Education of the best quality. Everyone is learning irrespective of age. There is a school in the neighbourhood. Our children are no more travelling long distances seeking education”. (Female participants, Semen Achefer Woreda, Amhara) … As to me, education is the best, because formerly children didn’t go to school and spent their time playing. Now they attend school…. I say education is the best quality, these days everyone has the chance to learn. In previous times everyone did not have such kind of chances; most of us were obligated to engage in business activities and the like. (Youth Participants, Wantawa Woreda, Gambella)
Agriculture (& education)
“It is the agricultural extension service which is better in service delivery, because by using fertilizers we are capable of getting up to 4 and 5 quintals now as compared to the 1 quintal we use to get without fertilizer. It is undeniable that the agricultural extension service is of the best quality. Because of (the introduction of) terracing systems there is an increase in production. The poor can’t afford to buy fertilizer and at the same time a farm land that adopts fertilizer won‘t bear fruit without it. This time the agricultural extension service is in good condition but the educational sector is a better one. Schools are opened in our doorsteps and children of school age are learning. Those farmers who practice terracing and compost are advantageous and those who apply fertilizers are at stake. Be this as it may, the educational sector is by far the best of all, because it is well-equipped with essential materials. We expend nothing on education, for it is free and the schools exercise strict control over our children. Schools don’t have shortages of efficient teachers and it is well-equipped in all aspects. In my opinion, the educational sector is the best because they are teaching us.

35
Education is in a very good condition. We encounter no shortage of efficient and dedicated teachers”. (Male participants, Were Jarso-Woreda (rural), Oromiya Region) I am at side of agricultural extension service, because it has contributed a lot in animal health care. The veterinary services rendered have helped to keep the health of our livestock. (Male participants, Wantawa Woreda, (rural) Gambella)
Water supply (& education)
“… The introduction of water supply using pipes is a great change for our locality. It has helped us in controlling water-borne diseases and above all we are capable of drinking pure water. Thus for me the best quality service is the service of water supply. …” (Male participants, Wantawa Woreda, Gambella) The service of water supply service is of the best quality. As you see our area is hot and sunny, we need water for everything. Formerly we were travelling a long distance (to) fetch water from the river. River water is not clean and is full of insects and parasites. But now we have a clean tap water here, we are free now from any disease that comes from drinking unsafe water. Thus, the water supply service is the best. We are highly satisfied with educational service. There is school in every village; all children who reached school age are going to school. Our children are not illiterate like us; they read and write, they are developing academically. Services of water supply and education are appreciated by people here. We are having clean drinking water; our clothes are washed by clean water, no disease. Education is changing the thinking of our children. They never travel a long distance in search of education. They also learned about cleanliness, about how contagious diseases spread, they come and tell us so, we appreciate the services of water supply and education (Female participants, Tahtay Koraro-Woreda, Tigray)
Health “The health service is a (quality) one despite the absence of accessible road. Mothers and children are provided with vaccinations. Formerly, only tablets were provided, but these days injections are widely used…. I personally place the health service at the top. Family planning has become practical as a result of provision of contraceptives. Of course the agricultural extension service is more or less a quality one, but the health service is the best of all. The health extension is upgraded to a health post and has expanded from one to two blocks. The increase of the number of physicians and heath assistants enables us to get fast and timely treatment and attention…. I give priority to the heath service. Malaria was our greatest problem. Nowadays we are relived from the mosquito bite due to the free provision of medicines and mosquito nets….” (Male respondents, Fogera-Woreda, Amhara Region)
Police (& justice) “The best quality service is the police service. It is the best because it has guaranteed our security. We can move everywhere at any time because there is a night patrol of the police. Moreover, the police have been given education on how to prevent crimes and control criminals. Thus, because it has made our kebele a peaceful zone, its service is of best quality. The best quality service in this Woreda is the service of justice. Formerly we use to go to Woreda and zone in need of justice but now justice has come to

36
our area. The Woreda has rotary court which comes to our area monthly. They see any case which has a legal touch and treat it according to the law. It is the best service for many reasons: it’s precise in its appointments, it solves cases within a short period of time, and it solves cases in the place where they emerged and above all its decisions are just. The best service is the service of justice. It is best because it gives solution instantly and this is good for the plaintiff and the defendant. Its decisions are just and are made referring to the civil code and the criminal procedures”. (Male participants, Enderta Woreda (rural), Tigray Region) “Police service is good. Because formerly it was too hard for a girl to move alone, but now after the police was set, we are safe, we can move any time to anywhere.” (Youth participants, Tahtay Koraro-Woreda (rural), Tigray) For the best quality service is provided by police. Because it has maintained peace and security of our area. As a border area we were having security problems, but now our police have controlled the situation and we are safe. (Male participants, Wantawa Woreda, Gambella)
Electric power supply (and transport)
“…there is also good road. Since there is a transport service, we can easily access it for any reason…. Since there is supply of electricity, we have got grinding mill in the former times we have been preparing flours with our hand”. (Female participants, Kofele-Woreda, Oromiya)
Road construction (& sanitation)
“The road built by Safety Net program is very good. They are widening the narrow roads and covering it by sands… (Youth participants, Kochire-Woreda, SNNP) The road sector is the best quality. Roads are being constructed. The other one is we have the opportunity to get financial support on the way to engage in small business activities, and organized under ‘IGAs’ (income generating activity). I say the road sector is best because expansion activities are being carried out. There is also electricity supply. In darkness, people used to be stabbed by looters….. (Women participants, Ambo City (Municipality with State functions, Oromiya)
Justice service (& police & education)
“The best quality service in this Woreda is the service rendered by the kebele’s social court. The presence of the kebele’s social court has helped us in minimizing the former hard troubles we were facing. For example, formerly if a dispute were to arise between married couples,and it was treated by formal courts, it would end up by appreciating the one side and punishing the other side, thus they will be divorced. But now, since such cases should be treated in the kebele as a first instance, in the social court through arbitration, they will restore peace and turn the hostility to the other side and hence the couples will save their a marital relationship. The best quality service is the service of the social court. Members of the said court are dwellers of our kebele. They are elected by the people of the kebele for their legal knowledge and high social relationship. It should be known that these members of the social court are giving a voluntary service. We are getting a good service from those who get nothing in return. The best quality in our Woreda is the educational service. The 1st, 2nd and

37
preparatory schools are sited in our locality. This means our children will not travel a long distance in search of education and we never spend a penny for transportation cost. The other best quality service for me is the electricity supply service. Though there is a temporary termination to the extension of electric line in every Woreda (there) is an improvement. The best quality in our Woreda is the educational service. The teaching and learning process is going smoothly and a great effort is made to introduce science and technology to the young generation. The best quality of the education service is justified by the contributions it makes to produce well disciplined, ethical students in order to shape the behaviour of the students in the way the state and any society needs. There is a monthly meeting between parents and the school leaders. In every meeting session a progress report will be presented by the school leadership. Monthly we will know the academic status of our children, their attendance and their general condition as a student. Moreover the best quality of education can be expressed by the tutorial class it gives on Saturdays and Sundays for the female students. This action is affirmative, because after school time most girls are engaged in house works, thus, to give a tutorial class at weekends is to free our girls from abuse. Police service is good because it established its station in our locality, so we get immediate security service. Police service is good for it brought a behavioural change of the idle youth who were a social scum. City administration has done a good service in organizing the unemployed youth and made them successful self-employed individuals…”. (Female participants, Adigrat Woreda (municipality), Tigray
Sanitation (waste disposal)
I prefer the sanitation service. Trash (waste) collectors are hired and there are vehicles, which transport the collected waste materials to dumping areas. For me sanitation and water services are good. (Women participants, Ambo City (Municipality with State functions, Oromiya)
Telephone service The telephone service is very fine it has given a credit service to the poor which they should pay in 3 years time paying on instalment basis. (Female participants, Bahir Dar, City (Municipality with State Function), Amhara.
Land allocation Land distribution is good because it has given equal rights to male and female. Any one who want to make life by tilling the land he/she is welcomed. (Youth participants, Tahtay Koraro-Woreda, Tigray)
Food aid Safety Net is the best program for our local society. They aid people with shortage of money. They also organize idlers to help them to get into business. They give aid six times per annum for people in poverty. They save us from being lost. Whenever our coffee didn’t give us good product, government aided us in our problems. (Female participants, Kochire-Woreda (rural), SNNP)
Over all services a number of aspects were repeated regardless of the service. Equality of treatment and access, the involvement of local people and the provision of feedback, for example, on a child’s education, were aspects of importance as expressed in FGDs.

38
4.6.2 Services perceived to be of the lowest quality when compared with other services in the locality
Participants were asked which services were of the lowest quality in their woreda or city government.
Table 19: Services identified as of the lowest quality: municipalities and rural areas
Service identified No. (& %) of FGDs identifying (70 FGDs)
Municipalities (n=19) Rural (n=51)
Water supply 40 (57%)
10 (53%)
30 (59%)
Electricity 34 (49%)
12 (63%)
22 (43%)
Road construction 26 (37%)
7 (37%)
19 (37%)
Agriculture 23 (33%)
5 (26%)
18 (51%)
Justice service 19 (27%)
9 (47%)
10 (20%)
Police 17 (24%)
7 (37%)
10 (20%
Education 17 (24%)
1 (5%)
16 (31%)
Health 14 (20%)
1 (5%)
13 (25%)
Land allocation 7 (10%)
4 (21%)
3 (6%)
Telecommunications 7 (10%)
0 (0%)
7 (14%)
City administration 5 (7%)
4 (21%)
1 (2%)
For water supply and road construction, municipalities and rural areas were broadly similar in their perceptions of the lowest quality services with over half and over a third of FGDs citing these two services respectively. Narratives relating to water supply in particular indicate that FGD participants feel they have raised their water problems repeatedly but, in many cases, with little response. Only 1 FGD in a municipality perceived education to be the service of the lowest quality; education was seen as the worst service by almost a third of rural FGDs. No municipalities gave telecommunications as the worst service; all FGDs perceiving telecommunications as the worst were outside of municipalities. Electricity was seen as the lowest quality service more frequently in urban areas but even in rural areas a large number of FGDs included electricity as the service they perceived to be of the lowest quality, due to both unavailability and unreliability. One FGD in SNNP felt that priority given to town was the cause of their frequent interruptions in power. City administrations were perceived to be particularly poor service providers in Municipalities without State functions (2 FGDs, 40%). However numbers are probably too small to draw firm conclusions. The instances where city administrations were perceived to be of low quality were
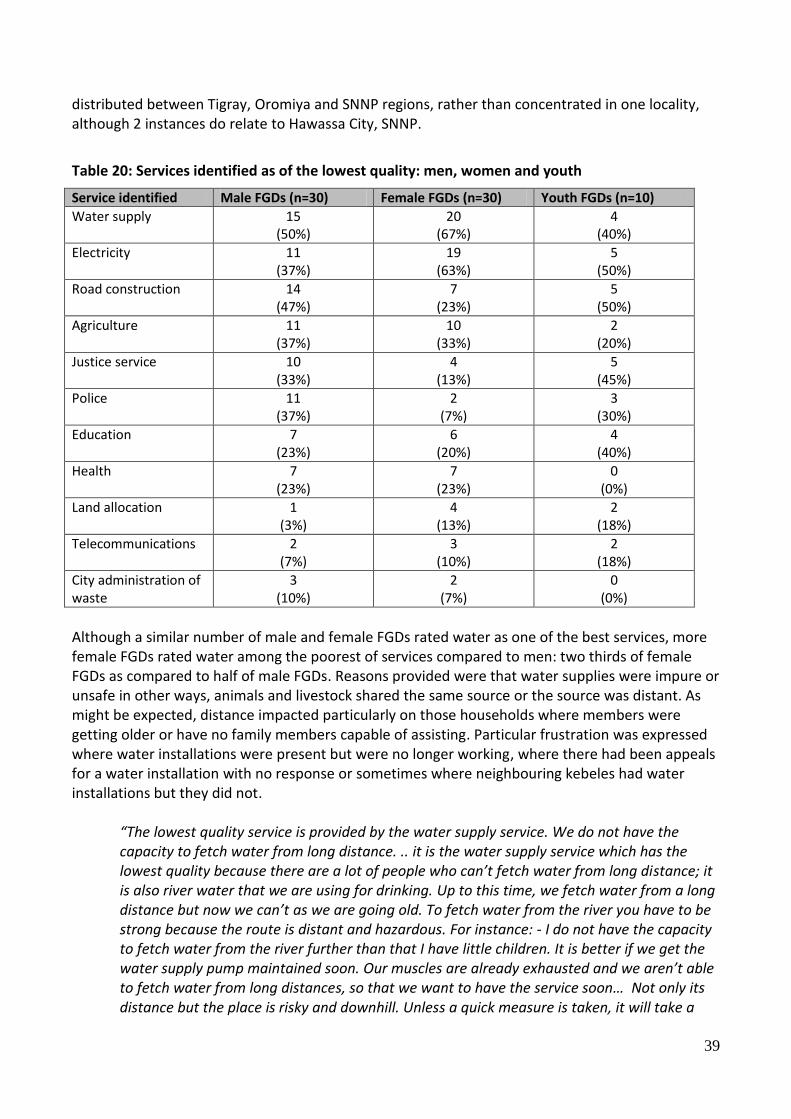
39
distributed between Tigray, Oromiya and SNNP regions, rather than concentrated in one locality, although 2 instances do relate to Hawassa City, SNNP.
Table 20: Services identified as of the lowest quality: men, women and youth
Service identified Male FGDs (n=30) Female FGDs (n=30) Youth FGDs (n=10)
Water supply 15 (50%)
20 (67%)
4 (40%)
Electricity 11 (37%)
19 (63%)
5 (50%)
Road construction 14 (47%)
7 (23%)
5 (50%)
Agriculture 11 (37%)
10 (33%)
2 (20%)
Justice service 10 (33%)
4 (13%)
5 (45%)
Police 11 (37%)
2 (7%)
3 (30%)
Education 7 (23%)
6 (20%)
4 (40%)
Health 7 (23%)
7 (23%)
0 (0%)
Land allocation 1 (3%)
4 (13%)
2 (18%)
Telecommunications 2 (7%)
3 (10%)
2 (18%)
City administration of waste
3 (10%)
2 (7%)
0 (0%)
Although a similar number of male and female FGDs rated water as one of the best services, more female FGDs rated water among the poorest of services compared to men: two thirds of female FGDs as compared to half of male FGDs. Reasons provided were that water supplies were impure or unsafe in other ways, animals and livestock shared the same source or the source was distant. As might be expected, distance impacted particularly on those households where members were getting older or have no family members capable of assisting. Particular frustration was expressed where water installations were present but were no longer working, where there had been appeals for a water installation with no response or sometimes where neighbouring kebeles had water installations but they did not.
“The lowest quality service is provided by the water supply service. We do not have the capacity to fetch water from long distance. .. it is the water supply service which has the lowest quality because there are a lot of people who can’t fetch water from long distance; it is also river water that we are using for drinking. Up to this time, we fetch water from a long distance but now we can’t as we are going old. To fetch water from the river you have to be strong because the route is distant and hazardous. For instance: - I do not have the capacity to fetch water from the river further than that I have little children. It is better if we get the water supply pump maintained soon. Our muscles are already exhausted and we aren’t able to fetch water from long distances, so that we want to have the service soon… Not only its distance but the place is risky and downhill. Unless a quick measure is taken, it will take a

40
human life. The place where we fetch water (river) is risky, it always horrifies us that it might take our life since it is sliding and has downhill location”. (Female participants, Mao Komo Special Wereda (rural) Benishangul-Gumuz. “The service, which is of the lowest quality, is the water supply service which was built by large amount of money but it is not still functioning…” (Male respondents, Cheliya-Woreda, Oromiya)
“The lowest quality service was provided by water supply service that means in our keble there is a serious water shortage problem. To solve this problem the water development office comes on a yearly basis and investigates the problem but no response is delivered still. In our adjacent kebele there is supply of water but in our kebele there is no water supply service. The people used to drink pond water….For us the lowest quality service is regarding water because we are exposed to water borne disease, the other one is we have no electricity provision but the official come to consult people during election is going to happen. However, The consultation left … after the election had taken place. … Since 2002 (E.C) they consulted us to establish a water well but it is not implemented - that is why we give the water supply service as lowest quality. (Male respondents, Kedida Gamela-Woreda (rural), SNNP).
Women, and to a lesser extent youth, gave greater significance to electricity supplies than male FGDs. This would appear to be related with security concerns, as illustrated by a woman in Bahir Dar who said that “since there is no electricity in our area which is a forest one, we are exposed to danger”. Both the police and justice service are seen as a service of low quality by a third of male FGDs, a higher proportion than for women. Youth FGDs also cited these services as amongst the poorest in almost a third (police) and almost half (justice) respectively, of all FGDs held with young people. There would appear to be two main and opposite reasons for rating the police service as among the lowest service. The first reason is due to the absence of a police and a perceived increase in crime as a result, the second reason is related to poor behaviour, corruption and lack of fairness in the police’s treatment of the public. However the majority fall under the latter reason. In terms of the justice service, two main reasons are given: lack of fairness in treatment including the perception of the need for bribes under the justice system, and what are seen as unnecessary and unhelpful delays in cases coming to court. Although education was given by a high proportion of youth FGDs as among the best services, its mention also under those of lowest quality highlight the importance that the youth FGDs give to education. This apparent contradiction is explained in terms of the quality (for example insufficient teachers and text books) rather than in terms of reach and numbers of schools. Those rating education among the worst services emphasised aspects of quality as reasons for their assessment.

41
Table 21: Statements made in relation to services identified as of the lowest quality
Service identified Statements
Water supply The water service is of the lowest quality. Water and education are inseparable. As water is a backbone to life, education is the pupil of the eye. However, the worst of all services is the water service. In former times, we were served with a water pump. Nowadays, there is no water in our kebele. Since the past four years, we have been using water collected from running water during the rainy season. Those who have relatives in Jijiga fetch from Jijiga travelling 14 kms. Those who own donkeys can fetch water from long distances. The water problem has been talked about repeatedly without solution. (Male participants, Jijiga Woreda, Somali Region)
Electricity With regard to electricity, there is improvement in all Ethiopia, But in Negele they shut it down as they like. There is a rumour that it is when Shashamane face shortage of electric supply that Kuyera and Arsi Negele are sacrificed. (Youth participants, Arsi Negele (municipality), Oromiya) Payments we make for electricity consumption are also unfair. While some pay 30-40 birr per month others who consumed the same pay 650 birr. “I know a women who paid a bill by selling her jewellery” (Female participants, Arba Minch (municipality), SNNP)
Road construction For me the lowest quality service is road because the road, established from Durame to Damboya, gives no road transportation service and nobody can see to maintain it. The higher officials of the zone always use the road but they don’t give due attention to maintain it. Finally we maintained it with full community participation. (Male participants, Kedida Gamela-Woreda, SNNP) The society cleared the land for road by hands, but when we were left with 5 kilometers(uncompleted) they demoralized us by saying it is not a road . They (the government) didn’t build it for us and still we are living with transportation challenges. This is why our members migrate to other places. Cars which transport aid during drought could not come when it rains. (Youth participants, Teltele-Woreda, Oromiya)
Agriculture The lowest quality service in this Woreda is the services of agricultural extension. We are pastoralists; we wander from place to place in search of grass land for grazing of our cattle. Our oxen have never been used for ploughing, we ourselves do not plough. The lowest quality service is the agricultural extension service, they have totally forgotten us, and there is no service which comes from the office, no animal health care, no agricultural training. They brought a plough and oxen, and then they forgot us. They have an office here but they will never be available even for a week. They are always at the Woreda, thus, the lowest quality services is the agricultural extension service (Male participants, Awash Fentale, Affar) We have got services of both agricultural and health extension. But none of them provide full service to us. We are not happy at all on agricultural extension Agents don’t ask what we did or how we did it. They don’t ask women they

42
only ask men. (Women participants, Bona Zuria-Woreda (rural), SNNP)
Justice service Criminals (suspects) are released by bribe - there are problems around the court… (Male participants,Teltele-Woreda (rural), Oromiya) The service of the lowest quality is the service of justice. There is a problem in decision making; there is no fast and reliable service. E.g. my neighbours quarrelled over territory. Their case has taken more than two years. The service of the lowest quality is the service of justice. There is a saying which says a ‘’justice delayed is a justice denied’’. There is a problem in deciding in time. E.g. There is a case of husband –wife here, their case took 8 years and yet is not finalized. In search of justice if a poor and a rich one go for justice, the rich is victorious. (Youth participants, Tahtay Koraro-Woreda, Tigray) Both on woreda and kebele level there is no justice. They didn’t solve our problems in time. While we give them application for justice, they are not responding on time. When a certain crime is committed and we apply for them, they didn’t accept us fairly and see us equally. People who have money and bribe them can be seen as superior where as those who do not have and can’t bribe as inferior. There is a great problem with the Woreda court. Once the judge decided that my case cannot be seen in the local court. They send us to other higher courts, but we are losing our properties. When we claim for the right to reapply in the same area, they respond that once we get the response from the local court the right to reapply is only be accepted by higher court. (Male participants, Bona Zuria-Woreda (rural), SNNP)
Police The police service is of the lowest quality to maintain peace between quarrelled persons and to track criminals. They insist on money from individuals to perform their task properly as a bribe. (Women participants, Ambo City, Oromiya) As compared to other regions, there is nothing that could be considered as a good service. We have problems of roads and police service. The police are illiterate. They kick those who don’t speak Somali language. I faced this problem although I told them that I belonged to another region. Police service is the lowest quality. They ask for an identification card and thereby intimate you as being an insurgent. They know nothing, for they are country (rural) men. They beat you when they want to. The police problem is that many of them are illiterate. They inspect the ID turning it upside down. Holding the ID, they ask your identity. (Youth participants, Jijiga City (Municipality with state functions, Somali Region) I feel pain when I remember what the police and court do to us. You can’t finish if you write on all your papers. The police do not accept our application. But they cooperate when the service seeker is rich. If you complain or talk they will break you. They (police) beat you either in your own house or outside. If you go to the court, they insult you. If you prosecute someone, you cannot win the case
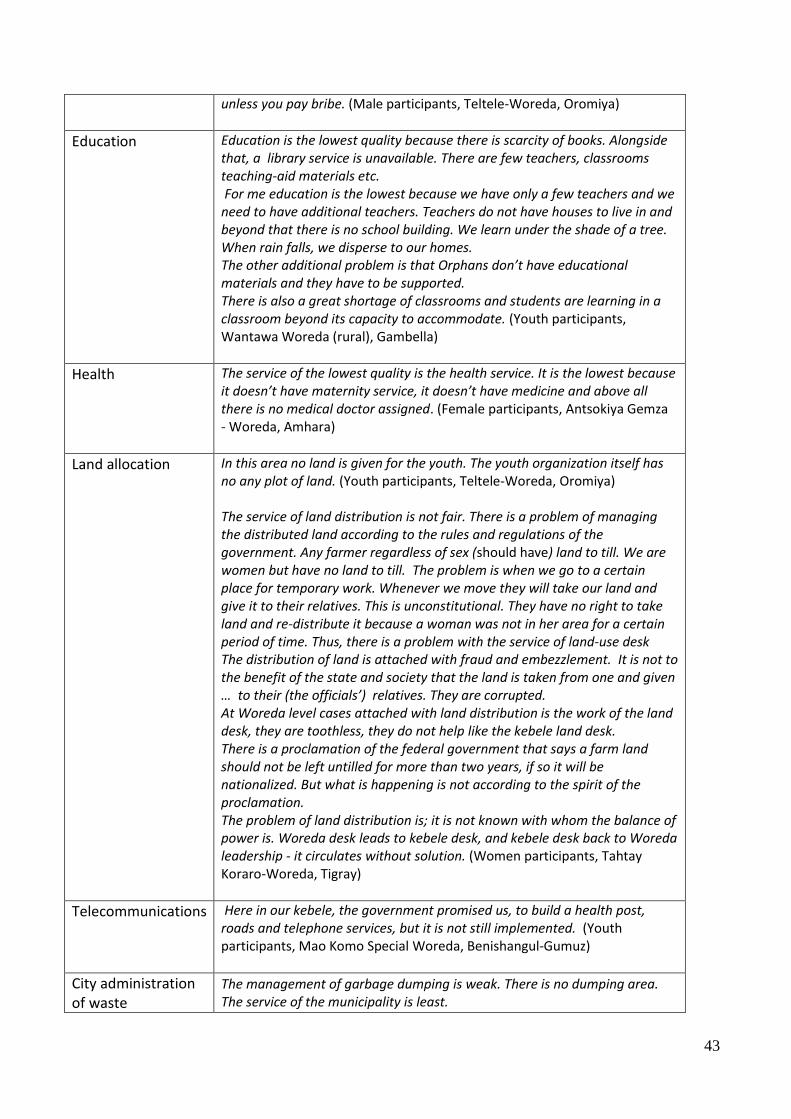
43
unless you pay bribe. (Male participants, Teltele-Woreda, Oromiya)
Education Education is the lowest quality because there is scarcity of books. Alongside that, a library service is unavailable. There are few teachers, classrooms teaching-aid materials etc. For me education is the lowest because we have only a few teachers and we need to have additional teachers. Teachers do not have houses to live in and beyond that there is no school building. We learn under the shade of a tree. When rain falls, we disperse to our homes. The other additional problem is that Orphans don’t have educational materials and they have to be supported. There is also a great shortage of classrooms and students are learning in a classroom beyond its capacity to accommodate. (Youth participants, Wantawa Woreda (rural), Gambella)
Health The service of the lowest quality is the health service. It is the lowest because it doesn’t have maternity service, it doesn’t have medicine and above all there is no medical doctor assigned. (Female participants, Antsokiya Gemza - Woreda, Amhara)
Land allocation In this area no land is given for the youth. The youth organization itself has no any plot of land. (Youth participants, Teltele-Woreda, Oromiya) The service of land distribution is not fair. There is a problem of managing the distributed land according to the rules and regulations of the government. Any farmer regardless of sex (should have) land to till. We are women but have no land to till. The problem is when we go to a certain place for temporary work. Whenever we move they will take our land and give it to their relatives. This is unconstitutional. They have no right to take land and re-distribute it because a woman was not in her area for a certain period of time. Thus, there is a problem with the service of land-use desk The distribution of land is attached with fraud and embezzlement. It is not to the benefit of the state and society that the land is taken from one and given … to their (the officials’) relatives. They are corrupted. At Woreda level cases attached with land distribution is the work of the land desk, they are toothless, they do not help like the kebele land desk. There is a proclamation of the federal government that says a farm land should not be left untilled for more than two years, if so it will be nationalized. But what is happening is not according to the spirit of the proclamation. The problem of land distribution is; it is not known with whom the balance of power is. Woreda desk leads to kebele desk, and kebele desk back to Woreda leadership - it circulates without solution. (Women participants, Tahtay Koraro-Woreda, Tigray)
Telecommunications Here in our kebele, the government promised us, to build a health post, roads and telephone services, but it is not still implemented. (Youth participants, Mao Komo Special Woreda, Benishangul-Gumuz)
City administration of waste
The management of garbage dumping is weak. There is no dumping area. The service of the municipality is least.

44
There is a dumping area but it is far from the city. It is near the hospital, they agreed to change it. (Male Participants, Adigrat woreda, (Municipality), Tigray)
The numbers of mentions in the above however, do not necessarily reflect the strength of feeling or the amount said on a subject. Justice services, the police and the provision (or lack of) water provision were discussed in greater detail than other subject. As with the discussion around services of best (better) quality, there are a number of common themes found across diverse services. These are:
Lack of service, delays in service provision
Raised expectations and failure to keep promises
Lack of fairness
Lack of trust
Lack of appreciation of local knowledge, lack of consultation
Lack of explanation or understanding, lack of clarity on system’s hierarchies
4.7 Action taken if not satisfied with a service
Participants were asked if not satisfied with a government service what could they do. Overall three quarters of the FGDs believed there was something they could do, while 23% believed there was nothing or little that they could do, see Table 22. A similar finding was given in 2008 where the majority of FGDs believed accountability systems did exist9. Women were less likely to believe that there was something they could do if dissatisfied with a service, as compared with other groups, Figure 3.
Table 22: If not satisfied with a service, what can you do
Something can be done (% in brackets)
Not able to do anything or very little
All (n=69) 53 (77%) 16 (23%)
Men (n=30) 25 (83%) 5 (17%)
Women (n=29) 1 20 (69%) 9 (31%)
Youth (n=10) 8 (80%) 2 (20%)
Municipality (n=19) 14 (74%) 5 (26%)
Rural (n=50) 39 (78%) 11 (22%)
9 Tafesse, 2009

45
Reasons given for either believing action could be taken or no action was possible were illuminating. Overall FGDs and all responses, 72% of FGDs saw appealing to higher (government) authorities as the action most likely to be taken – a substantial proportion of those who responded in the affirmative. 14% would turn to other service providers, if they were available, 13% would use community elders or leaders to mediate and 5% would appeal to a spritual or supernatural power. Overall FGDs and all responses, 4% of FGDs believed no action could be taken because the relevant authorities were corrupt, 14% because the authorities have not answered complaints, 7% because they believe the authorities can do nothing, 6% because they feared retribution. Lack of trust in authorities, fear of retributuion and a belief in the corruption of officials was expressed more frequently in municipalities than in rural areas, although overall numbers are relatively small. There are a number of possible explanations for this, not altogether clear from the narratives collated from FGDs: i) that there is more corruption in urban areas, ii) respondents felt less exposed in voicing these concerns in urban areas.
Figure 3: Percentage of FGDs believing something can be done if not satisfied with service / nothing can be done

46
A number of issues were highlighted in the results and discussion. Rural women in particular were less able to turn to alternative service providers, while the youth were more likely to use elders as mediators for their concerns. Women are also a little more likely to not appeal as there complaints are not heard and to appeal to supernatural powers. They also had greater fear of retribution. Use of mediators was also higher in municipalities than in rural area, possibly relating to higher numbers of educated and high status individuals in urban areas. However these results are also influenced by the municipalities in Somali region whose respondents come from a pastoralist tradition. It should also be noted that within FGDs, there was often a diversity of opinion, frequently dependent on varied past experiences of taking action, see statements in Table 24 below.
Table 23: If not satisfied with a service, what can you do – actions/reasons provided
Action / reason for taking action
All (n=69) Men
(n=30) Women (n=29)
Youth (n=10)
Rural (n=50)
Municipality (n=19)
Appeal to the higher officials /government
authority
50 (72%)
23 (77%)
19 (66%)
8 (80%)
36 (72%)
14 (74%)
Use alternate service providers, if any
10 (14%)
7 (23%)
2 (7%)
1 (10%)
8 (16%)
2 (11%)
Consult through mediator prominent individuals or elders.
9 (13%
3 (10%)
4 (14%)
2 (20%)
5 (10%)
4 (21%)
Appeal to super natural power
5 (7%)
1 (3%)
3 (10%)
1 (10%)
4 (8%)
1 (5%)
Not appealing to any authority, because most of complaints
have not been answered
10 (14%)
4 (13%)
5 (17%)
1 (10%)
7 (14%)
3 (16%)
Not appealing, because fear of
retribution
4 (6%)
1 (3%)
3 (10%)
0 (0%)
1 (2%)
3 (16%)
Not appealing because they (the authorities)
can do nothing
5 (7%)
2 (7%)
2 (7%)
1 (10%)
5 (10%)
0 (0%)
Not appealing because authorities are corrupt
3 (4%)
1 (3%)
1 (3%)
1 (10%)
1 (2%)
2 (11%)

47
A number of typical statements are given below.
Table 24: If not satisfied with a service, explanations given by a sample of FGDs
Action / reason for taking action
Reasons given
Appeal to the higher officials /government
authority
If the kebele officials fail to give us positive responses, we appeal to the woreda administration. There is no negative response from the officials. They promise to fulfil our demands with an excuse of the need to buy time. We have the tradition of appealing to officials to fulfil our burning demands. We appealed to get the electricity service and now we have become beneficiaries, though it is not available to all villagers. Except the health and water services, the rest are fine. We are always appealing though our demands are not fully realized. We appeal to concerned officials and we get positive responses. For instance, there was no library in our school. We now have a library as a result of the positive response to our demand. (Male Participants, Were Jarso-Woreda (rural), Oromiya) We are women, whenever we are dissatisfied with the services or whenever we feel that our rights are abused this way or that way, we apply to the women’s affairs office. We have confidence in this office because it stands on our behalf everywhere. Let me give you example for this – I and my friends gave our witness to a Woreda court on the case of husband and wife dispute. Our witness was genuine, we told the truth of what we knew and what we saw but the court twisted it and accused us of a false witness. Then we applied to the women’s affairs office and its head did all the necessary contacts and she made the case to be seen by a higher court through plasma. After all the necessary judicial procedures we were set free, thanks to the office. (Female participants, Adigrat (Municipality without state functions), Tigray
If we are not satisfied by a service, we appeal to the responsible authority. We are not satisfied with the services of agricultural extension and we applied to Woreda for a qualified development agent, however, we do not expect a positive result because government civil servants do not want to come to our area because there is no supply of water. (Youth participants, Antsokiya Gemza - Woreda (rural), Amhara
Use alternate service providers, or return
empty handed
P1: If I don’t find (medicines)when I go to medical centre, and the medicines are lost I prefer to look for other areas. … P2: For example: - when I go to health centre they tell us that medicines are not available. I went back to my home. (Youth participants, Mao Komo Special Woreda (rural), Benishangul-Gumuz)
Consult through mediator prominent individuals or elders.
Though village elders appealed to officials about the water problems, they couldn’t get a solution. As a result, the people prefer to buy water than appealing to officials. (Women participants, Jijiga City (municipality with

48
state functions), Somali Region.
Not appealing to any authority, because
most of our complaints have not
been answered
When we are not satisfied by a service of any office we do nothing because we know that we will not get any solution. If we apply to the Woreda they say apply to the kebele. The kebele is here with us, we used to report and they know what we are going to report. There is no solution. Thus, we have left off applying to any authority (Male participants, Awash Fentale, Affar) .
Not appealing, because authorities
are corrupt
If the judge is corrupt, what can we do? Except pray (appeal) to God? So far we have done nothing. What can we do except to keep silent? If no service is given from the health centre, we will go back home or we go to private centres. Once there was a person who had land. He also had a license for his land that he pays tax with. But the office of the mayor gave this land to another judge. When the owner marked his land, he was arrested and they destroyed what he built. Later, he was forced to sign a letter that states that the land does not belong to him. He could not get justice. We complained but we don’t think that there will be a change. Since there is corruption at all a level, I don’t expect any change from them. If we appeal to the Woreda, they just add up to what is already decided by the Kebele. They have connection up to the Zone. Hence our complaints have no result. (Male participants, Kofele-Woreda (rural), Oromiya)
Not appealing because they (the authorities)
do nothing
When we want to apply, we apply to the woreda administration. The budget (funds) didn’t reach us; it was distributed among the woreda offices. They shared it among themselves. When higher officials came here for consultancy we do not say anything about our problems. Because we have a fear of losing our benefits that we get from local officers. Taking measures on the works of the administration is nonsense for us. Previously, we told our problems to higher officials who came from woreda for consultancy, but they wrote our problems on papers and didn’t give us any solution. As we have said earlier we may or may not have problems but there is one saying. “A man lost a sheep. H asked his friend to accompany him in searching for the sheep. After a while they heard the sound of the sheep in the friend’s house. The friend is the thief “ , for our problems they are like the mentioned friend. People who come from woreda always talk about their own cases; they do not give any attention for our cases. When we claim for something, they wrote it and took it without any response. We know that they do not report to their bosses. It remains with themselves. We usually ask the woreda for solutions, but they are not responsive. “God … hear cries of people”. When the land dries we cry for God to give us rain. Regarding the administration our appeal is heard by the kebeles. Nobody came and asked us like you did. (Male participants, Bona Zuria-Woreda (rural), SNNP)
Not appealing because of negative
consequences
We appeal (in court) But there is a chain from militia to administration. The best thing is to stay at home. We just leave it to God, for there is no one either to take our opinion or

49
who can implement it….Police insult us; no solution is available for this so, we just go home (Youth participants, Hawassa City, SNNP)
From the discussions, it is clear that even those who do make a comment, complaint or query to authorities at whatever level, many are less than hopeful of a response. A feeling expressed frequently across all categories was that the kebele officials knew of local problems but were powerless to act while higher levels rarely understood their problems or gave them the seriousness local people felt that they deserved.
4.8 Consultations
Particiapants were asked a series of questions relating to whether they were consulted by woreda or city administration officials on services and development priorities. Main results are summarised below.
4.8.1 Are local people consulted: how
Participants were asked whether woreda or city government officials ask the opinions of people in their kebele. 58 (83%) of FGDs said they were consulted, 12 (17%) said they were not. Just under half (42%) of those who were not consulted came from Affar, Somali and Gambella regions.
Table 25: Consulted or not consulted?
Yes: Consulted No: Not consulted
All (n=70) 58 (83%)
12 (17%)
Men (n=30) 27 (90%) 3 (10%)
Women (n=30) 22 (73%) 8 (27%)
Youth (n=10) 9 (90%) 1 (10%)
Municipality (n=19) 16 (84%) 3 (16%)
Rural (n=51) 42 (82%) 9 (18%)
There was little difference between municipal and other areas. Women however indicated that they were consulted less than male and youth FGDs. The main topics of consultation are given in Table 26 below
Table 26: Topics of consultation
Topic Municipalities Rural
Tax & strategy 0 (0%) 2 (4%)
Education 2 (11%) 9 (18%)
Land administration 0 (0%) 3 (6%)
Agriculture 4 (21%) 20 (39%)
Health 4 (6%) 15 (29%)
Current affairs 3 (16%) 12 (24%)
Peace & security 7 (37%) 8 (16%)

50
Environmental protection 1 (5%) 0 (0%)
Problem solving 4 (21%) 4 (8%)
Job opportunities 4 (21%) 4 (8%)
Infrastructure 5 (26%) 7 (14%)
Food aid 0 (0%) 2 (4%)
As might be expected, agriculture is a major topic of consultation in rural areas but health was also a topic of consultation much more frequently in rural areas. Peace & security, job opportunities and problem solving featured more frequently in consultations carried out in municipalities. Representatives from the kebele administration were seen as the most frequent governmental representatives who consulted local people, reported by approximately a half of those FGDs who reported that consultation took place, followed by representatives of the woreda administration, reported by just under a quarter of FGDs who reported that consultation took place. A fifth of these FGDs reported consultations which involved civil servants.
“They seek our opinions. Organizing groups in a cell, the administration is trying to find out solutions to problems. They solve problems related to grazing fields, and crossing paths. We hold meetings on 12th, 27th and 29th days each month to discuss the tasks carried out each month… The parliament members consult us.” (Male participants, Fogera-Woreda (rural), Amhara) “We used to discuss on different issues through our different structured channels, we have an organization structured up to a unity working with committees & sub committees. We have urban dwellers association, women’s association, sanitary committee, student-parents committee, development committee etc, For example – the urban dwellers in a kebele meeting discussed about the construction of a wash room at schools, then agreed to contribute money to cover the expense. When the local officials seek opinions and when they want to forward something there are times they call the elders. I participated in the year planning being elected as an elder woman of the kebele. The mayor and his deputy were in the meeting. We discussed issues like the necessity of ambulance and its procurement, about road construction, about distribution of land for residential houses construction and others.” (Female participants, Adigrat (municipality without state functions), Tigray. “They don’t ask anything. They summon the males for meetings. They don’t call the women. They call, the women that have government jobs. They have not summoned any of us to discuss our problems. We are backwards. That is the reason. No it is not because we are back wards, rather than that they are partial/selective when calling up for a meeting. No one has ever discussed with us as you do. No one has come home to discuss with us.” (Female participants, Siraro-Woreda (rural), Oromiya “ The youths have never been asked on development matters. It is the elders and members of EPRDF that are called for meeting. But the administration does not give an answer for them too.
51
The woreda officials ask our problems. They promised us to take our case to higher officials. The Catholics consult us. DA (Agriculture agents) also has an office. The ‘Gere’ send these agents so that they give us a little information about agriculture but the ‘ Gere’ leaders do not visit us”. (Youth participants, Siraro-Woreda, Oromiya)
In relation to whether consultations took place or not there was a mixture of opinions expressed within FGDs with some among the the groups saying consultation took place others believing consultation did not take place, see transcript below: “The kebele officials consult with woreda officials, and then they consult us through public meetings. They seek our opinions - it is common. We were never called for formal meeting but we have heard about the construction of health post. If the consultation was done it would have been good. For instance: - the kebele administration receives instruction from the woreda officers and we implement that. But I have never participated in such issues. It is elders that participate. Unless the chairman is ordered to call meeting, no meetings are held. For instance: - The society consulted on illegal practices and each knows his/her rights and duties. Here in our kebele women don’t attend meetings but I attended meetings. They consult us on several issues through meeting. Previously there were no such consultations, but in recent days a man called “ Aboma” a DA (development agent) came to our kebele and consulted us about irrigation development and planting onion for commercial purpose”. (Youth participants, Mao Komo Special Woreda (rural), Benishangul Gumuz)
FGDs expressed two main caveats to whether consultation took place. They indicated that the community might not be interested so although meetings were called, turn-out was low. They also indicated that specific groups within the community might be consulted. This was the subject of the next discussion topic.
4.8.2 Are there particular groups amongst local people who are consulted
When asked if woreda / city government officials seek opinions of people, what kind of people do the officials talk to or consult, the majority of FGDs said the whole community and many FGDs stressed there was no discrimination in who was invited to take part.
“When they call for meeting they never discriminate among rich and poor. It is unusual to do this - they consult all together. As he said earlier they consult us all together. In our kebele consultation by discriminating as male or female is unusual”. (Male participants, Mao Komo Special Woreda (rural), Benishangul-Gumuz)
“Family men or family women (heads of families) are invited. They announce public meetings or dispatch letters for persons that have lived for a long time, I think they are invited for they are able to compare the past with the present situation. If the young are registered as a member of the youth league, there is a possibility to attend meetings. The kebele also encourages the non-members to attend meetings but job opportunities are first given to members, the members are given priority in everything and membership cards are issued to them.” (Female participants, Bahir Dar (municipality with state functions) Amhara.

52
18 FGDs (28%) of those who said consultation took place, said that certain groups (political affiliated groups, friends and relatives and/or the rich) were favoured.
“They consult males, members of development teams and females employed by government. It is not all males that they consult. Among them, employed males and members of the ruling party (are selected).” (Female participants, Siraro-Woreda (rural) Oromiya)
“Community elderly and senior (old) residents, the old generation are the ones that have acceptance. They don’t encourage the young generation to express their opinion. We the youth have submitted a letter, but after encouraging us they rejected our letter. ‘Gott’ is organized by 10 or 15 members. It is not the public but the members of “Gott “ or ‘cell’ that they summon for meetings - each ‘cell’ has 30 members. They also terrorize people (like the period of derg regim)” (Youth participants, Arsi Negele (municipality without state functions), Oromiya.
Two female FGDs pointed out that although there was no discrimination against women attending, the responsibilities of household chores rarely allowed then to attend. 5 (17%) further groups said that only men were encouraged to attend or only women with particular attributes such as working for the government or being married to an official.
4.8.3 Say or influence in planning or running service
Participants were asked if they felt they had any say or influence in the planning or running of services in their woreda or city administration. Overall 52% of FGDs felt they had no or very little say. Differences between male, female and youth FGDs and municipality and other areas are summarised in Table 27 below.
Table 27: Say or influence in running services
Yes – we have some say or influence in running services
No – we have little say or influence in running services
All (n=65) 31 (48%) 34 (52%)
Men (n=29) 16 (55%) 13 (45%)
Women (n=28) 11 (39%) 17 (61%)
Youth (n=8) 4 (50%) 4 (50%)
Municipality (n=17) 8 (47%) 9 (53%)
Rural (n=48) 23 (48%) 25 (52%)
By region1
Amhara (n=11) 7 (64%) 4 (36%)
Oromiya (n=20) 7 (35%) 13 (65%)
SNNP (n=14) 5 (36%) 9 (64%)
Tigray (n=7) 5 (71%) 2 (29%)
1 Only those regions where there are values for at least 6 FGDs are included

53
Overall, FGDs were fairly evenly divided as to whether they perceived they had influence in running services. Men and youth10 FGDs were approximately equally divided as to their perceptions of influence on the running of services. One FGD with the youth (Hawassa City, SNNP) said the administration actively sought the views of the youth. However well under half the female FGDs believed they had no or little say in the planning or running of services. There appears to be little difference between municipal FGDs and those outside of municipalities. Although numbers are small and therefore findings need to be treated tentatively, from the FGDs involved in the current study, there does appear to be differences between regions with relatively high numbers of FGDs in Oromiya and SNNP regions believing they have little say in the running of services at 65% and 64% respectively, as compared with FGDs from Amhara and Tigray. A fifth of all FGDs said their influence was through consultations carried out by the local authority and just fewer than 1 in 10 FGDs said it was through joint planning. However within FGDs there was greater diversity of opinion than on other issues discussed. This is reflected in transcripts below. It would appear that although consultation may have taken place there is little feedback as to whether and how results of consultation are used. In addition influence as described by FGDs participants is frequently at the level of providing inputs or other resources rather than ideas and priorities, see transcripts below. Diversity of opinion:
P1: Yes we can influence the planning process. For example: Formerly we influenced the planning with Farm Africa (an INGO) and currently World Bank established different unions for IGAs (income generating activites). We make tables from wood. P2: But this is not from the planning process, this is our involvement. P3: Most of the time only male dominated households participated at the meeting. But I can’t participate because I have no husband. P4: Women mostly do not participate at a meeting but they only share (get) information from men - except for sharing of information, we can’t influence the planning or running of the services. (Female participants, Kedida Gamela-Woreda (rural), SNNP) This is possible only if they inform us while they are planning. If they need public opinion, we will raise our hand and tell them ours, but they just decided the plan by themselves and then tell us what they did. … it is the people that vote for them, people can have influence. The police who came here in the name of federal government have been robbing and beating the people; however, the people influenced or pressured them to leave this town… We have repeatedly attempted to influence in the meeting but we haven’t seen any change. … whenever our teachers leave classes before due time or (are) absent, we just go and inform to the school director. But the director advises us to negotiate with the teachers. We don’t express our opinion or question for it cannot bring any change. It would be better for the senior old generation to express their opinion. No one listens to the youth. (Youth participants, Arsi Negele (municipality without state functions) Oromiya)
10
From KIIs carried out in 2008 (Tafesse), 38% of KIIs believed they had no say in planning, development and design.
Although figures are somewhat higher in 2010, some of this difference will be due to the group nature of the instrument:
FGDs in contrast with KIIs.

54
Can influence:
“We can influence because it’s the right of the people. The officials alone can do nothing. The woreda and kebele officials make plans only after the community’s proposed plan (agreed upon in village meetings) reaches the kebele. Here, the kebele and woreda officials reach consensus. Plans are made on both sides. The kebele officials make plans and the communities make plans assembled by vicinity leaders….. Officials can’t oppose or reject the needs of the community. The kebele administration has never planned anything outside the people’s knowledge”. ( All were said to have agreed unanimously: Male participants, Melka Belo-Woreda (rural), Oromiya)
Government also prepares a plan and we also prepare a plan, say for example the society proposed for having a health station. We consulted the government and it gave us the architectural design and the bill of quantity. We discussed and the community agreed to contribute money and to give labour service. The government assigned engineers and we are constructing a health station, it is almost finished. This is our plan not the government’s plan …. The same is true with the construction of the secondary school. We believe that we need a building which serves for high school education. The government did the engineering work, we are contributing money and man power, and it’s in process, this is also our plan, and our government co-operates with what we decide. (Male participants, Tahtay Koraro-Woreda (rural), Tigray)
Little influence in planning: “We are not educated. We can not influence any planning. But if there is a plan for us, they show us the way and inspire us. Then we strive for its implementation. e.g they plan opening a school and show us the place where the school can be built. They told us that they chose the place because it is the centre for all the villagers surrounding us, the students can have equal distance to travel. They also show us the architectural design and calculated the bill of quantity, they assign an engineer, we contributed and the school was constructed. They took the inspiration, we cooperate in implementation” (Male participants, Habru-Woreda (rural), Amhara)
Cannot influence:
“They never let us discuss it. We just listen. A few women try to respond. But they don’t give us chance to express our opinions they are the only speakers. It is for the first time that we express our opinion. Since we have a fear, we listen and get back home. We are elders, so we have a fear. We are the listeners, and we are not the speakers”. (Female participants, Siraro-Woreda (rural), Oromiya)
4.8.4 Setting development priorities
Participants were asked whether they felt they had any say or influence in setting development priorities in their woreda or city administration. Overall, a third of FGDs believed they had a say or influence in setting development priorities, a smaller number than with regards to services. This dropped to approximately a quarter for rural areas, for women and for youth.

55
Transcripts indicate a range of reactions to this discussion topic, from neutral, to being passive recipients to expressing a feeling of victimisation. Being passive recipients was a perception frequently expressed and this was often seen by participants themselves as a consequence of their low levels of education, literacy or understanding of the law.
Table 28: Say or influence in setting development priorities
Yes – we have some say or influence in setting
development priorities
No – we have little say or influence setting development
priorities
All (n=65) 21 (32%) 45 (69%)
Men (n=30) 12 (40%) 18 (60%)
Women (n=27) 7 (26%) 19 (70%)
Youth (n=8) 2 (25%) 6 (75%)
Municipality (n=17) 7 (41%) 10 (59%)
Rural (n=48) 14 (29%) 33 (69%)
By region1
Amhara (n=11) 5 (45%) 6 (55%)
Oromiya (n=21) 6 (29%) 15 (71%)
SNNP (n=14) 5 (36%) 9 (64%)
Tigray (n=7) 3 (43%) 4 (57%)
1 Only those regions where there are values for at least 6 FGDs are included
“Yes we can influence in prioritising what we would like done…. Before the construction on the school, there were various development plans (but as) our children travelled long distances to school, we demanded the construction of a school in our village above everything else. As a result a school Is (being) constructed and priority is being giving to it. We can change development priorities through development committees. The committee discussed with kebele officials and thereby a public meeting is organised…” (Male participants, Were-Jarso Woreda (rural) Oromiya)
“They know they are decision makers and our ideas have no value to them” (Male participants, Bona Zuria Woreda (rural), SNNP) “No. They bring to the meeting what has already been decided and argue that this is the dictate of the law” (Male participants, Teltele woreda (rural), SNNP) “We, the dwellers of this kebele are illiterate, including the kebele chairman, so we simply accept the plan designed. We can’t influence” (Male participants, Wantawa woreda, Gambella (rural)” “To give any comment or suggestion is to make problems come to you. You are asked your identity, where you come from and finally named as a terrorist. I don’t think we can be successful or anything can be improved even if our number is large. Whenever you ask for modification or improvement, they count you as a member of the opposition party. Therefore you shut down. If you decide to sacrifice yourself for change, you will expose your

56
family to another problem. For instance, an old man asked for the minimum contribution to be 20 Birr. The kebele told him that he and his family were new to the area and so to shut up” (Youth participants, Arsi Negele (municipality without state functions), Oromiya)
4.8.5 Other means of influence
Participants were asked if there were any other ways in which people can influence decisions taken by woreda or city government officials. 16 (23%) of FGDs answered in the affirmative, with 8 (11%) further FGDs indicating that it might be possible. 45 (63%) saw no further ways of influencing decisions on development matters. Of those believing there were other ways to influence decision making, the majority cited further consultation, further requests or appealing to higher authorities as the action that would be taken. One FGD suggested influence could be through the voting system and three FGDs suggested that development activities could be boycotted. However although the majority of FGDs believed there was nothing further that could be done to influence decisions, in their explanations, they expressed the belief that the authorities could do little without their cooperation.
“It is the village elders chosen by the people who were capable of changing the decision taken by the officials… They appealed hierarchically and their appeal got fruitful when the regional state passed a correct decision”. (Male participants, Fogera-Woreda (rural) Amhara) “Yes we can influence officials’ decisions. If the kebele officials pass decisions against the needs of the society or that are not acceptable by the community, we leave the discussion forum and disperse indicating opposition. Then we appeal our complaint to the woreda officials”. (All agreed unanimously) (Male participants, Melka Belo-Woreda, Oromiya)
“No way. We can’t change. No one listens to us. No one has ever changed what is planned or decided by the kebele. They say that “once it is decided, we can’t change it.” While the land of market place is distributed for the rich, the poor that have small hovels on the land couldn’t do anything. Now no poor person is there on that land. We can do nothing. We have also weaknesses. There is no cooperation among us. This is a new settlement; we did not know one another…. (Female participants, Hawassa City (municipality with state functions, SNNP)
“If you reject what you are ordered to do, you will be arrested, or fined 300.00 birr. Decisions can not be altered. Decisions, burdensome beyond imagination, are passed against us. There are still prisoners who were arrested in June but they were supposed to be jailed for only 24 hours. We talk nothing of that because we are threatened to be jailed, too”. (All agreed unanimously that they can’t oppose or influence decisions). (Male participants, Jijiga woreda (municipality with state functions, Somali Region)
4.9 Sharing of information
The final discussion topic of the FGDs was around the subject of information provision and sharing by woreda and city governments.

57
4.9.1 What information is provided
Participants were asked what information the woreda or city government shares with local people. Specifically FGDs participants were prompted whether they were informed about strategic plans and budgets, changes to services and taxation. Overall 53 FGDs (84%) believed that at least some information was shared, 8 (11%) believed information sharing was minimal and 3 (4%) said they did not know. Those that said they did not know were located in Affar and Gambella regions, two were youth FGDs and one was a female FGD. Most FGD participants were unaware of the details of strategic plans and budgets. However there are isolated cases of where reasonable practice in information flow is described, see examples from Oromiya and Tigray below.
“The city urban development department called a meeting for community elders and representatives and share information about urban development. Regarding tax, the officials held meetings and informed everybody during the time of harvest. The society has information, not only the officials – they are nothing except they are assigned by the people. They announce information through the notice board. They (also) announce information about tax through the megaphone. If we are in debt of tax payment they come to the house to collect taxes.” (Male participants, Ambo City, Oromiya) “The woreda officials announce the allotted budget through the kebele so as to encourage the public to engage in development activities” (Male participants, Were Jarso Woreda, Oromiya). “We share information through public meeting, through the villages, even through church gatherings, information will come. Yes we know about strategic plan .e.g. our kebele to develop 600 hectars through campaign development, this was told at the beginning of the year, it was the government’s plan. The whole population discussed and being convinced of it started the development work…. We receive any kind of information. There is no blind acceptance, we discuss, we add our assumption then act accordingly. We always share information with leadership and service giving sectors”. (Youth participants, Tahtay Koraro-Woreda, Tigray)
However with the exception of information on tax collection, the vast majority of participants had little information on the strategic plans, plans for changes in services or budgets. The most frequently cited information provided by the administrations were related to specific and practical development activities, to peace and security, to tax and to a lesser extent the May 2010 election.

58
Table 29: Information availability
Perceptions of information shared
Strategic plan Budget Proposed changes to services
Taxation
All (n=70) 6 (9%) 16 (23%) 6 (9%) 40 (57%)
Men (n=30) 2 (7%) 10 (33%) 4 (13%) 17 (57%)
Women (n=30) 3 (10%) 5 (17%) 2 (7%) 17 (57%)
Youth (n=10) 1 (10%) 1 (10%) 0 (0%) 6 (60%)
Municipality (n=19) 2 (11%) 2 (11%) 0 (0%) 12 (63%)
Rural (n=51) 4 (8%) 14 (27%) 6 (12%) 34 (67%)
By region
Amhara (n= 10) 2 (20%) 2 (20%)
Oromiya (n=22) 0 8 (36%)
SNNP (n=14) 3 (21%) (11%)
Somali (n=6) 0 1 (17%)
Tigray (n=7) 1 (14%) 2 (29%)
There does however appear to be some increase in availability of strategic plans and budgets since 2008 where the majority of FGD participants “firmly stated the absence of the practice of sharing annual budget documents, audit reports, proceedings of council meetings and public consultations11”. Transcripts from 2010 are given below:
“Concerning tax payments, we have been informed. We know we have to pay tax; it is an obligation. Also we have discussions concerning electricity and we are looking for its installation. If our kebele officials accepted the information and if it is a plan they will forward it to the people in public meeting. They consult us before planning we used to discuss at public meeting. We appreciate a plan when it was realized. We women get information through our husbands. We have no exposure in conducting a meeting with external bodies; just we get information from our husbands. Any information doesn’t reach to us directly; it is through our husbands that we get information. We paid tax when our husbands told us about taxation information” (Female participants, (Cheliya-Woreda (rural), Oromiya.) “We are pastoralists. We are not educated. We don’t stay in one place for a long time. We get out and come back with our cattle. We do not have any knowledge of what you are saying”. (Female participants, Awash Fentale, Affar) “Just like the imperial time, women have never attended meetings. We have no access to information. We pay for local security guards. They collect it by walking through every door. They discuss (information) within the committee, they do not call for residents of this area
11
Tafesse, 2009

59
for meeting. Even males themselves do not know about this. They told us about the election (card). I was not told by anyone, I saw while others take it. I have received afterwards (election card) They give order of tax payment by walking through every house.” (Female participants, Hawassa City (municipality with state functions, SNNP)
Statements, in general, were non-judgemental as to whether more information should be provided. However it is clear in those instances where budget and strategic plan information is provided, it is appreciated. From the data available, it is not possible to ascertain participants’ understanding of the data provided. The most commonly cited means of information sharing was from kebele officials either through public / village meetings, or information deliverers appointed by the kebele. Indirect means, i.e. through a third party were cited as a principal means of obtaining information by 11 (16%) of FGDs.
“We have information of taxation. Everybody knows about taxation. But we do not have any (other knowledge) In our kebele the chairman has no payment, they work with each other and about budgeting, no ideas are raised. Information is about tax payment provided at the end of the year, but they didn’t share information about planning, budget etc” (male participants, Wantawa Woreda (rural), Gambella.
.
“There is no sharing of information between the people and the Woreda administration. Information is told to intermediate leadership members, and then it is pushed to the people through kebele leaders and kebele militia. Sometimes the intermediate leaders can receive information through letters; these also will be defused to the people by the kebele and militias. Information is told to kebele and militias. The society does not know about strategic plans, budget or change of any services. There was a time that information was told only to a few selected. For example there was training on HIV/AIDS, certain adults who are not youth participated in the training, the reason was because there was incentive .Irrelevant individuals took the training but they could not train the young… We never know about budget allocation. In fact one time there was a festival here, then they told us how much money was collected there, but generally, information sharing is not between people and leadership but between leadership and their selected. Some information is told to a selected few. A good example for this is the distribution of improved seeds. The arrival of limited improved seeds will be told to members of leadership and their relatives recently”. (Male participants, Habru-Woreda (rural), Amhara)
4.9.2 Who does the information reach
When asked whether information (in general from the woreda or city administration) reached people like themselves, 49 (70%) FGDs responded in the affirmative, 21 (30%) FGDs thought such information did not reach people like themselves. Of those who felt that information did not reach people like themselves and gave a reason for why this was so, 7 (37%) said it was due to their failure to attend meetings and approximately the same number said it was because information was withheld (26%) or poorly disseminated (21%).

60
“…We don’t receive information because they don’t give attention to the young” (Youth participants, Bahir Dar (municipality with state functions), Amhara)
“…I don’t think that it is accessible at all. It does not reach a weak person like me…” (Male participant, Arsi Negele, Oromiya”
“Since I am a village elder (of the dominant ethnic group) I get information but others may not. The government officials obtain information. The rest of the community does not” (Female participants, Jijiga City (municipality with state functions, Somali)
When asked whether there were specific groups of people who have access to information provided by the woreda or city government more than others, 49 FGDs 12 (72%) responded in the affirmative. The most commonly cited reason for having greater access to information was affiliation to the ruling party by 42% of those FGDs who answered in the affirmative, see summary of reasons below.
Table 30: Access to information by specific groups of people
YES, there are such groups NO, the information reaches all
Are there specific groups who have greater access to information provided than others? (n=68)
49 (72%) 19 (28%)
Men (n=30) 23 (77%) 7 (23%)
Women (n=29) 20 (69%) 9 (31%)
Youth (n=9) 7 (78%) 2 (22%)
Groups perceived as having greater access
All (n=49)
Those with affiliation to ruling party
20 (42%)
Those with high position in the local community
10 (21%)
Those with high social status 4 (8%)
Those sharing kinship or affiliation with information
provided
2 (4%)
Those with higher economic status
1 (2%)
Those with linkages to information providers
through economic gain
5 (10%)
7 (24%) of the FGDs with women said that men had better access than women for a variety of reasons: they are out in the community more, women are confined to the home, women were seen as more “backward”.
12
Out of 68 FGDs who responded to this question

61
In responses many men, women and youth stressed the hierarchy or system and it was seen as only natural that information reached those higher in the system first. Therefore the fact that some members of society had better access than others was not seen in a negative way, see statements below:
“The access is equally provided for all kebele dwellers. The information access looks as follows: chairman to cabinet to the whole public. This is our opinion”. (Female participants, Kedida Gamela-Woreda (rural), SNNP)
“Whenever the information is provided from higher government bodies it first reaches to the kebele – next to the cabinet and then to the militia –then also to community elders and they consult with each other - finally it reaches to the whole mass. The information is provided first to kebele then to Justice and security head –finally to the police. In the year 2002 E.C. we organized development communities, which have 20-30 members. Now the information first reaches to the secretary of the development committee. The whole mass (of the population) have equal access for information” (Male participants, Cheliya-Woreda (rural), Oromiya).
In other cases information was perceived as having wide distribution through a number of formal and informal channels.
“There is no segregation; everybody has access to the information provided. Everybody knows what somebody knows. We have many means of exchanging information, at Woreda and kebele meeting, at church, at development campaigns, at market etc. everywhere we can share information”. (Female participants, Tahtay Koraro-Woreda (rural), Tigray)
Others however were more critical, feeling that there was a degree of favouritism in the sharing of information. A feeling of dissatisfaction with information distribution was often expressed where there was a perception that there would be some economic gain from the information.
“Yes, there are. Those who are kebele officials, civic association (Idir) leaders, cell members get information. Relatives of officials get information. When information and economic advantage is available, there is discrimination… based on kinship and wealth. We all share this opinion”. (Female participants, Telo-Woreda (rural), SNNP)
“It reaches all, for they announce at ‘gere’ level. However some information is not made available -this is because we are not members. Those who are not members don’t access information quickly. Our husbands are engaged in outdoor activates for this reason they have a better access”. (Female participants, Kofele-Woreda (rural), Oromiya)
“Government officials and government workers (employees) get Information. The village elders get no Information at all except engaging themselves in prayers”. (Youth participants, Jijiga City, Somali Region).

62
5 Results: Key Informant Interviews
The section below summarises results from 175 Key Informant Interviews undertaken with representatives of Civil Society Organisations carried out in 9 Regions.
5.1 Basic Particulars of Key Informant Interviewees
Selection of CSOs, see 3.2 above, was according to: i. to level of operation
ii. sector
CSOs were also categorised according to the following criteria and basic characteristics of Key Informants and their Civil Society Organisations are presented in Table 31 below.
1. Type of organisation: a. Traditional civil organisations, an example of which would be an iddr b. NGOs, this category includes indigenous and international NGOs c. Associations, unions and cooperatives
2. Membership of organisation:
a. Set up to serve members only b. Set up to serve members and the wider community c. Set up to serve the wider community
3. Level of operation
a. Kebele level – mainly operating at kebele and certainly operating in less than three kebeles
b. Woreda level – operating in multiple kebeles and usually having an office or headquarters at the woreda level or above.
4. Type of jurisdiction where located a. Woreda. To avoid confusion with the categorisations in (3) above these jurisdictions
are, in shorthand, named “rural”. However it should be noted that this classification may include peri-urban, small towns as well as rural locations
b. Municipality with state functions c. Municipalities

63
Table 31: Characteristics of CSOs whose representatives were interviewed
1. Type 1 Traditional civil organisation
NGOs Associations, unions &
cooperative
No. of KIIs 35 (20%) 27 (16%) 111 (64%)
2. Membership Members only
Members & wider community
Community
No. of KIIs 100 (57%) 43 (24%) 32 (18%)
3. Level Woreda Kebele
No. of KIIs 60 (34%) 115 (66%)
4. Jurisdiction Rural
Municipalities with state functions
Municipalities
No. of KIIs 98 (56%) 61 (35%) 16 (9%) 1
For one KII there was insufficient information to allow categorisation
Many (30%) of CSOs where KIIs took place had multiple functions. For those that had a specific function, 27 (16%) were involved in agriculture or agricultural processing and marketing, 15 (9%) were involved in service delivery, 17 (10%) were involved in handy craft production and small-scale industry, 7 (4%) were burial associations and 7 (4%) focused on advocacy issues. For all CSOs involved in KIIs, the total number of members represented by the CSOs was 49,011 members13. For those CSOs that were membership organisations, the average membership was 342 members with a range from 5 to 6488 members 81 (46%) of the CSOs had at least one member of paid staff. The total number of paid staff over all CSOs was 655. Among those CSOs with at least one member of staff, the average number of paid staff was 8 members of staff, with a range from 1 to 125 paid staff.
5.2 Resource sharing
A number of questions were asked of key informants relating to the sharing of financial resources, technical support and staff. Results from the KII are summarised below.
5.2.1 Support to CSOs (in general) from woreda or city governments
Key informants were asked whether support (funds, technical support, staff, other) was provided to CSOs in general by the woreda or city government in the last year. Responses are summarised in Table 32 below:
Table 32: Support to CSOs (in general) by Woreda or City Governments in past year
Type of support
Response (n=175) Funds Technical support Staff (time) Other
No 149 (85%) 99 (57%) 129 (74%) 135 (77%)
Yes 15 (9%) 71 (41%) 40 (23%) 29 (11%)
Don’t know 11 (6%) 5 (3%) 6 (3%) 11 (6%)
13
Just over 80% of CSOs involved in KIIs had members

64
Other types of support listed included training , provision of land, interest free loans, letters of support to set up bank accounts, counselling & advice, title deed preparation, support in conflict resolution and other resources. 12 (7%) KIs indicated that no support of any type was available to CSOs. 5 of these KIs were found in two woredas: Siraro woreda (rural) and Melka Belo woreda (rural) both in Oromiya Region. “Don’t know” responses were concentrated in Hawassa City, SNNP and Jijiga City, Somali - both Municipalities with state functions.
5.2.2 Support to the Key Informants’ CSOs from woreda or city governments
Key informants were asked whether support was provided to their CSO in the last year. Overall 59 (34%) KIs said their CSO received no support at all from woreda or city governments. 21(35%) were at woreda or city government level and 36 (31%) of these CSOs were at kebele level. Responses by type of support and type of CSO are summarised in Table 33 below.
Table 33: Support to respondents’ CSOs by Woreda or City Governments in past year
Type of support
Response: All (n=175)
Funds Technical support Staff (time) Other
No 161 (92%) 102 (58%) 133 (67%) 127 (73%)
Yes 14 (8%) 73 (42%) 42 (24%) 46 (26%)
Don’t know 0 (0%) 0 (0%) 0 (0%) 2 (1%)
Response: membership organisations (n=100)
No 91 (91%) 61 (61%) 83 (83%) 81 (81%)
Yes 8 (8%) 38 (38%) 16 (16%) 17 (17%)
Don’t know 0 0 0 1 (1%)
Response: organisations with wider community remit (n=75)
No 69 (92%) 40 (53%) 49 (65%) 45 (60%)
Yes 6 (8%) 35 (47%) 26 (35%) 29 (39%)
Don’t know 0 (0%) 0 (0%) 0 (0%) 1 (1%)
Woreda level CSOs (n=60)
No 55 (92%) 32 (53%) 40 (67%) 42 (70%)
Yes 5 (8%) 28 (47%) 20 (33%) 17 (28%)
Don’t know 0 0 0 1 (2%)
Kebele level CSOs (n=115)
No 106 (92%) 70 (61%) 93 (81%) 85 (74%)
Yes 9 (8%) 45 (39%) 22 (19%) 29 (25%)
Don’t know 0 0 0 1 (1%)

65
Other support from the administration included training , provision of land, interest free loans, letters of support to set up bank accounts, counselling & advice, title deed preparation, support in conflict resolution and other resources. The narrative given by respondents suggests that these other types of support were of particular value to CSOs. Some financial support was also received from kebeles rather than woredas or city governments as stated by 3 CSOs. Amounts received from kebeles were 300, 600 and 4000 Eth. Birr. In comparing membership organisations with those with a wider remit, responses indicate a slightly higher level of support to those organisations with a wider community remit, particularly in relation to staff time and “other” support. In comparing CSOs operating at woreda and city government levels with those at kebele level percentages of CSOs receiving funds from woredas and city governments were very similar though those operating at kebele level indicated higher levels of technical, staff and other support. Although the question clearly asked about woreda or city government support, at least some of this support was made available by kebele officials, as indicated by responses. In comparing regions, KIs in Tigray reported levels of support across all categories of support, similarly Amhara, albeit at a lower level. In Oromiya, although availability of funds was low with only one CSO receiving funds from the local administration, technical and other support was reported in approximately 25% of KIs.
5.2.3 Support to woredas or city governments from CSOs
Key informants were asked what kind of support their CSO provided to the Woreda or city government in the last financial year. 35 (20%) said they provided financial support to woredas or city governments in the last year.
Table 34: Support to Woredas or City Governments from CSOs in past year
Type of support
Response (n=175) Funds
Community work support for capital
investment Other
No 139 (79%) 62 (36%) 45 (26%)
Yes 35 (20%) 111 (64%) 129 (74%)
Don’t know 1 (1%) 1 (1%) 1 (1%)
46 (40%) CSOs at kebele level reported that they provided no support of any type to woreda or city governments, 19 (32%) CSOs at Woreda level reported that they provided no support. Those that provided no support were evenly spread over the regions except for Gambella region where no CSOs reported providing any support to the jurisdiction and Tigray where the majority provided support and only one KI (5%) reported providing no support. However in Gambella only 5 KIs were interviewed, all representatives of kebele-level CSOs.

66
Table 35: Support to woredas or city governments from CSOs by Region
Support available to Woreda & City Governments
Funds Community work support for capital investment
Other
Regions
Addis Ababa (n=5) 1 (20%) 1 (20%) 2 (40%)
Affar (n=5) 1 (20%) 2 (40%) 1 (20%)
Amhara (n=30) 3 (10%) 18 (60%) 6 (20%)
Benishangul Gumuz (n=5)
0 1 (20%) 1 (20%)
Gambella (n=5) 0 0 0
Oromiya (n=55) 15 (27%) 14 (25%) 15 (27%)
SNNP (n=35) 8 (23%) 10 (29%) 8 (23%)
Somali (n=15) 1 (7%) 2 (13%) 6 (40%)
Tigray (n=20) 4 (20%) 14 (70%) 6 (30%)
Other support provided by CSOs to woreda and city governments was varied and included training, providing equipment including computers, loans, sharing experience and resources including transport. The pattern of support to administrations follows a similar pattern to that shown for support from administrations with support other than financial, support in most cases being mutual. Just under one third of CSOs perceive that they are receiving and giving support to the local administration. In terms of funds provided in the last financial year, a total of 719,890 Eth. Birr (US$ 53,430) was provided to woreda or city governments, with a range from 90 to 451,000 Eth. Birr and an average over the 35 CSOs who provided funds of 20,568 Eth Birr (US$1,530). Except for Benishangul Gumuz, Gambella and Somali where funds were only made available from one CSO, funds were made available by approximately a quarter of the CSOs interviewed in the other Regions. Three CSOs both provided and received financial support from their woreda or city government administrations. The total net amount recorded as being provided to woreda or city administrations over the 175 CSOs interviewed was 456,400 Eth. Birr (US$ 33,840).
5.3 Public information sharing
KIs were asked whether woreda / city government i) budgets, ii) woreda / city government annual reports, iii) audit reports, iv) strategic plans, v) agenda for council meetings, vi) decisions taken by council were made available to their CSO. They were also asked the date these were last made available and by what means. Results for type of information made available and means of availability are summarised in Table 36.

67
Table 36: Information perceived as available by CSOs and means of availability
Means of Availability 1
No. of KIs responding (n=175)
Council meeting
Radio Annual meeting
Kebele officials
CSO forum
Other
Yes No DK
Budget 41 (23%)
129 (74%)
5 (3%)
26 (63%)
1
1 (2%)
3 (7%)
4 (10%)
3 (7%)
4 (10%)
Annual reports 56 (32%)
117 (67%)
2 (1%)
32 (57%)
1 (2%)
19 (34%)
19 (34%)
5 (9%)
4 (7%)
Audit reports 37 (21%)
132 (75%)
6 (3%)
24 (65%)
1 (3%)
2 (5%)
6 (16%)
0 3
(8%)
Strategic plan 63 (36%)
107 (61%)
5 (3%)
33 (52%)
0 7
(11%) 11
(17%) 7
(11%) 4
(6%)
Agenda for council meetings
49 (28%)
121 (69%)
4 (2%)
29 (59%)
1 (2%)
1 (2%)
9 (18%)
3 (6%)
5 (10%)
Decisions taken by council
47 (27%)
123 (70%)
4 (2%)
27 (57%)
1 (2%)
6 (13%)
5 (11%)
3 (6%)
3 (6%)
1 Percentages for Means of Availability expressed in terms of those who responded in the affirmative
Strategic plans and annual reports were the documents most frequently made available to CSOs and were available in the last 2 years in over 90% of those cases were they were made available. All documents were available to approximately one fifth of those CSO representatives interviewed. This is considerably higher than results from 2008, although as noted earlier, KII results from 2008 include the views of citizens as well as representatives of CSOs14. Information was most frequently made available through council meetings15 followed by through kebele officials. CSO forums would appear to be relatively rare as a means for sharing information. They were a means of information sharing in 11% of cases in relation to strategic plans for example. For the vast majority of CSOs a maximum of two methods were available for obtaining the above information. Therefore most CSOs obtained this information through a single channel. Other methods described by KIs are summarised below. For any of the information, no method in the “other” category was mentioned by more than 2% of KIs. Posting of the budget on notice boards, for example, was cited by two respondents.
Table 37: Other methods of information availability
Information Methods Budget Notice boards Annual reports Specially convened meetings with CSO, written & distributed reports
14
However results from 2010 FGDs also show an increase as compared to the 2008 KII results. It would therefore appear
that there has been an increase in the availability of key documents as compared to 2008. 15
This would appear to imply that council meetings are generally open to CSO representatives but this question was not
specifically asked in the KIIs.
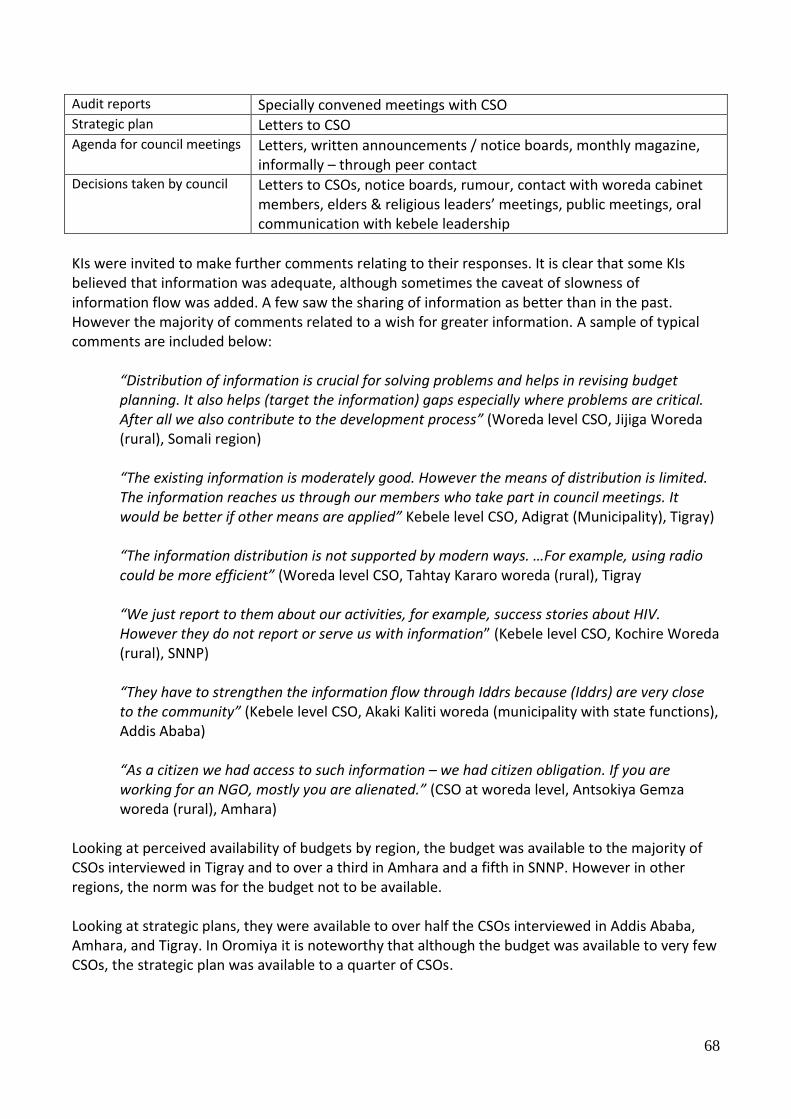
68
Audit reports Specially convened meetings with CSO Strategic plan Letters to CSO Agenda for council meetings Letters, written announcements / notice boards, monthly magazine,
informally – through peer contact Decisions taken by council Letters to CSOs, notice boards, rumour, contact with woreda cabinet
members, elders & religious leaders’ meetings, public meetings, oral communication with kebele leadership
KIs were invited to make further comments relating to their responses. It is clear that some KIs believed that information was adequate, although sometimes the caveat of slowness of information flow was added. A few saw the sharing of information as better than in the past. However the majority of comments related to a wish for greater information. A sample of typical comments are included below:
“Distribution of information is crucial for solving problems and helps in revising budget planning. It also helps (target the information) gaps especially where problems are critical. After all we also contribute to the development process” (Woreda level CSO, Jijiga Woreda (rural), Somali region)
“The existing information is moderately good. However the means of distribution is limited. The information reaches us through our members who take part in council meetings. It would be better if other means are applied” Kebele level CSO, Adigrat (Municipality), Tigray) “The information distribution is not supported by modern ways. …For example, using radio could be more efficient” (Woreda level CSO, Tahtay Kararo woreda (rural), Tigray
“We just report to them about our activities, for example, success stories about HIV. However they do not report or serve us with information” (Kebele level CSO, Kochire Woreda (rural), SNNP)
“They have to strengthen the information flow through Iddrs because (Iddrs) are very close to the community” (Kebele level CSO, Akaki Kaliti woreda (municipality with state functions), Addis Ababa)
“As a citizen we had access to such information – we had citizen obligation. If you are working for an NGO, mostly you are alienated.” (CSO at woreda level, Antsokiya Gemza woreda (rural), Amhara)
Looking at perceived availability of budgets by region, the budget was available to the majority of CSOs interviewed in Tigray and to over a third in Amhara and a fifth in SNNP. However in other regions, the norm was for the budget not to be available. Looking at strategic plans, they were available to over half the CSOs interviewed in Addis Ababa, Amhara, and Tigray. In Oromiya it is noteworthy that although the budget was available to very few CSOs, the strategic plan was available to a quarter of CSOs.

69
Table 38: Information perceived as available by CSOs
Perceived availability
Budget Strategic plan
Regions
Addis Ababa (n=5) 0 (0%) 3(60%)
Affar (n=5) 0 (0%) 0 (0%)
Amhara (n=30) 12 (40%) 17 (57%)
Benishangul Gumuz (n=5)
0 (0%) 0 (0%)
Gambella (n=5) 0 (0%) 1 (20%)
Oromiya (n=55) 5 (9%) 15 (27%)
SNNP (n=35) 7 (20%) 9 (26%)
Somali (n=15) 0 (0%) 0 (0%)
Tigray (n=20) 17 (85%) 18 (90%)
5.3.1 Levels of satisfaction with information provided
Overall when KIs were asked to assess their level of satisfaction with the information provided, the largest category of response overall was “very dissatisfied” at 26% of KIs. 49% of KIs were very dissatisfied or quite dissatisfied and 32% were very satisfied or quite satisfied. There is a clear desire for more information in approximately half of those interviewed. 20% of KIs were unsure or did not know, mainly because the idea of woredas and city governments making information available to them was a new concept. Numbers of respondents in each category by region and administration type are given in Table 39. Comments relating to each of these categories are summarised Table 40 below.
Table 39: Levels of satisfaction with information provided
No. of responses: satisfaction category
Very satisfied
Quite satisfied
Quite dissatisfied
Very dissatisfied
Don’t know
Regions
Addis Ababa (n=5) 1 (20%) 2 (40%) 2(40%) 0 0
Affar (n=5) 0 0 1 (20%) 4 (80%) 0
Amhara (n=30)
Benishangul Gumuz (n=5)
0 0 1 (20%) 3 (60%) 1 (20%)
Gambella (n=5) 0 0 1 (20%) 3 (60%) 1 (20%)
Oromiya (n=55) 3 (5%) 10 (18%) 16 (29%) 17 (31%) 9 (16%)
SNNP (n=35) 6 (18%) 2 (6%) 7 (21%) 9 (17%) 9 (27%)
Somali (n=15) 0 0 0 3 (20%) 12 (80%)
Tigray (n=20) 2 (10%) 9 (45%) 5 (25%) 1(5%) 1 (5%)
Administration type
Municipalities (n=16) 3 (29%) 5 (31%) 4 (25%) 4 (25%) 0
Municipalities with state functions (n=61)
4 (7%) 12 (20%) 12 (20%) 16 (26%) 17 (28%)
Woredas (n=96) 14 (15%) 17 (18%) 23 (24%) 25 (26%) 17 (18%)
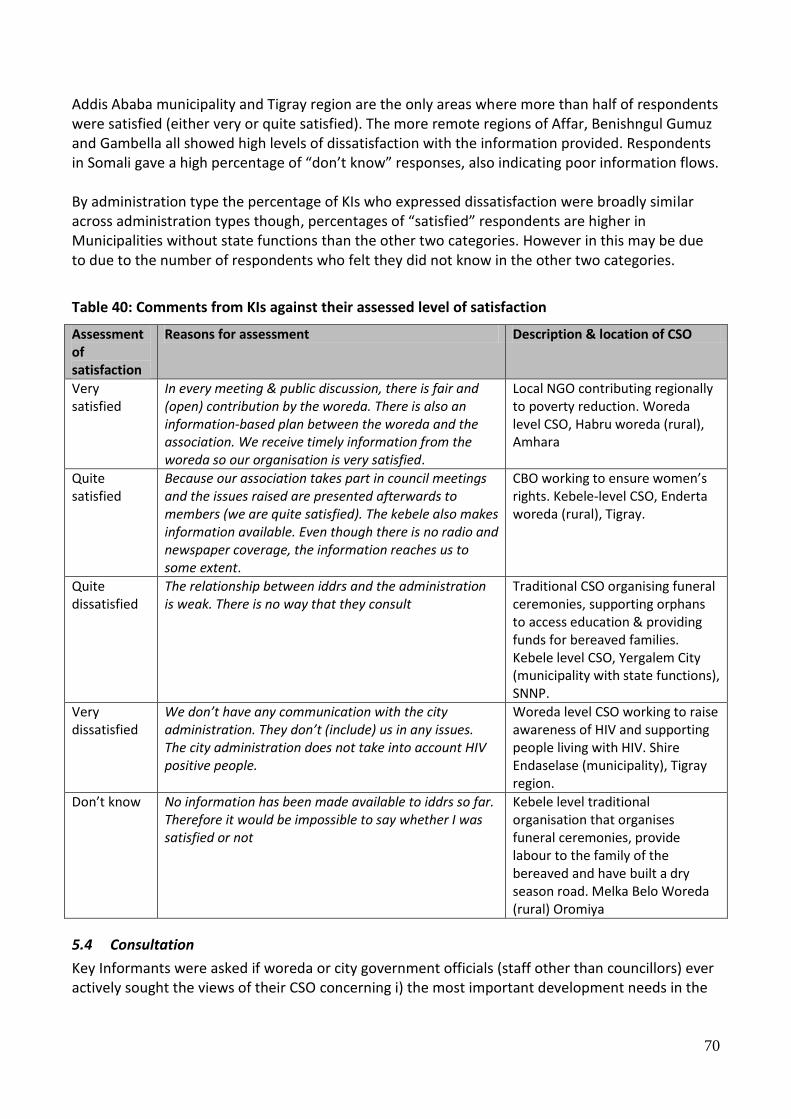
70
Addis Ababa municipality and Tigray region are the only areas where more than half of respondents were satisfied (either very or quite satisfied). The more remote regions of Affar, Benishngul Gumuz and Gambella all showed high levels of dissatisfaction with the information provided. Respondents in Somali gave a high percentage of “don’t know” responses, also indicating poor information flows. By administration type the percentage of KIs who expressed dissatisfaction were broadly similar across administration types though, percentages of “satisfied” respondents are higher in Municipalities without state functions than the other two categories. However in this may be due to due to the number of respondents who felt they did not know in the other two categories.
Table 40: Comments from KIs against their assessed level of satisfaction
Assessment of satisfaction
Reasons for assessment Description & location of CSO
Very satisfied
In every meeting & public discussion, there is fair and (open) contribution by the woreda. There is also an information-based plan between the woreda and the association. We receive timely information from the woreda so our organisation is very satisfied.
Local NGO contributing regionally to poverty reduction. Woreda level CSO, Habru woreda (rural), Amhara
Quite satisfied
Because our association takes part in council meetings and the issues raised are presented afterwards to members (we are quite satisfied). The kebele also makes information available. Even though there is no radio and newspaper coverage, the information reaches us to some extent.
CBO working to ensure women’s rights. Kebele-level CSO, Enderta woreda (rural), Tigray.
Quite dissatisfied
The relationship between iddrs and the administration is weak. There is no way that they consult
Traditional CSO organising funeral ceremonies, supporting orphans to access education & providing funds for bereaved families. Kebele level CSO, Yergalem City (municipality with state functions), SNNP.
Very dissatisfied
We don’t have any communication with the city administration. They don’t (include) us in any issues. The city administration does not take into account HIV positive people.
Woreda level CSO working to raise awareness of HIV and supporting people living with HIV. Shire Endaselase (municipality), Tigray region.
Don’t know No information has been made available to iddrs so far. Therefore it would be impossible to say whether I was satisfied or not
Kebele level traditional organisation that organises funeral ceremonies, provide labour to the family of the bereaved and have built a dry season road. Melka Belo Woreda (rural) Oromiya
5.4 Consultation
Key Informants were asked if woreda or city government officials (staff other than councillors) ever actively sought the views of their CSO concerning i) the most important development needs in the

71
kebele, ii) the quality of any public services. They were also asked if the consultations had taken place in the last financial year, Table 41.
Table 41: Consultation on development needs and quality of services
No. of respondents replying in the affirmative
Most important development needs of
the area
Quality of public services
Took place in the last financial year?
All Regions (n=175) 83 (47%) 80 (46%) 65 (37%)
Region
Addis Ababa (n=5) 2 (40%) 4 (80%) 3 (60%)
Affar (n=5) 4 (80%) 4 (80%) 3 (60%)
Amhara (n=30) 20 (67%) 20 (67%) 18 (60%)
Benishangul Gumuz (n=5)
0 0 0
Gambella (n=5) 3 (60%) 3 (60%) 2 (40%)
Oromiya (n=55) 20 (36%) 16 (29%) 15 27%)
SNNP (n=35) 12 (34%) 12 (34%) 12 (17%)
Somali (n=15) 3 (20%) 2 (13%) 2 (13%)
Tigray (n=20) 19 (95%) 19 (95%) 16 (80%)
Just under half of all CSOs responded that they had been consulted on development needs and quality of public services and of those who responded in the affirmative, just over a third had been consulted in the last year. However results were considerably lower in Oromiya, SNNP, Benishangul-Gumuz and Somali. One third of CSOs responded that they were consulted on issues over and above those related to development needs and quality of services16, see for example below:
(We are consulted) “…. There were also consultations to evaluate develop activities that had already been carried out. They regularly request our opinion concerning quarterly and half-yearly plans – this is discussed including our report and plans.” (Woreda-level CSO, Habro-woreda (municipality with state functions, Oromiya)”
However some of those CSOs that said they were consulted noted that the dividing line between consultation and asking for assistance was not always clear, see statement below:
(We are consulted)”concerning donations and aid invitations; they regularly ask our opinion on emergency aid supplies and sometimes on other issues. To sum up… shows their invitations to us are strictly for assisting them in taking measures in hard times, not to take part in consultations regarding the woreda” (Woreda level CSO, Shinile woreda (Municipality with state functions), Somali Region).
16
However many of these were in fact closely related to development needs or service quality in the broadest sense

72
KIs were asked if woreda / city government had used their views on i) development needs, ii) the quality of public services and results are given in Table 42 below. Just over a third of CSOs responded that they believed that their views had been used by woreda or city government officials, see Table 42 below. This is in line with 2008 findings from KIIs17. Overall, more than three quarters of CSOs that had been consulted believed their views were used, a relatively high proportion indicating relatively low levels of cynicism with regards to consultation. This is illustrated by a number of example statements below. However it should be noted that views expressed by many KIs tended to be seen as quite specific, relating to actions on a particular topic, including complaints, rather than being strategic in nature. Consultation tended to be related to, for example, the construction of a health centre, rather than to, for example, the prioritisation of development needs in an area, see also Section 5.4.1 below.
Table 42: Use of CSO views on development needs and quality of services
Use of CSO views: no. of respondents believing views were used
Most important development needs of
the area
Quality of public services
Other (miscellaneous) issues
All Regions (n=175) 66 (38%) 68 (39%) 47 (27%)
Region
Addis Ababa (n=5) 1 (20%) 2 (40%) 2 (40%)
Affar (n=5) 4 (80%) 4 (80%) 3 (60%)
Amhara (n=30) 17 (57%) 18 (60%) 13 (43%)
Benishangul Gumuz (n=5)
0 (0%) 0 (0%) 0 (0%)
Gambella (n=5) 3 (60%) 2 (40%) 0 (0%)
Oromiya (n=55) 14 (25%) 12 (22%) 12 (22%)
SNNP (n=35) 9 (26%) 9 (26%) 5 (14%)
Somali (n=15) 1 (7%) 1 (7%) 0
Tigray (n=20) 17 (85%) 20 (100%) 12 (60%)
Yes: Results of consultations are used
“We were told a health centre will not be built for us because the total population size is not 25,000. However because the Farmers’ Associations made a complaint to the responsible authorities, the issue was reconsidered and finally the health centre was constructed. There was also a budget-appropriation problem in the safety net programme. The Association made a suggestion on how to solve the problem and based on that the leaders (of the safety net programme) were replaced.” (Kebele-level CSO, Enderta woreda (rural), Tigray) “The availability of two schools was a result of demand by CSOs and society. Secondary schools are being built” (Kebele-level CSO, Semen Achefer woreda (rural), Amhara)
17
Tafesse, 2009

73
“The iddr suggested that a Technical and Vocational Training Centre should be built. We suggested making our members contribute labour when a fence was constructed for the college. We made comments on land administration service quality and we received very satisfactory responses “.(Kebele-level CSO, Amigna woreda (Municipality with state function, Oromiya) “It was the kebele that took our views. It was not the city administration. The budget is with the kebele” (Kebele-level CSO, Bahir Dar (Municipality with state functions), Amhara) No: results of consultations are not fully used “Sometimes they use our ideas. However they fail to give responses (and) although we requested clear questions, they give it a political interpretation and give us a bad name. It is not all of them, there are some who think positively.” (Kebele-level CSO, Were Jarso woreda (rural) Oromiya) “I do not think the woreda officials address the opinions they sought from the community to the concerned body. They just come to the kebele to collect their per diem” (Kebele-level CSO, Jijiga woreda (Minicipality with state function) Somali region.
5.4.1 Consultation on strategic plans
KIs were asked if in the last two years, the CSO had been consulted in the preparation of the strategic plan. Overall 41 (23%) CSOs replied in the affirmative. Three quarters of CSOs were not consulted on the strategic plan, see Table 43.
Table 43: Numbers of CSOs consulted on preparation of strategic plans
No. of respondents consulted on strategic plan preparation
Yes No Don’t know
All Regions (n=175) 41 (23%) 130 (74%) 4 (2%)
Region
Addis Ababa (n=5) 3 (60%) 2 0
Affar (n=5) 0 5 0
Amhara (n=30) 15 (50%) 15 0
Benishangul Gumuz (n=5)
0 5 0
Gambella (n=5) 0 4 1
Oromiya (n=55) 7 (13%) 47 1
SNNP (n=35) 2 (6%) 32 1
Somali (n=15) 1 (7%) 14 0
Tigray (n=20) 13 (65%) 7 0
If no consultation took place on the preparation of the strategic plan, KIs were asked to explain their understanding of why there was no consultation. Perceived reasons are given in Table 44.

74
Table 44: Perceived reasons for lack of consultation on preparation of strategic plans and number of CSOs in each category
Not consulted: No. of respondents according to response (% expressed as total no. of responses)
No
. of C
SOs n
ot
con
sulted
& givin
g respo
nse
Do
n’t kn
ow
1
Preju
dice again
st
CSO
s1
Fear of exp
ected
respo
nse
1
Weak w
orkin
g relatio
nsh
ip1
Exclusio
n d
ue to
no
n- go
vernm
ental
natu
re of C
SO,
gend
er, literacy levels, etc
1
No
t the u
sual
practice
1
CSO
is recently
form
ed1
All Regions (n=175)
132 (75%)
41 (31%)
8 (6%)
4 (3%)
46 (35%)
30 (23%)
1 (1%)
2 (2%)
Region
Addis Ababa (n=5)
2 (40%)
0 0 1 (50%)
1 (50%)
0 0 0
Affar (n=5) 5
(100%) 2 2 1
Amhara (n=30)
15 (50%)
3 (20%)
1 (3%)
0 8 (53%)
2 (13%)
0 1 (6%)
Benishangul Gumuz
(n=5)
5 (100%)
3 (60%)
0 0 1 (20%)
1 (20%)
0 0
Gambella (n=5)
5 (100%)
0 1 (20%)
0 1 (20%)
0 2 (40%)
1 (20%)
Oromiya (n=55)
47 (85%)
17 36%)
5 (11%)
1 (20%)
11 (20%)
12 (26%)
1 2%)
0
SNNP (n=35)
33 (94%)
11 (33%)
1 (3%)
1 (3%)
11 (33%)
9 (26%)
0 0
Somali (n=15)
14 (93%)
3 21%)
1 (7%)
1 (7%)
9 (64%)
1 (7%)
0 0
Tigray (n=20)
7 (35%)
0 0 0 2 (29%)
5 (71%)
0 0
1 Expressed as a percentage of “No” responses
Tigray, Amhara and Addis are the only regions where a substantial proportion of CSOs were consulted on the strategic plan. A large proportion of CSOs did not know why they were not consulted. However the largest category identified was due to weak working relationships with over a third of CSOs who were not

75
consulted giving this as a reason18. A further substantial category was that of exclusion due to the non-governmental nature of their work, or more unusually because they were from a particular social group: women, pastoralists, HIV positive or seen as ignorant and illiterate. A number of typical statements by those who were consulted and those not consulted are given below. Perceived reasons why CSO was included in strategic plan preparation consultations
“When the Woreda prepares its strategic plan it consults us to make sure it doesn’t overlap our plan” (Woreda-level CSO, Antsokiya Gemza - Woreda (rural), Amhara)
“The association always appears at the council meetings. For this reason we discuss on plans with the woreda administration. We ratify the decisions we accept, with the kebele and woreda together”. (Kebele-level CSO, Enderta-Woreda (rural), Amhara)
“To some extent they consult our association about the activities planned for the coming years. For instance for the construction of primary school and health post they ask our association to help with the supply of water and other inputs” (Woreda-level CSO, Antsokiya Gemza - Woreda (rural), Amhara)
Perceived reasons why CSO was not included in strategic plan preparation consultations
“Let alone consulting on the strategic plan they can not even do their office work properly. There can only be consultation when there is responsible body” (Kebele-level CSO, Jijiga City (municipality with state functions, Somali Region) “Since there is no communication with them there is no consultation, they are not willing and they do not even know the way how to”. (Woreda-level CSO, Jijiga City (municipality with state functions, Somali Region) “The woreda administrators do not consult the kebele community because there are many problems in our kebele and they are afraid that these problems will be raised, I think it is based on this reason that they do not consult us regarding strategic plan” (Kebele-level CSO, Jijiga woreda (rural), Somali Region) “It is the failure of the administration, power is not decentralized, they do not know the public” (Kebele-level CSO, Debre Tabor City (municipality with state functions), Amhara) “Most of the time they contact only governmental bodies and their relation with NGOs is poor”. (Woreda-level CSO, Enderta-Woreda (rural), Tigray)
From responses overall, it was clear that consultation with CSOs on the development of the strategic plan was not the norm.
18
It is not always clear from the responses whether a closer working relationship was an aim of the CSO. However some CSOs saw weak working relationships as a missed opportunity of working towards a common developmental goal.

76
5.4.2 Dissemination of results of consultations
KIs were asked if the results of woreda or city government consultations with CSOs or communities are written down and made public. 76 (43%) of KIs replied in the affirmative, see Table 45 below.
Table 45: Dissemination of consultations with CSOs and communities
No. of respondents
Yes, written down & made public
No, not written down & made public
Don’t know
All Regions (n=175) 76 (43%) 90 (51%) 9 (5%)
Region
Addis Ababa (n=5) 4 (80%) 0 1 (20%)
Affar (n=5) 5 (100%) 0 0
Amhara (n=30) 21 (70%) 9 (30%) 0
Benishangul Gumuz (n=5)
1 (20%) 4 (80%) 0
Gambella (n=5) 3 (60%) 2 (40%) 0
Oromiya (n=55) 21 (38%) 32 (58%) 2 (4%)
SNNP (n=35) 3 (9%) 29 (83%) 3 (9%)
Somali (n=15) 2 (13%) 12 (80%) 1 (7%)
Tigray (n=20) 16 (20%) 2 (10%) 2 (10%)
The most frequently cited methods of dissemination were by i) general community or public meeting (51 responses (29% of all responses)) and ii) kebele meeting (43 responses (25%)). Methods of dissemination are given in Table 46 below. 90 (51%) responded that no methods were used, 40 (23%) KIs responded that one method of dissemination was used, 23 (13%) that two methods were used, 8 (5%) that three methods were used and 4 (2%) that four or more methods were used.
Table 46: Methods used for dissemination of consultation findings
Methods of dissemination & no. of responses General community or public meeting
Kebele meeting
Public announcement (on notice or other public board, by megaphone)
Through the media (radio, newspaper)
Other means - official minutes - Letters - In church compound & community gatherings - meetings for CSO members - meetings for Iddr members - hearsay - Television - kebele sub-administration meetings (cell and gott)
51 (29%) 43 (25%) 11 (6%) 5 (3%) 16 (9%)
Percentages expressed as proportion of no. of KIIs

77
5.5 Service Provision
KIs were asked whether any services provided by the woreda or city government have been designed or planned in co-operation with the KI’s CSO. If they cooperated with the woreda or city government, they were asked by what means they provided input into service design or planning. If the CSOs did not cooperate they were asked the reasons for this. Overall, 52 (30%) of CSOs responded that services provided had been planned in cooperation with the administrations. The majority, 37 (71%) of these cooperated on one service, 11 (21%) cooperated on two services and 4 (8%) cooperated on three services. Regionally there were some clear differences, see Table 47 with the majority of CSOs interviewed in Tigray responding in the affirmative, while affirmative responses in Oromiya, SNNP and Somali are low.
Table 47: Numbers of CSOs cooperating in the design or planning of jurisdiction-provided services
No. of respondents
No 1
Don’t know 1
Yes 1 If yes, how:
Main method of cooperation 2
In public meetings
In meetings between CSO & administration
By involving CSO in service delivery
Other
All Regions (n=175)
120 (69%)
3 (2%)
52 (30%)
19 (37%) 23 (44%)
8 (15%)
2 (4%)
Region
Addis Ababa (n=5) 4 (80%) 0 1
(20%) 0 1 (100%) 0 1
(100%)
Affar (n=5) 2 (40%) 0 3
(60%) 1 (33%) 2 (67%) 0 0
Amhara (n=30) 18
(60%) 0 12
(40%) 6 3 3 0
Benishangul Gumuz (n=5)
4 (80%) 0 1 (20%)
0 1 (100%) 0 0
Gambella (n=5) 0 2 (40%) 3
(60%) 3 (100%) 0 0 0
Oromiya (n=55) 44
(80%) 2 (4%) 9
(16%) 4 (44%) 2 (22%) 2 (22%) 1 (2%)
SNNP (n=35) 31
(88%) 1 (3%) 3 (9%) 0 3 (100%) 0 0
Somali (n=15) 13
(87%) 0 2
(13%) 0 0 1 (50%) 1
(50%)
Tigray (n=20) 2 (10%) 0 18
(90%) 5 (28%) 11 (61%) 2 (11%) 0
1 Percentage yes /no/ don’t know expressed as proportion of all responses
2 Main method of cooperation expressed as proportion of affirmative (Yes) responses

78
Services listed as designed or planned in cooperation were varied and included: road construction, water (potable and irrigation), electricity, environmental, marketing, education, income generation & job creation, awareness raising (women), agriculture, health & HIV awareness, youth involvement and children’s rights. Other methods through which cooperation occurred included by letter to the administration, through working with the Regional administration and though provision of funds. The number of CSOs responding that they had no involvement and where there were a substantial number of responses was particularly high in Oromiya, SNNP and Somali. This is consistent with responses throughout the questionnaire which indicates weak working relationships between the administration and CSOs in these regions. KIs were asked reasons for lack of cooperation in service planning and design. Over all regions, 120 KIs responded in the negative and coded perceived reasons for lack of cooperation in service planning are given in Table 48 below.
Table 48: Reasons for no cooperation in designing & planning services
Reasons given for lack of cooperation in design & planning of services
There are n
o su
itable
platfo
rms
The ad
min
istration
do
es n
ot realise th
e ben
efit
Do
n’t kn
ow
CSO
no
t yet registered
&
recen
tly form
ed
No
t the m
ain fo
cus o
r co
ncern
of C
SO
Finan
cial weakn
esses o
f C
SO
Exclusio
n o
f CSO
becau
se o
f gend
er, HIV
status o
r o
ther asp
ects of m
emb
ers
Perceived
po
or
perfo
rman
ce by
adm
inistratio
n
Perceived
po
or
imp
lemen
tation
by
adm
inistratio
n
All Regions (n=120)
27 (22%)
29 (24%)
28 (23%)
10 (8%)
9 (7%)
1 (1%)
6 (5%)
9 (7%)
2 (2%)
Region
Addis Ababa (n=4)
0 1 (25%)
0 1 (25%)
0 0 0 2 (50%)
0
Affar (n=2)
1 (50%)
0 1 (50%)
0 0 0 0 0 0
Amhara (n=18)
5 (28%)
3 (17%)
2 (11%)
3 (17%)
1 (6%)
0 2 (11%)
1 (6%)
1 (6%)
Benishangul Gumuz
(n=4)
2 (50%)
0 2 (50%)
0 0 0 0 0 0
Gambella (n=2)
0 0 2 (100%)
0 0 0 0 0 0
Oromiya (n=44)
9 (20%)
11 (25%)
9 (20%)
4 (9%)
6 (14%)
0 4 (9%)
1 (2%)
0
SNNP (n=31)
7 (23%)
7 (23%)
11 (35%)
2 (6%)
0 0 0 3 (10%)
1 (3%)
Somali 3 6 1 0 1 0 0 2 0

79
(n=13) (23%) (46%) (8%) (8%) (15%)
Tigray (n=2)
0
1 (33%)
0 0 1 (33%)
1 (33%)
0 0 0
Total number of responses given was 121 with a very small proportion of KIs giving more than one reason. Percentages expressed as proportion of total number of responses for each region.
Although not all CSOs would be expected to cooperate with administrations in the design and planning of services, just under a quarter of KIs did not know (or were reluctant to say) why cooperation did not take place, a substantial proportion of those interviewed. Reasons, where given, for not cooperating are illuminating. Although poor performance of the administration was given as a reason, particularly in Addis Ababa (where number of interviews carried out was small), in Oromiya, Somali and SNNP, the main reason given was a lack of appreciation on the part of administrations of the benefits of cooperation with civil society in the design and planning of services. Also of importance was the perceived lack of a suitable platform, i.e. no administrative or practical structure that brought potential development partners together. In 200819 two thirds of KIIs believed there was “no adequate, efficient and institutionalised forums of dialogue between local governments and CSOs”. Although the 2008 figure is considerably higher than that recorded in 2010, this is likely to be due to the open nature of the question asked in 2010 which allowed a greater range of possible answers. In 2010, a small number of CSOs expressed a concern of losing their neutrality or being labelled as “political” if they worked too closely with the administrations. Perceived reasons for lack of cooperation are illustrated by the statements from KIs below:
“There are no governmental bodies that are ready to plan in cooperation. More or less those who are in charge of this are assigned based on their tribes, not their performance, they are not ready for this”. (Woreda-level CSO, Jijiga City (Municipality with state functions), Somali Region “There has not been any effort or ways or attempts made to strengthen our CSO and no one has asked our objectives or inquires before” (Kebele-level CSO, Kochire-Woreda (rural), SNNP) “They do not have the system of consulting us. They could do if they want but they disregarded our CSO”. (Kebele-level CSO, Kochire-Woreda (rural), SNNP) “There is not any kind of work- produced principle which guides the woreda to work with CSOs in designing service provision” (Woreda-level CSO, Shinile-Woreda (rural), Somali Region “It would be nice if we had a chance of working together and recognition of our CSO (Iddr). It would be better if they would enlighten us to participate in development activities as well – so we are looking for this feature” (Kebele-level CSO, Amigna woreda (rural), Oromiya)
19
Tafesse, 2009.

80
“Since this is religious organization it is free from political affiliation. I think this is the reason why the government does not work with us” (Woreda-lvel CSO, Yergalem City (Municipality with state functions), SNNP
5.6 The Registration process for CSOs
The majority (90%) of CSOs where interviews took place had undergone the registration process and were registered. A small proportion of CSOs interviewed were registered centrally through their head office. The majority (79%) of KIs responded that it was very easy or fairly easy to register their CSOs. Among these, most found it very easy. This would appear to be an improvement since 2008 when 43% of CSOs reported “speedy registrations”. However again it should be noted that questions used in 2008 and 2010 are somewhat different. Statements reflecting relative ease of registration in 2010 are given below:
“This CSO is registered in kebele, city administration and zone level. The process was very easy” (Woreda-level CSO, Ambo (municipality with state functions, Oromiya). “There is positive proper registration process cycle” (Kebele-level CSO, Addis Ababa (municipality with state functions). “The requirements of the registration of CSOs is available on notice boards (Kebele-level CSO, Antsokiya Gemza - Woreda (rural), Amhara).
Those that found it difficult or very difficult to register (18 (10%)) were evenly spread through the regions with the exception of Somali where over a third found it very difficult or fairly difficult to register. Reasons for difficulties in registration provided by respondents included slowness, lack of understanding on the part of the administration, suspicion of CSOs and corruption on the part of officials as reflected in the following statements.
“There is a misunderstanding among the responsible staff members. Due to this there is a poor bureaucratic procedure which makes them (CSOs) visit various offices repetitively”. (Kebele-level CSO, Melka Belo-Woreda(rural), Oromiya)
“The registration process is full of corruption - approving the registration is based on personal relationship, or for those who make informal payments (in money and in kind) moreover they (the authorities) are suspicious of CSOs” (Kebele-level CSO, Yergalem City (municipality with state functions, SNNP)
“There is office bureaucracy for getting services and authorities require bribes. It took us a year to get legal certificate from the regional administration” (Kebele-level CSO, Jijiga-Woreda, Somali Region)
“There are lots of ups and downs for registering associations. It would be better if there is a uniform way of registering so that associations can become engaged in the development process (Kebele-level CSO, Jijiga-Woreda, Somali Region)

81
“The officials lack awareness about their task and the benefit of CSOs. They do not see CSOs as helpful. There is a lack of good governance” (Woreda-level CSO, Jijiga City (Municipality with state functions, Somali Region)
5.7 Accountability and complaint procedures
KIs were asked a series of questions relating to their perceptions of: whether the woreda or city government failed to keep their promises and in cases where promises were not kept what could be done to improve the situation.
Results are summarised in Table 49 and Table 50 below. In the majority of regions, respondents were fairly evenly divided in their opinions as to whether promises were kept or not, with the possible exception of Benishangul Gumuz where the majority of respondents believed promises were broken but total number of respondents were small. The relatively large numbers of “Don’t know” responses however indicates lack of knowledge of jurisdiction plans and actions or a reluctance to answer a possibly sensitive question.
Table 49: Failure to keep promises: yes, sometimes, no, don’t know
No. of respondents
Yes, there is failure to keep promises
No, promises are kept
Sometimes there is failure to keep
promises
Don’t know
All Regions (n=175) 62 (35%)
73 (42%) 20 (11%) 20 (11%)
Region
Addis Ababa (n=5) 3 (60%) 2 (40%) 0 0
Affar (n=5) 1 (20%) 3 (60%) 1 (20%) 0
Amhara (n=30) 11 (37%) 13 (43%) 3 (10%) 3 (10%)
Benishangul Gumuz (n=5)
4 (80%) 0 0 1 (20%)
Gambella (n=5) 1 (20%) 4 (80%) 0 0
Oromiya (n=55) 19 (35%) 22 (40%) 6 (11%) 8 (15%)
SNNP (n=35) 12 (34%) 18 (51%) 3 (20%) 2 (6%)
Somali (n=15) 5 (33%) 5 (33%) 0 5 (33%)
Tigray (n=20) 6 (30%) 6 (30%) 7 (35%) 1 (5%)
Those KIs who thought promises were not / not always kept were asked how much their CSO could do to improve the situation. Responses to this question reflect the relationship between CSOs and jurisdictions in their locality.
Table 50: Failure to keep promises: what can the CSO do?
No. of respondents
Nothing Very little Something A great deal Don’t know
All Regions (n=83)
34 (41%) 15 (18%) 28 (34%) 6 (7%) 0
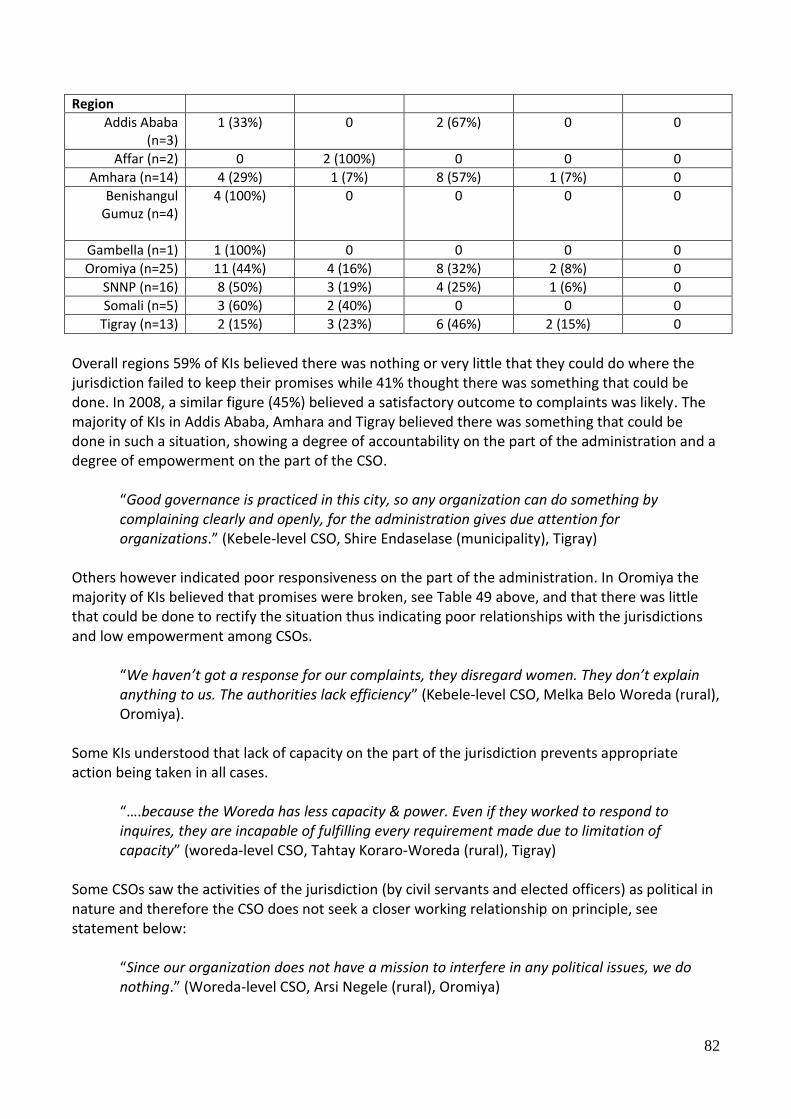
82
Region
Addis Ababa (n=3)
1 (33%) 0 2 (67%) 0 0
Affar (n=2) 0 2 (100%) 0 0 0
Amhara (n=14) 4 (29%) 1 (7%) 8 (57%) 1 (7%) 0
Benishangul Gumuz (n=4)
4 (100%) 0 0 0 0
Gambella (n=1) 1 (100%) 0 0 0 0
Oromiya (n=25) 11 (44%) 4 (16%) 8 (32%) 2 (8%) 0
SNNP (n=16) 8 (50%) 3 (19%) 4 (25%) 1 (6%) 0
Somali (n=5) 3 (60%) 2 (40%) 0 0 0
Tigray (n=13) 2 (15%) 3 (23%) 6 (46%) 2 (15%) 0
Overall regions 59% of KIs believed there was nothing or very little that they could do where the jurisdiction failed to keep their promises while 41% thought there was something that could be done. In 2008, a similar figure (45%) believed a satisfactory outcome to complaints was likely. The majority of KIs in Addis Ababa, Amhara and Tigray believed there was something that could be done in such a situation, showing a degree of accountability on the part of the administration and a degree of empowerment on the part of the CSO.
“Good governance is practiced in this city, so any organization can do something by complaining clearly and openly, for the administration gives due attention for organizations.” (Kebele-level CSO, Shire Endaselase (municipality), Tigray)
Others however indicated poor responsiveness on the part of the administration. In Oromiya the majority of KIs believed that promises were broken, see Table 49 above, and that there was little that could be done to rectify the situation thus indicating poor relationships with the jurisdictions and low empowerment among CSOs.
“We haven’t got a response for our complaints, they disregard women. They don’t explain anything to us. The authorities lack efficiency” (Kebele-level CSO, Melka Belo Woreda (rural), Oromiya).
Some KIs understood that lack of capacity on the part of the jurisdiction prevents appropriate action being taken in all cases.
“….because the Woreda has less capacity & power. Even if they worked to respond to inquires, they are incapable of fulfilling every requirement made due to limitation of capacity” (woreda-level CSO, Tahtay Koraro-Woreda (rural), Tigray)
Some CSOs saw the activities of the jurisdiction (by civil servants and elected officers) as political in nature and therefore the CSO does not seek a closer working relationship on principle, see statement below:
“Since our organization does not have a mission to interfere in any political issues, we do nothing.” (Woreda-level CSO, Arsi Negele (rural), Oromiya)

83
A further CSO saw the jurisdiction in Arsi Negele woreda (Oromiya) as “politically influenced in every respect”. Others were concerned that interference would be seen as a political statement:
“They don’t pay that much attention to us. Even if we make any pressure, I don’t believe it would make any difference. They (would) consider our opinion and deflect it into a political issue so we are afraid to give opinion”. (Kebele-level CSO, Kofele-Woreda (municipality), Oromiya)
Others did not give the reason as politically-motoivated but perceived that any action could bring problems for their organisation.
“In order to avoid confrontation, we have abstained ourselves”. (Kebele-level CSO, Bahir Dar (municipality with state functions) Amhara)
“Because if we try to put pressure to improve the situation, they will count it as a crime. And they don’t have a specific office for complaint.” (Kebele-level CSO, Ambo (municipality with state functions), Oromiya.
Many of those who responded that action could be done indicated that they would go to higher officials. Trust in higher officials often appeared to be higher than those at the more local level.
“… because of a lack of stable administration, (there is) no exchanging of power between regional leaders and the woreda administrators … because there is bad governance and corruption. Since we can’t complain to the nearby authorities we are forced to go to the federals” (Woreda-level CSO, Jijiga City (municipality with state functions), Somali Region)
When asked specifically (from a multiple response question) what would be affective in putting pressure on Woreda or City Government promises, 82 KIs responded as in Table 51.
Table 51: Failure to keep promises: what can the CSO do?
No. of respondents
Community
meetings
Contacting Regional
Leadership
Local Elections
Working with Community-
Based Organisations
Other
All Regions (n=82)
46 (31%)
39 (27%) 20 (13%) 32 (22%) 10 (7%)
There was little variation over regions. Community meetings and contacting the regional leadership were given as the most frequent avenue of follow-up. Unlike responses in the FGD, over one in ten respondents believed that local elections could be effective, showing greater awareness of the political process than detected in the FGDs. Some typical statements from KIs are included below:

84
“I believe the regional leaders are prepared for considering our complaints and implementing our improved services (more) than the woreda administration. Elections are effective ways for getting rid of those administrators who are unable to keep their promises and replacing them with those who are able to keep their promise” (Woreda-level CSO, Jijiga-Woreda (rural), Somali Region)
“Since regional bodies have more authority I believe by contacting the regional leaders’ better results would be obtained. Woreda administrative authorities pay more attention to regional authorities than to community members. (However) I believe that community-based organizations can put more pressure than others because community-based organizations can easily forward their ideas to the responsible bodies without appointment” (Woreda-level CSO, Antsokiya Gemza (rural) Woreda, Amhara)
“In my opinion contacting regional leadership enables the improvement of poor management; after all they evaluate the implementation of plans and apply a control mechanism. They will also consider comments made by the community”. (Kebele-level CSO, Melka Belo-Woreda (rural), Oromiya)
“Elders and respected people in the area can put effective pressure because they are trusted by all people including the administration”. (Kebele-level CSO, Ambo (Municipality with state functions) Oromiya)
“Community meetings enable the community to put clearly the ideas and problems they have to the responsible organs feel accountability more than the commonly tells them what they failed to achieve with one voice collectively The woreda administration lack efficiency to administrate the people and perform their duties well. The regional leadership has better experience in job implementation , and also they (have) better capability . Therefore, I believe that consulting the regional leadership will be successful” (woreda-level CSO, Awash Fentale, Affar).
5.8 Final comments from Key Informants
Finally KIs were asked if there was anything they would like to add about the survey overall. The vast majority of respondents were positive about the survey, several saying that they had learnt from it, see KIs’ comments below. Others added a caveat that the worth of the survey would be if changes in working relationships between CSOs and jurisdictions were improved. 164 KIs provided final comments and numbers of responses against coded categories are given in Table 52.

85
Table 52: Final comments – on the survey as a whole
No. of responses against comments categories Exp
ect imp
rovem
ent if th
e
survey serve
s its pu
rpo
se
Enab
les us to
assess the
relation
ship
betw
een o
ur
organ
isation
& go
vernm
ent
It is intere
sting &
help
s us to
express o
ur o
pin
ion
Sho
uld
be d
on
e frequ
ently
Wo
uld
be go
od
if the resu
lts
of th
e research is availab
le to
CSO
s
Sho
ws th
e con
cern o
f the
govern
men
t and
the
inclu
sion
of go
od
govern
ance
Migh
t enab
le the C
S sector to
get recogn
ition
from
go
vernm
ent
The ad
min
istration
sho
uld
in
crease coo
peratio
n w
ith
CSO
s and
the p
ub
lic
No
com
men
t
All Regions
(n=164)
78 (48%)
16 (10%)
35 (21%)
9 (5%)
2 (1%)
3 (2%)
3 (2%)
12 (7%)
6 (4%)
Comments by selected KIs are given below:
“This kind of study is relevant and provides support to enhance CSOs. It would be nice if it was put into action and made frequently. More or less it makes us to open up and express our opinion, so please carry on” (woreda-level CSO, Habro-Woreda (Municipality with state functions), Oromiya) “I hope that this survey can bring CSOs and the government offices together” (kebele-level CSO, Bona Zuria-Woreda (rural), SNNP) “The survey is good. It causes us to communicate with the government, the city administration and with other civil organizations. In addition, it gives us awareness to understand the overall activities of the city administration” (Woreda-level CSO, Shire Endaselase (Municipality), Tigray) “It would be good if the same questions were asked to the administration. It would make them see the contrast between what ‘iddrs’ contribute to the society and the place government gives to ‘Iddrs’. We request to take part in researches. However we do not see their results. It would be good if you consider this” (kebele-level CSO, Yergalem City (Municipality with state functions), SNNP) “Authorities at federal level have a positive outlook toward NGOs. However, authorities at regional, zonal, woreda and kebele level lack this. In other words there is a difference between service delivery at the federal and the regional, zonal, worda and kebele levels because there is difference in authorities’ level of awareness. … it would good to make the research include this problem” “(woreda-level CSO, Antsokiya Gemza - Woreda (rural), Amhara) “The survey actually seems good but it should have a result. I will love it if the result of this survey corrects this spoiled administration. Thank you.” (Kebele level CSO, Jijiga City (Municipality with state functions), Somali Region).
86
6 Case Studies
In this section two case studies have been developed for selected jurisdictions. They are intended to illustrate examples of how a picture for individual jurisdictions could be developed. It should also be noted that the local consultants have produced FGD and KII reports for each jurisdiction20. Two examples have been chosen. The first is from Tahitay Koraro, a rural woreda, and provides an example of generally good practice. Responses from both the FGDs and KIIs were, on the whole, positive from respondents in Tigray Region. There were exceptions, however, for example one CSO felt the jurisdiction ignored the importance of HIV/AIDS and disregarded the opinions of both women and those living with HIV/AIDS. To provide an example of positive responses over a range of governance indicators, Box 1 below collates responses from Tahitay Koraro to provide a brief case study. The second example is from Arsi Negele, a municipality without state functions. This example provides a more mixed picture. Indicators relating to availability of information indicate that at least some male citizens have information on budgets and plans, albeit at the kebele rather than the municipality level. However the same information does not appear to be available to women and youth. In a similar way, although one CSO would seem to have a reasonable working relationship with the administration, this is the exception rather than the rule.
20
It should also be noted that these are of varying quality

87
Box 2: Tahitay Koraro woreda, Western Tigray Zone, Tigray
Three FGDs and 5 KIIs were held in the woreda. Tahitay koraro woreda is located in West Tigray zone (Tigray region) and is close to Shire town. The kebele, Mayliham, selected for the 3 FGDs is approximately 15 kms from Shire town, on the way to Humera town. In this example there was considerable consistency across all FGDs held.
The generally positive picture on consultation and ability to influence the development agenda from FGD participants was supported by interviews with Key Informants. Men, women and youth believed the quality of the health services close to their kebele was improving due to reduced distances to nearest health facility, reduced infant mortality due to malaria prevention and because of vaccination programmes (men) and the availability of 24 hour midwifery service (women). However facilities in town were said to be getting worse. A major reason for worsening urban facilities was seen as poor salaries received by health professional s which meant that many worked in the private sector. Men and youth also believed that inadequate assessment and evaluation played a part in poor health service quality. All groups believed that urban dwellers were treated better than people from rural areas in health facilities in town though they experienced no such disparity of treatment within their own kebele.
All groups said that they were consulted on development issues through public meetings and they believed there was no discrimination in who was involved. Meetings were held at village level weekly and every month at kebele level. All groups said that consultation was worthwhile. Consultations were said to have led to a clean water supply, elementary and junior schools, health care education, and the maintenance of an all-year grazing area. The kebele had also managed to overtake a neighbouring area to become a model kebele. All groups accepted at least some ownership of the decisions made. The male FGD said that yearly woreda plans and budgets were available. In addition results of evaluations were read out in public meetings. 5 representatives of a variety of CSOs were also interviewed (from a farmers’ association, a women’s association, a disabled people’s association, a cooperative union and a saving and credit association). Two of the CSOs had received funding from the woreda administration and all had received staff, technical and other support and had a working relationship with the administration. Training in, for example, construction had been made available including training in increasing disabled access to public buildings. One CSO had made a funds transfer to the woreda and all CSOs contributed community work support. In terms of information sharing all CSOs said the woreda budget, annual report, audit reports, strategic plan, agenda of council meetings and decisions taken by council were available to their CSO primarily though council meetings at which CSO representatives attend and also through annual meetings, kebele meetings and a CSO forum. There were concerns however that information flow relied heavily on meetings and this tended to exclude CSOs in the more remote kebeles. A further concern was that woreda officials tended to overestimate achievements in the reports. CSOs believed they were consulted on developmental issues and on the quality of public services. All CSOs had been consulted on planned changes to service delivery and 3 out of 5 CSOs were consulted on the strategic plan and budget. As also noted by the FGDs above, consultation also included an evaluation of past activities. All CSOs said that the results of consultations were made public and 4 out of the 5 CSOs had worked with the Woreda administration to plan and design service delivery. In the event of a complaint 4 out of the 5 CSOs were confident that action would result though CSOs with low capacity were said to be taken less seriously. Despite this, 1 CSOs believed that the administration failed to keep its promises and 2 thought this happened sometimes due to failure to follow plans, absence of funds and government officials’ self interest causing misappropriation of funds. However all CSOs believed there was something they could do where promises were not kept. Overall, the interviews undertaken point to good working relations with the public, CSOs and improving governance.

88
Box 3: Arsi Negele Town, Oromiya
Three FGDs and 5 KIIs were held in the Arsi Negele Town, a municipality not performing state functions that is located in West Arsi Zone and is approximately 25km from Shashemene town. Men, women and youth identified the following as measures of a quality health service: 24 hour service, ambulance availability, good management, disciplined, ethical and well-trainer health workers, adequate medicines and equipment and good sanitation with similar identifications across all 3 groups. The most important indicators identified were availability of medicines (women) and well-trained professionals (men & youth). However women also stressed the importance of 24 hour service for pregnant women. The youth praised a local Red Cross drug store that supplied medicines at affordable prices. In terms of fairness of treatment, it was generally thought to be fair though 2 examples of unfair treatment were given – a poor rural person was refused treatment until blood from his injuries had been cleaned by relatives, the other example was related to language. No informal payments were experienced. Overall health facilities were said to be improving though inadequate supplies of medicines and other factors remained an issue.
Men and women assessed water services as among the best services due to availability in people’s compounds. The youth identified education due to easy access (free and close by) with the added comment that education quality could be better. Male and youth FGDs identified justice services as among the worst saying there was no fair trial without money and delays were frequent. Female participants identified agriculture as among the worst due to high costs of fertiliser and lack of improved seeds.
When not satisfied with a service male and female participants said they would report to higher officials for action but with low expectations after years of experience of unanswered complaints. Some from the youth said the kebele officials politicised complaints making them reluctant to take action. Public meetings were the most common means of public consultation though door to door discussions were also held and the elders and youth also held meetings with the kebele leadership. Despite this the youth said gott/cell leaders were favoured as they were affiliated to the ruling party and the youth put little value on the consultations that took place. They also believed they had no influence in determining development priorities. Men felt they could influence and women said only occasionally. Only the male group said that information on budgets and what kebele officials were planning to do was available to them . Political cadres and officials were named as those with the best information.
5 representatives of a variety of CSOs were also interviewed (from an environmental & development NGO, a dairy processing association, an Iddr, a Children & Women’s development association working with pastoralists , an elders’ self-help association). None of the CSOs had received funding from the woreda administration and two CSOs received no other support. 2 CSOs provided funds, 2 provided community work and 3 provided other support to the administration. Weak working relationships were the norm and only 2 CSOs had information of the strategic plan or agenda to council meetings. No CSO had budget information and there was little consultation on other issues. Only 1 CSO had input into design of services (through a public meeting). All were dissatisfied with the amount of information provided. 3 KIs believed the administration failed to keep its promises and the CSOs were evenly divided over whether nothing or something could be done to ensure promises were kept. Effective means for follow-up on promises were said to be: contacting the regional leadership and working with community-based organisations. Other less frequent means were local elections, community meetings, issuing an official letter and through CSOs working in collaboration.
Overall, the interviews undertaken point to some consultation and availability of information to male citizens. However the youth in particular felt marginalised. The administration appeared to have a reasonable working relationship with one CSO but in general collaboration with CS organisations was weak.

89
7 Discussion and conclusions
This section summarises and discusses a number of topics which FGD and KII participants raised of particular importance to them. Greater emphasis is given to those areas which generated the most animated discussion among participants. The section is arranged to allow easy comparison with other instruments employed in WCBS III. Time and resources constraints limit the number of topics that can be covered in the instruments deployed in WCBS III. However as the FGD in particular and the KII to a lesser extent uses open questions which allow respondents to raise issues of importance to them, the FGDs and KIIs provide an opportunity of assessing whether there are key areas of governance of importance to citizens and civil society, which due to the above constraints, are not included in the other instruments. These are discussed in this section. In addition, both instruments (FGD and KII) provide greater detail and citizen voice on governance topics and hence provide some of the reasons from the perspectives of citizens and civil society behind quantitative responses summarised in related reports (CRC and Supply-side reports). Examples of verbatim responses are given in the Sections above and overall perceptions are summarised in this section. The supply-side questionnaire has a number of questions relating to CSOs. Civil society organisations have the potential to be a key stakeholder group in local development and governance. The KIs carried out with CSO representatives are used to explore working relationships between CSOs and administrations and other aspects of administration performance from the perspective of CSOs. These are discussed below.
7.1 Health
7.1.1 Health: service quality
Discussion within FGDs on whether health facilities are improving or getting worse can be directly related to Question 25 in the CRC. There are also additional questions on health in the SSQ (questions 80, 107 to 119). Just over two thirds21 of FGDs perceived that health facilities were improving, a figure that is comparable with results from the CRC. In contrast to the CRC, percentages were higher for rural areas than municipalities. Proximity was one of the main reasons for seeing an improvement in rural areas together with general service improvement. The distance to the nearest health facility was important to users for a number of reasons. Close proximity saved time and effort, and transport money but also respondents in rural areas perceived that they were more likely to be understood in their own language and to receive fairness of treatment in facilities closer to their localities. The main reasons for improvements, other than proximity, which are likely to apply also to the CRC are:
Increased numbers of health professionals
21
As noted earlier, values for FGDs are always likely to be higher for FGDs than CRCs due to the group nature of the
methodology. I.e. where FGDs are recorded as seeing a service as improving, the amount of agreement has been
recorded. However there may still be some members of the group who hold the reverse view.
90
Better health education services
Improvements in MCH
Improved size of facilities
Better supplies of medicines
Improved house to house service, especially appreciated by women
Improved availability of family planning and contraceptives, especially appreciated by younger participants.
Differences in reasons for perceived health service improvements between men, women and younger participants were also seen. Women placed greater emphasis on house-to-house services and young people placed greater emphasis on family planning services. Despite the perception of an overall improvement, shortage of medical supplies and the frequent need to look for drugs prescribed in private outlets was a major concern to respondents due to problems associated with availability, price and time. This was particularly a concern for rural residents who had fewer choices in drug supply and to younger participants who placed greater emphasis on affordability. Shortage of medical supplies at government health facilities was an area that stimulated considerable discussion among FGD participants. Lack of government supplies was seen to hit rural and poor users particularly hard as private sources were perceived as more expensive and beyond the reach of some and involved greater time away from home to search out suitable supplies. As such lack of medicines at government facilities and the purchase of drugs from private outlets were seen as a hidden cost to users.
Over all discussion areas, an issue that was repeatedly raised by participants was the relationship between private and government health services. There was a clear perception among participants who believed that services they received from government facilities were affected negatively by health professionals also working in the private sector and that this impacted on the poor in particular who were more dependent on government facilities. It was believed that medical supplies and professional time were available in private centres at the expense of government facilities. Discussion within the FGDs on informal payments or bribes can be directly related to Questions 23 and 24 within the CRC. Overall FGDs just over 1 in 10 FGDs reported that informal payments or bribes were made. Over a third of FGDs in municipalities reported that informal payments were made, while such payments reported in rural areas were low. This is supported by rural residents saying that payments were more likely at facilities in urban areas. Such payments are made to a range of staff from security guards to medical personnel.
7.1.2 Health: Issues raised not covered by other instruments
The CRC collected data against a number of key indicators of service quality which would be expected during a visit to a government health centre. These broadly correspond with the indicators of service quality identified in open questions by FGD participants. The most frequently mentioned indicators of quality by FGD participants: availability of medical supplies, distance, availability of medical staff, attitudes of medical staff, building condition corresponded with those used as closed questions within the CRC.

91
However it is also worthwhile to note that FGD participants included a number of further services as measures of a quality health service. These include family planning services highlighted as of particular importance to younger participants, gynaecological services and house to house programmes (highlighted by women) and education programmes, and laboratory and x-ray diagnosis. In municipalities in particular, access to emergency treatment was raised by participants as an important aspect of a good health service. As stated above the CRC or other instruments cannot cover all topics of importance. However in future rounds of WCBS, it is worth considering the inclusion of issues relating to family planning and / or sexual health. In the context of highland Ethiopia in particular, where pressure on land is expected to continue to rise, family planning services have important health and socio-economic roles. Including an aspect of preventative health services would also give a more complete picture of health services provided. The importance of advice and practical measures on HIV/AIDS was raised during FGDs and the impact of HIV/AIDS is likely to be felt over coming decades. However this may be more appropriately covered in other surveys. The FGD also introduced a further topic relating to perceptions of fairness of treatment. Just over half of all FGDs thought treatment was unfair in one way or another. Many users of health facilities also raised aspects of negative attitudes among health staff and this was clearly an issue of importance to FGD participants. Many and particularly those from rural areas felt discriminated against for their clothing, ability to express themselves or other aspects relating to relative poverty. Staff attitude and approach is an indicator used in the CRC though fairness per se is not included. In terms of fairness of treatment, taken together with a previous discussion topic where participants gave considerable emphasis to attitudes taken by health staff (medical and administrative), see also CRC, perceptions of unfairness of treatment should be a major concern for health service managers, particularly in health facilities in urban areas.
7.2 Education
7.2.1 Education: service quality
Education services are not covered specifically in the CRC or the FGD22. However within the FGD, due to the open nature of the instrument, issues relating to education were discussed. When asked about the best quality services in the locality, education was cited by almost three quarters of all focus groups and was particularly appreciated by women and younger participants and in rural areas. There were twice as many mentions as water supply and agriculture which were listed as best by approximately a third of FGDs. Recent expansion of the education sector would therefore appear to have resulted in a service valued at the local level. This mainly applies to primary school but comments include an appreciation of adult education (evening classes) and extra-curriculum activities for girls. Where caveats are added, these mainly concern the quality of education with some concerns being expressed relating to a lack of teachers, books and library facilities, possibly a facet of rapid expansion of the education sector.
7.3 Agriculture
The woreda CRC uses a number of questions (28 to 38) to explore the support provided by agricultural extension agents. The FGD does not include questions specifically relating to agriculture 22
See questions 120 to 128 in SSQ

92
but FGD participants were asked for the best and worst services in their kebele and for the reasons behind their answers. From the FGD it can be seen that participants valued the inputs made available through agents while the CRC focuses on information provided although it would be expected these would be closely related. An area highlighted in the FGDs is the provision of seeds, often described as improved seeds. The lack of or availability of veterinary medicines was an area that affected participants’ rating of the agricultural service either positively or negatively. Questions on agricultural inputs provided by the agricultural service might be considered in future rounds of WCBS. The CRC results show a significant decline in value placed on agricultural extension information between WCBS II and WCBS III. As highlighted in the CRC report, poor and erratic rainfall over this period may have contributed and this is supported by results from the FGD where participants expressed a concern over cost of fertiliser but also related this to poor weather conditions which meant that agricultural outputs were low in comparison with inputs.
7.4 Police services23
The police service was mentioned as among the best services by just under a quarter of FGDs. Women and youth gave greater appreciation to the police than men, and the police service was seen to be of particular value to women and the elderly. Areas that had experienced unrest (Gambella region and parts of Somali) included the police service among the better services. However a very similar number included the police amongst the worst services. Among those that included the police service amongst the worst service, there would appear to be to three main categories of response. The first cause is the lack of police services in their kebele, lack of all-night service or lack of police personnel in times of need. The second perception is that the police are not able or are unwilling to do anything to respond to cases of crime. These two reasons account for about half the reasons given for including police among the worst services. The third reason relates to corruption24, the paying of bribes, aggressive or unfair treatment by the police and accounts for a further half of the reasons. Descriptions of experiences with the police service resulted in the greatest instances of reported corruption and therefore should be a cause for concern. There was also a perception, at least in some groups, that the police treated the rich better than the poor, a further area of grievance. Therefore it would appear that although police services are a service that citizens wish for in their kebele, when present the service may not reach expectations. The youth FGDs were fairly evenly split as to whether the police were providing a good or bad service and results will inevitably depend on individual experiences with the service. The youth, in particular were critical of the poor education levels they perceived among police officers and expressed a lack of trust in the police service.
23
See questions 145 to 153 in SSQ 24
The CRC also recorded high levels of perceived corruption among the police and justice services.

93
7.5 Justice services25
Responses to justice services also showed a mixed picture. About a quarter of all FGDs included justice services among the best services in their area, with more men and youth and more FGDs in urban areas including it among the best services, than women. A third of FGDs, a slightly higher figure, included it among the worst services in their area. Reasons for including justice services in the best services focused on three main reasons. The main reason and one contrasted with previous justice systems, was that services were now available in the locality, usually the kebele. The rotation of courts to the local area and the use of technology (plasma) were mentioned. Previously situations were described where users travelled to woreda, to zone and finally to the region in search of justice. Compared with the past, respondents believed that cases were dealt with swiftly and justly. In addition, use of the local language in the local area was appreciated. Conversely however, a greater number of FGDs, particularly men in rural areas included the justice service amongst those services that were worst in the kebele. Reasons given were long time delays in bringing cases to court and receiving verdicts. Travelling to the Woreda court was also a complaint implying that not all areas benefited from rotating courts in their kebele. Just under a quarter of those including justice among the worst services believed that obtaining “justice” was not possible without the payment of bribes.
7.6 Complaints procedures26
FGD participants were asked if they were not satisfied with a service what could they do. Three quarters of FGDs believed there was something that could be done and three quarters of these would appeal to a higher level of the administration (woreda, zonal or higher). The second most frequently cited action was use of alternative service providers. The CRC includes both these options also provides for an option of “other” which covers the other main actions given by FGDs ( Use of mediators and Appealing to supernatural powers). The remaining quarter of FGDs believed there was nothing they could do. A frequently expressed feeling across all categories was that the kebele officials knew of local problems but were powerless to act while those at higher levels had little knowledge of their problems or were unable to give them the seriousness they deserved. The most common reason for not raising a complaint or appeal was that previous appeals had received no response, or slightly less frequently cited, because the administration could do nothing. A small percentage however feared retribution or saw the administration as corrupt, 6 and 4 per cent respectively. KIs were asked if the administration failed to keep their promises, if there was anything their CSO could do. A (small) majority said there was little or nothing that could be done. This lack of confidence is of particular concern in those areas such as Oromiya where it was believed that promises are frequently broken and there was little that could be done to correct the situation. Also of particular concern is the fear of retribution or fear that the CSOs activities would be labelled negatively as political in nature thus inhibiting CSOs from taking action.
25
See questions 154 to 162 in SSQ 26
See questions 19, 20, 26, 27, 39, 40, 44, 45, 56 in woredaCRC. See questions 103,134 and 147 in SSQ.
94
7.7 Common themes arising – service quality
A number of common themes emerge from the FGD and KII results. Where low satisfaction with quality of services is expressed a number of reasons repeat across a number of discussion topics. The following are the key elements that cut across discussion topics:
Lack of perceived fairness where some are treated before or better than others
Discussion of problems with no response or feedback
Delays in service or response,
Lack of understanding of the process, and lack of explanation Lack of perceived fairness cut across many of the services discussed. Quality service was seen as difficult to access whether the service be health, agriculture, the police or justice and this was frequently related to discriminatory practices on the part of staff. Unfairness manifested itself in inferior service if bribes were not paid (justice and police services), preferential distribution of scarce inputs (agriculture) or delays in receiving services (health, justice, police). On the other hand the education service was frequently praised as being open to all children. Lack of feedback was a common grievance. Many participants understand that resources are in short supply but when suggestions or complaints are made, the lack of any response or explanation can cause a feeling of resentment. Delays in receiving feedback were also a concern, an aspect also highlighted in 2008 findings. Delays were a particular issue with regards to the justice service where participants quoted examples of cases taking years to complete. Reduced delays were seen as significant improvement under the rotating courts. Where delays in receiving medical treatment were caused by other non-emergency cases being treated before those that had arrived early, delays were an issue of grievance among health service users. Although many participants saw there preferred complaint procedure as appealing to higher authorities, there was also a feeling of disempowerment when people were sent from the kebele to the woreda or zone and then back again. Health services were particularly praised where time was taken to explain and in one case where a member of staff was especially allocated to this task. Over all services, equality of service and ability to access service, the incorporation of people’s views and the provision of feedback, for example, on a child’s education, were aspects of importance as expressed in FGDs.
7.8 Access to information on government activities
7.8.1 Taxation27
FGD facilitators asked participants what information the woreda or city government shares with local people with instructions to prompt on information on a range of subjects including tax payments. Hence the question in the FGD is considerably more open than related questions within the CRC. The CRC finds that 60% of respondents knew which taxes and fees must be legally paid
27
See questions 28 to 35 in CRC. See questions 42,43 and 45 in SSQ

95
and this is a similar figure to FGDs who believed tax information had reached them. Some reasons for high levels of awareness are provided by the FGDs.
As compared with other prompted topics (strategic plan, budget, proposed changes to services), participants believed themselves to have received more information on taxation with two thirds of groups in rural areas saying they had been informed on taxation issues with a slightly lower figures in municipalities. Several avenues for dispersing information on taxation were deployed including kebele and sub-kebele meetings and door-to-door visits, methods that would appear to achieve wide inclusion. Door-to-door services, as noted for health education programmes, would appear to have been responsible for ensuring greater awareness among women who are frequently excluded from meetings either due to heavy work loads or local attitudes.
7.8.2 Budget and strategic plan28
FGD facilitators asked participants what information the woreda or city government shares with local people with instructions to prompt on whether the strategic plan, budget or proposed changes to public services were shared. Discussion around these topics can be directly related to Questions 49A and 49B in the CRC. FGD participants had more information on the budget than on strategic plans and although figures overall are similar to those recorded in the CRC. However in comparing the availabilities of strategic plans and budgets, FGDs showed the reverse of findings in the CRC where greater information on the strategic plan was available as compared with the budget. However knowledge of both the budget and strategic plan were low. Some FGDs struggled with the concept that this information might be available to them as citizens. Within groups comments from individuals showed that certain types of people felt excluded from such information. The poor, the youth and those not affiliated with the dominant political party perceived that information was less likely to reach them. Within FGDs it is possible that only a few individuals were aware of their availability and is likely to explain the differences in results with the CRC29. In terms of making information available, and in terms of consultation, see Sections 7.9 and 7.9.2 it would appear that women, youth and pastoralists are groups that local administrations are finding it particularly hard to engage with. Where such hard-to-reach groups exist, greater engagement with CSOs working closely with these groups might be expected. However from the FGDs and KIIs there is little evidence of this. KII results show that just over a fifth of CSO respondents had access to budget information and just over a third had access to the strategic plan. Thus access to budget information is higher for CSO representatives than that recorded for “ordinary citizens” in either the FGDs or CRC. Although access would therefore appear to be higher for CSO representatives, this is comparatively low if CSOs are regarded as partners in development and it should be noted that some respondents had access to this information as ordinary citizens rather than as CSO representatives and/or
28
See questions 39 (city government CRC), 49 (woreda CRC). See questions 21, 25, 61, 62 in SSQ 29
Another reason was that FGD participants appeared to have greater understanding of what a budget was compared to
strategic plans.

96
development agents. As for FGDs above, the idea that strategic plan and budget information should be shared with CSOs was new to some of those interviewed. The most commonly given route of access to information was through council meetings and to a lesser extent, annual meetings. A reliance on meetings, excluded some CSOs, particularly those working exclusively in more remote kebeles. In these cases there was greater reliance on kebele officials for access to information. CSO fora did exist in a few cases but were the exception rather than the norm a finding similar to 2008 results. As reflected in other KII discussion topics, platforms for sharing information with CSOs appeared to be rare. Although at least some CSOs representatives demonstrated an understanding of the resource constraints in terms of time, capacity and funds experienced by local administrations, there was also a feeling that the local administration was extractive in the use of information from CSOs without sharing information in return and on other occasions that CSOs were actively excluded. Of greater concern however was a feeling expressed among CSOs, albeit from a small number, that their involvement would be misinterpreted as negatively and overtly political and thus would have negative consequences on their ability to carry out their development activities. CSOs were fairly evenly split as to whether they were satisfied of dissatisfied with the information provided. The high numbers of CSO representatives in rural areas who did not know whether they were satisfied or not indicate poor working relationships and/or that the concept of working with the local woreda administration was new to them.
7.9 Consultation:
7.9.1 Quality of local services30
FGD facilitators asked whether woreda or city government officials ask the opinions of local people about the quality of local services. This question is related to Question 51B in the CRC and Question 38 in the KII. The vast majority of men and youth FGDs believed local people were consulted about the quality of local services. Fewer female FGDs (just under three quarters) believed that local people were consulted31 on the quality of local services. One topic, peace and security, was the most frequently topic that FGDs mentioned, cited well above mentions for other topics. However on other topics, such as education provision, there are clear examples of good practise where plans and skills from the jurisdiction and the community are combined into a workable plan owned by the community. When asked whether they themselves had a say or influence in the running of services about half of the FGDs believed that they did32. However “say or influence” from the narratives provided covers a range of possible responses, from citizens actively bringing about a change in an inferior service to providing labour on a (semi-) voluntary basis. Perceptions of say or influence between FGDs were
30
See questions 51B, 53B in woreda CRC, 41B and 43B in city government CRC. See also questions 45, 80 in SSQ 31
Figures are likely to be higher in FGDs than CRCs. Where the majority of FGD respondents respond in the affirmative
the FGD is scored as having given an affirmative. However this does not mean that all respondents have replied in the
affirmative. 32
As noted in the CRC, as this question ask whether thay have been involved personally the proportion of “yes”
responses is expected to be lower than when asked if “local people” are involved.

97
fairly polarised. Those groups believing they had an influence expressing considerable confidence in their abilities with few groups saying they sometimes had influence and sometimes did not. Groups who believed they had repeatedly made suggestions with no effect expressed considerable negativity. An aspect of this reflected in the narratives would appear to be lack of feedback to local people when their plans or appeals were not actualised. Greater feedback on reasons for lack of actualisation would go some way to preventing a perception that repeated suggestions and appeals are ignored. Just under half of the KIs believed they had been consulted on the quality of public services. A similar figure had been consulted on development needs. Consultation often appeared to be specific in nature relating to the implementation of specific activities rather than to service quality or governance per se. When asked whether their views had been used, over three quarters of those consulted believed their views had been used demonstrating a belief in the value of the consultations that had taken place.
7.9.2 The most important development needs
FGD facilitators asked whether woreda or city government officials ask the opinions of local people about development needs and priorities. This question is related to Question 51A in the CRC33 However it should be noted that the question in the CRC deals only with whether views were actively sought while in the FGD, participants were asked whether they had say or influence on development needs and priorities. Just under a third of FGDs believed they had a say or influence in setting development priorities and this dropped to below a quarter for rural women and youth. Responses ranged from a feeling of confidence, based on past positive experiences, of being able to include local needs as development priorities, to a feeling that suggestions are accepted but do not result in change, to a feeling of being ignored due to decision-makers seeing local people as ignorant, or even that local opinions are not welcome. A perception expressed was that where a local priority is different from that handed down from the woreda or higher levels of the administration, there was little that could be done by local people to influence pre-set agendas and that the role of the community is to accept what had already been decided. Where examples of influence are provided, this was frequently through direct participation, for example, in planting trees or through presenting priorities primarily through public meetings at the kebele level. The electoral system was rarely given as a means as influencing development among FGD participants. Just under half of KIs had been consulted by administrations on development needs, a similar figure to those who had been consulted on quality of public services and approximately three quarters of those who were consulted believed their views were used. As with consultations on quality of services, the nature of the consultation was frequently quite specific in nature, relating to a single topic or a few related topics rather than being strategic in character. This is reflected in the comparatively few CSO representatives who were consulted in the preparation of strategic plans,
33
See questions 51A and 53A in woreda CRC and 41A and 43A in city government CRC.

98
see Section 7.9.3 below. In addition there was a perception that consultation was frequently linked with the request for resources from the CSO and those consultations were on an ad hoc basis rather through established channels that institutionalised consultation with civil society.
7.9.3 Preparation of strategic plans34
KIs were asked whether their CSO was consulted vis-à-vis the preparation of the woreda strategic plan. Just under a quarter of KIs believed they were consulted on strategic plan preparation. This figure is less than half those who were consulted on development needs and quality of services. Consultations that were carried out fell broadly into two categories: i) CSO involvement was frequently through council meetings or less often through public meetings that discussed the strategic plan, ii) consultations were on single topics incorporated into strategic plans and often appeared to be ad hoc in nature. The reasons given for lack of consultation are informative and illustrate the often extremely weak working relationships between the woreda or city administrations and civil society organisations. Of additional concern, is the small percentage who perceived prejudice against CSOs on the part of the administration or feared retribution or misinterpretation if they voiced their opinions.
7.9.4 CSO involvement in design and planning of public services35
About a third of KIs said their CSO was involved in design and planning of services and their involvement was through public meetings or in meetings between their CSO and the administration.
7.9.5 Dissemination of consultations with CSOs and communities36
43% of KIs believed that consultation results were written down and made public. From the narratives, it would appear that written versions of consultation are not necessarily made public and the most frequent dissemination was through verbal presentation at community, public and kebele meetings. Little use of mass media such as the radio was described. This was seen as a weakness in dissemination by some CSOs.
7.10 Information sharing and consultation: common themes
Discussions on information sharing and consultation shows a consistent picture of disempowerment of women and youth, who are frequently excluded from consultative and decision-making platforms. Women tended to be more passive in their acceptance of the status quo, often blaming themselves as ignorant or lacking sufficient knowledge or having insufficient time due to the number of household’s chores they were responsible for, for their lack of involvement. A similar picture of exclusion was presented by the youth. However the youth showed greater frustration, and frequently and openly criticised their lack of voice with blame being placed on both administrations and traditional systems for not listening to the viewpoints of younger citizens.
34
See questions 21, 25, 61, 62 in SSQ 35
See questions 62, 127 in SSQ 36
See question 63 in SSQ

99
Pastoralist groups were also generally disengaged from their administrations. They are, of course, a traditionally hard to reach group. Discussions not only showed that consultations were infrequent but that the agriculture service was rated particularly poorly in pastoralist areas. This was related to lack of resolution on land issues, inappropriate recommendations and poor follow up. Pastoralist groups who took part in the current study were mainly from Affar, Somali and Oromiya regions. Over a range of indicators relating to consultation and information dissemination, and to service provision, FGDs and KIIs from Somali region gave consistently poor results with dissatisfaction being expressed on topics from justice to complaints procedures. In contrast, with one notable exception Tigray gave generally positive results against indicators of governance. Although only expressed in a minority of FGDs and KIIs, there were sufficient mentions of fear of retribution to cause concern. Consultation and comment on development agendas was, at least at times, seen by some to be politicised. This is particularly expressed by the young who, at least at times, feared being labelled as trouble makers. Over all topics, hungers for information and particularly for feedback were expressed together with what would appear to be a growing disillusionment over failure to achieve action or even a response from past consultations with administrations. Two aspects should be of particular concern: i) citizens’ fear of giving their true opinions for fear of losing the benefits they already have, ii) fear of retribution if complaints are made.
7.11 Key findings from interviews with Civil Society Organisations
A number of questions in the supply-side questionnaire relate directly to questions in the KIIs. These are discussed first before working relationships between the woreda or city administrations and CSOs are discussed more generally.
7.11.1 Public information and empowerment37
Within the supply-side questionnaire a series of questions are asked about the amount of support provided by the administration to CSOs and whether CSOs are consulted in the preparation of strategic plans, budgets and changes in service delivery. Related questions in the supply-side questionnaire fall under Section 8: Public information and empowerment. Questions 56, 59, 60 and 62 are closely related to data collected in KIs. The selection framework for KIIs was designed to include CSOs working at the very local level as well as those CSOs with a wider geographical remit and thus representatives of very small as well as large CSOs were interviewed. Despite this, more than twice as many CSOs provided financial support to administrations as received financial support in the last financial year. More CSOs perceived that they had provided community work for capital investment than received technical support or staff time from the administration. However support from the administration, particular in terms of “other” – the sharing of scarce resources, the facilitation of certain procedures with the administration were carefully listed by respondents and appreciated where they occurred. Despite this, well over a third of CSOs reported receiving no support from woreda or city administrations and appeared to work largely independently of these administrations. In this latter group, at least a proportion, unknown from the data collected, would be expected to have working relationships with the kebele.
37
Note the title of this section refers to the section title in the Supply-side questionnaire and relates to questions 65 and
66 in SSQ.

100
When asked about a range of information (budget, annual reports, audit reports, strategic plans, agenda for council meetings, decisions taken by council) those KIs who had access to the information ranged from one fifth (audit reports) to a third of those interviewed (strategic plan). However the number of CSOs who believed they were consulted in the preparation of the strategic plan over all regions drops below a quarter. In Regions other than Amhara, Addis Ababa and Tigray, those consulted are very low and generally less than 10%. Reasons for lack of involvement have been discussed in Section 7.8.2 above.
7.11.2 Working relationships between CSOs and administrations
Three quarters of the CSOs involved in the current study were membership organisations with a total of over 49,000 members, a not inconsiderable number of members. They ranged in type from very small CSOs operating entirely within a single kebele to large multi-sectoral organisations with up to 125 paid staff. All were involved in development activities of one type or another. Across a range of indicators, results would indicate considerable difference in administrations’ attitudes towards CSOs as perceived by KIs. In some cases, notably Somali region working relationships over a range of indicators would indicate relatively little cooperation between administrations and CSOs. Support to and from the CSO is low, availability of key information (strategic plans and budgets) to CSOs interviewed was extremely low and KIs were dissatisfied with the amount of information made available to them. Overall, although there are clear examples of close working relationships between CSOs and the administrations, working relationships would appear to be ad hoc rather than the norm. A possible exception is Tigray, where responses were generally (but not entirely) positive. Consultation on development needs, quality of public services and strategic plans was also extremely low and there was little cooperation on the design or planning of services. In addition a small majority of respondents believed there was little they could do in cases where the administration failed to keep their promises. On the whole, registration presented few major problems. The majority of cases where difficulty in CSO registration were experienced originated from Somali region. In general this reflects the pattern of results from FGDs from Somali region where discussion on a range of topics indicated lack of responsiveness on the part of the administration to local populations. In contrast, the attitude of administrations to CSOs would appear to considerably more supportive in Tigray region and in specific jurisdictions in other regions. In Tigray, Addis Ababa and Amhara over half of CSOs were consulted on strategic plan preparation although cooperation in design and planning of services was more variable. In those areas where little cooperation was recorded, lack of cooperative working was believed by KIs to be due to:
weak working relationships,
a lack of suitable platforms for consultation of CSOs and
a lack of realisation, on the part of the administration, of the potential benefits.

101
In a small percentage of responses, prejudice against CSOs was given as a reason and there was a feeling at least among some CSOs that such negativity was greater at woreda and city administration levels than at higher levels of government. However a large proportion of CSOs did not know why they were not consulted, on for example strategic plan preparation, also indicating a weak relationship. As a result of weak working relationships, many CSOs were working in complete independence from the administration. It should also be noted that for the more local level and traditional CSOs come of the concepts covered in the KIIs were new to their representatives. Despite such organisations being collectively numerous, it had not occurred to respondents that they might have a role, however minor, in planning the development of their locality or would be entitled to knowing the administration’s plans in their sector or for development more generally.
.

102
ANNEX 1: Focus Group Discussion Checklist
Focus Group Discussion Checklist38
Introductions etc. – see FGD Guide
TOPIC A: Measures of service quality - health
Topic A Explanation & Introduction
Explanation: Our first discussion topic relates to services provided by the woreda or city
government. By services we mean those facilities such as water, agricultural extension,
health, water, education, police, roads justice system, land allocation, in city
administrations – rubbish collection and others that are provided by government through
the woreda or city government administration.
Some services are made available to citizens in a way that meets the needs of ordinary
people, some services could do better. We would like to ask your opinion of how you
assess whether a service is good or not, looking first at health services.
Main questions for discussion Prompting and follow-on questions
1. If you went to a government
health facility what aspects
would allow you to say that
the service was a good
service?
2. If you went to a government
health facility what aspects
would make you say that the
service was a less than good
service?
Aspects that might be considered:
waiting time at the facility; distance to
the facility; availability of medicines;
maintenance & cleanliness of buildings
internally & externally; others?
38
Note: A survey guide and guide to note taking & recording will also be provided
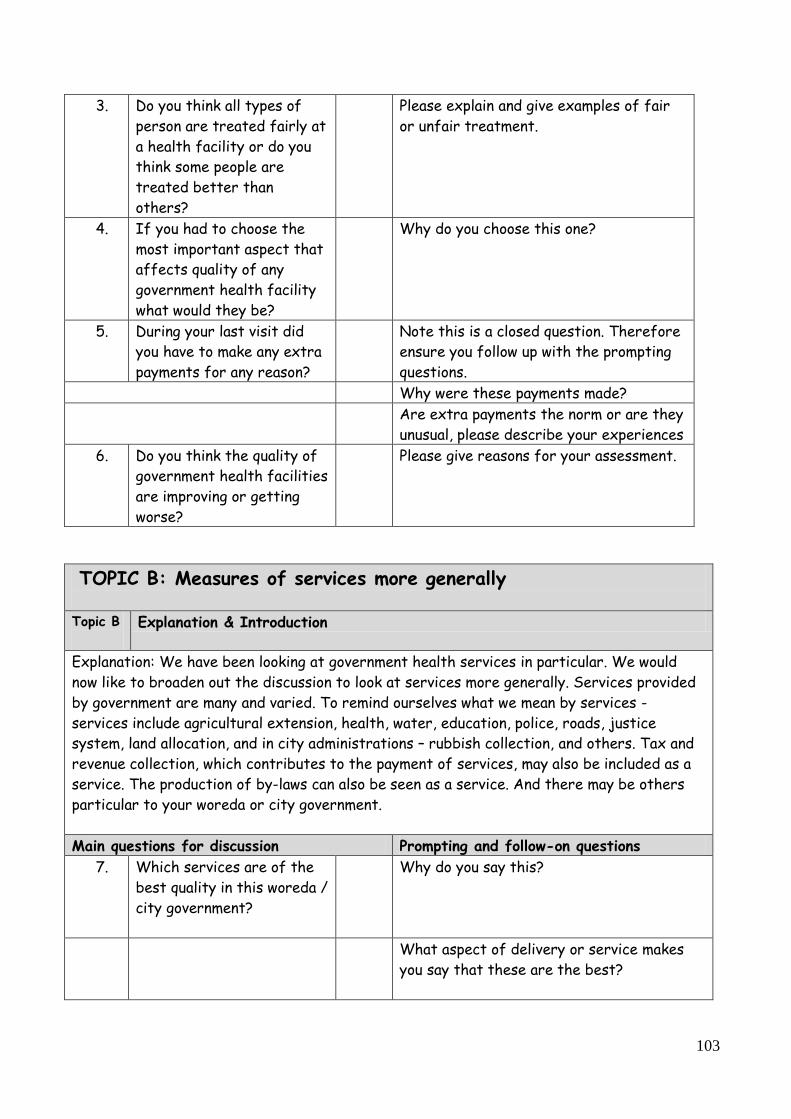
103
3. Do you think all types of
person are treated fairly at
a health facility or do you
think some people are
treated better than
others?
Please explain and give examples of fair
or unfair treatment.
4. If you had to choose the
most important aspect that
affects quality of any
government health facility
what would they be?
Why do you choose this one?
5. During your last visit did
you have to make any extra
payments for any reason?
Note this is a closed question. Therefore
ensure you follow up with the prompting
questions.
Why were these payments made?
Are extra payments the norm or are they
unusual, please describe your experiences
6. Do you think the quality of
government health facilities
are improving or getting
worse?
Please give reasons for your assessment.
TOPIC B: Measures of services more generally
Topic B
Explanation & Introduction
Explanation: We have been looking at government health services in particular. We would
now like to broaden out the discussion to look at services more generally. Services provided
by government are many and varied. To remind ourselves what we mean by services -
services include agricultural extension, health, water, education, police, roads, justice
system, land allocation, and in city administrations – rubbish collection, and others. Tax and
revenue collection, which contributes to the payment of services, may also be included as a
service. The production of by-laws can also be seen as a service. And there may be others
particular to your woreda or city government.
Main questions for discussion Prompting and follow-on questions
7. Which services are of the
best quality in this woreda /
city government?
Why do you say this?
What aspect of delivery or service makes
you say that these are the best?

104
What are the aspects of quality that you
appreciate most about this service?
8.
Which services are of the
lowest quality in this
woreda / city government?
What makes you say this?
What are the things that make this service
the worse?
9. If you are not satisfied by
a service what can you do?
What actions can be taken?
Would you expect positive or negative
results from your actions – please explain?
Are there any real life examples of when
you complained – please describe what
happened?
TOPIC C: Exploration of who, how and when local people are
consulted by woreda / city government and kebele officers
Topic C
Explanation & Introduction
Explanation: We have been looking specifically at service provision so far. We would now like
to discuss your experiences and opinions on whether and how local officials seek the opinions
of people in this jurisdiction. We would like to discuss with you how, when and why local
officials consult with ordinary people, on what topics and whether these discussions are of
any value. We would like to explore which kind of people they talk to.
Main questions for discussion Prompting and follow-on questions
10. Do woreda / city
government officials ask
the opinions of people in
this kebele about quality of
local services? How do they
seek the opinions of people
in this kebele?
How do they seek the opinions of local
people? (Through what kind of forums / fora
, e.g. was it through meetings (what kind?),
through woreda officials talking to
individuals, through the kebele
administration or in some other way?
What kind of things is discussed?
What other ways have woreda / city govt.
officials consulted with local people in this
area?

105
Which kinds of woreda officials seek the
opinions of local people – councillors, civil
servants (health workers, teachers,
extension officers, etc.) or somebody else?
11. If woreda / city
government officials seek
opinions of people, what
kind of people does the
officials talk to or consult?
Possible prompts – men or women, rich or
poor, landed or landless, those with jobs,
business people, farmers or some other type
of person? Or people in specific
organisations or doing specific jobs?
Why do they speak to the people that they
do?
12. When did woreda / city
government officials last
seek the opinions of local
people on services or
development priorities?
[Note: this is a closed question but do make sure reasons and discussions are recorded, as the occur]
13. Do you think the discussions
that the woreda / city
government officials
undertook with local people
were of any value?
– Please explain?
Do you think they are interested in gaining
your opinions? Why do you say this?
Please give examples of changes, if any, that
have come about from these discussions or
consultations? [If there were any changes, Look for at least three examples, if possible]
14. Do you feel you have any
say or influence in the
planning or the running of
services in this woreda /
city government?
– please explain, saying why and how you
have influence, with which aspects.
- please give specific examples of how this
has happened, if they exist
15. Do you feel you have any
say or influence in setting
the development priorities
in this woreda / city
government?
– please explain, saying why and how you
have influence in setting development
priorities.
- please give specific examples of how this
has happened, if they exist

106
16. Are there other ways
people around here or in
this kebele can influence
decisions taken by woreda /
city government officials?
– if yes, please explain. How are decisions
influenced? Through what means? Which
people are involved? Please give details.
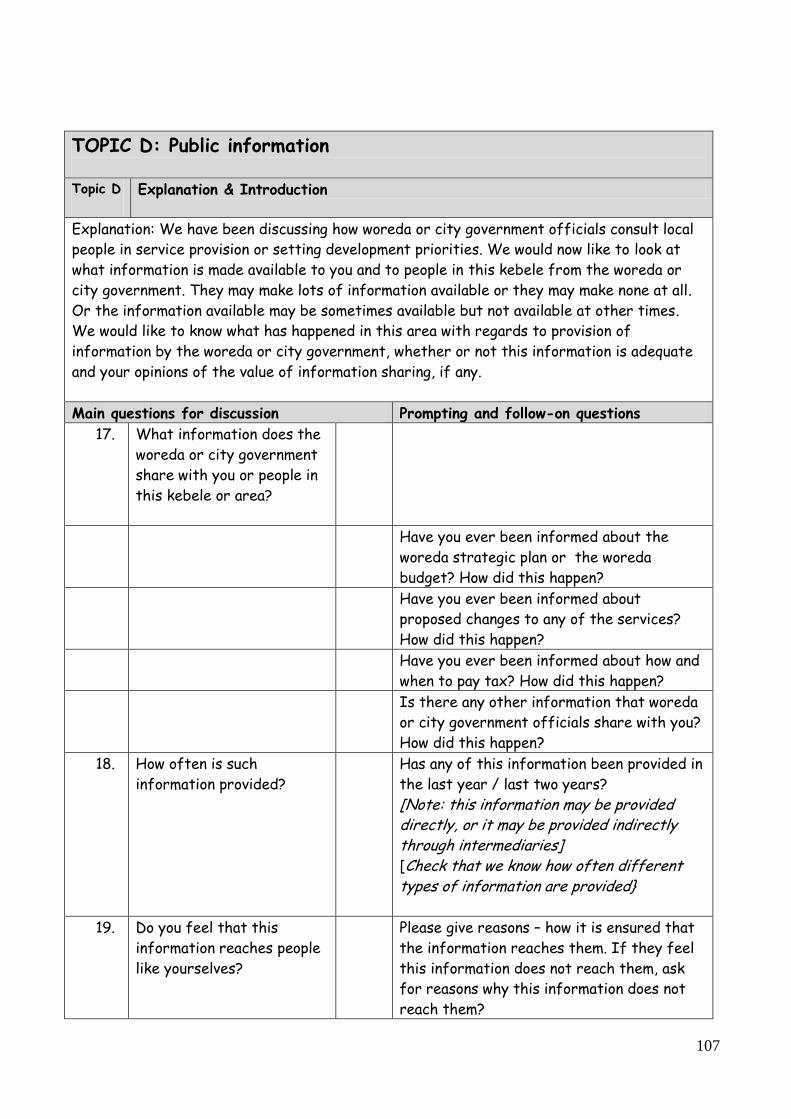
107
TOPIC D: Public information
Topic D
Explanation & Introduction
Explanation: We have been discussing how woreda or city government officials consult local
people in service provision or setting development priorities. We would now like to look at
what information is made available to you and to people in this kebele from the woreda or
city government. They may make lots of information available or they may make none at all.
Or the information available may be sometimes available but not available at other times.
We would like to know what has happened in this area with regards to provision of
information by the woreda or city government, whether or not this information is adequate
and your opinions of the value of information sharing, if any.
Main questions for discussion Prompting and follow-on questions
17. What information does the
woreda or city government
share with you or people in
this kebele or area?
Have you ever been informed about the
woreda strategic plan or the woreda
budget? How did this happen?
Have you ever been informed about
proposed changes to any of the services?
How did this happen?
Have you ever been informed about how and
when to pay tax? How did this happen?
Is there any other information that woreda
or city government officials share with you?
How did this happen?
18. How often is such
information provided?
Has any of this information been provided in
the last year / last two years?
[Note: this information may be provided directly, or it may be provided indirectly through intermediaries] [Check that we know how often different types of information are provided}
19. Do you feel that this
information reaches people
like yourselves?
Please give reasons – how it is ensured that
the information reaches them. If they feel
this information does not reach them, ask
for reasons why this information does not
reach them?

108
20. Are there specific groups
of people who have access
to information provided by
the woreda or city
government more than
others?
Who are these people? Why does this
happen?
21. How could distribution of
information from the
woreda or city government
be improved?
Basic Particulars of Respondents
Explanation & Introduction
Explanation: Explain that names are not needed but it would be useful to know ages,
occupations and mother tongue or ethnicity. This will help those people who analyse the
results from our discussion know what type of people were involved.
Main questions for discussion Prompting and follow-on questions
22. Please can you give me your age, main occupation and ethnicity

109
WCBS III KEY INFORMANT INTERVIEW
Start Time
End Time
1. Interviewed by
2. Supervisor
3. Date of Interview DD MM YY (use Ethiopian
calendar here)
4. Date of Interview DD MM YY (use Gregorian
calendar here)
5.
Spot Checked
By:
Yes
No
1
2
6.
Back Checked
By:
Yes
No
1
2
7. Scrutinized By:
Interview
No:

110
KEY INFORMANT QUESTIONNAIRE
Hello! As you may be aware, the Government of Ethiopia is implementing various programmes to alleviate poverty in the country. We are undertaking independent research to understand people’s and organisations’ experiences with important public services such as water, education, health, agriculture extension services among others. Your responses and suggestions will be treated confidentially and will be used only for the purpose to improve the services by using your suggestions. Results from the survey will be amalgamated, i.e. presented per jurisdiction and not for each organization of person. We are independent researchers working for an independent consultancy company. However we have the support of Government in this research. We would very much appreciate hearing your experiences. The questions we have relate to your experience and the experience of your CSO of information, consultations and services provided by government. As such we are interest in government performance, and not the performance of your CSO as such. We expect the questions to take about 1 hour. Would you be willing to help us by answering as truthfully as possible? Do you have any questions at this point?
1. Basic Information concerning Civil Society Organization and its location
8. Regional state (select) Classification
Tigray 1
9. Zone name:
Amhara 2
10. Woreda / city government name:
Oromiya 3
11. Kebele name:
SNNP 4 12. Enumeration area EA code:
Benushangul Gumz 5 13. Interview ID (interview number):
Diredewa Administrative Council 6
Afar 7
Somali 8
Gambela 9
Harari 10
Addis Ababa 11
14.
What type of jurisdiction is this
jurisdiction? (choose 1 of the
following)
Woreda
(a)
Municipality with state
functions (reforming towns) (b)
Municipality (not performing
state functions) (c)

111
15.
What date was this CSO started:
Start date [E.c] [circle one response only] :
Length of CSO existence:
less than 1 year (a)
1 to 2 years (b)
2.1 to 3 years (c)
3.1 to 5 years (d)
More than 5 years (e)
16. Please describe the main functions of your CSO:
Ensure that you understand & record whether the CSO operates at the kebele level (within 1 or 2 kebeles) or at
the woreda level (covering 3 or more kebeles):
17. What is the membership fee of your CSO (if any?)
[give amount in Birr and for what time period]
18. How many members (if any) are there currently?
Note: the CSO may not be a membership organization
19. How many paid staff members (if any)?
20. What is your position within this CSO

112
2. Resources & Working Relationships
(a) (b) (c) (d) (e)
Woreda / city govt. funds
are made available
Woreda / city govt.
technical support is made
available
Woreda / city govt. staff
support is made available
Other – please describe No support to C
SO
s
available
21. Please indicate the type of
support provided by your local
woreda or city government to
CSOs (in general) in the last year
Y 1 Y 1 Y 1 Y 1
N 2 N 2 N 2 N 2 No support 2
DK 99 DK 99 DK 99 DK 99 DK 99
22. Please indicate the type of
support provided to your CSO
specifically by the woreda or city
government administration in the
last year
Y 1 Y 1 Y 1 Y 1
N 2 N 2 N 2 N 2 No support 2
DK 99 DK 99 DK 99 DK 99 DK 99
[If funds were provided complete Q 23]
23. How much financial support was provided to your CSO last
year by the woreda or city govt. in the last financial year? [Enter amount in Birr]
24. How much financial support was provided to your CSO last
year by the kebele in the last financial year? [Enter amount in Birr]
25. What other sources provided financial support during the last
financial year – please name source or sources.
(a) (b) (c)
CS
O fund
transfer to w
oreda / city
govt.
Com
munity
work support
for capital
investment
Other support – please describe
26. What kind of support did your CSO provide to the woreda or city govt, in the last financial year?
Y 1
Y 1
Y 1
N 2 N 2 N 2
DK 99 DK 99 DK 99
[If funds were provided complete Q27]

113
27. How much financial support was provided by your CSO last year to the woreda or city govt. in the last financial year? [Enter amount in Birr]
3. Public Information
Method through which information is made available [circle appropriate box or boxes – more than 1 method may apply]
(a) (b) (c) (d) (e) (f) (g) (h)
Which of the following have been made available to this CSO:
Available yes / no /
Don’t know
IF Y
ES
, (a) wh
en &
ho
w w
ere these m
ade availab
le …com
plete (b)
to (i)
Date (E
.c.) last made
available
Council m
eeting
Radio
Annual m
eeting
Kebele
CS
O forum
Other (specify) – complete below
28. Budget for woreda / city govt.
Y 1
28c 28d 28e 28f 28g 28h N 2
DK 99
29. Woreda / city govt. Annual Reports
Y 1
29c 29d 29e 29f 29g 29h N 2
DK 99
30. Woreda / city govt. Audit Reports
Y 1
30c 30d 30e 30f 30g 30h N 2
DK 99
31. Woreda / city govt. Strategic Plan
Y
1
31c 31d 31e 31f 31g 31h N 2
DK 99
32. Agenda of Council Meetings
Y 1
32c 32d 32e 32f 32g 32h N 2
DK 99
33. Decisions taken by Council
Y 1
33c 33d 33e 33f 33g 33h N 2
DK 99
34. (h) Are there any other methods through which the above are made available (specify) – see above

114
35. Do you have any further comments on the distribution of information by the woreda / city government?
(a) (b) (c) (d) (e)
Very satisfied
Quite satisfied
Quite dissatisfied
Very dissatisfied
[Do not read out this option]
DK
36. Overall, how satisfied are you with the information provided by the woreda / city govt. to your CSO (budgets, reports, strategic plans, council meeting agendas, decisions taken by council or other information) ? [Tick 1 box only]
37. Please give reasons for your answer [Prompt for at least 2 reasons]

115
4. Consultation
38. Have any Woreda / city govt. officials (staff other than councilors) ever actively sought the views of your CSO concerning:
Yes No Don’t know
A. The most important development needs in this area 1 2 99
B. The quality of any public services 1 2 99
39. In the past financial year have any Woreda / city govt. Officials sought the views of your CSO on these issues?
1 2 99
40. In the past year have any Woreda / city govt. councilors actively sought the views of your CSO concerning other issues:
1 2 99
41. For which other (if any) issues has the Woreda / city govt. actively sought the views of your CSO? [Please describe the issues ensuring that all issues are included]. [Prompt to ensure we understand & record whether this is a regular or occasional occurrence.] [Prompt to ensure we know when this has happened – this year, last year or when – please record.]

116
42. Have any Woreda / city govt. officials (staff other than councilors) used the views of your CSO concerning:
Yes No DK
A. The most important development needs in this Kebele Y 1 N 2
DK 99
B. The quality of any public services Y 1 N 2
DK 99
C. Any other issues Y 1 N 2
DK 99
43. Please describe your understanding of how the woreda / city government officials have used the views of your CSO.
(a) Strategic Plan (b) Budget capital investment plan
(c.) Changes in service delivery
44. In the last 2 years has your CSO been consulted by the woreda / city govt. in the preparation of :
Y 1 N 2 DK 99 Y 1 N 2 DK 99 Y 1 N 2 DK 99
45. Please can you explain how you were consulted on the strategic plan. IF NO, consultation took place, please explain your understanding of why there was no consultation. (a) strategic plan

117
46. IF YES, please can you explain how you were consulted on the budget capital investment plan. IF NO, consultation took place, please explain your understanding of why there was no consultation. (b) budget / capital investment plan
47. IF YES, please can you explain how you were consulted on changes in service delivery). IF NO consultation took place, please explain your understanding of why there was no consultation. (c) changes in service delivery
(a) (b) (c) (d) (e) (f)
48. Are the results of woreda / city govt. consultations with CSOs or communities written down and made public? [Circle as many as apply]
Y If Yes, by general community or public meeting
If Yes, by kebele meeting
If Yes, by public announcement [on notice or other public board]
If Yes, through the media (radio, newspaper)
If Yes, by other (specify below)
N
DK
49. (e) Other – specify and describe:

118
5. Service Provision
50. Have any of the services provided by the woreda or city government been designed or planned in co-operation with your CSO
Y 1 If YES go to Q. 51
N
2 If NO go to Q. 54
DK
99 If DK go to Q. 55
51. IF YES, which services were designed in cooperation with your CSO? (please list all) [and prompt for others as appropriate]
1
2
3
4
5
6
7
8
(a) (b) (c) (d)
52.
IF YES, how did your CSO provide input into service design or planning [circle as many as apply]
In Public meetings
In meetings between CSOs & the administration
By involving your CSO in service delivery
[By other means – please describe in the space below]
53. (d) By other means … Please describe
54. IF NO, please explain why this has not happened
55. If DON’T KNOW, please explain why you do not know.

119
56. If your CSO were to make a complaint about service delivery are you confident that any action will be taken by the woreda or city government as a result? [circle one response only]
Very confident
1
Moderately confident
2
Moderately doubtful 3
Very doubtful 4
[Do not read this option] DK
99
57. Please give reasons for your answer (prompt to make sure at least 2 reasons are given). [Ensure that you record at which level action is undertaken]
6. The Registration Process for CSOs
58. Is this CSO registered? Y 1
(If YES go to Q.59) N 2
(If NO go to Q.60)
DK 99
(If DK go to Q. 61)
59. How easy or difficult was it to register the CSO?
Very easy Fairly easy Fairly difficult Very difficult
60. You say this CSO is not registered, please can you give the reasons for this.
61. Please name the 2
(or more) most
severe problems or
challenges in the
area of registering
CSOs.
1
2

120
3
4
62. Additional comments (if any): Anything else you would like to add concerning the registration of this CSO or CSOs more generally?
7. Accountability & Complaint Procedures
63. Does the Woreda / city govt. fail to keep its promises Y 1 (If YES go to Q.64)
Sometimes [if sometimes go to Q. 64]
N 2
(If NO go to Q.69)
DK 99
(If DK go to Q.69)
64. If Woreda /city govt. fail to keep their promises how much do you think your CSO can do to improve the situation? [circle one response only]
A. A great deal 3
B. Something 2
C. Very little 1
D. Nothing 0
E. Don’t know (do not read out) 99
65.
Please give reasons for your answer (prompt for at least 2 reasons)
1
2
3

121
4
66. Which of the following would you find effective, if any, as a CSO representative, in putting pressure on Woreda / city govt. leaders to keep their promises? [circle as many as apply]
A. Community meetings 1
B. Contacting your Regional leadership 2
C. Local elections 3
D. Community-based organizations 4
E. Other (specify & describe)
5
F. Don’t know (do not read out) 99
67. Please give reasons for your answer:

122
68. Please can you give example of times (if any) when your CSO has made a complaint. Please describe what happened.
69. Anything you would like to add about the survey overall?
CLOSING REMARKS

123
ANNEX 2: Jurisdictions selected for FGDs and KIIs
Region Zone Woreda Type No. of
KIIs
Nos. of
FGDs
ADDIS ABABA Addis Ababa City
Administration
Akaki Kaliti Municipality with state
function
5 0
AFFAR Zone 3 Awash Fentale Woreda 5 3
AMHARA Bahir Dar Bahir Dar City Municipality with state
function
5 2
AMHARA North Shewa Antsokiya Gemza - Woreda Woreda 5 3
AMHARA North Wello Habru-Woreda Woreda 5 2
AMHARA South Gonder Debre Tabor City Municipality with state
function
5 0
AMHARA South Gonder Fogera-Woreda Woreda 5 2
AMHARA West Gojjam Semen Achefer - Woreda Municipality with state
function
5 2
BENISHANGUL-
GUMUZ
Mao Komo Special Zone Mao Komo Special Woreda Woreda 5 3
GAMBELLA Nuwer Wantawa Woreda Woreda 5 3
OROMIYA Arsi Amigna-Woreda Municipality with state
function
5 2
OROMIYA Borena Teltele-Woreda Woreda 5 3
OROMIYA East Hararge Melka Belo-Woreda Woreda 5 2
OROMIYA North Shewa Were Jarso-Woreda Woreda 5 2
OROMIYA West Hararge Habro-Woreda Woreda 5 2
OROMIYA West Arsi Arsi Negele Woreda 5 3
OROMIYA West Arsi Kofele-Woreda Municipality 5 2
OROMIYA West Arsi Siraro-Woreda Woreda 5 2
OROMIYA West Arsi Shashemene Municipality with state
function
5 0
OROMIYA West Shewa Cheliya-Woreda Woreda 5 2
OROMIYA West Shewa Ambo Municipality with state
function
5 2
SNNP Gamo Gofa Zone Arba Minch Municipality with state
function
5 2
SNNP Gedeo Kochire-Woreda Woreda 5 3
SNNP Hawassa City Hawassa City Municipality with state 5 3
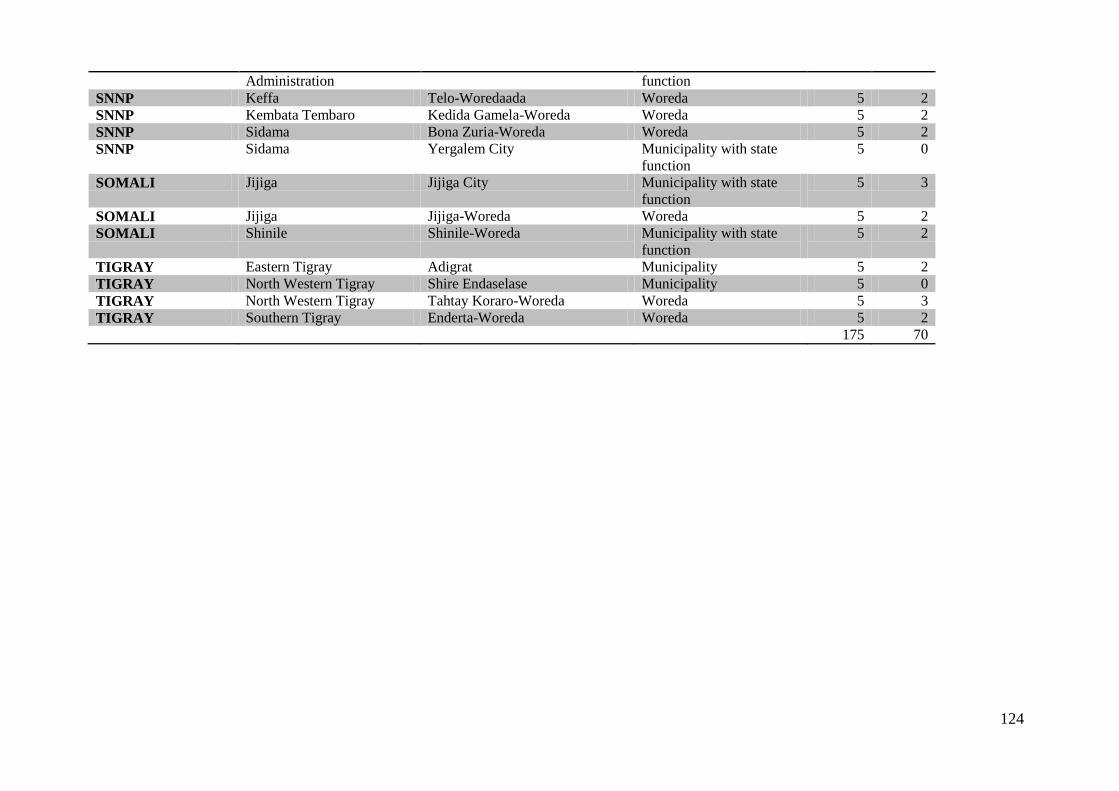
124
Administration function
SNNP Keffa Telo-Woredaada Woreda 5 2
SNNP Kembata Tembaro Kedida Gamela-Woreda Woreda 5 2
SNNP Sidama Bona Zuria-Woreda Woreda 5 2
SNNP Sidama Yergalem City Municipality with state
function
5 0
SOMALI Jijiga Jijiga City Municipality with state
function
5 3
SOMALI Jijiga Jijiga-Woreda Woreda 5 2
SOMALI Shinile Shinile-Woreda Municipality with state
function
5 2
TIGRAY Eastern Tigray Adigrat Municipality 5 2
TIGRAY North Western Tigray Shire Endaselase Municipality 5 0
TIGRAY North Western Tigray Tahtay Koraro-Woreda Woreda 5 3
TIGRAY Southern Tigray Enderta-Woreda Woreda 5 2
175 70

125
ANNEX 3: Main question areas in CRC (Citizen Report Card) and Supply-side Questionnaire (SSQ) that correspond with discussion topics and questions in FGD and KII
Topic in FGD Related question numbers in Woreda CRC
Related question numbers in City Government CRC
Related question numbers in SSQ
Health 23,24,25 23,24,25 80,107,119
Education 120 -128
Agriculture 28 - 38
Police services 145 - 153
Justice services 154 - 162
Complaints procedures (also in KII)
19, 20, 26, 27, 39, 40, 44, 45, 56
19,20,26, 27, 37, 38, 49, 50
103, 134, 147
Taxation 28 - 35 28 -35 42, 43 and 45
Budget and strategic plan (also in KII)
49 39 21, 25, 61, 62
Consultation on quality of local services (also in KII)
51B, 53B 41B, 43B 45, 80
Consultation on important development needs(also in KII)
51A, 53A 41A, 43A
Topic in KII
Preparation of strategic plans
21,25,61,62
CSO involvement in design & planning of public services
62, 127
Dissemination of consultation results
63
Public information & empowerment of CSOs
66