surge pressure in plumbing pipe materials · pdf filesurge pressure in plumbing pipe materials...
TRANSCRIPT
Surge Pressure in Plumbing Pipe Materials
Prepared for
Plastics Pipe Institute, Inc. 105 Decker Court, Suite 825
Irving, Texas 75062
Prepared by
NAHB Research Center 400 Prince George’s Blvd. Upper Marlboro, MD 20774
Report # 3285_20081013
FINAL REPORT
March 2009

Disclaimer Neither the NAHB Research Center, Inc., nor any person acting on its behalf, makes any warranty, express or implied, with respect to the use of any information, apparatus, method, or process disclosed in this publication or that such use may not infringe privately owned rights, or assumes any liabilities with respect to the use of, or for damages resulting from the use of, any information, apparatus, method, or process disclosed in this publication, or is responsible for statements made or opinions expressed by individual authors.
Surge Pressure in Plumbing Pipe Materials
Table of Contents Executive Summary ........................................................................................................ 1 Objective ......................................................................................................................... 1 Background ..................................................................................................................... 1 Test Setup....................................................................................................................... 1 Test Method .................................................................................................................... 4 Results ............................................................................................................................ 4 Analysis........................................................................................................................... 4 Conclusions................................................................................................................... 16
List of Tables Table 1 - First Peak Pressure for Each Piping Material and Flow Rate (Cold Water) ..... 5 Table 2 - First Peak Pressure for Each Piping Material and Flow Rate (Hot Water) ....... 5 Table 3: Peak Pressure Comparison – 2.5 GPM Cold Water Flow, 54ºF Water .......... 16 Table 4: Peak Pressure Comparison – 2.5 GPM Hot Water Flow, 130ºF Water .......... 16
List of Figures Figure 1: Test setup schematic ....................................................................................... 3 Figure 2A: Cold Water at 6 gpm – Full Period................................................................. 6 Figure 2B: Cold Water at 6 gpm – First 2000 ms ............................................................ 7 Figure 3A: Hot Water at 6 gpm – Full Period................................................................... 8 Figure 3B: Hot Water at 6 gpm – First 2000 ms .............................................................. 9 Figure 4A: Cold Water at 2.5 gpm – Full Period............................................................ 10 Figure 4B: Cold Water at 2.5 gpm – First 2000 ms ....................................................... 11 Figure 5A: Hot Water at 2.5 gpm – Full Period.............................................................. 12 Figure 5B: Hot Water at 2.5 gpm – First 200 ms ........................................................... 13 Figure 6A: Type L Copper Repeatability – Full Period .................................................. 14 Figure 6B: Type L Copper Repeatability – 400 to 600 ms............................................. 15 Figure 7: Comparison of Piping Pressure Response
to Quick-Acting Valve with Cold Water Flows .......................................................... 17 Figure 8: Comparison of Piping Pressure Response
to Quick-Acting Valve with Hot Water Flows............................................................ 18
i

Surge Pressure in Plumbing Pipe Materials
Surge Pressure in Plumbing Pipe Materials
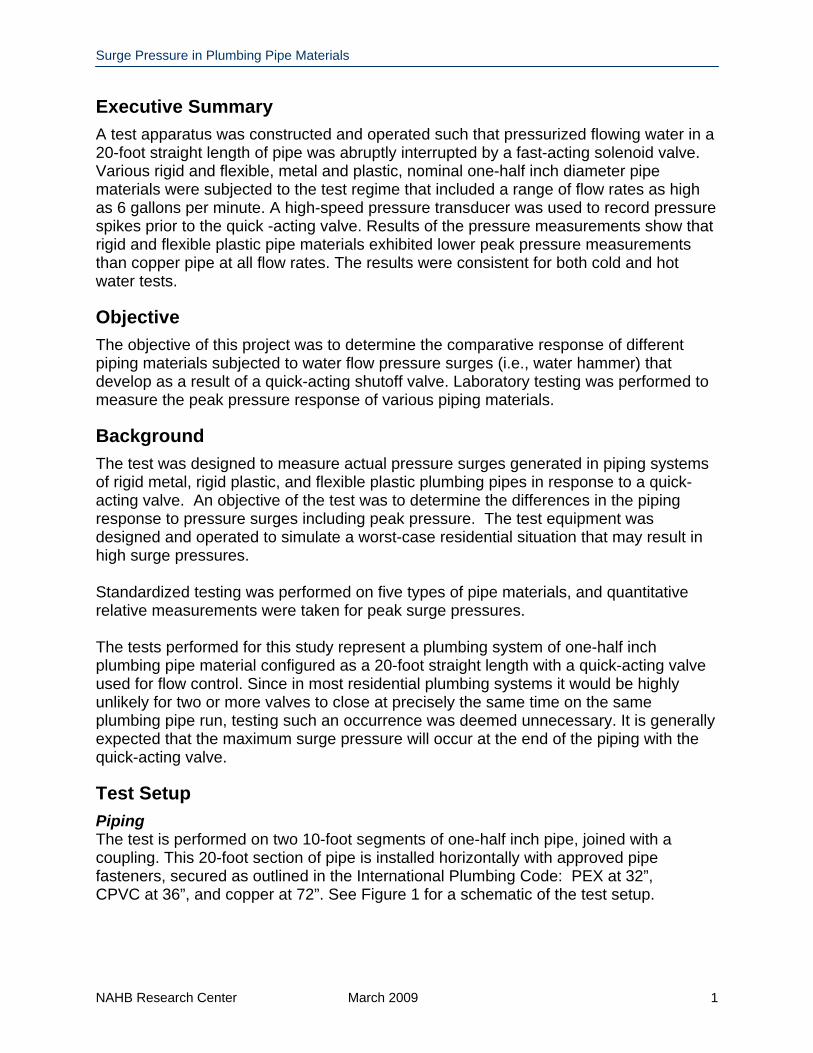
Executive Summary A test apparatus was constructed and operated such that pressurized flowing water in a 20-foot straight length of pipe was abruptly interrupted by a fast-acting solenoid valve. Various rigid and flexible, metal and plastic, nominal one-half inch diameter pipe materials were subjected to the test regime that included a range of flow rates as high as 6 gallons per minute. A high-speed pressure transducer was used to record pressure spikes prior to the quick -acting valve. Results of the pressure measurements show that rigid and flexible plastic pipe materials exhibited lower peak pressure measurements than copper pipe at all flow rates. The results were consistent for both cold and hot water tests.
Objective The objective of this project was to determine the comparative response of different piping materials subjected to water flow pressure surges (i.e., water hammer) that develop as a result of a quick-acting shutoff valve. Laboratory testing was performed to measure the peak pressure response of various piping materials.
Background The test was designed to measure actual pressure surges generated in piping systems of rigid metal, rigid plastic, and flexible plastic plumbing pipes in response to a quick-acting valve. An objective of the test was to determine the differences in the piping response to pressure surges including peak pressure. The test equipment was designed and operated to simulate a worst-case residential situation that may result in high surge pressures. Standardized testing was performed on five types of pipe materials, and quantitative relative measurements were taken for peak surge pressures. The tests performed for this study represent a plumbing system of one-half inch plumbing pipe material configured as a 20-foot straight length with a quick-acting valve used for flow control. Since in most residential plumbing systems it would be highly unlikely for two or more valves to close at precisely the same time on the same plumbing pipe run, testing such an occurrence was deemed unnecessary. It is generally expected that the maximum surge pressure will occur at the end of the piping with the quick-acting valve.
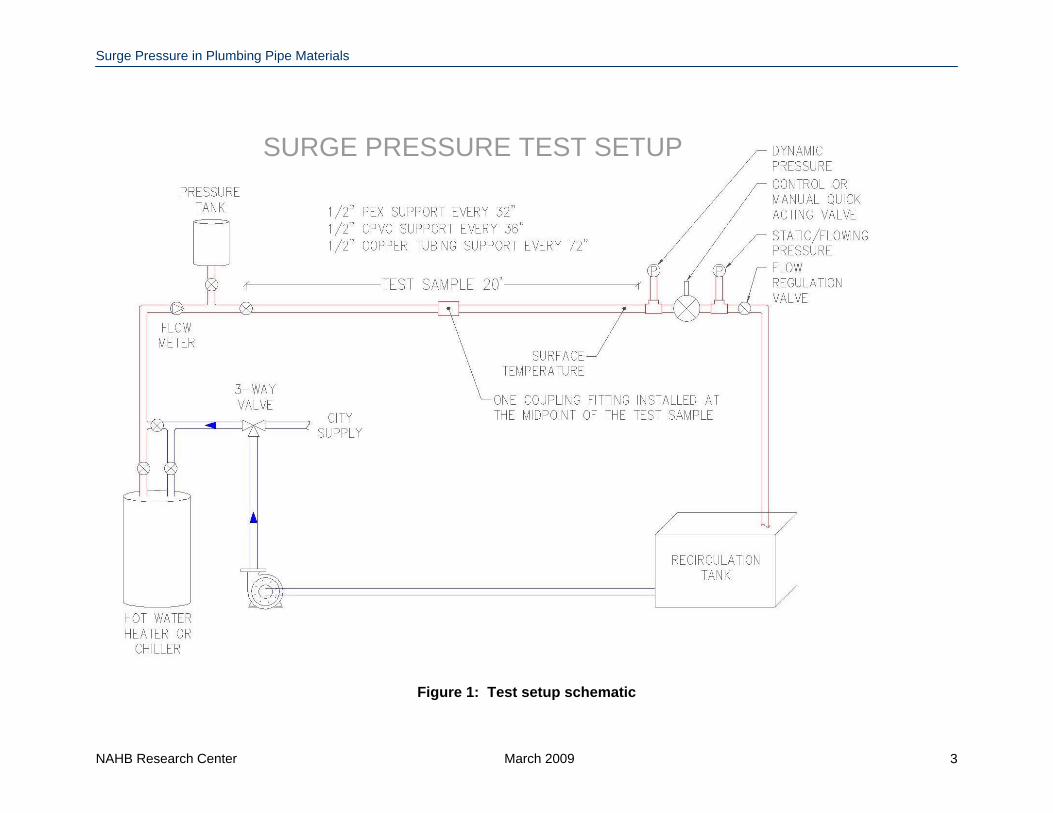
Test Setup Piping The test is performed on two 10-foot segments of one-half inch pipe, joined with a coupling. This 20-foot section of pipe is installed horizontally with approved pipe fasteners, secured as outlined in the International Plumbing Code: PEX at 32”, CPVC at 36”, and copper at 72”. See Figure 1 for a schematic of the test setup.
NAHB Research Center March 2009 1
Surge Pressure in Plumbing Pipe Materials
NAHB Research Center March 2009 2
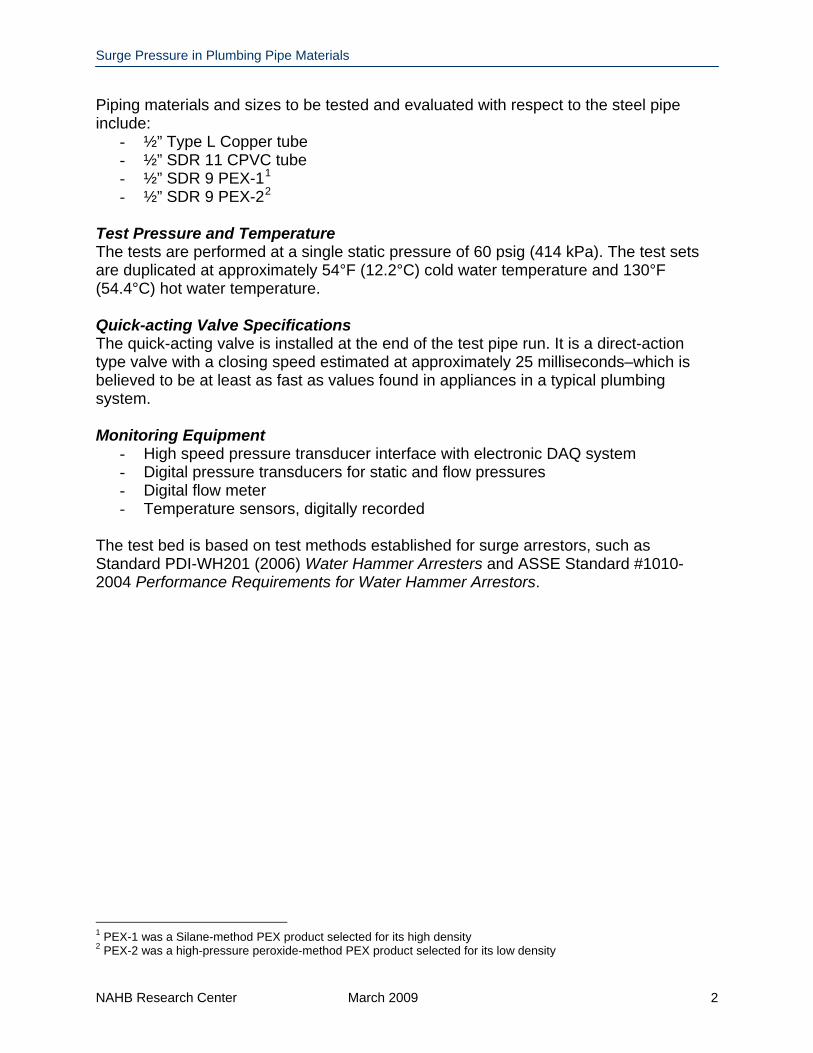
Piping materials and sizes to be tested and evaluated with respect to the steel pipe include:
- ½” Type L Copper tube - ½” SDR 11 CPVC tube - ½” SDR 9 PEX-11 - ½” SDR 9 PEX-22
Test Pressure and Temperature The tests are performed at a single static pressure of 60 psig (414 kPa). The test sets are duplicated at approximately 54°F (12.2°C) cold water temperature and 130°F (54.4°C) hot water temperature. Quick-acting Valve Specifications The quick-acting valve is installed at the end of the test pipe run. It is a direct-action type valve with a closing speed estimated at approximately 25 milliseconds–which is believed to be at least as fast as values found in appliances in a typical plumbing system. Monitoring Equipment
- High speed pressure transducer interface with electronic DAQ system - Digital pressure transducers for static and flow pressures - Digital flow meter - Temperature sensors, digitally recorded
The test bed is based on test methods established for surge arrestors, such as Standard PDI-WH201 (2006) Water Hammer Arresters and ASSE Standard #1010-2004 Performance Requirements for Water Hammer Arrestors.
1 PEX-1 was a Silane-method PEX product selected for its high density 2 PEX-2 was a high-pressure peroxide-method PEX product selected for its low density
Surge Pressure in Plumbing Pipe Materials
SURGE PRESSURE TEST SETUP
Figure 1: Test setup schematic
NAHB Research Center March 2009 3
Surge Pressure in Plumbing Pipe Materials
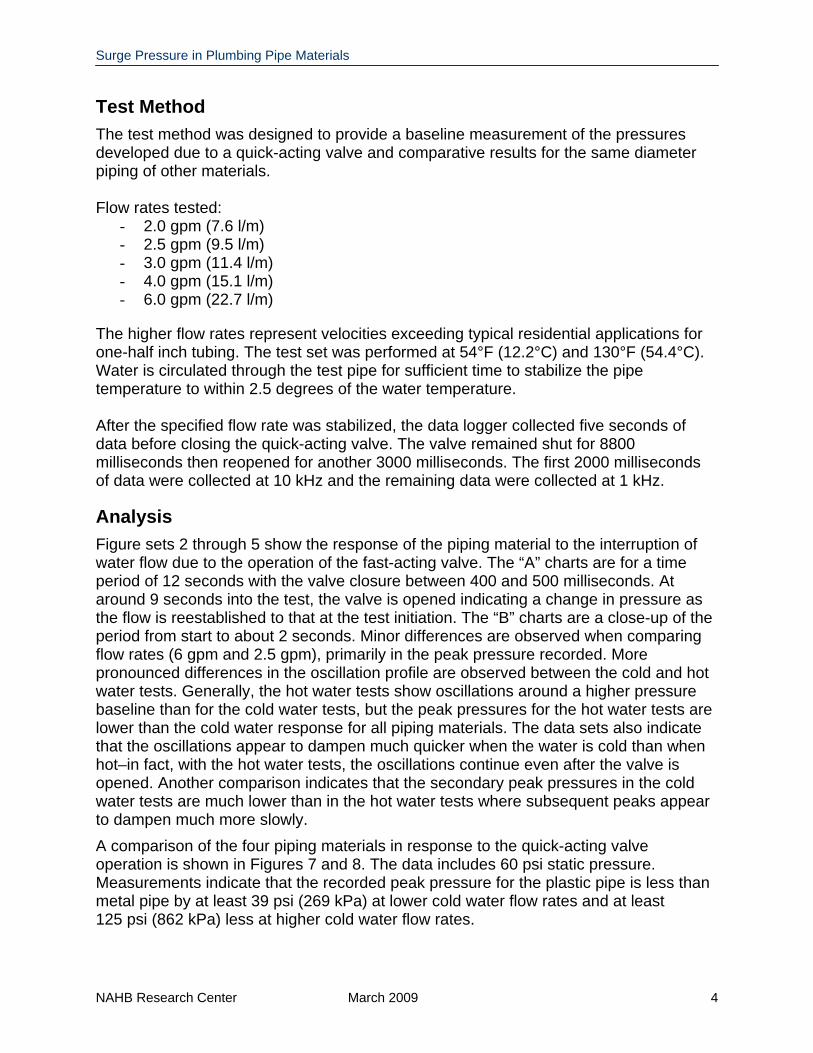
Test Method The test method was designed to provide a baseline measurement of the pressures developed due to a quick-acting valve and comparative results for the same diameter piping of other materials. Flow rates tested:
- 2.0 gpm (7.6 l/m) - 2.5 gpm (9.5 l/m) - 3.0 gpm (11.4 l/m) - 4.0 gpm (15.1 l/m) - 6.0 gpm (22.7 l/m)
The higher flow rates represent velocities exceeding typical residential applications for one-half inch tubing. The test set was performed at 54°F (12.2°C) and 130°F (54.4°C). Water is circulated through the test pipe for sufficient time to stabilize the pipe temperature to within 2.5 degrees of the water temperature. After the specified flow rate was stabilized, the data logger collected five seconds of data before closing the quick-acting valve. The valve remained shut for 8800 milliseconds then reopened for another 3000 milliseconds. The first 2000 milliseconds of data were collected at 10 kHz and the remaining data were collected at 1 kHz.
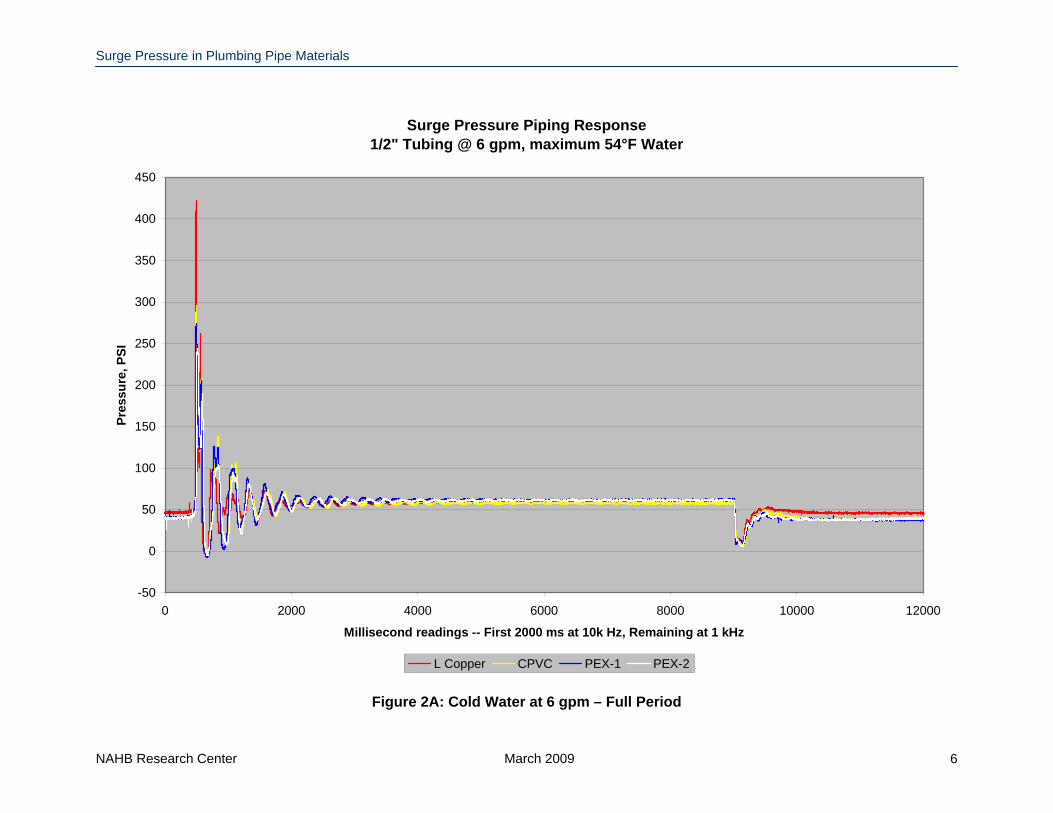
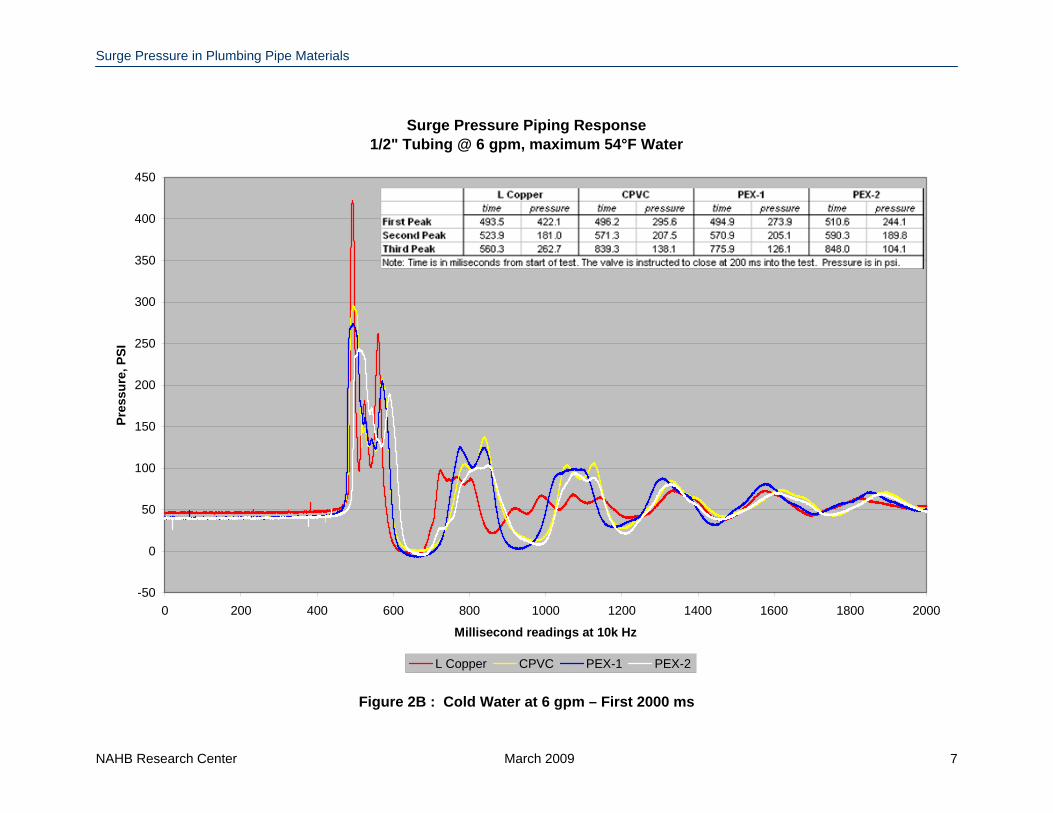
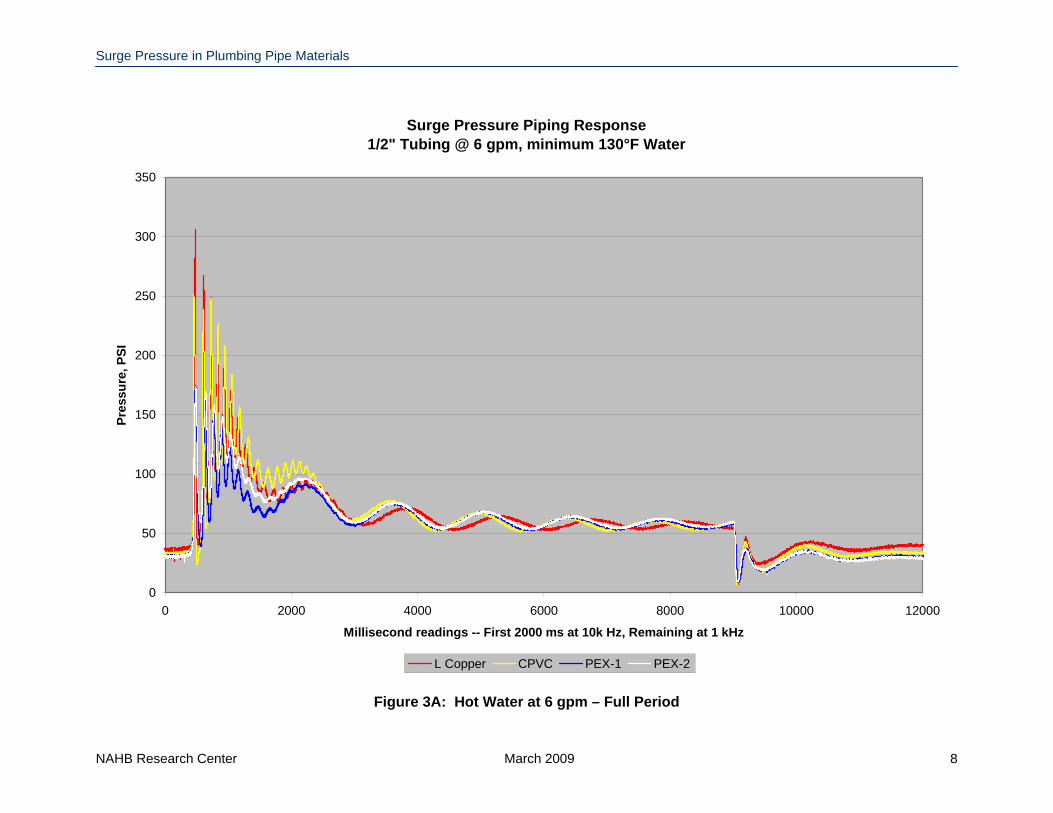
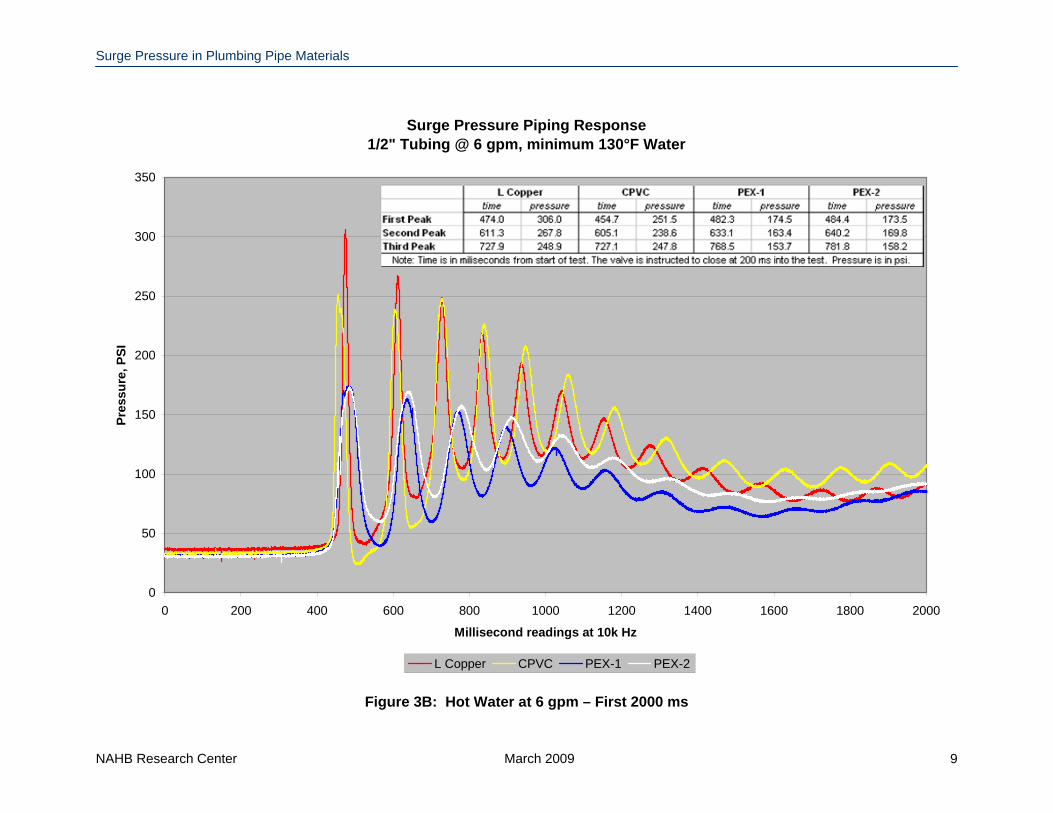
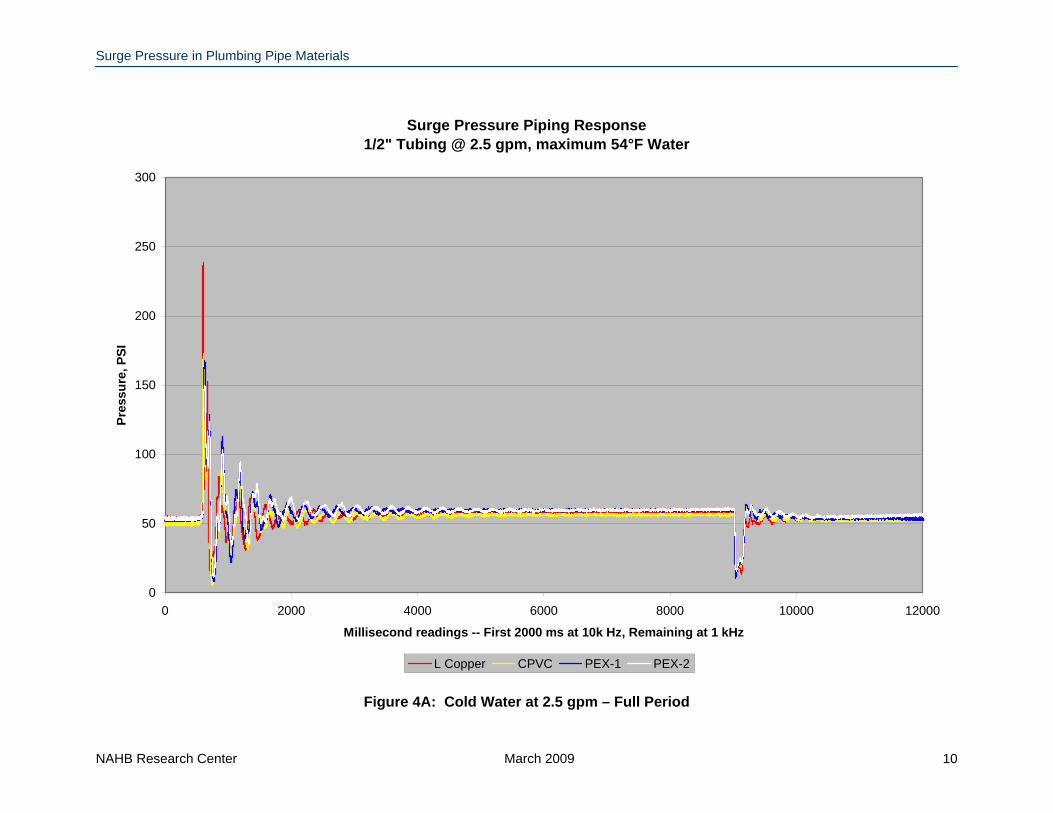
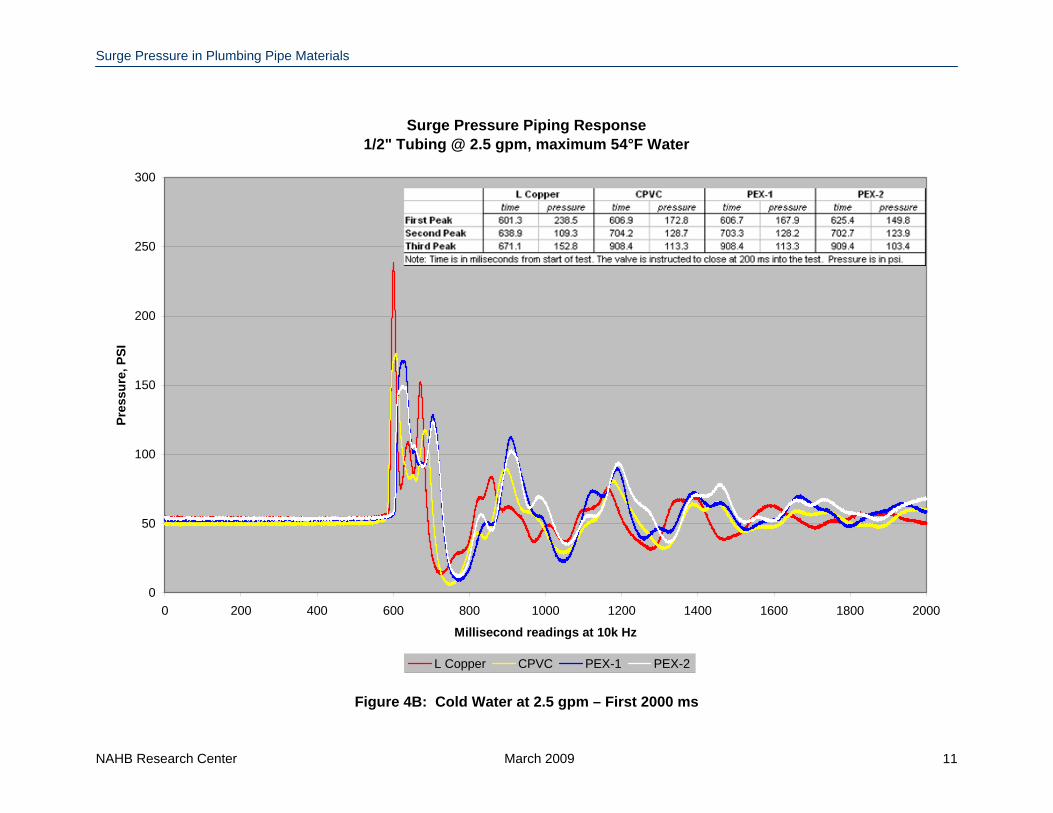
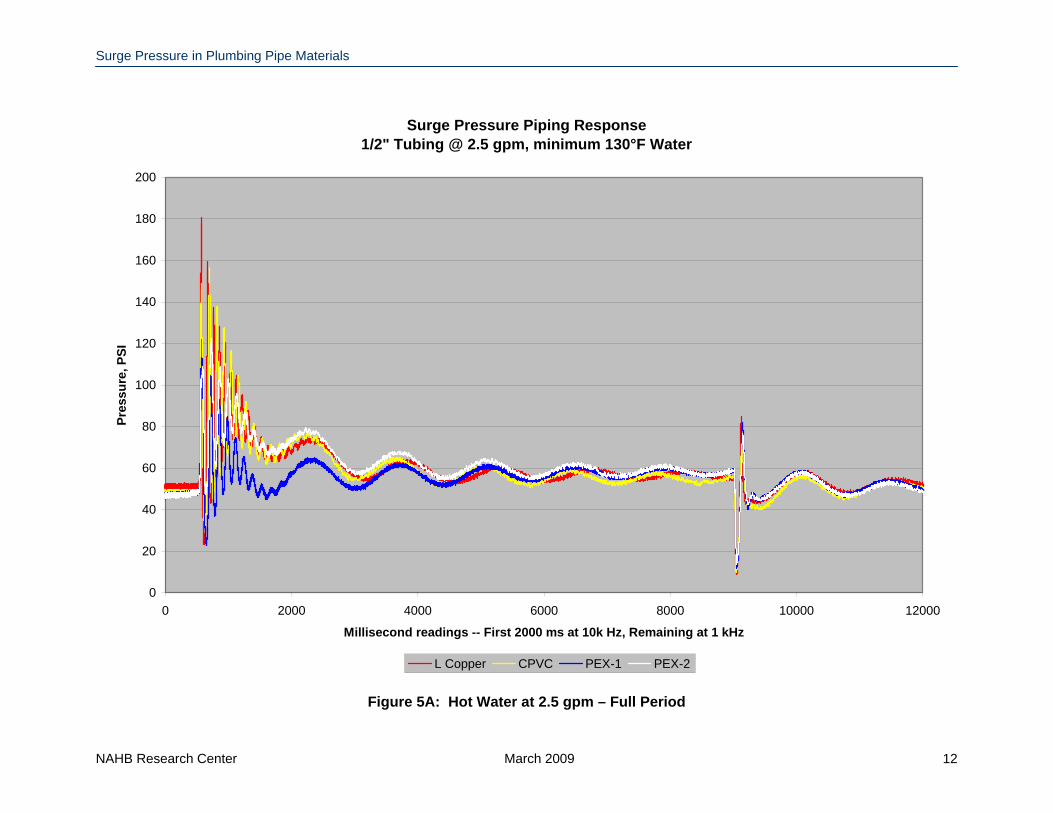
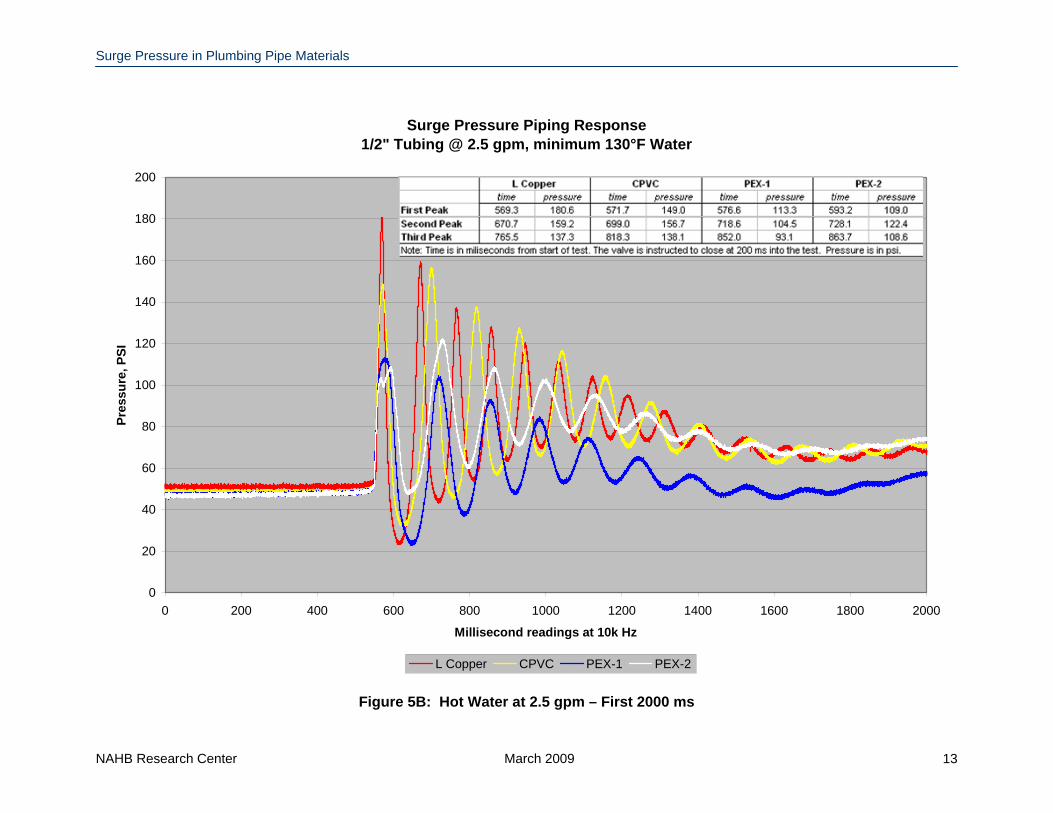
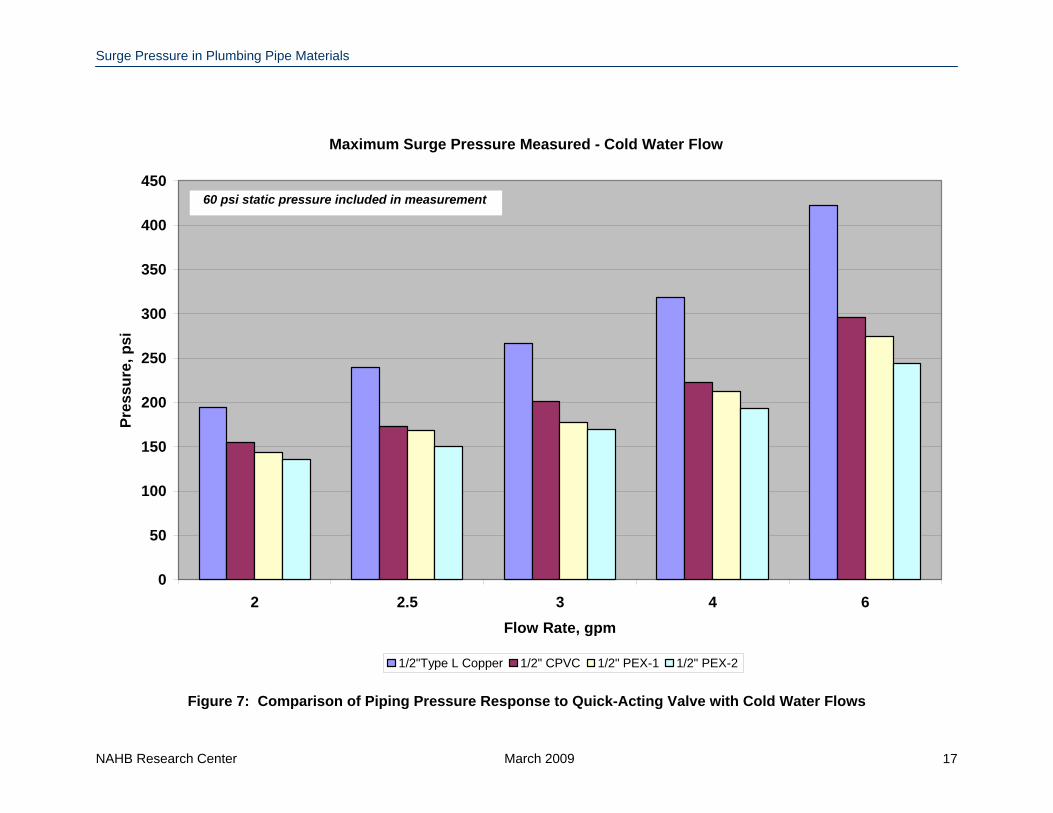
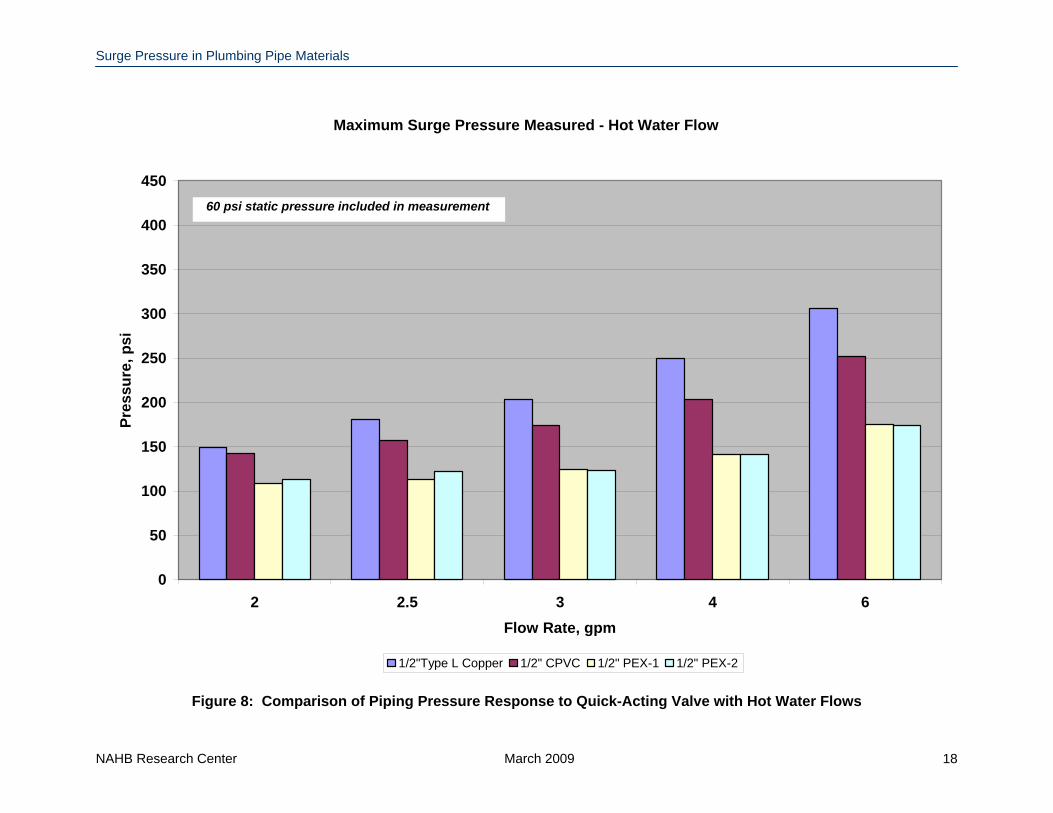
Analysis Figure sets 2 through 5 show the response of the piping material to the interruption of water flow due to the operation of the fast-acting valve. The “A” charts are for a time period of 12 seconds with the valve closure between 400 and 500 milliseconds. At around 9 seconds into the test, the valve is opened indicating a change in pressure as the flow is reestablished to that at the test initiation. The “B” charts are a close-up of the period from start to about 2 seconds. Minor differences are observed when comparing flow rates (6 gpm and 2.5 gpm), primarily in the peak pressure recorded. More pronounced differences in the oscillation profile are observed between the cold and hot water tests. Generally, the hot water tests show oscillations around a higher pressure baseline than for the cold water tests, but the peak pressures for the hot water tests are lower than the cold water response for all piping materials. The data sets also indicate that the oscillations appear to dampen much quicker when the water is cold than when hot–in fact, with the hot water tests, the oscillations continue even after the valve is opened. Another comparison indicates that the secondary peak pressures in the cold water tests are much lower than in the hot water tests where subsequent peaks appear to dampen much more slowly. A comparison of the four piping materials in response to the quick-acting valve operation is shown in Figures 7 and 8. The data includes 60 psi static pressure. Measurements indicate that the recorded peak pressure for the plastic pipe is less than metal pipe by at least 39 psi (269 kPa) at lower cold water flow rates and at least 125 psi (862 kPa) less at higher cold water flow rates.
NAHB Research Center March 2009 4
Surge Pressure in Plumbing Pipe Materials
NAHB Research Center March 2009 5
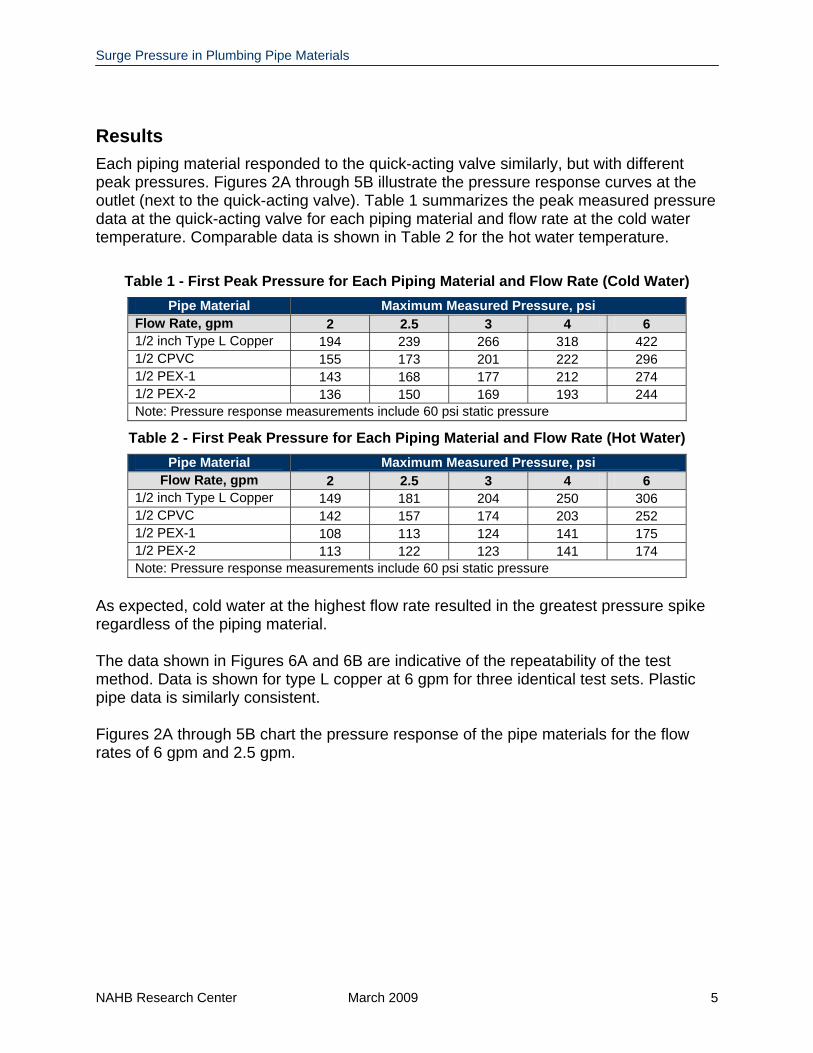
Results Each piping material responded to the quick-acting valve similarly, but with different peak pressures. Figures 2A through 5B illustrate the pressure response curves at the outlet (next to the quick-acting valve). Table 1 summarizes the peak measured pressure data at the quick-acting valve for each piping material and flow rate at the cold water temperature. Comparable data is shown in Table 2 for the hot water temperature.
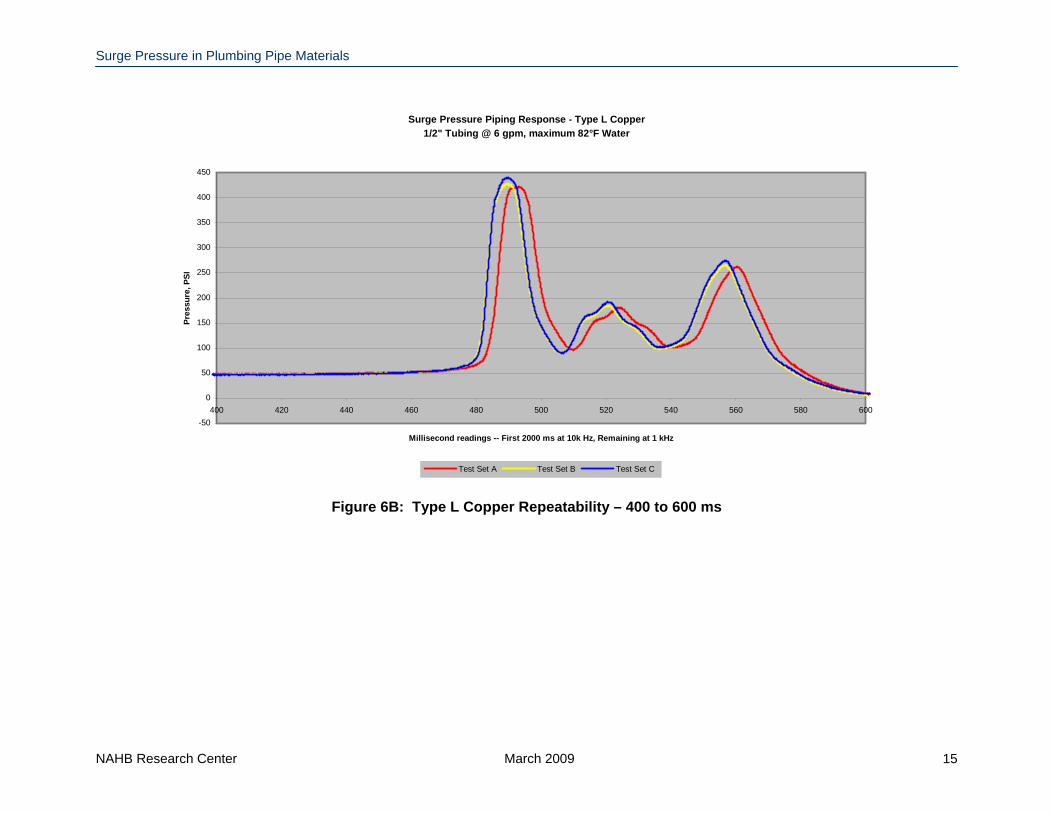
Table 1 - First Peak Pressure for Each Piping Material and Flow Rate (Cold Water) Pipe Material Maximum Measured Pressure, psi
Flow Rate, gpm 2 2.5 3 4 6 1/2 inch Type L Copper 194 239 266 318 422 1/2 CPVC 155 173 201 222 296 1/2 PEX-1 143 168 177 212 274 1/2 PEX-2 136 150 169 193 244 Note: Pressure response measurements include 60 psi static pressure
Table 2 - First Peak Pressure for Each Piping Material and Flow Rate (Hot Water) Pipe Material Maximum Measured Pressure, psi
Flow Rate, gpm 2 2.5 3 4 6 1/2 inch Type L Copper 149 181 204 250 306 1/2 CPVC 142 157 174 203 252 1/2 PEX-1 108 113 124 141 175 1/2 PEX-2 113 122 123 141 174 Note: Pressure response measurements include 60 psi static pressure
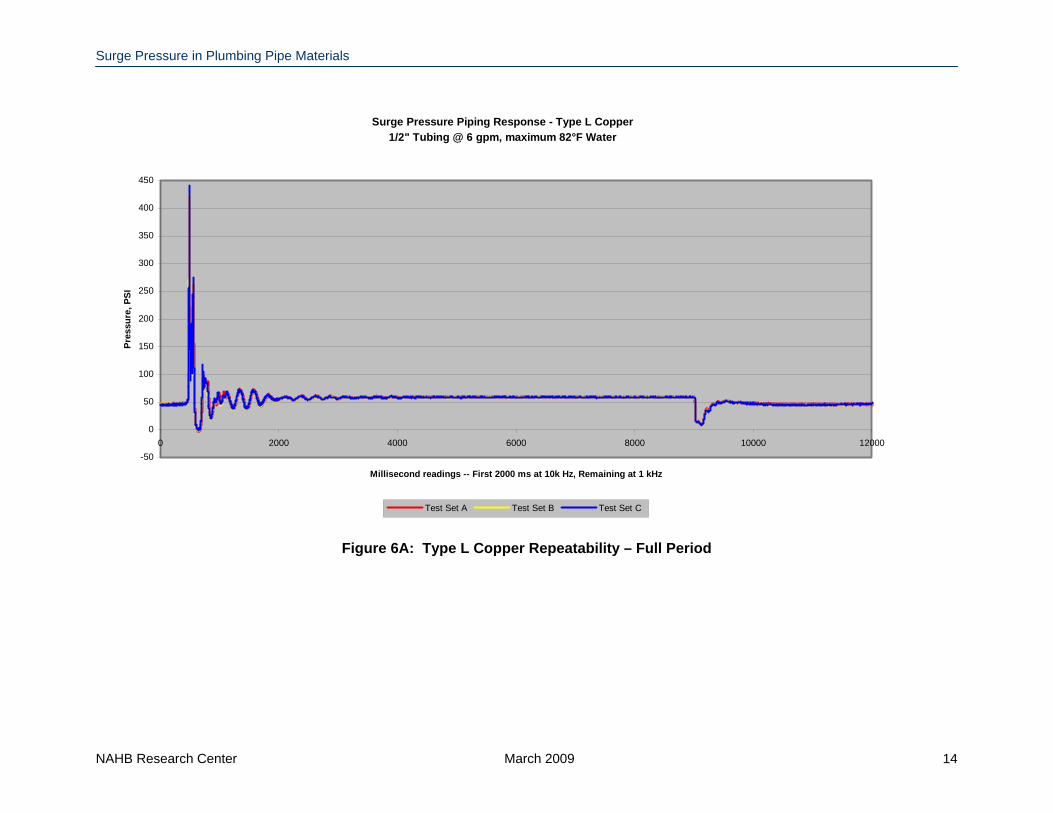
As expected, cold water at the highest flow rate resulted in the greatest pressure spike regardless of the piping material. The data shown in Figures 6A and 6B are indicative of the repeatability of the test method. Data is shown for type L copper at 6 gpm for three identical test sets. Plastic pipe data is similarly consistent. Figures 2A through 5B chart the pressure response of the pipe materials for the flow rates of 6 gpm and 2.5 gpm.
Surge Pressure in Plumbing Pipe Materials
Surge Pressure Piping Response1/2" Tubing @ 6 gpm, maximum 54°F Water
-50
0
50
100
150
200
250
300
350
400
450
0 2000 4000 6000 8000 10000 12000
Millisecond readings -- First 2000 ms at 10k Hz, Remaining at 1 kHz
Pres
sure
, PSI
L Copper CPVC PEX-1 PEX-2
Figure 2A: Cold Water at 6 gpm – Full Period
NAHB Research Center March 2009 6
Surge Pressure in Plumbing Pipe Materials
Surge Pressure Piping Response1/2" Tubing @ 6 gpm, maximum 54°F Water
-50
0
50
100
150
200
250
300
350
400
450
0 200 400 600 800 1000 1200 1400 1600 1800 2000
Millisecond readings at 10k Hz
Pres
sure
, PSI
L Copper CPVC PEX-1 PEX-2
Figure 2B : Cold Water at 6 gpm – First 2000 ms
NAHB Research Center March 2009 7
Surge Pressure in Plumbing Pipe Materials
Surge Pressure Piping Response1/2" Tubing @ 6 gpm, minimum 130°F Water
0
50
100
150
200
250
300
350
0 2000 4000 6000 8000 10000 12000
Millisecond readings -- First 2000 ms at 10k Hz, Remaining at 1 kHz
Pres
sure
, PSI
L Copper CPVC PEX-1 PEX-2
Figure 3A: Hot Water at 6 gpm – Full Period
NAHB Research Center March 2009 8
Surge Pressure in Plumbing Pipe Materials
Surge Pressure Piping Response1/2" Tubing @ 6 gpm, minimum 130°F Water
0
50
100
150
200
250
300
350
0 200 400 600 800 1000 1200 1400 1600 1800 2000
Millisecond readings at 10k Hz
Pres
sure
, PSI
L Copper CPVC PEX-1 PEX-2
Figure 3B: Hot Water at 6 gpm – First 2000 ms
NAHB Research Center March 2009 9
Surge Pressure in Plumbing Pipe Materials
Surge Pressure Piping Response1/2" Tubing @ 2.5 gpm, maximum 54°F Water
0
50
100
150
200
250
300
0 2000 4000 6000 8000 10000 12000
Millisecond readings -- First 2000 ms at 10k Hz, Remaining at 1 kHz
Pres
sure
, PSI
L Copper CPVC PEX-1 PEX-2
Figure 4A: Cold Water at 2.5 gpm – Full Period
NAHB Research Center March 2009 10
Surge Pressure in Plumbing Pipe Materials
Surge Pressure Piping Response1/2" Tubing @ 2.5 gpm, maximum 54°F Water
0
50
100
150
200
250
300
0 200 400 600 800 1000 1200 1400 1600 1800 2000
Millisecond readings at 10k Hz
Pres
sure
, PSI
L Copper CPVC PEX-1 PEX-2
Figure 4B: Cold Water at 2.5 gpm – First 2000 ms
NAHB Research Center March 2009 11
Surge Pressure in Plumbing Pipe Materials
Surge Pressure Piping Response1/2" Tubing @ 2.5 gpm, minimum 130°F Water
0
20
40
60
80
100
120
140
160
180
200
0 2000 4000 6000 8000 10000 12000
Millisecond readings -- First 2000 ms at 10k Hz, Remaining at 1 kHz
Pres
sure
, PSI
L Copper CPVC PEX-1 PEX-2
Figure 5A: Hot Water at 2.5 gpm – Full Period
NAHB Research Center March 2009 12
Surge Pressure in Plumbing Pipe Materials
Surge Pressure Piping Response1/2" Tubing @ 2.5 gpm, minimum 130°F Water
0
20
40
60
80
100
120
140
160
180
200
0 200 400 600 800 1000 1200 1400 1600 1800 2000
Millisecond readings at 10k Hz
Pres
sure
, PSI
L Copper CPVC PEX-1 PEX-2
Figure 5B: Hot Water at 2.5 gpm – First 2000 ms
NAHB Research Center March 2009 13
Surge Pressure in Plumbing Pipe Materials
Surge Pressure Piping Response - Type L Copper1/2" Tubing @ 6 gpm, maximum 82°F Water
-50
0
50
100
150
200
250
300
350
400
450
0 2000 4000 6000 8000 10000 12000
Millisecond readings -- First 2000 ms at 10k Hz, Remaining at 1 kHz
Pres
sure
, PSI
Test Set A Test Set B Test Set C
Figure 6A: Type L Copper Repeatability – Full Period
NAHB Research Center March 2009 14
Surge Pressure in Plumbing Pipe Materials
NAHB Research Center March 2009 15
Surge Pressure Piping Response - Type L Copper1/2" Tubing @ 6 gpm, maximum 82°F Water
-50
0
50
100
150
200
250
300
350
400
450
400 420 440 460 480 500 520 540 560 580 600
Millisecond readings -- First 2000 ms at 10k Hz, Remaining at 1 kHz
Pres
sure
, PSI
Test Set A Test Set B Test Set C
Figure 6B: Type L Copper Repeatability – 400 to 600 ms
Surge Pressure in Plumbing Pipe Materials
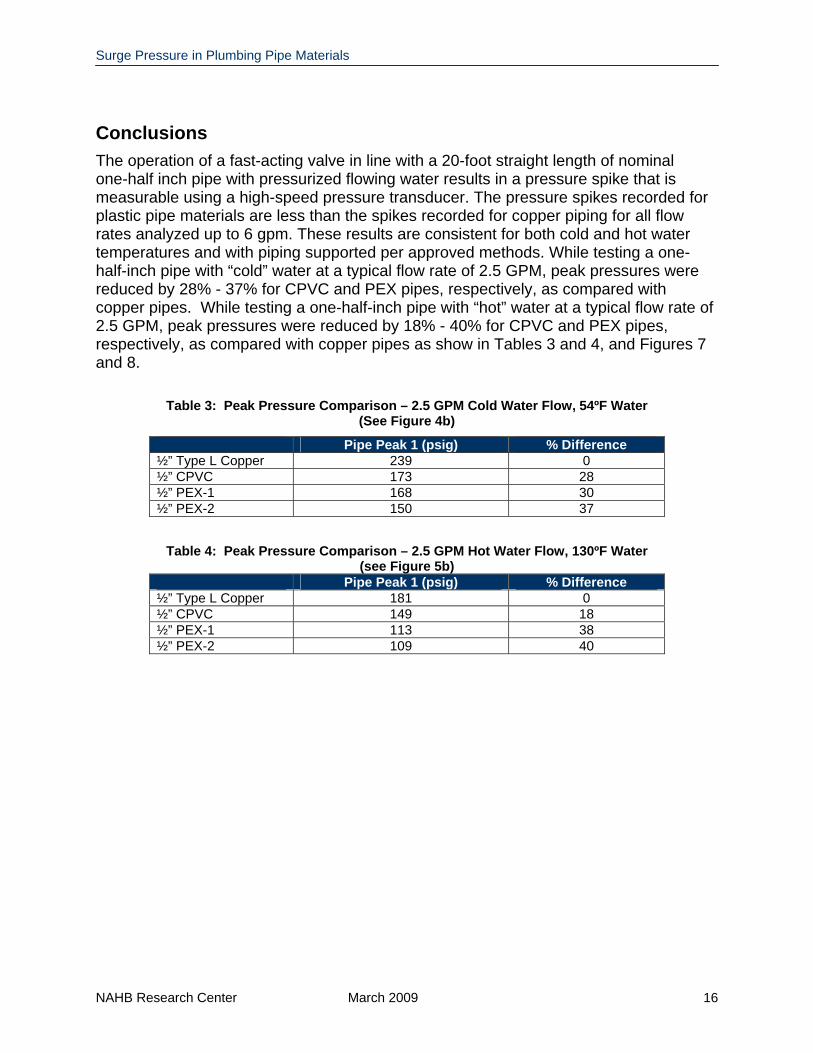
Conclusions The operation of a fast-acting valve in line with a 20-foot straight length of nominal one-half inch pipe with pressurized flowing water results in a pressure spike that is measurable using a high-speed pressure transducer. The pressure spikes recorded for plastic pipe materials are less than the spikes recorded for copper piping for all flow rates analyzed up to 6 gpm. These results are consistent for both cold and hot water temperatures and with piping supported per approved methods. While testing a one-half-inch pipe with “cold” water at a typical flow rate of 2.5 GPM, peak pressures were reduced by 28% - 37% for CPVC and PEX pipes, respectively, as compared with copper pipes. While testing a one-half-inch pipe with “hot” water at a typical flow rate of 2.5 GPM, peak pressures were reduced by 18% - 40% for CPVC and PEX pipes, respectively, as compared with copper pipes as show in Tables 3 and 4, and Figures 7 and 8.
Table 3: Peak Pressure Comparison – 2.5 GPM Cold Water Flow, 54ºF Water (See Figure 4b)
Pipe Peak 1 (psig) % Difference ½” Type L Copper 239 0 ½” CPVC 173 28 ½” PEX-1 168 30 ½” PEX-2 150 37
Table 4: Peak Pressure Comparison – 2.5 GPM Hot Water Flow, 130ºF Water
(see Figure 5b) Pipe Peak 1 (psig) % Difference ½” Type L Copper 181 0 ½” CPVC 149 18 ½” PEX-1 113 38 ½” PEX-2 109 40
NAHB Research Center March 2009 16
Surge Pressure in Plumbing Pipe Materials
Maximum Surge Pressure Measured - Cold Water Flow
0
50
100
150
200
250
300
350
400
450
2 2.5 3 4 6Flow Rate, gpm
Pres
sure
, psi
1/2"Type L Copper 1/2" CPVC 1/2" PEX-1 1/2" PEX-2
60 psi static pressure included in measurement
Figure 7: Comparison of Piping Pressure Response to Quick-Acting Valve with Cold Water Flows
NAHB Research Center March 2009 17
Surge Pressure in Plumbing Pipe Materials
NAHB Research Center March 2009 18
Maximum Surge Pressure Measured - Hot Water Flow
0
50
100
150
200
250
300
350
400
450
2 2.5 3 4 6Flow Rate, gpm
Pres
sure
, psi
1/2"Type L Copper 1/2" CPVC 1/2" PEX-1 1/2" PEX-2
60 psi static pressure included in measurement
Figure 8: Comparison of Piping Pressure Response to Quick-Acting Valve with Hot Water Flows