supporting information - proceedings of the national ... · supporting information ... were...
TRANSCRIPT
Supporting InformationLemée et al. 10.1073/pnas.0910759107SI Materials and MethodsSample Preparation.All of the tumor tissue samples were surgicallycollected and immediately snap-frozen in liquid nitrogen andstored until RNA extraction. RNA from the samples of theFrench cohort was prepared by the same facility (IPSOGEN,Marseille, France) by using the CsCl-cushion technique as de-scribed (1). Before RNA extraction, all tumor samples werecontrolled for the presence of adequate cancer cell number (i.e.,>50% tumor cells) after hematoxylin/eosin staining. RNA ex-traction from seven normal breast tissues was performed by us-ing 30 10-μm-thick sections of frozen tissue. This methodallowed the morphological analysis of the tissue to be processedfor RNA extraction. Sections from each sample were stainedwith hematoxylin/eosin and analyzed by a pathologist. Eachnormal breast sample was reviewed to (i) ascertain the absenceof any neoplastic lesion; and (ii) quantify the percentage ofnormal epithelial, fibrous, and adipose components. RNA sam-ples from the UK cohort were prepared by homogenizing ≈10mg of tissue extracted from representative tumor tissue (>70%of tumor cells) in 750 μL of QIAzol lysis reagent (Qiagen). Thequality and the quantity of all French and UK RNA sampleswere assessed by using the Agilent BioAnalyzer 2100, and onlyRNA presenting a suitable 28S/18S ratio (≥1.5) was selected forexpression analysis.
Analysis of Differential Gene Expression. For the French cohort,total RNA was reverse transcribed by using the High-CapacitycDNA Archive Kit (Applied Biosystems). All studied genes werethen amplified in triplicate from tumor and normal samples byusing the TaqMan Universal PCR Master Mix and the TaqManLow Density Array technology (Applied Biosystems). PCRamplifications were performed by using either the 7900HT FastReal-Time PCR system (Toulouse, batch 1) or the Stratagene“Mx3005P Real-Time QPCR system” (Dundee, batch 2). For theFrench cohort, we normalized gene expression between samplesby using two controls (HMBS, IPO8), which were amplified fromeach cDNA. These two controls were selected with the Genormprogram as the two most stable among 16 genes tested on the
TaqMan Low Density Human Endogenous Control Array (Ap-plied Biosystems). The primer DNA context sequences as well asthe Applied Biosystems references used for the expressionanalysis of each DNA polymerase and control genes are listedbelow. To analyze the variation of expression, the T/N ratios ofthe normalized tumor values (T) and the median of normalizedvalues of normal tissues (N) were calculated.On the other hand, for analyses of POLQ expression and pa-
tient survival in the French cohort, IPO8 was chosen as the nor-malizer. The calculated variances in set 1 (n= 101) and set 2 (n=105) of the French cohort were the same (0.0033 for set 1 and0.0031 for set 2, with a Student’s t test P = 0.6510). In the Britishcohort, the expression level of POLQ was measured in triplicatein a multiplex reaction containing a set of primers and probesspecific for POLQ (“TaqMan Gene Expression Assay”, AppliedBiosystems; assay ID Hs00198196_m1) and a set of primers andprobes specific for TBP (TATA-box binding protein) as thenormalizer gene. A calibrator sample (U2OS cDNA) was used inevery plate. Probes and primers were assessed for their amplifi-cation efficiency by using serial dilutions of template DNA.
Cells. MRC5-SV human fibroblasts (HPA culture collection No.84100401) and the MCF7 human breast adenocarcinoma cell line(ATCCHTB22)were grown in α-MEMmedia andRPMImedium1640 containing 10% FCS, respectively (Invitrogen). Humanmammary epithelial cells (HMEC) were a gift from J. Piette (In-stitut National de la Santé et de la Recherche Médicale, Mont-pellier, France).
Gene Silencing. Transfection of siRNA was carried out by usingLipofectamine 2000 (Invitrogen) and Luciferase (5′-CGUACG-CGGAAUACUUCGAdTdT-3′), Cyclin E, or POLQ (both arespecific ON-TARGET plus SMARTpool siRNAs; Dharmacon)siRNAs at a final concentration of 60 nM. The levels of POLQand Cyclin E transcripts were measured by using the specificTaqMan Gene Expression Assays (Applied Biosystems)Hs00198196_m1 and Hs 00233356_m1, respectively. ΔCt valueswere normalized by using the Qbase software (http://medgen.
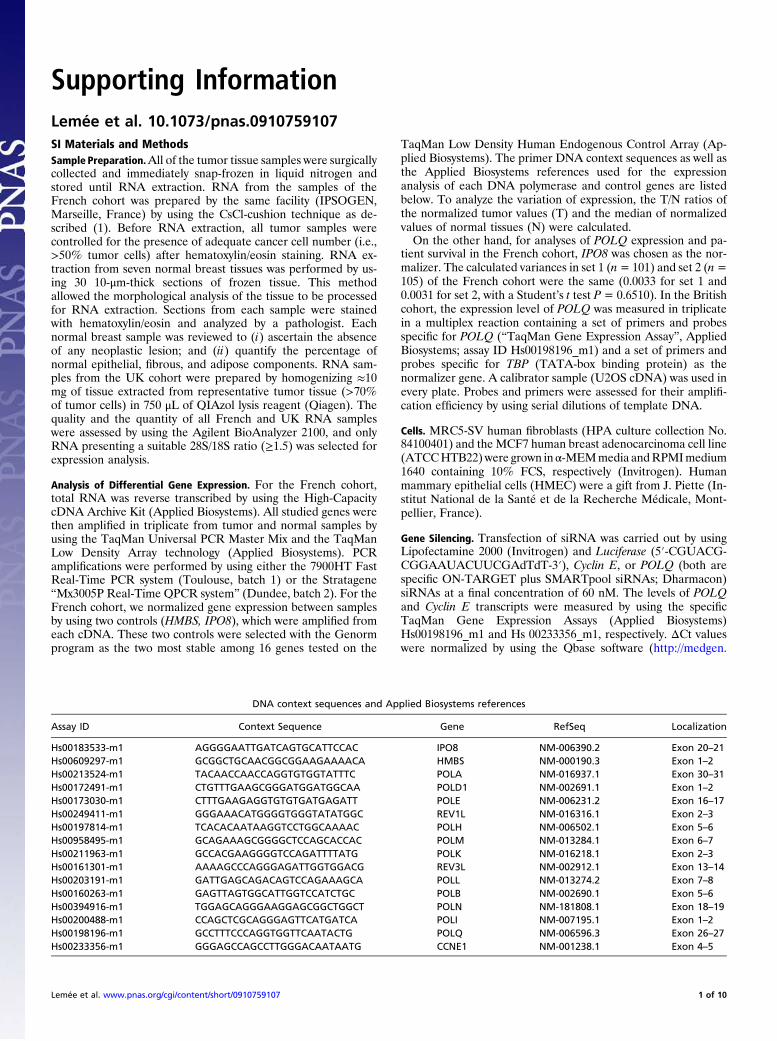
DNA context sequences and Applied Biosystems references
Assay ID Context Sequence Gene RefSeq Localization
Hs00183533-m1 AGGGGAATTGATCAGTGCATTCCAC IPO8 NM-006390.2 Exon 20–21Hs00609297-m1 GCGGCTGCAACGGCGGAAGAAAACA HMBS NM-000190.3 Exon 1–2Hs00213524-m1 TACAACCAACCAGGTGTGGTATTTC POLA NM-016937.1 Exon 30–31Hs00172491-m1 CTGTTTGAAGCGGGATGGATGGCAA POLD1 NM-002691.1 Exon 1–2Hs00173030-m1 CTTTGAAGAGGTGTGTGATGAGATT POLE NM-006231.2 Exon 16–17Hs00249411-m1 GGGAAACATGGGGTGGGTATATGGC REV1L NM-016316.1 Exon 2–3Hs00197814-m1 TCACACAATAAGGTCCTGGCAAAAC POLH NM-006502.1 Exon 5–6Hs00958495-m1 GCAGAAAGCGGGGCTCCAGCACCAC POLM NM-013284.1 Exon 6–7Hs00211963-m1 GCCACGAAGGGGTCCAGATTTTATG POLK NM-016218.1 Exon 2–3Hs00161301-m1 AAAAGCCCAGGGAGATTGGTGGACG REV3L NM-002912.1 Exon 13–14Hs00203191-m1 GATTGAGCAGACAGTCCAGAAAGCA POLL NM-013274.2 Exon 7–8Hs00160263-m1 GAGTTAGTGGCATTGGTCCATCTGC POLB NM-002690.1 Exon 5–6Hs00394916-m1 TGGAGCAGGGAAGGAGCGGCTGGCT POLN NM-181808.1 Exon 18–19Hs00200488-m1 CCAGCTCGCAGGGAGTTCATGATCA POLI NM-007195.1 Exon 1–2Hs00198196-m1 GCCTTTCCCAGGTGGTTCAATACTG POLQ NM-006596.3 Exon 26–27Hs00233356-m1 GGGAGCCAGCCTTGGGACAATAATG CCNE1 NM-001238.1 Exon 4–5
Lemée et al. www.pnas.org/cgi/content/short/0910759107 1 of 10
ugent.be/qbase/) and the two HPRT (Hs01003267-m1) andYWHAZ (Hs00237047-m1) stable genes.
Statistical Analysis. Statistical analyses were performed by using thefree statistical software R (version 2.9.2) including the “Survival”and “DiagnosisMed” packages (R development Team, http://cran.r-project.org) and the Stata software, version 10 (Stata). In theFrench cohort, the major parameters of analysis when comparingthe expression of the different DNA polymerases in cancer andnormal tissues were the individual T/N ratios normalized to theexpression of the controls HMBS and IPO8. Conversely, in theanalysis of POLQ or Cyclin E expression in relation to survival, theexpression of genes was normalized to IPO8 only, and in theBritishcohort, ratios between POLQ expression (normalized to TBP) ineach individual tumor and in U2OS cells were used. Correlationsbetween genes were assessed with a nonparametric Spearman’scorrelation. Besides these analyses, the expression data weretransformed into binomial data (i.e., more or less than 1) to usebinomial exact tests to evaluate the significance of gene over- andunderexpression defined as unbalanced groups ≈1. In the Frenchcohort, POLQ and Cyclin E expression levels ≤0.063 and 0.182,respectively, were defined as “low expression.” In the British co-hort, POLQ gene expression ≤0.31 was defined as low expression.These cutoffs were defined in relation to survival to identify twostatistically different populations of patients. ROC (ReceiverOperating Characteristics) curves were used to determine whichlevel (optimal cutoff point) of each gene expression best segre-gated patients in terms of survival. For both cohorts, a low number
of metastatic lymph nodes was defined as a lymph node countsequal to 1 or less, distinct from patients with 2 or more metastaticaxillary nodes. The cancer-specific survival was defined as the in-terval between the date of breast surgery and the date of death orof the last follow-up (censored data). Patients who died because ofanother cause were considered as censored observations. Survivalrates were estimated according to the Kaplan–Meier method, andthe log-rank test was used to assess the differences between groups.A Cox’s proportional hazards regression model using a backwardselection procedure and the likelihood ratio test was applied toinvestigate the impact of prognostic factors on cancer-specificsurvival. All variables associated with P < 0.05 on univariateanalyses were included in the initial model. A χ2 test was used todetermine the existence of an association between two qualitativevariables. All P values were two-sided. For all statistical tests, dif-ferences were considered significant at the 5% level.
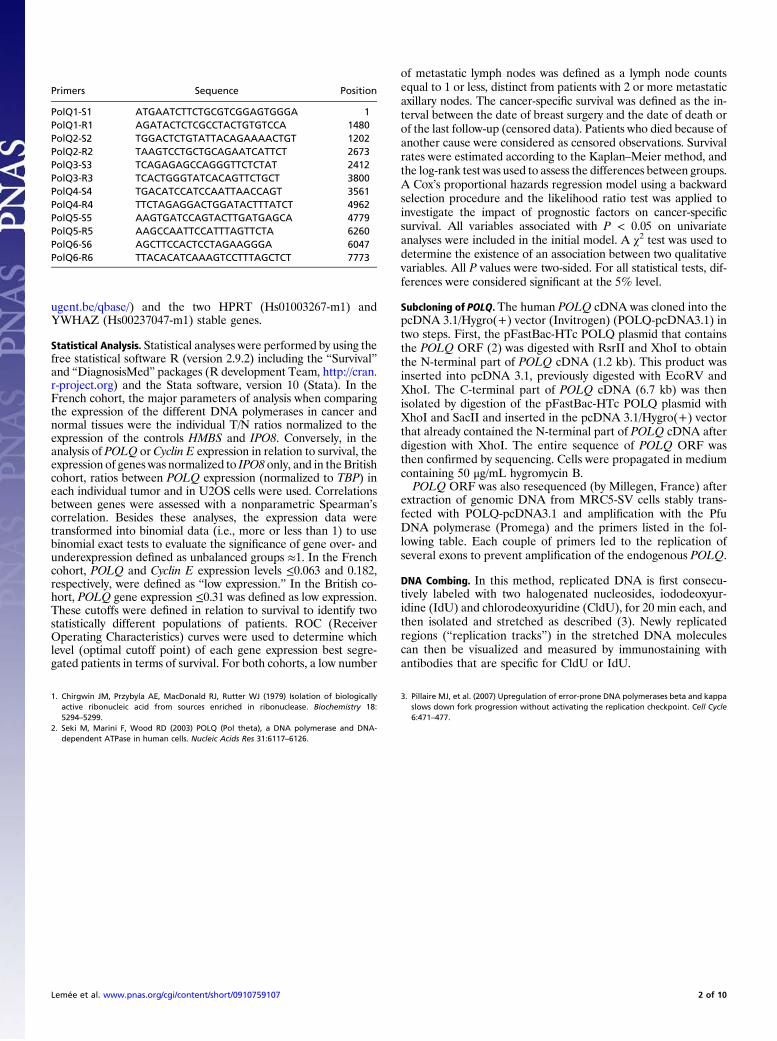
Subcloning of POLQ. The human POLQ cDNA was cloned into thepcDNA 3.1/Hygro(+) vector (Invitrogen) (POLQ-pcDNA3.1) intwo steps. First, the pFastBac-HTc POLQ plasmid that containsthe POLQ ORF (2) was digested with RsrII and XhoI to obtainthe N-terminal part of POLQ cDNA (1.2 kb). This product wasinserted into pcDNA 3.1, previously digested with EcoRV andXhoI. The C-terminal part of POLQ cDNA (6.7 kb) was thenisolated by digestion of the pFastBac-HTc POLQ plasmid withXhoI and SacII and inserted in the pcDNA 3.1/Hygro(+) vectorthat already contained the N-terminal part of POLQ cDNA afterdigestion with XhoI. The entire sequence of POLQ ORF wasthen confirmed by sequencing. Cells were propagated in mediumcontaining 50 μg/mL hygromycin B.POLQ ORF was also resequenced (by Millegen, France) after
extraction of genomic DNA from MRC5-SV cells stably trans-fected with POLQ-pcDNA3.1 and amplification with the PfuDNA polymerase (Promega) and the primers listed in the fol-lowing table. Each couple of primers led to the replication ofseveral exons to prevent amplification of the endogenous POLQ.
DNA Combing. In this method, replicated DNA is first consecu-tively labeled with two halogenated nucleosides, iododeoxyur-idine (IdU) and chlorodeoxyuridine (CldU), for 20 min each, andthen isolated and stretched as described (3). Newly replicatedregions (“replication tracks”) in the stretched DNA moleculescan then be visualized and measured by immunostaining withantibodies that are specific for CldU or IdU.
1. Chirgwin JM, Przybyla AE, MacDonald RJ, Rutter WJ (1979) Isolation of biologicallyactive ribonucleic acid from sources enriched in ribonuclease. Biochemistry 18:5294–5299.
2. Seki M, Marini F, Wood RD (2003) POLQ (Pol theta), a DNA polymerase and DNA-dependent ATPase in human cells. Nucleic Acids Res 31:6117–6126.
3. Pillaire MJ, et al. (2007) Upregulation of error-prone DNA polymerases beta and kappaslows down fork progression without activating the replication checkpoint. Cell Cycle6:471–477.
Primers Sequence Position
PolQ1-S1 ATGAATCTTCTGCGTCGGAGTGGGA 1PolQ1-R1 AGATACTCTCGCCTACTGTGTCCA 1480PolQ2-S2 TGGACTCTGTATTACAGAAAACTGT 1202PolQ2-R2 TAAGTCCTGCTGCAGAATCATTCT 2673PolQ3-S3 TCAGAGAGCCAGGGTTCTCTAT 2412PolQ3-R3 TCACTGGGTATCACAGTTCTGCT 3800PolQ4-S4 TGACATCCATCCAATTAACCAGT 3561PolQ4-R4 TTCTAGAGGACTGGATACTTTATCT 4962PolQ5-S5 AAGTGATCCAGTACTTGATGAGCA 4779PolQ5-R5 AAGCCAATTCCATTTAGTTCTA 6260PolQ6-S6 AGCTTCCACTCCTAGAAGGGA 6047PolQ6-R6 TTACACATCAAAGTCCTTTAGCTCT 7773
Lemée et al. www.pnas.org/cgi/content/short/0910759107 2 of 10

mR
NA
exp
ress
ion
T/N
rat
io
5
REV1p<10-4
10.296.76
(POLH)
5
POL p<10-4
5
POL (POLM)12.60p<10-4
5
5
POL (POLK)
15.12
p<10-4
57
POL (POLE)
p<10-4
5
p=0.8453REV3 (POLZ)
57
POL
p<10-4
p=0.0187POL (POLL)
p=0.0008POL (POLB)
5
POL (POLA)p<10-4
(POLD)
5
5
POL (POLN)
p<10-4
POL (POLI)p=0.0108
POL (POLQ)
6
9
12
15
18
21
2426 p<10-4
Tumors (n=105)
Fig. S1. Relative expression of replicative and specialized DNA polymerases in breast tumors from set 2 of the French cohort (n = 105). Normalized mRNAexpression ratios for tumor (T) and normal (N) breast samples (T/N) were calculated. T/N > 1 and <1 indicate higher and lower expression levels in tumorscompared with pooled normal tissues, respectively. The individual T/N ratios were normalized to the expression of the controls HMBS and IPO8, the two moststable control genes. T/N expression ratios were transformed into binomial data: 0 if T/N < 1; 1 if T/N > 1. The new variables then followed a binomial dis-tribution according to the parameters n and p0, which represent the number of patients and the probability that a gene is overexpressed, respectively. To testthe significance of a gene over- or underexpression, we checked whether the p0 parameter of this binomial distribution was different from 0.5 by usingbilateral exact binomial tests (null hypothesis: p0 = 0.5). Because of multiple testing, the P values from these tests were compared with a significance levelobtained using the Benjamini et al. (1) procedure for an overall false discovery rate (FDR) of 0.05. The patients’ samples on the x axis are classified in the sameorder for every panel. + and – stand for higher and lower expression in the tumor (T) compared with the normal (N) tissues, respectively. For graph repre-sentation T/N values lower than 1 were transformed into the inverse N/T values.
1. Benjamini Y, Drai D, Elmer G, Kafkafi N, Golani I (2001) Controlling the false discovery rate in behavior genetics research. Behav Brain Res 125:279–284.
Lemée et al. www.pnas.org/cgi/content/short/0910759107 3 of 10

POLN
POLQ
POLI
POLA
POLB
POLL
POLD
POLE
POLK
POLM
POLH
POLN
POLQ
POLI
POLA
POLB
POLL
POD
D
POLE
POLK
POLM
POLH
POLN
POLQ
POLI
POLA
POLB
POLL
POLD
POLE
POLK
POLM
POLH
+1 -1
POLN
POLQ
POLI
POLA
POLB
POLL
POD
D
POLE
POLK
POLM
POLH
Fig. S2. Gene-to-gene comparison of relative gene expression in tumors. Graphical display of all pairwise correlations between the expression of the differentDNA polymerases in the two sets of breast tumors of the French cohort. Correlations between genes were assessed with a nonparametric Spearman’s cor-relation to analyze 11 × 11 (121) DNA pol/DNA pol correlations of the cohort. (Upper) Set 1 (n = 105). (Lower) Set 2 (n = 101). The closer to 1 the Spearmancorrelation (ρ) coefficient is (illustrated by a red or yellow zone at the intersection of the horizontal and vertical axes), the greater is the association betweenthe expressions of the two genes considered. Conversely, ρ values lower than 1 (illustrated by a green zone) indicate that the expressions under comparison areindependent from each other.
Lemée et al. www.pnas.org/cgi/content/short/0910759107 4 of 10

010203040506070
9080
100
POLQ
Cycli
n E
Rel
ative
mRN
A
siRNALuc Cyclin E
Cyclin E
Actin
Luc siRNA Cyclin E siRNA
A
B
n=113n=25
n=27
n=38
Spearman Rho=0.71 (p<0.0001)
Fig. S3. Interplay between POLQ and Cyclin E. ROC (Receiver operating characteristics) curves were used to determine the expression level (optimal cutoffpoint) of each gene that best segregated patients in terms of survival. POLQ and Cyclin E expression level in tumors less than or equal to 0.063 and 0.182,respectively, was defined as low expression. Cancer-specific survival was defined as the interval between the date of breast surgery and the date of death or ofthe last followup (censored data). Patients who died due to another cause were considered as censored observations. Survival rates were estimated accordingto the Kaplan–Meier method, and the log-rank test was used to assess the differences between groups. (A) Kaplan–Meier survival of breast cancer patientsfrom the French cohort, according to the expression levels of POLQ and Cyclin E in the primary tumor. We used a multivariate Cox model adjusted for POLQand Cyclin E. The Spearman’s correlation coefficient between POLQ and Cyclin E is indicated on the figure. (B) Western blots of whole-cell extracts of MCF7breast cancer cells that were transfected with either control Luciferase (Luc) or Cyclin E siRNAs at 24 h after transfection. Normalized real-time PCR quanti-fication of POLQ and Cyclin E expression in MCF7 breast cancer cells 24 h after transfection with control Luciferase or Cyclin E siRNAs (n = 3).
Lemée et al. www.pnas.org/cgi/content/short/0910759107 5 of 10
0
10
20
30
40
50
60
70
G1 S G2/M
Cells
(%)
CTL2
Vinculin
CTL9Q1Q2Q3
***
***
*********
**
A
B
CTL2
Pol QQ1 Q2 Q3purifi
ed PolQ
Pol QQ3
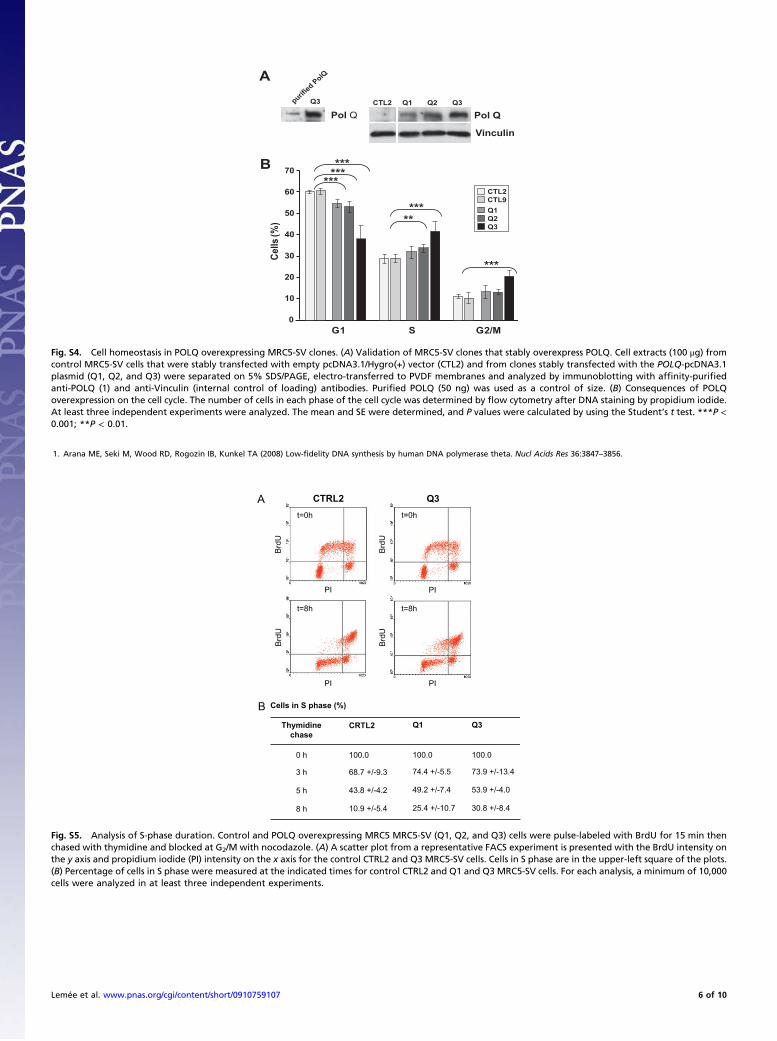
Fig. S4. Cell homeostasis in POLQ overexpressing MRC5-SV clones. (A) Validation of MRC5-SV clones that stably overexpress POLQ. Cell extracts (100 μg) fromcontrol MRC5-SV cells that were stably transfected with empty pcDNA3.1/Hygro(+) vector (CTL2) and from clones stably transfected with the POLQ-pcDNA3.1plasmid (Q1, Q2, and Q3) were separated on 5% SDS/PAGE, electro-transferred to PVDF membranes and analyzed by immunoblotting with affinity-purifiedanti-POLQ (1) and anti-Vinculin (internal control of loading) antibodies. Purified POLQ (50 ng) was used as a control of size. (B) Consequences of POLQoverexpression on the cell cycle. The number of cells in each phase of the cell cycle was determined by flow cytometry after DNA staining by propidium iodide.At least three independent experiments were analyzed. The mean and SE were determined, and P values were calculated by using the Student’s t test. ***P <0.001; **P < 0.01.
A
Cells in S phase (%)
Thymidinechase
CRTL2 Q1 Q3
3 h
5 h
8 h
68.7 +/-9.3 74.4 +/-5.5 73.9 +/-13.4
43.8 +/-4.2 49.2 +/-7.4 53.9 +/-4.0
10.9 +/-5.4 25.4 +/-10.7 30.8 +/-8.4
0 h 100.0 100.0 100.0
B
PI
PI
CTRL2t=0h
t=8h
PI
t=0h
Q3
PI
t=8h
BrdU
BrdU
BrdU
BrdU
Fig. S5. Analysis of S-phase duration. Control and POLQ overexpressing MRC5 MRC5-SV (Q1, Q2, and Q3) cells were pulse-labeled with BrdU for 15 min thenchased with thymidine and blocked at G2/M with nocodazole. (A) A scatter plot from a representative FACS experiment is presented with the BrdU intensity onthe y axis and propidium iodide (PI) intensity on the x axis for the control CTRL2 and Q3 MRC5-SV cells. Cells in S phase are in the upper-left square of the plots.(B) Percentage of cells in S phase were measured at the indicated times for control CTRL2 and Q1 and Q3 MRC5-SV cells. For each analysis, a minimum of 10,000cells were analyzed in at least three independent experiments.
1. Arana ME, Seki M, Wood RD, Rogozin IB, Kunkel TA (2008) Low-fidelity DNA synthesis by human DNA polymerase theta. Nucl Acids Res 36:3847–3856.
Lemée et al. www.pnas.org/cgi/content/short/0910759107 6 of 10

Actin
-H2AX
Q1Q3Q2CTL5CTL2
CTL5+UV
CTL2+UV
Q1 Q3 Q2CTL2CTL2+
UV
A
B
Actin
Chk1
P-Chk1
Fig. S6. Detection of γ-H2AX (A) and phosphorylated Chk1 (B). Control (i.e., cells stably transfected with empty pcDNA3.1 vector) CTL2, and CTL5 MRC5-SVcells were treated with UV (10 J·m−2) to induce DNA damage. Then 250,000 subconfluent control (CTL2 and CTL5 with or without UV treatment) and POLQoverexpressing (Q1, Q2, and Q3) MRC5-SV cells were harvested and sonicated. Total protein extracts were resolved by electrophoresis on 15% SDS/PAGE andtransferred to Hybond-P membranes (Amersham), which were probed with the monoclonal anti-γ-H2AX antibody (Upstate Biotechnology), anti-total Chk1(Santa Cruz Biotechnology), or anti-phospho-Chk1 (Ser345) antibodies (Cell Signaling) at 4 °C overnight. Horseradish peroxidase-goat anti-mouse antibodieswere used as the secondary antibody (Sigma). Detection of immunolabeling was by incubation with the Enhanced Chemiluminescence Reagent (Amersham).Loading were assessed by immunoblotting the membrane with an anti-β-Actin antibody (Sigma-Aldrich).
surv
ival
(%
)
MMS (mM) MNU (µM)
100
10
00 50 100 150
100
10
1
00 0.5 1 1.5
CTL2CTL5Q1Q2Q3
Q5Q4
Fig. S7. Sensitivity to alkylating agents. Sensitivity of POLQ overexpressing (Q1, Q2, Q3, Q4, Q5) and isogenic control (CTL2, CTL5) MRC5-SV cells to methylmethanesulfonate (MMS) and N-Nitroso-N-Methylurea (MNU) was determined by clonogenic assay. Survival (%) is expressed as the relative plating efficiencyof POLQ overexpressing cells in comparison with the controls. The doses of MMS and MNU are displayed on the x axis in a linear scale, whereas the fractions ofsurviving colonies are on the y axis in a logarithmic scale. Results are the mean ± SE of at least three separate experiments performed in duplicate.
Lemée et al. www.pnas.org/cgi/content/short/0910759107 7 of 10

Table S1. Baseline characteristics of patients and tumors
Characteristics
French Set 1 (n = 101) Cohort Set 2 (n = 105) Dundee-U.K. cohort (n = 117)
No. of patients % No. of patients % No. of patients %
Age, yearsMedian 49 50.8 59Range 29–64 31–64 28–89Premenopausal 70 69.31 58 55.24 35 29.91
SurgeryLocal excision 60 59.41 54 51.43 43 36.75Mastectomy 41 40.59 51 48.57 74 63.25
Pathologic tumor size, mmMedian 23 25 25Range 6–70 10–150 8–95
Histological typeDuctal carcinoma 82 81.19 80 76.19 100 85.47Lobular carcinoma 12 11.88 11 10.48 17 14.53Other 7 6.96 14 13.33 0 0.00
GradeI 22 21.78 9 8.57 11 9.40II 34 33.66 39 37.14 39 33.33III 42 41.58 54 51.43 65 55.56Not graded 2 1.98 2 1.90 0 0.00Missing 1 0.99 1 0.95 2 1.69
No. of positive nodes≤1 43 42.57 30 28.57 73 62.39>1 58 57.42 75 71.42 44 37.60
Estrogen receptorsPositive 68 67.33 74 88 75.21Negative 30 29.70 29 29 24.79Missing 3 2.97 2 0 0.00
Progesterone receptorsPositive 42 41.58 41 39.05 75 64.10Negative 56 55.45 62 59.05 42 35.90Missing 3 2.97 2 1.9 0 0.00
HER2Positive 16 15.84 13 12.38 17 14.53Negative 66 65.35 87 82.86 92 78.63Missing 19 18.81 5 4.76 8 6.84
TreatmentFEC (only) 49 48.51 57 54.29 4* 3.42FEC+TXT (only) 52 51.49 48 45.71 2* 1.71Other 0 0 0 0 78 66.67Tamoxifen 57 56.43 67 63.8 88 75.21
*With radiotherapy.
Lemée et al. www.pnas.org/cgi/content/short/0910759107 8 of 10
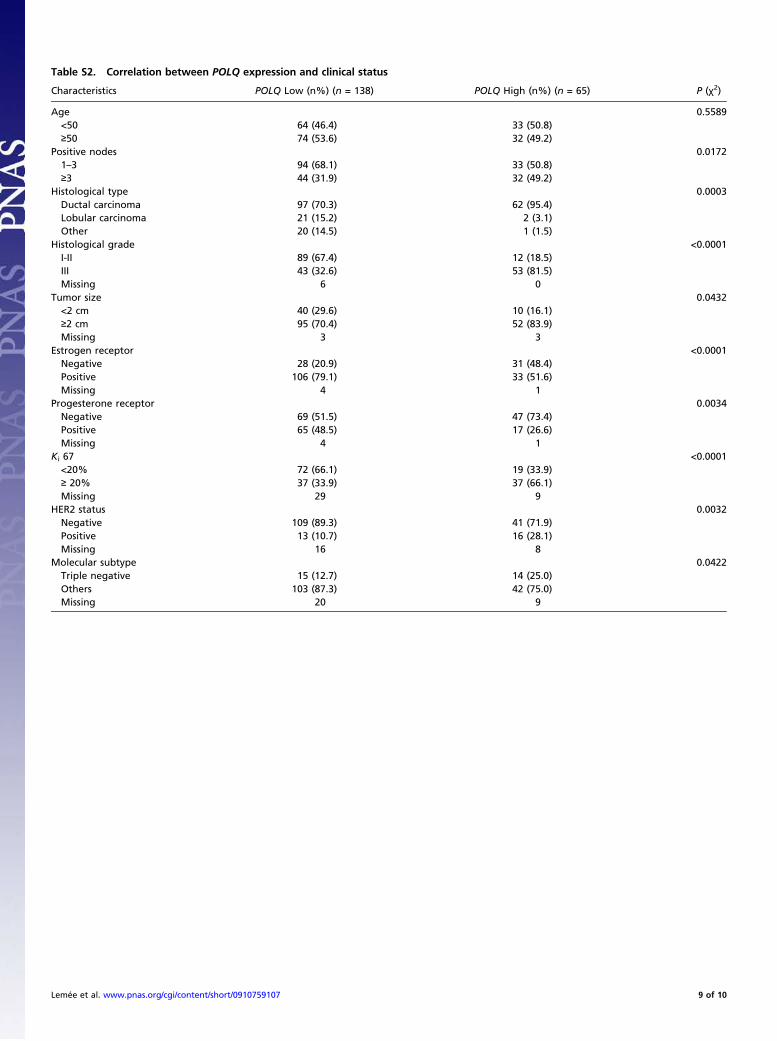
Table S2. Correlation between POLQ expression and clinical status
Characteristics POLQ Low (n%) (n = 138) POLQ High (n%) (n = 65) P (χ2)
Age 0.5589<50 64 (46.4) 33 (50.8)≥50 74 (53.6) 32 (49.2)
Positive nodes 0.01721–3 94 (68.1) 33 (50.8)≥3 44 (31.9) 32 (49.2)
Histological type 0.0003Ductal carcinoma 97 (70.3) 62 (95.4)Lobular carcinoma 21 (15.2) 2 (3.1)Other 20 (14.5) 1 (1.5)
Histological grade <0.0001I-II 89 (67.4) 12 (18.5)III 43 (32.6) 53 (81.5)Missing 6 0
Tumor size 0.0432<2 cm 40 (29.6) 10 (16.1)≥2 cm 95 (70.4) 52 (83.9)Missing 3 3
Estrogen receptor <0.0001Negative 28 (20.9) 31 (48.4)Positive 106 (79.1) 33 (51.6)Missing 4 1
Progesterone receptor 0.0034Negative 69 (51.5) 47 (73.4)Positive 65 (48.5) 17 (26.6)Missing 4 1
Ki 67 <0.0001<20% 72 (66.1) 19 (33.9)≥ 20% 37 (33.9) 37 (66.1)Missing 29 9
HER2 status 0.0032Negative 109 (89.3) 41 (71.9)Positive 13 (10.7) 16 (28.1)Missing 16 8
Molecular subtype 0.0422Triple negative 15 (12.7) 14 (25.0)Others 103 (87.3) 42 (75.0)Missing 20 9
Lemée et al. www.pnas.org/cgi/content/short/0910759107 9 of 10
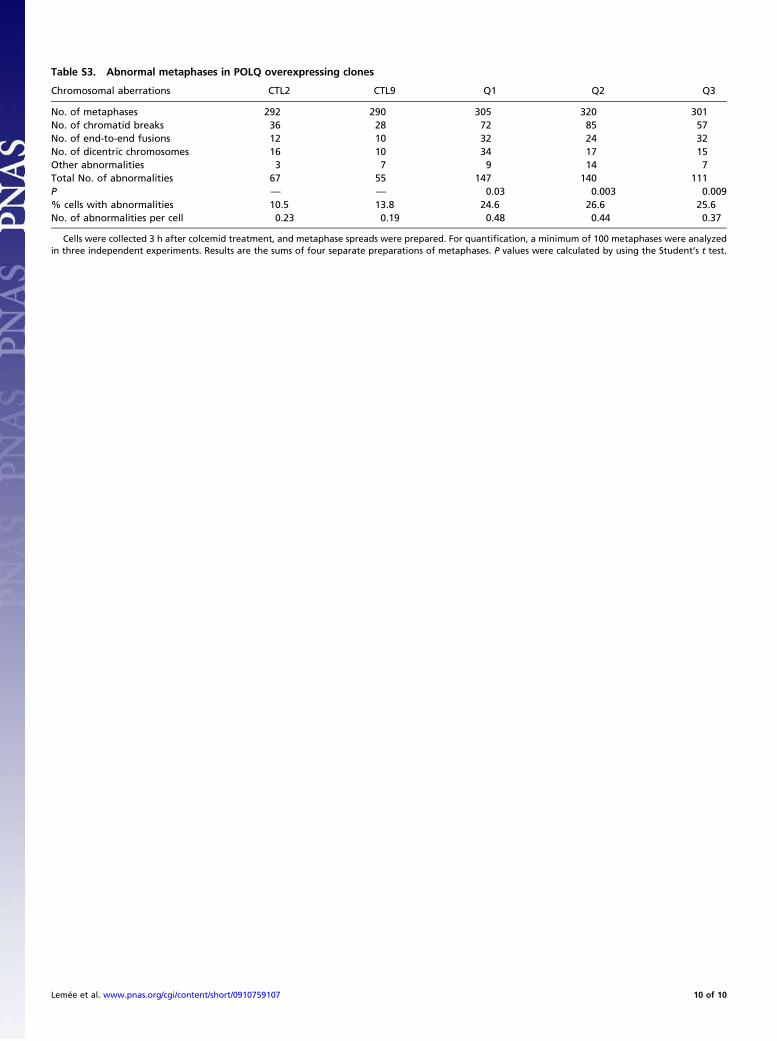
Table S3. Abnormal metaphases in POLQ overexpressing clones
Chromosomal aberrations CTL2 CTL9 Q1 Q2 Q3
No. of metaphases 292 290 305 320 301No. of chromatid breaks 36 28 72 85 57No. of end-to-end fusions 12 10 32 24 32No. of dicentric chromosomes 16 10 34 17 15Other abnormalities 3 7 9 14 7Total No. of abnormalities 67 55 147 140 111P — — 0.03 0.003 0.009% cells with abnormalities 10.5 13.8 24.6 26.6 25.6No. of abnormalities per cell 0.23 0.19 0.48 0.44 0.37
Cells were collected 3 h after colcemid treatment, and metaphase spreads were prepared. For quantification, a minimum of 100 metaphases were analyzedin three independent experiments. Results are the sums of four separate preparations of metaphases. P values were calculated by using the Student’s t test.
Lemée et al. www.pnas.org/cgi/content/short/0910759107 10 of 10