supporting corporate reporting, controlling and strategy ... · supporting corporate reporting,...
TRANSCRIPT

<Insert Picture Here>
Supporting Corporate Reporting, Controlling and Strategy
Management in a single Framework
Michał Grochowski
Senior Consultant Oracle Business Intelligence

Pain Areas in Controlling &
Strategic Management
Link strategies to plans and execution,
Monitor financial and operational results
against goals, and applying analytics to
Drive enterprise-wide performance
improvement.

Market Pressures Demand Effective
Performance Management
Today’s Reality: Management
Processes Are Fragmented
• Lack of business alignment
• Low predictability in performance
• Inconsistency in business
decisions
ECONOMIC VALUE ADDED
(EVA)
ANALYZE
PERFORMANCE
GOAL
SETTING
SCORECARDS FINANCIAL
REPORTING
FINANCIAL
MODELING
VARIANCE
ANALYSIS
ROLLING
FORECAST
OPERATIONAL
PLANNING
MONITOR
RESULTS
$ € £ ¥

ENVIRONMENT
OPERATIONAL
EXCELLENCE
Priorities and Pressures on the CFO
REGULATORY
COMPETITION/
CUSTOMER
CHOICE
Efficiency
Visibility
Agility
Business Transformation

What is the strategic priority of the following key issues on the finance agenda for 2011?
Top 3 are not ERP
Related
ISSUE #1
ISSUE #2
ISSUE #3
Source: 2010 Hackett Key Issues Performance Study
Driving improvements Dominates the CFO Agenda
Meet the Stakeholders 5

Five Core Management Processes
•Strategic Objectives
•Value Drivers
•Success metrics
•Targets
Goal setting
•Cascade targets
•Top-down allocations
•Bottom-up planning
•Budget dev.
Planning •KPIs
•Variance analysis
•Ad-hoc analysis
•Decisions and actions
Management Reporting
•Scenario modeling
•What-if analysis
•Simulations
•Predictive analytics
Analysis •Data validation
•Consolidation
•Audits and controls
•Financial stmts, and compliance
Financial Reporting
6

7
Impact of poorly integrated Management Processes
• Can’t align corporate goals with plans and execution
Lack of Alignment
• Each business has its own data. No single version of the truth
Lack of Confidence in the data
• Systems for setting goals, monitoring progress and taking action are disconnected
Lowered ability to proactively course correct
• Organizational systems are not agile enough to meet changing disclosure requirements
Lack of Transparency
• Limited integration with transactional systems
Poor visibility into detail
• Advanced analytical capabilities are missing or disconnected
Lowered ability to “compete on analytics”
• Separate maintenance streams
Higher Total Cost of Ownership

Time spent coping with change
BI Benchmark Report: Organizational and performance metrics for BI teams", 2008,
www.tdwi.org
7 On average, how many weeks does it take to add a new
source of data to your data warehouse?
On average, how many weeks does it take to create a
report or dashboard with about 20 dimensions, 12
measures, and 6 user access roles?
4.7 On average, how many weeks does it take to change a
hierarchy?
6.7

IT & Business: Divided by Common Goals
The need for synergy
• Heterogeneous & ubiquitous
access
• Fast access to new
information
• Information in context with
business processes
• Ease of use, intuitive, self
service
BUSINESS PERSPECTIVE
• Information Management
• Data quality & consistency
• Robust data architecture
• Data Integration
• Rapid deployment
• Ease of maintenance
IT PERSPECTIVE
Information
consumption
represents
value Information
management
represents value

Closing the gap between the Business and IT
Increase the value of information to your business
• Making BI more valuable
– Insight delivered to the right person at the right time, in context
• Make Information a strategic resource
– Consistent, reliable & secure
• Design for change
– Speed of change - Agility
• Make the impossible possible
– Ask the questions they haven’t
even thought of yet!

Is your Information a Business Asset?
Asset Distraction Liability
Do not trust this
information!
• Information overload
• Unsolicited
• Not actionable
• Cannot be interpreted
• Not trustworthy
• Inconsistent, Inaccurate
• Not secure
• Too expensive
• Too late
• Too difficult to change
• Complete, consistent,
accurate, trustworthy
• Enriched
• In context, relevant,
timely
• Secure
• Actionable

Insight Driven workflows Controlling Environment
Distribution & Logistics Mgr Receives e-mail message detailing option of filling impacted orders by alternative suppliers
Orders placed
1. Large Order alert
Checks for large order.
Identifies and notifies sales reps.
Passes info. to a Chained Inventory alert
2. Low Inventory alert
Detects insufficient inventory
Notifies impacted Managers
Initiates Alt Sourcing alert
3. Alt. Sourcing alert Identifies alternative suppliers that can fulfill impacted Orders.
Notifies impacted sales and distribution management
Sales Reps Receives an e-mail notifying him of the large order placed by Best Value, one of his accounts.

Standardised Reporting
• Dashboards
• Publishing
• Pixel-perfect
• What-if
• Scenarios
• Allocations
Advanced Analytics
Ad-hoc Query & Reporting
• Slice and Dice
• Parameter-driven
• Self-service
Reality: No Single Tool Spans the BI Pyramid
• Inefficient processes
• Inconsistent data
• Inaccurate conclusions
• Predictive Analytics
• Allocations / Aggregations
• Set-based Analysis
Modeling
Insight gap
Insight gap
Insight gap

BI Foundation – filling the gaps
BI Foundation
Power to answer
any question
Pervasive delivery channels
Performant on
an enterprise scale
Standardised Reporting
Advanced Analytics
Ad-hoc Query & Reporting
Modeling
• Dashboards
• Publishing
• Pixel-perfect
• What-if
• Scenarios
• Allocations
• Slice and Dice
• Parameter-driven
• Self-service
• Predictive Analytics
• Allocations / Aggregations
• Set-based Analysis

The New Standard for Enterprise Analytics Oracle Business Intelligence 11g
Complete Enterprise Analytic Foundation Best in class functionality provides consistent view of business performance
Powers Packaged Applications Performance Management, Operational Analytics, Industry and Partner Applications
Integrated Analytic Processes Easily leverage analytics to drive better decision-making across the organization to improve performance continuously
Powers Packaged Applications Performance Management, Operational Analytics, Industry and Partner Applications
Integrated Analytic Processes Easily leverage analytics to drive better decision-making across the organization to improve performance continuously

OLTP & ODS Systems
Data Warehouse Data Mart
Packaged Applications (Oracle, SAP, Others)
Excel XML/Office
Business Process
OLAP Sources
Exadata Unstructured & Semi-Structured
Integrated. Oracle Business Intelligence 11g
Common Enterprise Information Model
• Common Metadata Foundation across all Data Sources
• Common Security, Access Control, Authorization, Auditing
• Common Request Generation and Optimized Data Access Services
• Common Clustering, Workload Management, & Deployment
• Common Systems & Operational Lifecycle Management
Interactive Dashboards
Reporting & Publishing
Ad-hoc Analysis
Detect & Alert
Office Integration
Search Embedded Data Integration
Mobile Scorecards Collaborate

Complete Enterprise Analytic Foundation Oracle
Business Intelligence 11g
SINGLE
ENTERPRISE INFORMATION
MODEL
SINGLE
ENTERPRISE INFORMATION
MODEL
Interactive Dashboards
Office Integration
Secure Search
Production Reporting
Mobile
Ad-hoc Analysis
Scorecards
Strategy Maps
Geographic Visualization
Embedded in Applications

"OBIEE 11g has features which make all enterprises running
Oracle applications think twice before looking somewhere
else for their enterprise BI platform. Having said that, there's
nothing in the OBIEE architecture that requires tight coupling
with Oracle's applications and middleware. 11g is a huge
release, bringing tons of important new features to the OBIEE
platform.”
Forrester: Boris Evelson July 2010
Analyst Perspective on Oracle BI

The New Standard for Enterprise Analytics Oracle Business Intelligence 11g
Complete Enterprise Analytic Foundation Best in class functionality provides consistent view of business performance
Powers Packaged Applications Performance Management, Operational Analytics, Industry and Partner Applications
Integrated Analytic Processes Easily leverage analytics to drive better decision-making across the organization to improve performance continuously

SINGLE
ENTERPRISE INFORMATION
MODEL
Integrated Analytic Processes Oracle Business Intelligence 11g
DETECT
ANALYZE ACT
MODEL
• Data-driven alerts
• Mobile devices
• Scorecard / KPI’s
• Ad-hoc OLAP query
• Interactive visualization
• Role-based dashboards
• What-if scenarios
• Write-back
• Predictive analytics
• Standards-based process execution
• User-centric process design
• Closed-loop process metrics
SINGLE
ENTERPRISE
INFORMATION MODEL

Dashboards and Scorecards Complimentary Perspectives
• Business results • Operational and strategic • Root cause analysis • Guided navigation
Past
Dashboards
Why did I miss my goal?
• Strategy deployment • People & team • Accountability maps • Management processes • Initiative tracking • Cause & effect • Collaboration
Future
Scorecards
How do goals support our strategy?
Alerting
Benchmarking
Metrics
Graphics
Reporting
Metadata

Communicate Strategy -Detect Variances from Goals Oracle Scorecard and Strategy Management
• Integrated BI component, not a silo – KPIs as core metadata
– Thresholds, owners, history
– Auto-generated interactive analyses
– Linked objectives & initiatives
• Automatic detection
– KPI alerts triggered by thresholds
• Strategy visualization
– Strategy Maps and Trees
– Cause and Effects
– Watchlists
– Annotations & override
• All methodologies
– Balanced scorecard, six sigma, Baldrige
<Insert Picture Here>
Oracle Scorecard and
Strategy Management

Oracle Scorecard and Strategy Management Offers
KPI Management
• Performance Tracking
– Against Target / Trending
– Threshold Assessment
• Ownership Definition
• Collaboration
– Threaded Discussions
– Related Documents
– Action Links
– Agents
– Drill to Analysis
– Watch Lists
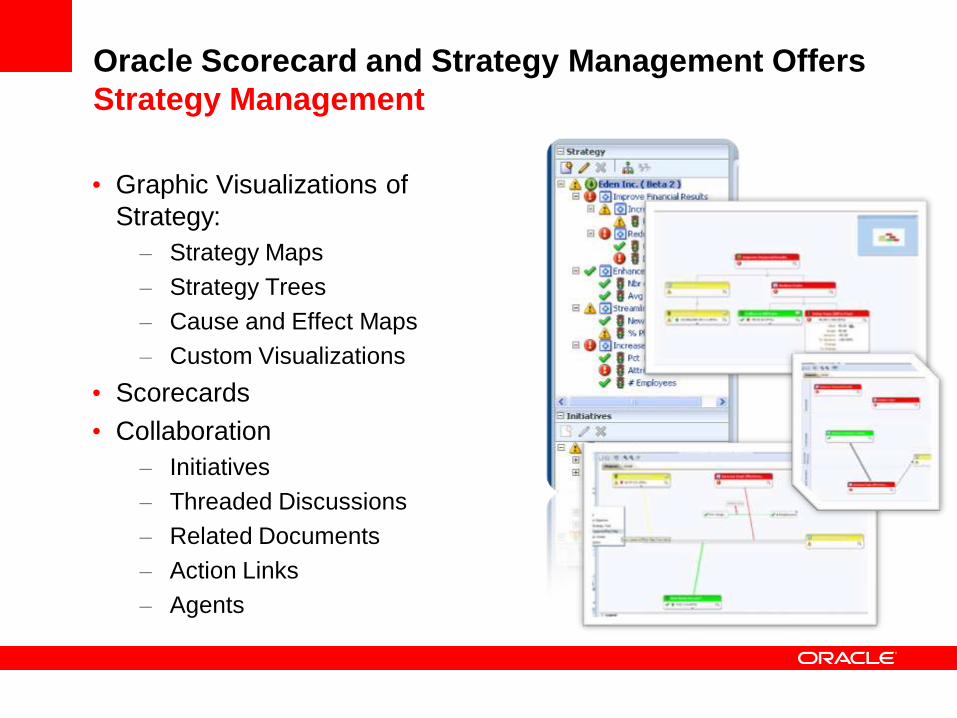
Oracle Scorecard and Strategy Management Offers
Strategy Management
• Graphic Visualizations of
Strategy:
– Strategy Maps
– Strategy Trees
– Cause and Effect Maps
– Custom Visualizations
• Scorecards
• Collaboration
– Initiatives
– Threaded Discussions
– Related Documents
– Action Links
– Agents

Oracle Scorecard and Strategy Management Offers
An Interactive, Collaborative Environment
• Dashboard integration – Embed scorecard visualizations
into dashboards to foster broad interactive analyses
• KPI Agents – To monitor performance
even when you can’t
• KPI & Scorecard Actions – Align day-to-day decisions with your
corporate strategy
• Annotations & Overrides – Collaborate and document exceptions
to prevent future recurrences

<Insert Picture Here>
Self Assessment
Oracle Scorecard and
Strategy Management

Self Assessment
Key Challenge OSSM Helps
Do I have established financial and non-
financial key performance indicators?
• KPIs built on existing data warehouse
Would I like to be able to pro-actively
monitor the performance of KPIs through
continuous feedback and real-time alerts?
• Answers
• Agents
Am I satisfied with how my corporate goals and measures are communicated to the organizations?
• Strategy Maps
• Cause and Effect Maps
• Strategy Trees
• Custom Strategy Visualizations
Do I have a need to translate strategic initiatives into objectives, actions and performance measures?
• Scorecard Hierarchies to detail levels and
interrelationships of artifacts
Would I like to increase employee participation, collaboration and accountability for results?
• Annotations / Related Documents
• Subjective Overrides
• Explicit Ownership
• Initiative Tracking

Oracle Scorecard and Strategy Management Values
Offered
• Merge Enterprise Performance Management and
Operational results
• Build KPI definitions based on existing BI structure
• Present strategy in terms that can be understood and
acted upon
• Make high-level, strategic information accessible and
actionable across the extended enterprise

Strategy Artifacts present visibility and insight
into strategy performance
Better decisions, actions, control at all levels
Respond faster to opportunities and threats
Identify and replicate best practices
Key Benefits of Oracle Scorecard and Strategy
Management
• Insight
• Alignment
• Leverage
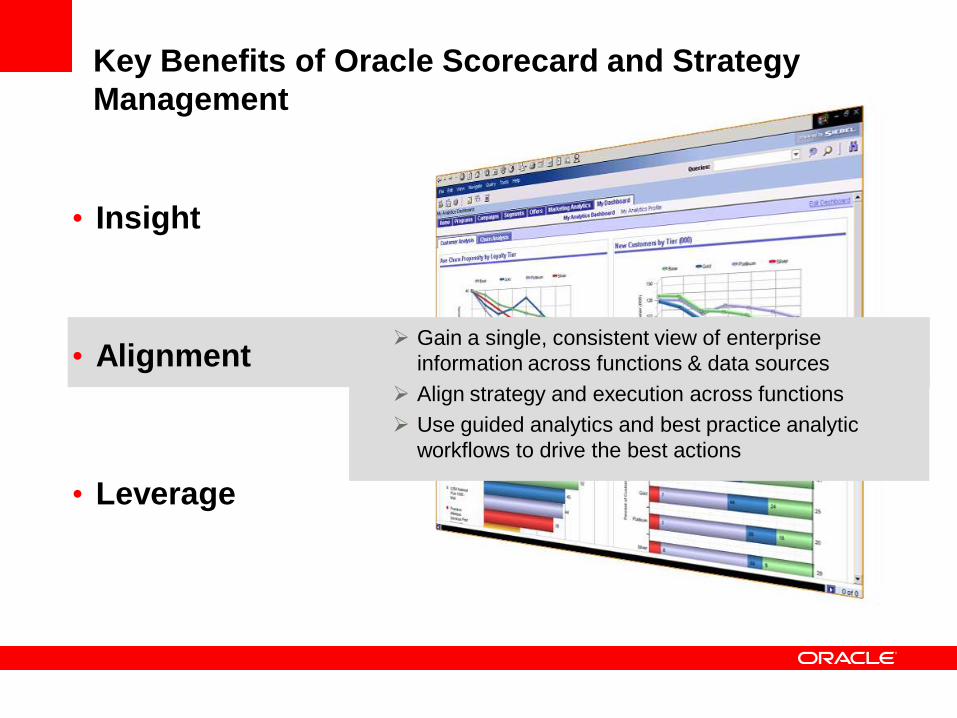
Gain a single, consistent view of enterprise
information across functions & data sources
Align strategy and execution across functions
Use guided analytics and best practice analytic
workflows to drive the best actions
Key Benefits of Oracle Scorecard and Strategy
Management
• Insight
• Alignment
• Leverage

Key Benefits of Oracle Scorecard and Strategy
Management
Do more with less - deploy BI more broadly
with fewer IT resources than custom-build
Accelerate time-to-value, lower TCO and risk
Increase the utility of existing data and
applications, including CRM and ERP
• Insight
• Alignment
• Leverage

<Insert Picture Here>
Strategy Management
Unites EPM and OBI

Oracle EPM Connects Management Processes
Common Integration & Analysis Data Quality and Consistent Dimensions
Common Reporting & Interaction
Strategic Planning
Financial Close
Planning & Forecasting
Profitability Management

Run models based on key strategies
Seed targets to annual operating plan
Start annual process
Update strategic plan with latest outcome and forecast
Evaluate resource and capital requirements
Long-term strategic plan
Annual budget / plan
Validate operational feasibility
Evaluate workforce and
capital
Monthly / rolling
forecast
Update long-term strategic
plan
Supporting a World Class Enterprise Planning
Process
Assess and Manage Risk
Validate operational feasibility to financial plan
Update forecast with latest budget and actuals
Set and communicate targets

Oracle Strategy and Scorecard Management Offers
Integration with existing EPM and BI
• Consolidate EPM information:
– Set goals & targets in Essbase
– Take in Actual results from Hyperion Financial Management
– Include Budgets/Forecasts from Planning/Essbase
– Expose long-term planning hypothesis from Hyperion
Strategic Finance
– Incorporate Profitability/Costs details from Hyperion
Profitability and Cost Management
• Integrate with Oracle ERP suites for operational
details from BI Server / BI Apps

REPORTING ANALYSIS , MODELING, PLANNING
Which customers spend the most?
What did this customer buy?
What is the Q4 revenue forecast?
Which customers are most profitable?
What is the customer likely to buy next?
What if demand falls short of forecast?
The value of Modeling & Planning Deeper insights – to decide next course of action

Oracle Essbase Powerful OLAP Server for Business Scenario Modeling
• Rich Business User Experience
• Powerful & Intuitive tools for the business user
• Integrates into Excel as a front-end
• “Speed of thought” response
• Models complex business scenarios with
advanced calculation Engine
• Comprehensive library of functions
• Extensive financial and time intelligence
• A complimentary extension to the BI platform
• Custom Business Analytic Environment
• Optimized storage
• Enterprise scale forward looking applications
• Premium performance

Oracle BI 11g Foundation Single, Integrated Solution
Common Enterprise Information Model
BI Server Essbase
Role-based Interactive Dashboards
Proactive alerts
Scorecards & Strategy Communication
MS Office and Excel integration
Simplified logical view of data
Powerful query processing, modeling,
planning, what-if analysis
Federated enterprise data sources Excel
XML
OLTP &
ODS
Systems
Data Marts
Data Warehouse
Database
Machine
OLAP
Cubes
Integrated analytical solution for Strategy Reporting, Modelling/Planning &
Operational BI
Shared metadata, calcs, dimensions, security
Synchronized Relational & OLAP cubes

<Insert Picture Here>
“Business intelligence (BI) is moving into the context of the business process, not just to make users’
information experience more effective, but also to allow for business process
optimization.”
Insight Driven Business
Processes
#2 Actionable BI in the Business Processes

Integrating Insights with Business Processes BI as part of Operational Day to Day Activities
THE NEW WAY: Action Framework
Integrated. Closed Loop.
THE OLD WAY
Disconnected. Open Ended.

The New Standard for Enterprise Analytics Oracle Business Intelligence 11g
Complete Enterprise Analytic Foundation Best in class functionality provides consistent view of business performance
Powers Packaged Applications Performance Management, Operational Analytics, Industry and Partner Applications
Integrated Analytic Processes Easily leverage analytics to drive better decision-making across the organization to improve performance continuously

SINGLE
ENTERPRISE INFORMATION
MODEL
Powers Packaged Applications Oracle Business Intelligence 11g
DETECT
ANALYZE ACT
MODEL
SINGLE
ENTERPRISE
INFORMATION MODEL
• Sales
• Marketing
• Service
• Contact Center
• Price
• Loyalty
• Financial Services
• Communications
• Healthcare
• Retail
• Financials
• HR
• Procure & Spend
• Projects
• Supply Chain
• Order Mgt
• Logistics
• Scorecard
• Strategic Planning
• Financial Close
• Planning & Forecasting
• Profitability Management

Integration with Packaged EPM Applications Oracle Business Intelligence 11g
Industry leading Performance Management Applications for Oracle, SAP and other systems

CRM ANALYTICS ERP ANALYTICS
SALES
• Pipeline Analysis
• Forecast Accuracy
• Up-sell/Cross-sell
• Cycle Times
• Lead Conversion
• Sales Team Effectiveness
MARKETING
• Campaign Effectiveness
• Customer Insight
• Product Propensity
• Market Basket Analysis
• Campaign ROI
SERVICE &
CONTACT CENTER
• Service Effectiveness
• Customer Satisfaction
• Resolution Rates • Service Rep
Efficiency • Service Cost • Service Trends
ORACLE BUSINESS INTELLIGENCE AND OTHER OPERATIONAL AND ANALYTIC SOURCES
SOURCE ADAPTERS:
PRICE
• Price Segments
• Price Waterfall Analysis
• Deal Life Cycle
• Deal Desk Analysis
• Product Pricing Performance
LOYALTY
• Member Demographics
• Program Revenue
• Membership Trends
• Promotion Effectiveness
• Points Analysis
FINANCIALS
• General Ledger
• Accounts Receivable
• Accounts Payable
• Cash Flow
• Profitability
• Expense Management
PROCUREMENT &
SPEND
• Direct & Indirect Spend
• Buyer Productivity • Contract
Compliance • Supplier
Performance • Purchase Cycle
Time • Employee Expense
SUPPLY CHAIN &
ORDER MGMT
• Revenue & Backlog
• Inventory Analysis
• Fulfillment Status
• Customer Status
• Order Cycle Time
• BOM Analysis
PROJECTS
• Project Funding and Budget
• Product Cost
• Project Revenue
• Project Billing
• Project Profitability
HUMAN
RESOURCES
• Employee Productivity
• Compensation
• Talent Management
• Recruiting Analysis
• Learning Analysis
• Workforce Profile
Broadest Analytic Application Coverage Oracle BI Applications


