supplementary text analysis of cell migrationdm5migu4zj3pb.cloudfront.net/manuscripts/35000/... ·...
TRANSCRIPT

Supplementary text
Analysis of cell migration
Dye fluorescent (PKH26) labeled cells were delivered into the cerebral spinal fluid (CSF) to
evaluate ALDHhiSSClo cell migration within the parenchyma (Supplementary Fig. 3).
Donor cells survived and proliferated, generating cell clusters laterally in the spinal cord
parenchyma attached to the meninges. A total of 20% of these cells had already migrated into the
spinal cord parenchyma through the pia mater as early as 5–7 days after transplantation. Cell
invasion was also observed at root exits. Cell clusters were situated preferentially near the blood
vessels and were probably favored by the nutrient supply. Few cells were detected in the brain of
recipient animals, particularly in the area directly adjacent to the ventricular system. Cell
attachments on the spinal cord surface as well as the cell cluster formations were less frequent in
wild-type mice. Only 2–3% of donor cells invaded the parenchyma of non-mutated mice within 7
days.
Analysis of SMN expression in transplanted SMA spinal cord
We demonstrated that SMN+7 (full-length) mRNA levels had increased in the laser capture
motoneurons after transplantation (2.1 fold, P = 0.01, treated SMA vs untreated SMA)
(Supplementary Fig. 8). Western blot analysis of protein isolated from whole spinal cord tissue of
SMA mice revealed the presence of both the full-length SMN protein and the SMNΔ7 protein, as
previously described in these mice (4). The level of full-length SMN protein in SMA mice was at
least 14-fold lower than in wt. No apparent change in the ratio of full-length to SMNΔ7 protein was
evident after transplantation in the whole spinal cord of SMA mice (Supplementary Fig. 8).
1

Analysis of Cdkn1a and Hsbp1 protein levels in primary spinal motoneurons (PMNs) from
SMA mice
We evaluated the expression of Cdkn1a and Hsbp1 proteins in SMA PNMs before and after
coculture with ALDHhiSSClo cells (Fig 9s c, d). We demonstrated that isolated PMNs from SMA
expressed higher levels of Cdkn1a compared to wt (1.6 fold, P = 0.007, SMA vs wt). No difference
was observed in Hsbp1 protein levels. The protein level was not modified by the coculture system.
2

Supplementary Figures
Figure 1 s
Identification, isolation, and differentiation of ALDHhi
SSClo
cells into motoneuron-like cells.
(a, b) Flow cytometric analysis of ALDH activity on spinal-cord–derived NSCs. ALDHhi
SSClo
cells
were selected based on forward scatter (FSC) and side scatter (SSC) characteristics. NSCs
incubated with Aldefluor substrate and the specific inhibitor of ALDH, diethylaminobenzaldehyde
(DEAB), were used to establish the baseline fluorescence of these cells and to define the ALDHhi
region (a). Incubation of NSCs with Aldefluor substrate in the absence of an inhibitor induced a
shift in FL1 fluorescence, defining the ALDHhi
population (b).

Figure 2 s
Neuromuscular evaluation of SMA mice.
(a) Photograph of hand grip assay of a treated SMA mouse. (b) Number of crossings in the open-
field test in treated SMA mice (SMA Tr) and in untreated (SMA) and wild-type mice (wt). At 13
days of age, the number of crossings made by treated mice was significantly different from that of
untreated mice (P < 0.00001).

Figure 3 s
ALDHhiSSClo cell migration into the spinal cord after intrathecal delivery.
Dye fluorescent (PKH26, red signal)-labeled cells were delivered into the CSF to evaluate
ALDHhiSSClo cell migration into the parenchyma. Five days after transplantation (a), donor cells
were located laterally in the spinal cord parenchyma attached to the meninges, initiating through the
pia mater in the parenchyma. After 7 (b) and 10 days (c), donor cells were observed in the
parenchyma in gray and white matter. At the end of the disease, HB9-GFP neurons were detected in
the ventral horn of transplanted mice (d). In panel (d), neurons are stained for the neuronal antigen
NeuN (red signal). Scale bar: a: 300 µm; b-d: 100 µm.
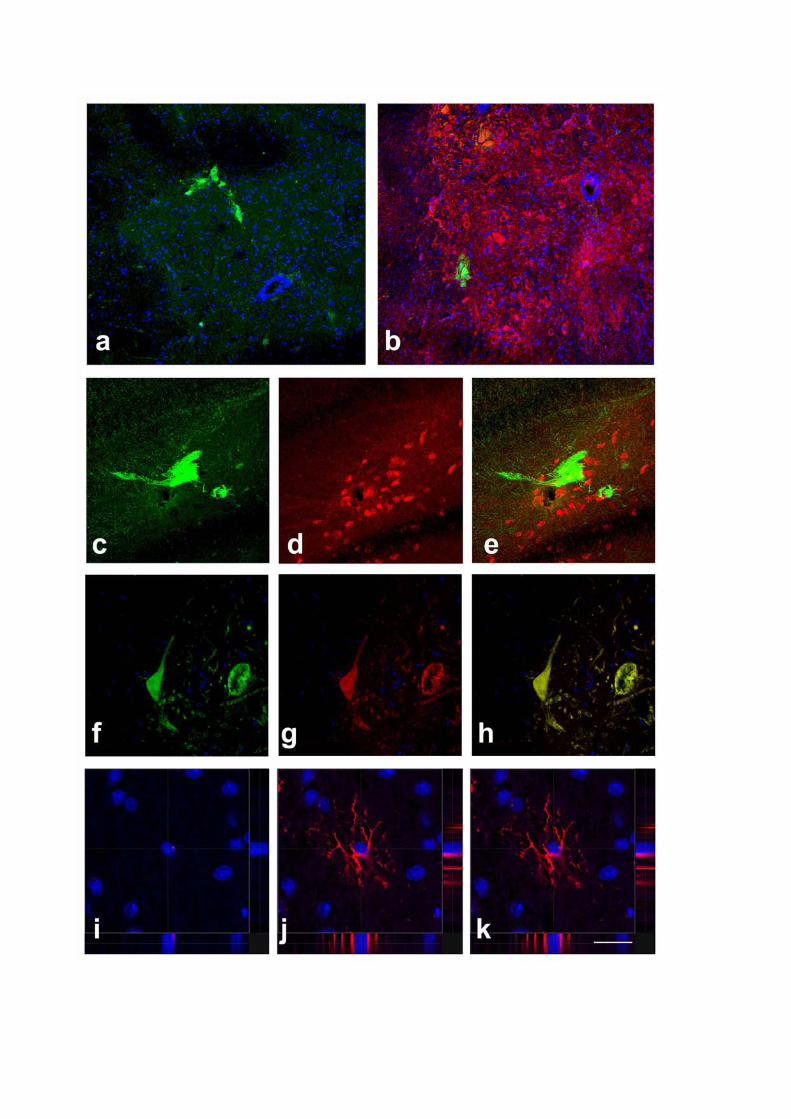

Figure 4 s
ALDHhiSSClo cells transplanted into SMA mice engraft the host spinal cord.
ALDHhiSSClo cells derived from HB9-GFP mice were transplanted intrathecally in P1 SMA mice.
GFP+ neurons were detected in the anterior horn of the spinal cord, as shown in spinal cord coronal
sections (a, b). Immunohistochemistry for neuroectodermal markers confirmed that these cells are
differentiated into neurons. Confocal microscopy showed that GFP donor-derived neurons co-
express neuronal specific proteins such as NF (b) and NeuN (c–e). (f–h) GFP cells present
motoneuronal characteristics, as demonstrated by double immunofluorescence staining of GFP
(green) under the HB9-specific motoneuronal promoter and cholinergic neurotransmitter (f: GFP; g:
ChAT; h: merge). FISH analysis for Y chromosome in sex-mismatched transplantation experiments
(male donor cells into a female recipient) permit the detection of other non-neuronal fates
undertaken by transplanted cells such as astrocytes, as shown in i–k. i: Y chromosome (pink dot); f:
GFAP (red signal); k: merge. Scale bars: a–b: 300 µm; i–k: 75 µm.

Figure 5 s
FISH analysis of SMA-transplanted spinal cord
a–f: FISH analysis for Y chromosome (dot signal) in sex-mismatched transplantation experiments
(male donor cells into a female recipient) allows confirmation of the donor origin of HB9-GFP cells

(a–c), as well as detection of other phenotypes, such as donor neural stem/precursor cells, positive
for nestin and Y chromosome, as shown in d–f.
(a–c) Two HB9-GFP neurons (green, a) presenting Y-positive signal (red dots, b) surrounded by
other male donor cells (Y-positive red dots, b) and female host cells (negative for red signals, b).
(c): merge. d–f: Donor neural stem/precursor cells, positive for nestin (red, d) and Y chromosome
(purple, e). (f): merge.
g–h: FISH analysis for Y chromosome in male SMA mouse spinal cord recipients transplanted with
donor female Hb9 cells permits exclusion of cell fusion events as shown in panels g–i in which a
three-dimensional confocal reconstruction demonstrates an HB9-derived neuron that does not
express the Y chromosome signal, surrounded by Y-positive male host cells (g: blue DAPI-stained
nuclei with FISH red dot signals; h: merge with GFP). Scale bar: a–c: 35 μm; d–f: 50 μm; g–h: 50
μm.

Figure 6 s
Laser capture microdissection (LCM) of endogenous SMA motoneurons
(a, b) Motoneuron cells stained for ChAT before (a) and after microdissection (b). Scale bar: 70
µm.

Figure 7 s
Cluster analysis of the differentially expressed genes in the comparison between SMA
untreated and wt motoneurons.
The hierarchical cluster clearly subdivides upregulated (red) and downregulated (blue) genes in
both groups. Color scale helps to visualize internal similarity.

Figure 8 s
Cluster analysis of differentially expressed genes in the comparison between SMA treated and
untreated motoneurons.
The hierarchical cluster subdivides upregulated (red) and downregulated (blue) genes in both
groups. Color scale helps to visualize internal similarity.

Figure 9 s
ALDHhiSSClo cells increase expression of SMN.
(a) Transplanted ALDHhiSSClo cells increase SMN full-length transcript in motoneurons (isolated
by laser capture microdissection) in vivo (mean ± SD) (* P < 0.02 treated vs untreated). (b) Western
blot analysis of the whole spinal cord of treated SMA mice did not show any increase in SMN
protein levels. The upper bands show full-length SMN protein; the lower bands show SMNΔ7
protein. (c) Western blot analysis showed that isolated PMNs from SMA mice expressed a higher
level of p21 compared to wt (P = 0.007, SMA vs wt) in line with results obtained by real-time PCR
in vivo. The expression of Cdkn1a did not change after coculture. (d) No difference was observed
in Hsbp1 protein levels before and after co-culture.

Figure 10 s
Cytokines profile
Luminex multi-analyte profiling (xMAP) technology was used to profile 26 cytokines in the cell
supernatants of primed ALDH SSChi lo NSCs, undifferentiated cells, astrocytes, and fibroblasts. (a)
Primed ALDH SSChi lo-derived cells expressed significantly higher levels of vascular endothelial
growth factor (VEGF) (** P < 0.00001) compared to other cell types. (b) Primed ALDH SSChi lo
NSCs secreted significantly higher quantities of KC (CXCL1) than the other cell types (KC: primed
vs undifferentiated, P = 0.02; primed vs astrocytes and primed vs fibroblasts, ** P < 0.00001,

respectively). (c) Granulocyte colony-stimulating factor (G-CSF) is produced by primed cells in a
significantly higher quantity (G-CSF: primed vs other cells ** P < 0.00001). (d) All cell types
analyzed expressed high MCP1 levels, with the highest level expressed by fibroblasts (MCP1:
primed vs undifferentiated, P = 0.000013; primed vs astrocytes, P = 0.000013; primed vs
fibroblasts, P = 0.000027). (e) Other proinflammatory cytokines were either not expressed or were
secreted at very low levels in ALDH SSChi lo-derived cells.

Figure 11 s
Primed ALDH SSChi lo NSCs secrete neurotrophic factors
(a–d) ELISA assay was performed to detect the profile of neurotrophins (GDNF, BDNF, TGF-α,
and NT-3). Primed ALDH SSC NSCs hi lo secrete significant amounts of GDNF (a) (primed vs other
cells, ** P < 0.00001), BDNF (b) (primed vs undifferentiated, P = 0.00013; primed vs astrocytes
and primed vs fibroblasts, ** P < 0.00001, respectively), TGF-α (c) (primed vs other cells, ** P <
0.00001), NT3 (d) (primed vs other cells, ** P < 0.00001). (e) The axonal growth of SMA PMNs

cocultured with primed ALDH SSC NSCs hi lo was inhibited by neutralizing antibodies for GDNF,
BDNF, TGF-α, NT3, and VEGF compared to control antibody (IgG) (GDNF vs control, ** P <
0.00001; BDNF vs control, ** P < 0.00001; TGF-α vs control, ** P = 0.00004; NT3 vs control, **
P < 0.00001; VEGF vs control, ** P < 0.00001).

Gene expression profile: untreated SMA mice vs wt
Gene name Accession number Gene definition Probe Affymetrix
Biological function
Ratio SMA/WT
Ratio Treated/SMA
Ratio Treated/WT
Down-regulated genes
Gjb1 BC026833 gap junction membrane channel protein beta 1 1448767_s_at
nervous system development
0.21 2.19 0.46
Rsad2 BB741897 radical S-adenosyl methionine domain containing 2
1421009_at immune response 0.31 1.39 0.43
Mkrn1 BQ176661 makorin, ring finger protein, 1 1418435_at
transcription acitivty, cell cycle regulation
0.34 1.24 0.42
Pomt1 BC027325 protein-O-mannosyltransferase 1 1424284_at
protein amino acid O-linked glycosylation
0.35 1.74 0.61
2810453I06Rik NM_133703 RIKEN cDNA 2810453I06 gene 1418389_at 0.36 0.89 0.32
Vps25 NM_026776 vacuolar protein sorting 25 1421050_at
regulation of transcription, DNA-dependent
0.39 2.15 0.84
H2-K1 BC011306 histocompatibility 2, K1, K region 1425336_x_at
antigen processing and presentation of peptide antigen via MHC class I
0.4 1.30 0.52
Anln BI690018 anillin, actin binding protein 1433543_at cytokinesis 0.4 1.38 0.55
Trf AF440692 transferrin 1425546_a_at iron ion 0.41 1.71 0.70

transport
Slc13a3 BB497312 solute carrier family 13 (sodium-dependent dicarboxylate transporter), member 3
1438377_x_at sodium ion transport 0.42 2.10 0.88
Cxcl7 NM_023785 chemokine (C-X-C motif) ligand 7 1418480_at immune
response 0.42 1.40 0.59
Arpp21 BC027107 cyclic AMP-regulated phosphoprotein, 21 1424248_at signal
transduction 0.43 1.95 0.84
Prkg1 NM_011160 protein kinase, cGMP-dependent, type I 1449876_at dendrite
development 0.43 0.58 0.25
Cyp51 NM_020010 cytochrome P450, family 51 1422534_at electron
transport 0.44 1.05 0.46
Up-regulated genes
Hspb1 U03561 heat shock protein 1 1425964_x_at protein folding 11.1 0.42 4.69
Tmsb10 AV148480 thymosin, beta 10 1455946_x_at
actin cytoskeleton organization and biogenesis
5.55 0.70 3.91
Sult1a1 AK002700 sulfotransferase family 1A, phenol-preferring, member 1
1427345_a_at lipid metabolism 5.2 0.71 3.69
Prodh NM_011172 proline dehydrogenase 1417629_at proline metabolism 4.35 0.69 3.02
Hspb1 NM_013560 heat shock protein 1 1422943_a_at protein folding 4.35 0.46 1.98
Cdkn1a AK007630 cyclin-dependent kinase inhibitor 1A (P21)
1424638_at regulation of progression through cell cycle
4 0.90 3.60
Gdf10 L42114 growth differentiation factor 10 1424007_at
transforming growth factor beta receptor
3.7 0.62 2.28

signaling pathway
Mt2 AA796766 metallothionein 2 1428942_at nitric oxide mediated signal transduction
3.57 0.73 2.62
Tcap AK010167 titin-cap 1423145_a_at sarcomere organization 3.12 0.59 1.85
Mt1 NM_013602 metallothionein 1 1422557_s_at nitric oxide mediated signal transduction
2.94 0.74 2.18
Kcna5 NM_008419 potassium voltage-gated channel, shaker-related subfamily, member 5
1417680_at potassium ion transport 2.94 0.53 1.55
Tsc22d3 AF201289 TSC22 domain family 3 1425281_a_at regulation of transcription, DNA-dependent
2.77 0.91 2.52
Ccl2 AF065933 chemokine (C-C motif) ligand 2 1420380_at inflammatory
response 2.7 1.33 3.60
Ddx5 AW536527 DEAD (Asp-Glu-Ala-Asp) box polypeptide 5 1433809_at RNA splicing 2.7 1.12 3.03
Hif3a AF416641 hypoxia inducible factor 3, alpha subunit 1425428_at
response to hypoxia, regulation of transcription, DNA-dependent
2.27 0.80 1.81

Gene expression profile: treated SMA mice vs untreated
Gene name Accession number Gene definition Probe Affymetrix Biological function
Ratio SMA/WT
Ratio Treated/SMA
Ratio Treated/WT
Up-regulated genes
Atf3 BC019946 activating transcription factor 3
1449363_at regulation of transcription, DNA-dependent
2.94 4.11 12.07
Socs3 BB241535 suppressor of cytokine signaling 3
1455899_x_at regulation of cell growth 1.16 4.03 4.66
Tcrb-J X67128 T-cell receptor beta, joining region
1452205_x_at cellular defense response 0.42 3.97 1.68
5430435G22Rik BB128517 RIKEN cDNA 5430435G22 gene
1424987_at small GTPase mediated signal transduction
0.33 2.81 0.93
Phka1 AA422311 phosphorylase kinase alpha 1 1422744_at glycogen
metabolism 0.44 2.73 1.21
Ier2 NM_010499 immediate early response 2 1416442_at immediate-early
gene inducible 1.04 2.53 2.64
Itgb4 L04678 integrin beta 4 1427387_a_at cell-matrix adhesion 0.50 2.51 1.25
Dusp1 NM_013642 dual specificity phosphatase 1 1448830_at response to
oxidative stress 2.01 2.51 5.04
Ccdc46 BG075808 coiled-coil domain containing 46 1427205_x_at 1.22 2.50 3.04

Cyr61 BM202770 cysteine rich protein 61 1438133_a_at regulation of cell
growth 0.89 2.43 2.16
Ildr1 BG084606
immunoglobulin-like domain containing receptor 1
1423276_at receptor activity 0.55 2.41 1.33
Usp18 NM_011909 ubiquitin specific peptidase 18 1418191_at
ubiquitin-dependent protein catabolism
0.95 2.36 2.25
Ghdc NM_031871 GH3 domain containing 1419502_at GTPase activator
activity 0.70 2.35 1.64
Egr1 NM_007913 early growth response 1 1417065_at
regulation of transcription, DNA-dependent
1.30 2.33 3.04
Zdhhc14 BB544336 zinc finger, DHHC domain containing 14
1438151_x_at zinc ion binding 0.58 2.31 1.35
Down-regulated genes
Myh1 AJ002522
myosin, heavy polypeptide 1, skeletal muscle, adult
1427868_x_at cytoskeleton organization and biogenesis
1.88 0.08 0.15
Car3 NM_007606 carbonic anhydrase 3 1460256_at
one-carbon compound metabolism
4.53 0.30 1.36
Sypl2 NM_008596 synaptophysin-like 2 1449206_at calcium ion
homeostasis 3.32 0.31 1.03
Rbm5 BE446879 RNA binding motif 1438069_a_at negative 1.59 0.32 0.51

protein 5 regulation of progression through cell cycle
Shroom3 AK003320 shroom family member 3 1454211_a_at cell
morphogenesis 1.81 0.32 0.58
4930408O21Rik AK015115 RIKEN cDNA 4930408O21 gene
1431741_a_at 1.56 0.34 0.53
Bmpr2 NM_007561
bone morphogenic protein receptor, type II (serine/threonine kinase)
1419616_at
transforming growth factor beta receptor signaling pathway
0.58 0.36 0.21
Errfi1 AI788755 ERBB receptor feedback inhibitor 1
1419816_s_at stress-activated protein kinase signaling pathway
1.35 0.37 0.50
Lpl NM_008509 lipoprotein lipase 1415904_at lipid metabolism 2.20 0.40 0.88 Capn6 AI747133 calpain 6 1450429_at proteolysis 2.39 0.41 0.98
Taf11 BC005603
TAF11 RNA polymerase II, TATA box binding protein (TBP)-associated factor
1451995_at regulation of transcription, DNA-dependent
1.02 0.41 0.42
Npl BC022734 N-acetylneuraminate pyruvate lyase
1424265_at N-acetylneuraminate lyase activity
2.14 0.42 0.90
Josd3 AU044383 Josephin domain containing 3 1452635_x_at 1.14 0.43 0.49
BC003993 BB532946 cDNA sequence 1438278_a_at RNA binding 2.07 0.43 0.89


Gene Name
Accession Number
Gene definition Probe Affymetrix
Ratio SMA/WT
Ratio Treated/SMA
Ratio Treated/WT
Hnrpk BB722680 Heterogeneous nuclear ribonucleoprotein K 1454692_x_at 2.00 0.7 1.40
Fus AF224264 fusion, derived from t(12;16) malignant liposarcoma (human) 1451285_at 1.72 0.53 0.91
Dhx9 U91922 DEAH (Asp-Glu-Ala-His) box polypeptide 9 1425617_at 1.64 0.81 1.33
Rbm5 BE446879 RNA binding motif protein 5 1438069_a_at 1.59 0.32 0.51
Snrpd3 AK019453 small nuclear ribonucleoprotein D3 1422885_at 1.49 0.76 1.13
Snrp70 BC002169 U1 small nuclear ribonucleoprotein polypeptide A 1451104_a_at 1.43 0.63 0.90
Sfpq BF224766 splicing factor proline/glutamine rich (polypyrimidine tract binding protein associated) 1438459_x_at 1.43 0.68 0.97
Trnt1 BM225164 tRNA nucleotidyl transferase, CCA-adding, 1 1425562_s_at 1.41 0.73 1.03
Sf1 BC009091 Splicing factor 1 1423750_a_at 1.39 0.8 1.11
Trit1 BC019812 tRNA isopentenyltransferase 1 1424489_a_at 1.35 0.79 1.07
Hnrpa2b1 C88150 heterogeneous nuclear ribonucleoprotein A2/B1 1433829_a_at 1.33 0.44 0.59
Prpf4b BC003769 PRP4 pre-mRNA processing factor 4 homolog B (yeast) 1451909_a_at 1.33 0.77 1.03
Sfrs7 BE825013 splicing factor, arginine/serine-rich 7 1436871_at 1.30 0.8 1.04
Dhx9 U91922 DEAH (Asp-Glu-Ala-His) box polypeptide 9 1451770_s_at 1.30 0.75 0.97
Xab2 NM_026156 XPA binding protein 2 1448278_at 1.30 0.73 0.95
Srrm1 NM_016799 serine/arginine repetitive matrix 1 1450045_at 1.28 0.77 0.99
Sf3a3 AK015776 splicing factor 3a, subunit 3 1432488_a_at 1.28 0.52 0.67
Sf3a3 BC009141 splicing factor 3a, subunit 3 1423811_at 1.27 0.78 0.99
List of genes involved in the RNA processing

Sf3a1 BB031756 splicing factor 3a, subunit 1 1449333_at 1.25 0.75 0.94
Fus AF224264 fusion, derived from t(12;16) malignant liposarcoma (human) 1451286_s_at 1.25 0.77 0.96
Cugbp1 AK014492 CUG triplet repeat, RNA binding protein 1 1427413_a_at 1.25 0.75 0.94
Fusip1 AF060490 FUS interacting protein (serine-arginine rich) 1 1423982_at 1.25 0.76 0.95
Rpp30 BG069849 ribonuclease P/MRP 30 subunit (human) 1423373_at 0.83 1.16 0.96
Hnrpr BB822465 heterogeneous nuclear ribonucleoprotein R 1452030_a_at 0.81 1.3 1.06
Snrpa NM_015782 small nuclear ribonucleoprotein polypeptide A 1417274_at 0.81 1.32 1.07
Ddx56 BC018291 DEAD (Asp-Glu-Ala-Asp) box polypeptide 56 1423815_at 0.81 1.28 1.03
Snrpn NM_013670 small nuclear ribonucleoprotein N 1415895_at 0.81 1.39 1.12
Crnkl1 NM_025820 Crn, crooked neck-like 1 (Drosophila) 1420849_at 0.80 1.48 1.18
Hnrpab BB168316 heterogeneous nuclear ribonucleoprotein A/B 1455855_x_at 0.80 1.23 0.98
Fbl NM_007991 fibrillarin 1416684_at 0.80 1.42 1.14
Snrpn NM_013670 small nuclear ribonucleoprotein N 1415896_x_at 0.79 1.23 0.98
0610009D07Rik BE199670 RIKEN cDNA 0610009D07 gene 1436681_x_at 0.76 1.21 0.92
Fusip1 NM_010178 FUS interacting protein (serine-arginine rich) 1 1449121_at 0.75 1.25 0.94
EG666609 NM_026506 small nuclear ribonucleoprotein polypeptide G 1448357_at 0.75 1.32 0.99
Bop1 BM213936 block of proliferation 1 1423264_at 0.73 1.33 0.97
Rbm8a NM_025875 RNA binding motif protein 8a 1418120_at 0.72 1.46 1.05
Rpp14 BI455861 ribonuclease P 14 subunit (human) 1419461_at 0.67 1.31 0.88