supplementary methods cytof - cancer...
TRANSCRIPT

Supplementary Methods CyTOF
Metal-labeled antibodies against cell surface markers were purchased from DVS Sciences and
listed in Table S1. Prostate tumor single cells were isolated using the Mouse Tumor Dissociation
kit (cat# 130-096-730, Miltenyl Biotec). Cells from spleen and lymph node were isolated by
mincing with a 5mL syringe plunger against a 40µm cells strainer into a 60mm dish with RPMI
medium containing 10% fetal bovine serum (FBS). The cells were depleted of erythrocytes by
hypotonic lysis. Peripheral blood (100µL) was drawn using retroorbital bleeding and depleted of
erythrocytes by hypotonic lysis. Next, tumor, spleen, lymph node, or blood cells were incubated
with CD16/CD32 antibody (clone 2.4G2, BD Biosciences) to block FcγR binding for 10 minutes
then with antibody mix for 30 minutes at room temperature. Cells were washed once and
incubated with MAXPAR®Nucleic Acid Intercalator-103Rh (Cat# 201103A, DVS Sciences) for
20 minutes for viability staining. Cells were fixed with 1.6% formaldehyde for 1 hour and
incubated with MAXPAR®Nucleic Acid Intercalator-Ir (Cat# 201192A, DVS Sciences) at 4oC
overnight to stain the nuclei. The samples were analyzed with CyTOF instrument (DVS
Sciences) in the Flow Cytometry and Cellular Imaging Core Facility at M.D. Anderson Cancer
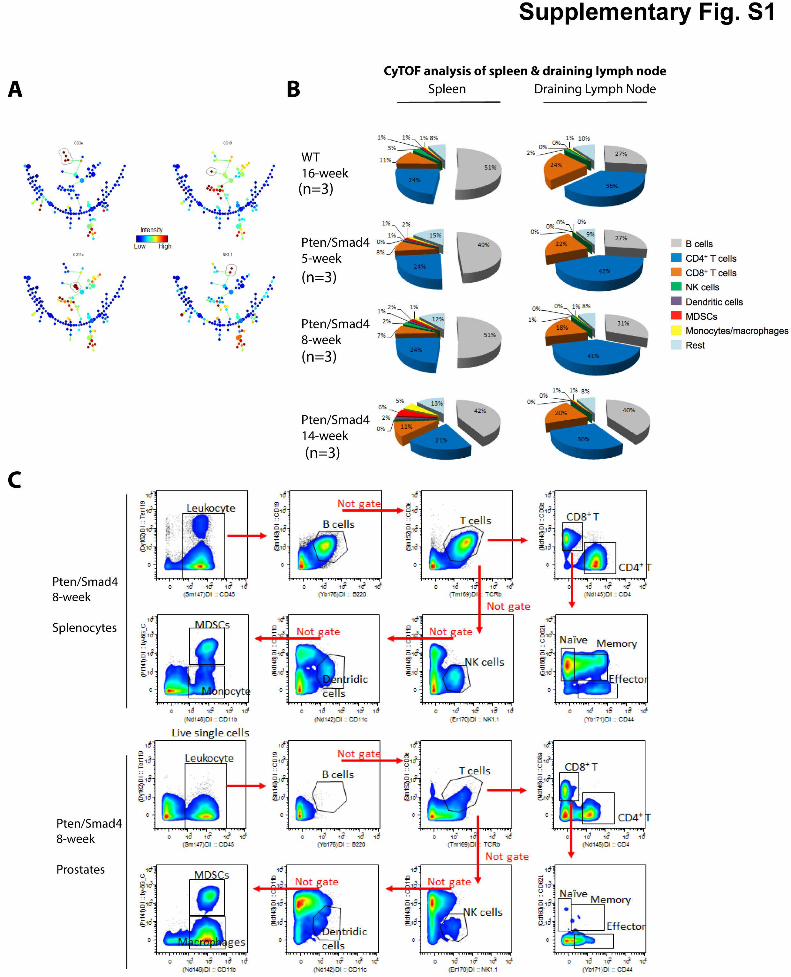
Center. The following markers were used to define different immune populations: T cells (CD3+
TCRβ+, further classified as CD4+ and CD8+), B cells (B220+ CD19+), NK cells (NK1.1+),
dendritic cells (CD11c+), MDSCs (CD11b+ Gr-1+), and macrophages (CD11b+ Gr-1-).
Flow cytometry
Fluorochrome-conjugated antibodies against CD45 (clone 30-F11), CD11b (M1/70), Gr-1 (RB6-
8C5), Ly-6C (HK1.4) were purchased from eBiosciences. Antibody against Ly-6G (1A8) was

purchased from BioLegend. Antibody against Cxcr2 (242216) was purchased from R&D
Systems. Primary cells from mice were isolated with the same methods as in CyTOF. To assess
cell viability, cells were incubated with SYTOX Blue (Life Technologies) prior to FACS
analysis. All samples were acquired with the LSRFortessa analyzer (Becton Dickinson) and
analyzed with FlowJo software (Tree Star).
T cell suppression assays
Single cells were prepared from prostate tumors using the Tumor Dissociation Kit-Mouse
(Miltenyi) and dead cells were removed using the Dead Cell Removal Kit (Miltenyi). MDSCs
were isolated by FACS sorting. Purified MDSCs were spun down, counted, and plated into 96-
well plates at an MDSC/T cell ratio of 0:1, 1:1, 1:2, 1:4, with 3.0 × 10⁵ to 5.0 × 10⁵ MDSCs used
in each ratio. T cells were harvested from naive, wild-type littermate animals by mashing whole
spleen through a 40-µm filter, followed by red blood cell lysis using ACK buffer. MACS-sorted
(Miltenyi) CD8+or CD4+ T cells were then washed, counted, and stained with carboxyfluorescein
diacetate succinimidyl ester (CFSE) (Invitrogen, Carlsbad, CA) according to the manufacturer's
instructions. CFSE labeled T cells were plated onto 96-well plates in the presence of anti-CD3 (1
µg/ml, Clone 145-2C11, eBioscience) and soluble anti-CD28 (2 µg/ml, Clone 37.51,
eBioscience) antibodies, with and without MDSCs, and allowed to proliferate for 72 hours.
Wells without anti-CD3 and soluble anti-CD28 antibodies were used as negative controls. The
suppression of T cells is calculated as described (1). The percentage of CFSE+ cells divided in
the presence of MDSCs was compared to percentage of CFSE+ divided cells in the absence of
any added MDSCs.
Cell culture and Lentivirus-mediated shRNA knockdown and overexpression
Ptenpc-/-Smad4pc-/- prostate cell lines have been described previously (2). All lentiviral shRNA
clones targeting Yap1 and nontargeting shRNA control were obtained from Sigma Aldrich in the
pLKO vector (Moffat et al., 2006) and prepared as described (3). The lentiviral constitutive
active YAP1 S127A and inactive YAP1 S127A/S94A mutants have been described (3).
MDSC depletion with Gr-1 antibody
Purified neutralizing antibody against Gr-1 (clone RB6-8C5) (4) and isotype Rat IgG2b control
(clone LTF-2) were purchased from BioXcell and dosed at 200 µg/mouse by intraperitoneal
injection, every other day for 30 days.
MDSC depletion with peptibody
Plasmids for irrelevant control peptibody and MDSC-specific Pep-H6 peptibody were
generously provided by Dr. Larry W Kwak. Plasmids used for in vivo administration were
purified using EndoFree Plasmid Maxi Kit (Qiangen). 15 ug of plasmids were injected into mice
through tail vein using the established protocol (5) in TransIT-EE Delivery Solution (Mirus Bio
LLC) every 4 days.
Cxcr2 inhibitor in vivo treatment
SB225002 was obtained from Cayman Chemical (Cat# 13336) and dissolved in DMSO
(10mg/ml) and diluted in vehicle (0.9%NaCl, 0.3%Tween 80) for in vivo administration. Mice
are subjected to either SB225002 (5mg/kg) or vehicle treatment by daily intraperitonal injection
for 14 days.

Microarray and computational analysis of mouse microarray data
Single cells from Ptenpc-/-Smad4pc-/-mTmG+ prostate were isolated by 1mg/ml collagenase
digestion for 1 hour followed by DNase I treatment. Single cells were FACS-sorted for GFP+ and
Tomato+ cells and RNA was purified with TRIzol (Life Technologies). RNA expression
profiling was performed at the MD Anderson Microarray Core facility using the Mouse Genome
430 2.0 Array (Affymetrix) to generate a Ptenpc-/-Smad4pc-/- tumor/Stroma dataset. Genes with
statistically significant differences between test and control conditions (Ptenpc-/-Smad4pc-/- tumors
vs Ptenpc-/- tumors or GFP+ vs. Tomato+) were generated using the following method: statistical
analyses were performed on log scale data using parametric test and variances are not assumed
equal (Welch t-test) with p-value cutoff 0.05. Additional fold change was applied to generate the
final list of genes as indicated in the Figure legend. Gene filtering was performed by removing
genes whose mean normalized test and control intensities are both less than the 20th percentile of
the combined normalized signal intensities. The intensities reported below correspond to mean
normalized test and control data rescaled to a median of 500. For GSEA analysis, the raw data of
GSE25140 was processed and analyzed by GenePattern (6) using ExpressionFileCreator Module
(version 11.14) and GSEA module (v14). For oPOSSUM (7) analysis
(http://opossum.cisreg.ca/cgi-bin/oPOSSUM3/opossum_mouse_ssa), genes upregulated in the
Ptenpc-/-Smad4pc-/- tumors as compared to Ptenpc-/- tumors (≥1.5 Fold) were intersected with genes
that are upregulated in GFP+ cells vs. Tomato+ cells (≥2 folds). The 70 overlapped genes were
subjected to oPOSSUM Mouse Single Site Analysis.
MDSCs migration assay
Single cells were prepared from prostate tumors using the Tumor Dissociation Kit-Mouse
(Miltenyi) and dead cells were removed as described above. Cells are labeled with Gr-1-FITC
(Clone RB6-8C5, Biolegend) conjugated antibody and Sytox red for cell viability. FITC positive
cells were sorted using BD FACSAria™ Fusion (BD Biosciences). 0.5x10⁶ of FACS sorted cells
were placed on the upper chamber of a transwell system (6 µm, BD Falcon) and conditioned
media (CM) with vehicle, CM with anti-Cxcl5 neutralizing antibody (10 mg/ml final
concentration), CM with anti-Cxcr2 neutralizing antibody (10 mg/ml final concentration), or
Cxcr2 specific inhibitor SB225002 (400 nM final concentration), CM from Pten/Smad4-deficient
cells infected with control shRNA or shRNA for Yap1, CM from Pten/Smad4-deficient cells
treated with vehicle or 1 µM Verteporfin (VP) were added to the bottom chamber of a 24-well
plate. For Cxcr2 neutralizing antibody and Cxcr2 inhibitor SB225002 treatment, cells were pre-
treated with 10 µg/ml antibody or 400 nM inhibitor before added to the upper chamber. Cells
were allowed to migrate to the bottom well for 6 hours at 37 °C, 5% CO2. Migrated cells were
then analyzed by flow cytometry using BD Fortessa X20. Migrated FITC positive cells were
gated to count the absolute number of cells migrated through the transwell.
Mouse histopathological analysis
The dorsolateral, anterior and ventral prostate from control, anti-Gr1 neutralizing antibody
treatment, peptibody treatment, and SB225002 treatment groups were examined histologically
and scored qualitatively for the following criterion: most advanced neoplastic classification,
neoplastic classification of the predominant portion of the slide, stromal reaction and
inflammation. Diagnoses were based on the Bar Harbor classification of mouse prostate
pathology. Fibrosis and inflammation were graded qualitatively on a scale from 0 - 4.

Evaluation of histopathologic slides from the 3 components of the mouse prostate from animals
either control or treated with Gr1 antibody, peptibody, and Cxcr2 inhibitor was performed.
Inducible Yap1 knockdown
Inducible Yap1 knockdown was constructed by cloning the two Yap1 shRNA used previously
(3) from the pLKO.1 into a doxycycline inducible plasmid. Lentivirus was packaged in 293T and
was used to infect PPS, a C57BL/6-syngeneic cell line isolated from prostate tumor of Ptenpc-/-
Smad4pc-/- Tp53pc-/-mice. Stable sublines were selected with puromycine (2 µg/mL) and injected
subcutaneously to the flank of 5-week old male C57BL/6 mice (Jackson Laboratory). Two weeks
post-injection, mice were fed with doxycycline water (2 g/L), a method used to execute
doxycycline inducible expression in vivo (8). Tumors were measured and extracted 6 days later
to analyze for MDSC% in infiltrating immune cells.
TCGA analysis for MDSCs signature, YAP1 signature, and CXCL6 expression
Two different resources are collected to generate a short list of genes as putative signature genes
for human MDSCs. The first resource is from a landmark review article about MDSCs (9). From
Box 1 of this paper, 24 phenotypic markers of human MDSCs are adopted into our signature.
The second resource is from automated literature mining. From PubMed database, we searched
genes cited in literature related to three keywords: immunoscore, immune gene signature, and
myeloid derived suppressor cell. After removing overlapping genes from the first method, 16
genes are left that were cited by at least two of the three keyword. We finally selected 39 MDSC
genes (Supplementary Table S7). We clustered the 498 TCGA prostate samples or the prostate
tumor samples from Wallace et al (10) (GSE6956) using the gene expression data of 39 MDSC

genes and identified subtypes: MDSC-high, MDSC-low, and MDSC-medium. We then
compared the whole transcriptome profiles between MDSC-high and MDSC-low samples to
identify differentially expressed genes. Gene set enrichment analysis (GSEA; Subramanian et al.,
2005) was then used to identify significantly de-regulated pathways and biological processes
between the two sample groups. The two YAP1 signatures were derived from two publications
(11, 12). The expression of CXCL6 in MDSCs-high samples is compared to MDSCs-low
samples using wilcoxon test.
1. Battaglia M, Stabilini A, Roncarolo MG. Rapamycin selectively expands CD4+CD25+FoxP3+ regulatory T cells. Blood. 2005;105:4743-‐8. 2. Ding Z, Wu CJ, Chu GC, Xiao Y, Ho D, Zhang J, et al. SMAD4-‐dependent barrier constrains prostate cancer growth and metastatic progression. Nature. 2011;470:269-‐73. 3. Kapoor A, Yao W, Ying H, Hua S, Liewen A, Wang Q, et al. Yap1 activation enables bypass of oncogenic Kras addiction in pancreatic cancer. Cell. 2014;158:185-‐97. 4. Pekarek LA, Starr BA, Toledano AY, Schreiber H. Inhibition of tumor growth by elimination of granulocytes. The Journal of experimental medicine. 1995;181:435-‐40. 5. Liu F, Song Y, Liu D. Hydrodynamics-‐based transfection in animals by systemic administration of plasmid DNA. Gene therapy. 1999;6:1258-‐66. 6. Reich M, Liefeld T, Gould J, Lerner J, Tamayo P, Mesirov JP. GenePattern 2.0. Nat Genet. 2006;38:500-‐1. 7. Kwon AT, Arenillas DJ, Worsley Hunt R, Wasserman WW. oPOSSUM-‐3: advanced analysis of regulatory motif over-‐representation across genes or ChIP-‐Seq datasets. G3. 2012;2:987-‐1002. 8. Ying H, Kimmelman AC, Lyssiotis CA, Hua S, Chu GC, Fletcher-‐Sananikone E, et al. Oncogenic Kras maintains pancreatic tumors through regulation of anabolic glucose metabolism. Cell. 2012;149:656-‐70. 9. Talmadge JE, Gabrilovich DI. History of myeloid-‐derived suppressor cells. Nat Rev Cancer. 2013;13:739-‐52. 10. Wallace TA, Prueitt RL, Yi M, Howe TM, Gillespie JW, Yfantis HG, et al. Tumor immunobiological differences in prostate cancer between African-‐American and European-‐American men. Cancer Res. 2008;68:927-‐36. 11. Lee KW, Lee SS, Kim SB, Sohn BH, Lee HS, Jang HJ, et al. Significant association of oncogene YAP1 with poor prognosis and cetuximab resistance in colorectal cancer patients. Clinical cancer research : an official journal of the American Association for Cancer Research. 2015;21:357-‐64. 12. Cordenonsi M, Zanconato F, Azzolin L, Forcato M, Rosato A, Frasson C, et al. The Hippo transducer TAZ confers cancer stem cell-‐related traits on breast cancer cells. Cell. 2011;147:759-‐72.


SUPPLEMENTARY FIGURE LEGENDS
Figure S1. CyTOF analysis of biological samples from Ptenpc-/-Smad4pc-/- mice (Related to
Figure 2). (A) SPADE trees colored by the median intensity of individual markers. (B) CyTOF
analysis of spleen and draining lymph node from 5, 8, and 14 weeks old Ptenpc-/-Smad4pc-/- mice
and control 16 weeks old wild type mice (n=3). Percentages of various immune cell populations
within CD45+ leukocytes are shown. Data were collected with CyTOF and analyzed with
Flowjo. (C) Gating strategy of immune cell populations from CyTOF data. Splenocytes and
prostate cells (containing both tumor and non-tumor cells) are shown as representatives. Blood
and draining lymph nodes cells were gated following the same strategy.
Figure S2. Strategy used for MDSCs Isolation (Related to Figure 3). MDSCs were isolated
through FACS of CD11b+Gr1+ cells from the tumor.
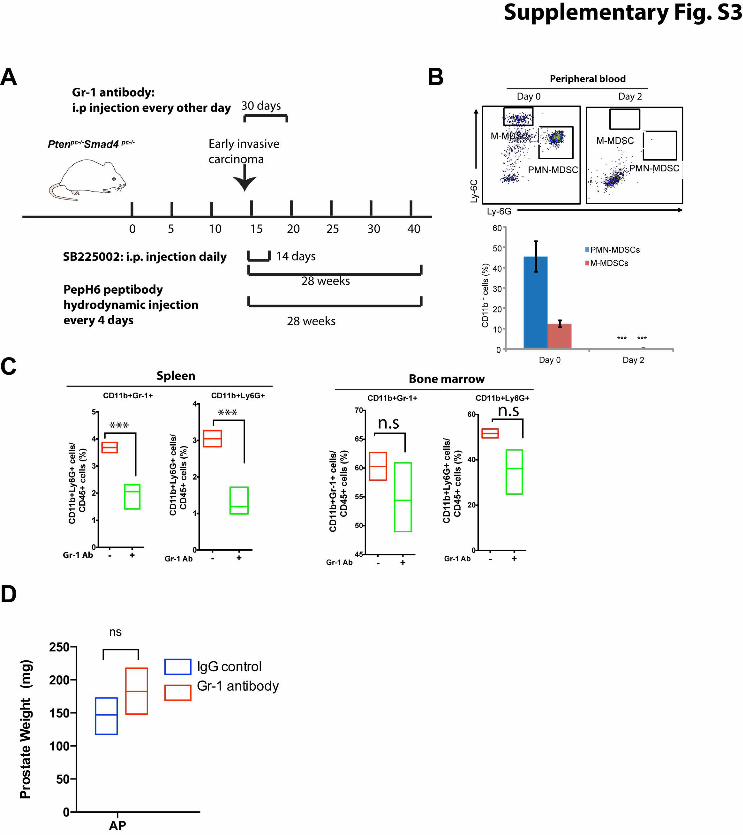
Figure S3. (A) Treatment scheme for Gr-1 antibody, peptibody, and Cxcr2 inhibitor SB225002.
(B) Gr-1 antibody significantly reduced MDSCs in peripheral blood 2 days after 1 dose of
injection, measured by Ly-6G and Ly-6C using flow cytometry (n=3). (C) Gr-1 antibody
significantly reduced MDSCs in spleen and bone marrow (n=4). (D) Weight of anterior prostates
(AP) (n=4) treated with IgG or Gr-1 antibody. No difference was observed due to excessive fluid
accumulation in the Gr1 treated AP. In B, D ***P<0.001.
Figure S4. (A) IHC staining of Ki67, CD45, Vimentin, Smooth muscle actin (SMA) and
Trichrome staining of mouse prostate tissues treated with IgG control or Gr1 antibody.
Quantification was performed using ImageJ. (B) Pep-H6 peptibody treatment significantly
reduced MDSCs in peripheral blood 3 days after 1 dose of injection measured by flow cytometry
(n=3). *P<0.05, **P<0.01.
Figure S5. (A) The top 10 differentially expressed genes in Ptenpc-/-Smad4pc-/- tumors as
compared to Ptenpc-/- tumors, identified by microarray analysis (n=5). (B) Prostate tumor enriches
for CD11b+ Gr-1+ cells with higher Cxcr2 expression. From Pten/Smad4 mice with established
prostate tumor, tissues including bone marrow, blood, spleen and prostate were harvested and
stained with CD45, CD11b, Gr-1 and Cxcr2. From CD45+ cells in each tissue, both CD11b+ Gr-
1+ cells and CD11b- Gr-1- cells were examined for Cxcr2 expression level. Cxcr2 expression is
segmented to three levels: negative, positive and high, and CD11b+ Gr-1+ cells in each tissue are
plotted for the three levels in pie charts (n=3). (C-D) SB225002 decreased MDSCs infiltration in
the Ptenpc-/-Smad4pc-/- tumors as shown by flow cytometry analysis (n=4). (E) Weight of anterior
prostates (AP) from mice treated with vehicle or Cxcr2 inhibitor SB225002 (n=4).
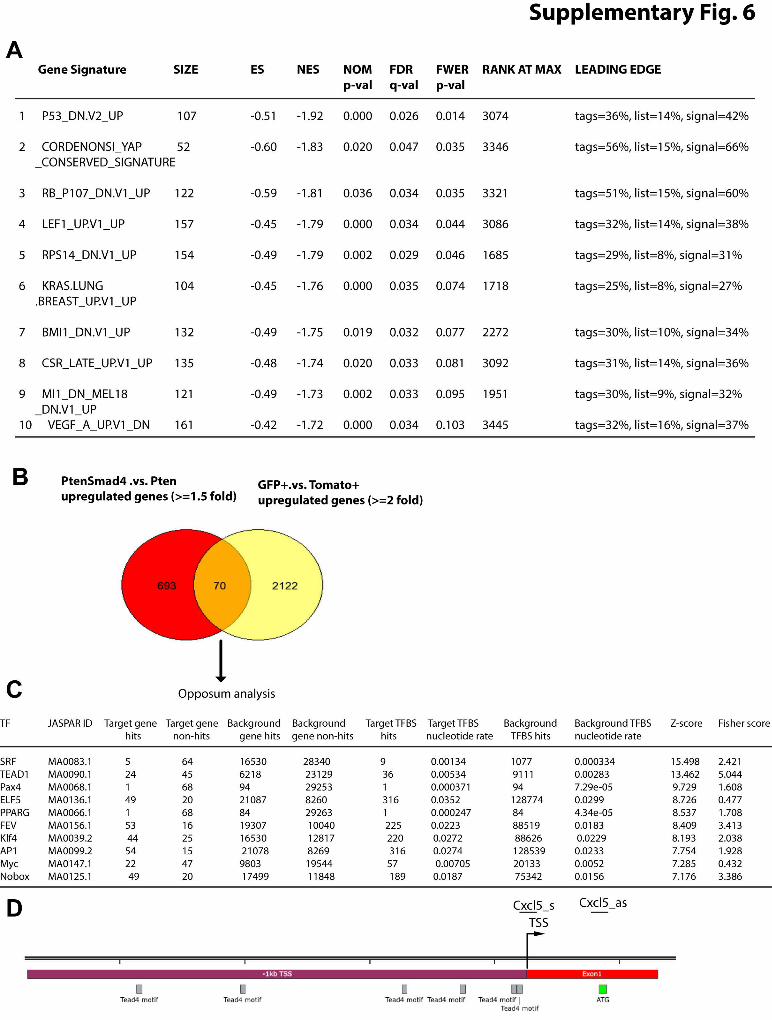
Figure S6. (A) Top 10 activated oncogenic signatures identified by GSEA analysis in Ptenpc-/-
Smad4pc-/- tumors as compared to Ptenpc-/- tumors (n=5). (B-C) oPOSSUM analysis identified
TEAD motifs as overrepresented in the upregulated tumor-specific genes in Ptenpc-/-Smad4pc-/-
tumors as compared to Ptenpc-/- tumors (n=5). (D) Putative Yap1/TEAD binding sites in the
Cxcl5 promoter.
Figure S7. (A) Clustering of primary prostate tumors from Wallace et al into MDSC-high and
MDSC-low subtypes. (B) GSEA analysis identified YAP1 signatures in MDSC-high as
compared to MDSC-low samples.
Table S1. Markers used in CyTOF analysis.

Table S2: Detailed pathology description of the Gr1 treated mice and Cxcr2 inhibitor treated
mice.
Table S3. Genes upregulated in Ptenpc-/-Smad4pc-/- tumors as compared to Ptenpc-/- tumors (≥2
fold).
Table S4. Genes upregulated in GFP+ tumors cells from Ptenpc-/-Smad4pc-/- mice as compared to
Tomato+ cells (≥4 fold)
Table S5. Overlapped genes between Genes upregulated in Ptenpc-/-Smad4pc-/- tumors as
compared to Ptenpc-/- tumors (≥2 fold) and genes upregulated in GFP+ tumors cells from Ptenpc-/-
Smad4pc-/- mice as compared to Tomato+ cells (≥4 fold).
Table S6. Detailed information for the YAP1 IHC staining in human prostate cancers.
Table S7. The 39-gene signatures curated from literatures.