supplementary information - media.nature.com · supplementary information 2 | research 0.2 s (sling...
TRANSCRIPT

W W W. N A T U R E . C O M / N A T U R E | 1
SUPPLEMENTARY INFORMATIONdoi:10.1038/nature11248
SUPPLEMENTARY FIGURES
Supplementary Figure 1| Rolling leukocytes form slings in mouse cremaster venules.
DyLight-488-conjugated-anti-LFA-1 (green) mAb was injected (via a catheter connected to the
right carotid artery) into WT mice to stain all leukocytes green and the rolling in cremaster
venules was recorded using a 100X 1.45 NA oil immersion objective and intravital
epifluorescence microscopy. Images were saturated to reveal slings, which makes the cells
appear bigger than their normal size (~7.5 µm). (a-f) Six representative leukocytes before,
during, and after sling formation. (a) A sling appears in the front of a rolling leukocyte at t = 0.1
s (sling marked with white arrow) and the cell wraps the sling around itself by t = 0.2 s (sling
still visible marked with white arrow). (b) A rolling leukocyte forms a sling in the front at t =

SUPPLEMENTARY INFORMATION
2 | W W W. N A T U R E . C O M / N A T U R E
RESEARCH
0.2 s (sling marked with white arrow). As the cell rolls over the sling, the sling comes closer to
the vessel wall and becomes clearly visible at t = 0.5 s (sling marked with white arrow). (c) A
rolling leukocyte forms a sling in the front at t = 0.4 s (sling marked with white arrow) and then
rolls over the sling by t = 0.6 s. (d) A rolling leukocyte forms a sling in the front at t = 0.1 s
(sling marked with white arrow) and rolls over the sling by t = 0.4 s. (e) A rolling leukocyte
forms a sling in the front at t = 0.1 s (sling marked with white arrow) and starts to roll over the
sling by t = 0.2 s (sling still visible marked with white arrow). (f) A rolling leukocyte forms a
sling in the front at t = 0.2 s (sling marked with white arrow) and then rolls over the sling by t =
0.6 s. Scale bars 5 µm. Thick grey horizontal arrows denote the direction of rolling.

W W W. N A T U R E . C O M / N A T U R E | 3
SUPPLEMENTARY INFORMATION RESEARCH
Supplementary Figure 2| Aspect ratio of tether anchorage points increases linearly with
maximum tether length. (a) Sequence of qDF images of a DiI-stained neutrophil rolling on P-
selectin. The tether anchorage point (white arrowhead) elongates with the increasing length of
tether. Wall shear stress 10 dyn/cm2. Images were processed to reveal tether anchorage points. P-
selectin 20 molecules/µm2. TIRF excitation 561 nm laser and incidence angle θ = 70⁰. Scale bars
5 µm. Grey thick arrow denotes the direction of rolling. (b-d) Aspect ratio of tether anchorage
points plotted as a function of the maximum tether length (horizontal distance between the cell
center and tether anchorage point before tether detachment from the substrate) at shear stresses
of (b) 6, (c) 8, and (d) 10 dyn/cm2. P-selectin 20 molecules/µm2. Data representative of three

SUPPLEMENTARY INFORMATION
4 | W W W. N A T U R E . C O M / N A T U R E
RESEARCH
independent experiments. (e) Linear correlation analysis of the data in b-d40. a, y intercept; b,
slope; σa, uncertainty in a; σb uncertainty in b; r2, linear correlation coefficient.
40. Press, W.H., Flannery, B.P., Teukolsky, S.A. & Vetterling, W.T., NUMERICAL RECIPES-
THE ART OF SCIENTIFIC COMPUTING, 3rd ed. (Cambridge University Press, New
York, 2007).

W W W. N A T U R E . C O M / N A T U R E | 5
SUPPLEMENTARY INFORMATION RESEARCH
Supplementary Figure 3| Fraction of the forward force and torque acting on a rolling
neutrophil balanced by slings and tethers. Two slings and two tethers, each with
inflection/anchorage point 10 µm from the cell center; Fcell, total forward force on the cell; FSL/Te
(2SL & 2Te), forward force balanced by 2 slings and 2 tethers; Γcell, total torque on the cell;
ΓSL/Te (2SL & 2Te), torque balanced by 2 slings and 2 tethers. Refer to Methods for details on
force and torque estimation.
SUPPLEMENTARY INFORMATION
6 | W W W. N A T U R E . C O M / N A T U R E
RESEARCH
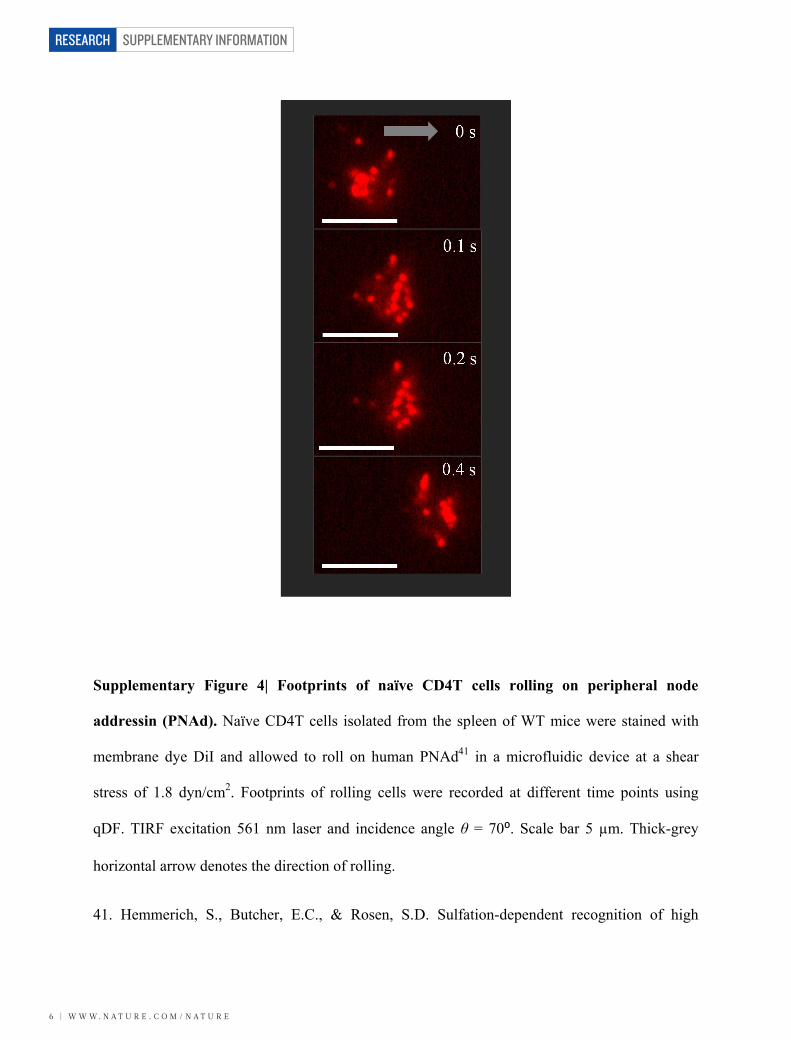
Supplementary Figure 4| Footprints of naïve CD4T cells rolling on peripheral node
addressin (PNAd). Naïve CD4T cells isolated from the spleen of WT mice were stained with
membrane dye DiI and allowed to roll on human PNAd41 in a microfluidic device at a shear
stress of 1.8 dyn/cm2. Footprints of rolling cells were recorded at different time points using
qDF. TIRF excitation 561 nm laser and incidence angle θ = 70⁰. Scale bar 5 µm. Thick-grey
horizontal arrow denotes the direction of rolling.
41. Hemmerich, S., Butcher, E.C., & Rosen, S.D. Sulfation-dependent recognition of high

W W W. N A T U R E . C O M / N A T U R E | 7
SUPPLEMENTARY INFORMATION RESEARCH
endothelial venules (HEV)-ligands by L-selectin and MECA 79, and adhesion-blocking
monoclonal antibody. The Journal of Experimental Medicine 180, 2219-2226 (1994).

SUPPLEMENTARY INFORMATION
8 | W W W. N A T U R E . C O M / N A T U R E
RESEARCH
Supplementary Figure 5| Sling formation by Th1 cells rolling on P-selectin. (a) Naïve CD4T
cells were in vitro differentiated into Th1 cells and the differentiation was verified by their
ability to produce γ-interferon (IFN) following activation. (b) Th1 cells were tested for their
ability to bind soluble recombinant murine P-selectin-Fc. Red curve (P-selectin-Fc + APC-anti-

W W W. N A T U R E . C O M / N A T U R E | 9
SUPPLEMENTARY INFORMATION RESEARCH
human-IgG), blue curve (APC-anti-human-IgG), and green (no IgG-Fc). (c) In vitro
differentiated Th1 cells stained with membrane dye DiI were allowed to roll on P-selectin in a
microfluidic device and footprints of rolling cells visualized using qDF. TIRF excitation 561 nm
laser, incidence angle θ = 70⁰. A membrane tether (anchorage point marked with a white
arrowhead at t = 0 s) following detachment at the rear of the rolling cell is laid in the front of the
cell as a sling (marked with white arrow at t = 5 s). The cell rolls forward relocating the sling to
the rear (t = 7 and 18.5s). P-selectin 20 molecules/µm2. Wall shear stress 8 dyn/cm2. Thick-grey
horizontal arrow denotes the direction of rolling. Images were processed to reveal slings and
tether anchorage points. Scale bars 5 µm.

SUPPLEMENTARY INFORMATION
1 0 | W W W. N A T U R E . C O M / N A T U R E
RESEARCH
Supplementary Figure 6| PSGL-1 expressed on the tips of microvilli. Isolated mouse bone
marrow neutrophils stained with membrane dye DiI (red) and DyLight-488-conjugated-non-
blocking-anti-PSGL-1 mAb (green) were allowed to roll on P-selectin in a microfluidic device
and footprints visualized using DqDF. (a) DqDF image of a bone marrow neutrophil from a WT
mouse rolling on P-selectin. First column-dual color image showing membrane (red) and PSGL-
1 (green). Corresponding single color images of PSGL-1 (green) and membrane (red) shown in
second and third column, respectively. Slings marked with white solid arrows. Thick grey
horizontal arrow denotes the direction of rolling. TIRF excitation 488 and 561 nm lasers and
incidence angle, θ = 70⁰. Scale bars 5 µm. P-selectin 20 molecules/µm2. Wall shear stress 10
dyn/cm2. (b) The DiI image (red image in the third column of a) was used to generate a 3D-
reconstruction of the footprint12 and the PSGL-1 image (green image in the second column of a)

W W W. N A T U R E . C O M / N A T U R E | 1 1
SUPPLEMENTARY INFORMATION RESEARCH
overlaid to reveal the PSGL-1 distribution on slings, tether anchorage points, and microvilli
(hills) vs. cell surface (valleys). Thick white horizontal arrow denotes the direction of rolling.
SUPPLEMENTARY INFORMATION
1 2 | W W W. N A T U R E . C O M / N A T U R E
RESEARCH
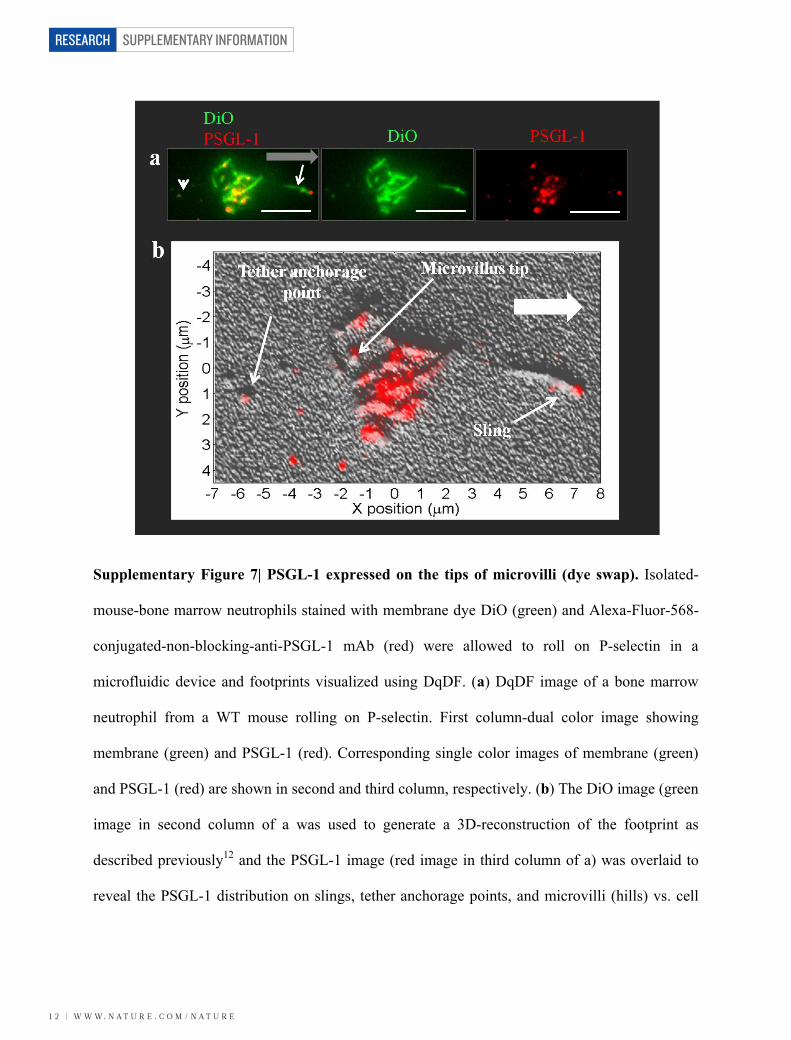
Supplementary Figure 7| PSGL-1 expressed on the tips of microvilli (dye swap). Isolated-
mouse-bone marrow neutrophils stained with membrane dye DiO (green) and Alexa-Fluor-568-
conjugated-non-blocking-anti-PSGL-1 mAb (red) were allowed to roll on P-selectin in a
microfluidic device and footprints visualized using DqDF. (a) DqDF image of a bone marrow
neutrophil from a WT mouse rolling on P-selectin. First column-dual color image showing
membrane (green) and PSGL-1 (red). Corresponding single color images of membrane (green)
and PSGL-1 (red) are shown in second and third column, respectively. (b) The DiO image (green
image in second column of a was used to generate a 3D-reconstruction of the footprint as
described previously12 and the PSGL-1 image (red image in third column of a) was overlaid to
reveal the PSGL-1 distribution on slings, tether anchorage points, and microvilli (hills) vs. cell

W W W. N A T U R E . C O M / N A T U R E | 1 3
SUPPLEMENTARY INFORMATION RESEARCH
surface (valleys). TIRF excitation 488 and 561 nm lasers and incidence angle, θ = 70⁰. Scale bars
5 µm. Thick arrow denotes the direction of rolling.

SUPPLEMENTARY INFORMATION
1 4 | W W W. N A T U R E . C O M / N A T U R E
RESEARCH
Supplementary Figure 8| PSGL-1 is distributed in patches on slings. Mouse bone marrow
neutrophils stained with Alexa-Fluor-568-conjugated-non-blocking-anti-PSGL-1 mAb (red)
were allowed to roll on P-selectin and footprints visualized using qDF. TIRF excitation 561 nm
laser and incidence angle θ = 70⁰. qDF images of a rolling neutrophil show PSGL-1 expression
on the sling (white arrow at t = 1 s), tether anchorage points (white arrowhead at t = 1 s), and
also cell surface. Wall shear stress 10 dyn/cm2. P-selectin 20 molecules/µm2. Thick-grey
horizontal arrow denotes the direction of rolling. Scale bars 5 µm.

W W W. N A T U R E . C O M / N A T U R E | 1 5
SUPPLEMENTARY INFORMATION RESEARCH
Supplementary Figure 9| PSGL-1 staining absent in the footprints of PSGL-1 deficient
neutrophils. Isolated-bone marrow neutrophils from PSGL-1 deficient (Selplg-/-) mice stained
with membrane dye DiO (green) and Alexa-Fluor-568-conjugated-non-blocking-anti-PSGL-1
mAb (red) were allowed to roll on E-selectin and footprints visualized using DqDF. TIRF
excitation 488 and 561 nm lasers and incidence angle, θ = 70⁰. First row-dual color image
showing membrane (green) and PSGL-1 (red-staining absent). Corresponding single color
images of membrane (green) and PSGL-1 (red-staining absent) shown in second and third row,
respectively. The PSGL-1 (red) staining is absent in the dual color (row 1) and the single color
(row 3) images. Wall shear stress 10 dyn/cm2. E-selectin coating concentration 1 µg/ml. Scale

SUPPLEMENTARY INFORMATION
1 6 | W W W. N A T U R E . C O M / N A T U R E
RESEARCH
bars 5 µm. Tether anchorage points and slings marked with white arrowheads and white arrows,
respectively. Thick-grey horizontal arrow denotes the direction of rolling.

W W W. N A T U R E . C O M / N A T U R E | 1 7
SUPPLEMENTARY INFORMATION RESEARCH
Supplementary Figure 10| Microvilli preserved as lobes on slings-Example 1. Isolated-
mouse bone marrow neutrophils rolling on P-selectin in a microfluidic device were fixed and
visualized using scanning electron microscopy. View from top of the cell. Scanning electron
micrograph showing lobe-like structures (marked with white dashed arrows) on the slings. Scale
bar 5 µm. Thick white arrow denotes the direction of rolling. Wall shear stress 10 dyn/cm2. P-
selectin 20 molecules/µm2. Image processed to reveal lobes on slings.

SUPPLEMENTARY INFORMATION
1 8 | W W W. N A T U R E . C O M / N A T U R E
RESEARCH
Supplementary Figure 11| Microvilli preserved as lobes on slings-Example 2. Isolated-
mouse bone marrow neutrophils rolling on P-selectin in a microfluidic device were fixed and
visualized using scanning electron microscopy. View from top of the cell. Scanning electron
micrograph showing lobe-like structures (marked with white dashed arrows) on the slings. Scale
bar 5 µm. Thick white arrow denotes the direction of rolling. Wall shear stress 10 dyn/cm2. P-
selectin 20 molecules/µm2. Image processed to reveal lobes on slings.
W W W. N A T U R E . C O M / N A T U R E | 1 9
SUPPLEMENTARY INFORMATION RESEARCH
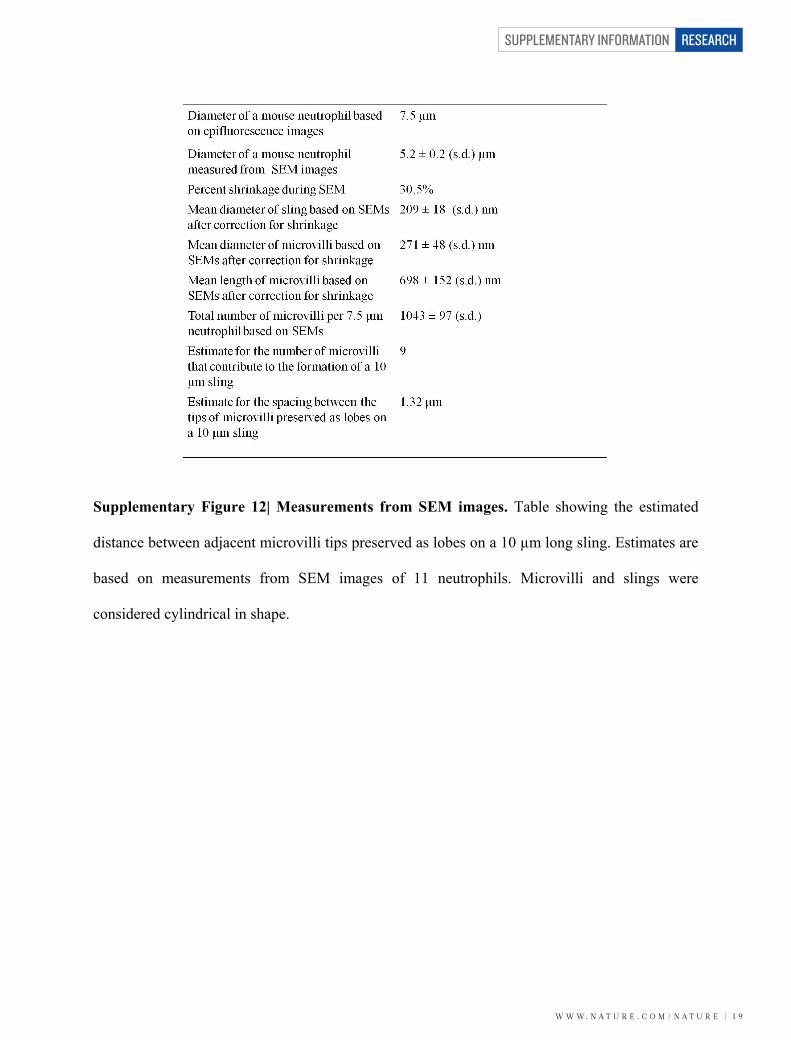
Supplementary Figure 12| Measurements from SEM images. Table showing the estimated
distance between adjacent microvilli tips preserved as lobes on a 10 µm long sling. Estimates are
based on measurements from SEM images of 11 neutrophils. Microvilli and slings were
considered cylindrical in shape.

SUPPLEMENTARY INFORMATION
2 0 | W W W. N A T U R E . C O M / N A T U R E
RESEARCH
Supplementary Figure 13| Step-wise peeling of slings. Isolated mouse bone marrow
neutrophils stained with membrane dye DiO (green) and Alexa-Fluor-568-conjugated-non-
blocking-anti-PSGL-1 mAb (red) were allowed to roll on P-selectin in a microfluidic device and
footprints visualized using DqDF. TIRF excitation 488 and 561 nm lasers and incidence angle, θ
= 70⁰. P-selectin 20 molecules/µm2. Wall shear stress 10 dyn/cm2. Scale bars 5 µm. The same
cell is shown in Figure 3c. Images were saturated to reveal membrane (green) in the tether
anchorage points and slings. PSGL-1 patches on the slings appear yellow (red + green). The
rolling neutrophil has two slings (marked with red solid arrows as SL#1 and 2) and three long
tethers (anchorage points marked with red dashed arrows as Te#1, 2, and 3). Rolling is from left
W W W. N A T U R E . C O M / N A T U R E | 2 1
SUPPLEMENTARY INFORMATION RESEARCH
to right. As described in Figure 3d-e and Supplementary figure 14-15, when a PSGL-1 patch
becomes load-bearing, the bond force acting on the patch pulls the patch out of the TIRF
evanescent wave (~100 nm from the cover slip4). As a result, the PSGL-1 staining (yellow spot)
in the patch falls below detection limit and thus, seems to disappear. Based on this, a patch or a
tether anchorage point was considered as failed only when both the PSGL-1 staining (yellow
spot) and the green membrane underneath disappeared. The PSGL-1 patches at the inflection
point of SL#1 and 2 are visible as yellow spots (marked with solid white arrow) at t = -0.8 s
when the slings are not yet loaded. As the cell rolls forward the patches marked with white
arrows at the inflection point of both the slings at t = -0.8 s become load bearing at t = 0 s which
is evident by the loss of PSGL-1 staining (yellow) in these patches. The loading of slings cause
the cell to slow down. The two load-bearing patches on SL#1 fail somewhere between t = 0 and
0.2 s allowing the cell to roll forward by a small distance (displacement relative to black vertical
dashed line) and the next two downstream patches on SL#1 become load-bearing, which is again
evident by the loss of PSGL-1 staining in these patches which was visible at t = 0 s (yellow
spots). The first load-bearing patch on SL#1 fails somewhere between t = 0.2 and 0.4 s allowing
the cell to roll to the right by a small distance. The unloaded patches on SL#1 are clearly visible
as yellow spots. The remaining load-bearing patch on SL#1, the load-bearing patch on SL#2, and
Te#2 fail somewhere between t = 1 s and 1.2 s. The cell jumps forward and the load is
transferred to the next downstream patches on SL#1 and SL#2. The new load-bearing patch on
SL#1 shows decreased PSGL-1 staining following loading at t = 1.2 s which was evident as a
yellow spot at t = 1 s when unloaded. The new load-bearing patch on SL#2 is hidden under the
cell and becomes visible as the cell rolls forward, however, it was visible as a yellow spot
(marked with white dashed arrow) when unloaded at t = -0.8 s. The displacement generated by
SUPPLEMENTARY INFORMATION
2 2 | W W W. N A T U R E . C O M / N A T U R E
RESEARCH
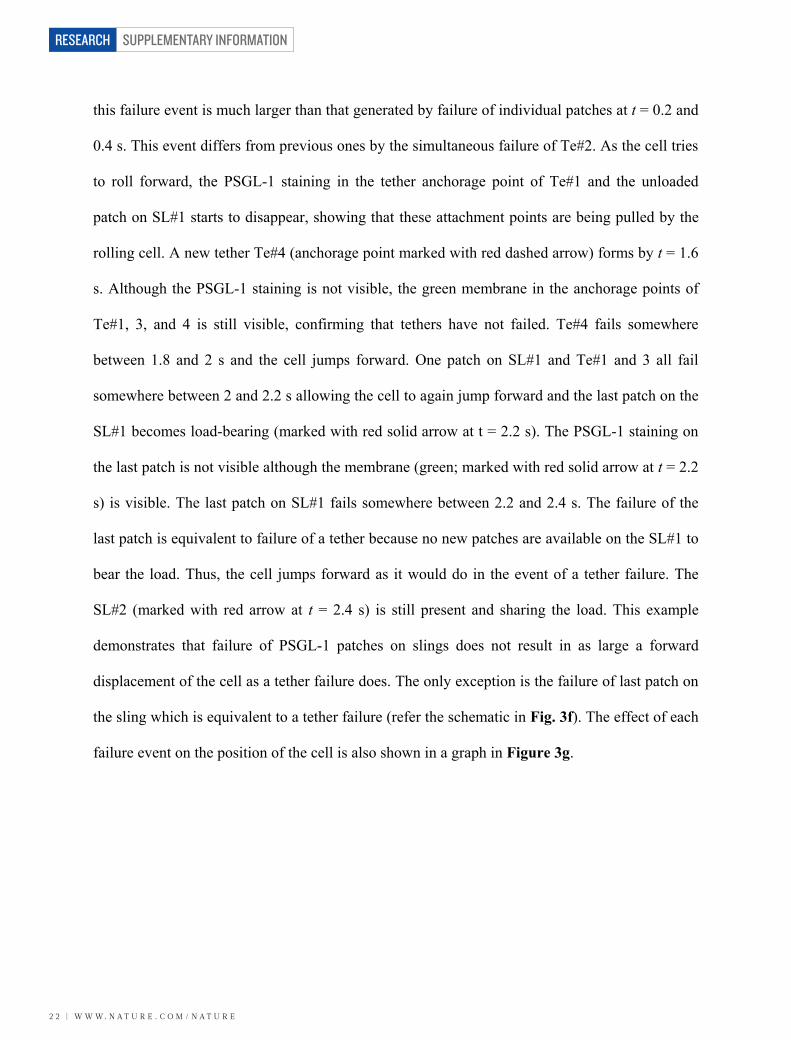
this failure event is much larger than that generated by failure of individual patches at t = 0.2 and
0.4 s. This event differs from previous ones by the simultaneous failure of Te#2. As the cell tries
to roll forward, the PSGL-1 staining in the tether anchorage point of Te#1 and the unloaded
patch on SL#1 starts to disappear, showing that these attachment points are being pulled by the
rolling cell. A new tether Te#4 (anchorage point marked with red dashed arrow) forms by t = 1.6
s. Although the PSGL-1 staining is not visible, the green membrane in the anchorage points of
Te#1, 3, and 4 is still visible, confirming that tethers have not failed. Te#4 fails somewhere
between 1.8 and 2 s and the cell jumps forward. One patch on SL#1 and Te#1 and 3 all fail
somewhere between 2 and 2.2 s allowing the cell to again jump forward and the last patch on the
SL#1 becomes load-bearing (marked with red solid arrow at t = 2.2 s). The PSGL-1 staining on
the last patch is not visible although the membrane (green; marked with red solid arrow at t = 2.2
s) is visible. The last patch on SL#1 fails somewhere between 2.2 and 2.4 s. The failure of the
last patch is equivalent to failure of a tether because no new patches are available on the SL#1 to
bear the load. Thus, the cell jumps forward as it would do in the event of a tether failure. The
SL#2 (marked with red arrow at t = 2.4 s) is still present and sharing the load. This example
demonstrates that failure of PSGL-1 patches on slings does not result in as large a forward
displacement of the cell as a tether failure does. The only exception is the failure of last patch on
the sling which is equivalent to a tether failure (refer the schematic in Fig. 3f). The effect of each
failure event on the position of the cell is also shown in a graph in Figure 3g.
W W W. N A T U R E . C O M / N A T U R E | 2 3
SUPPLEMENTARY INFORMATION RESEARCH
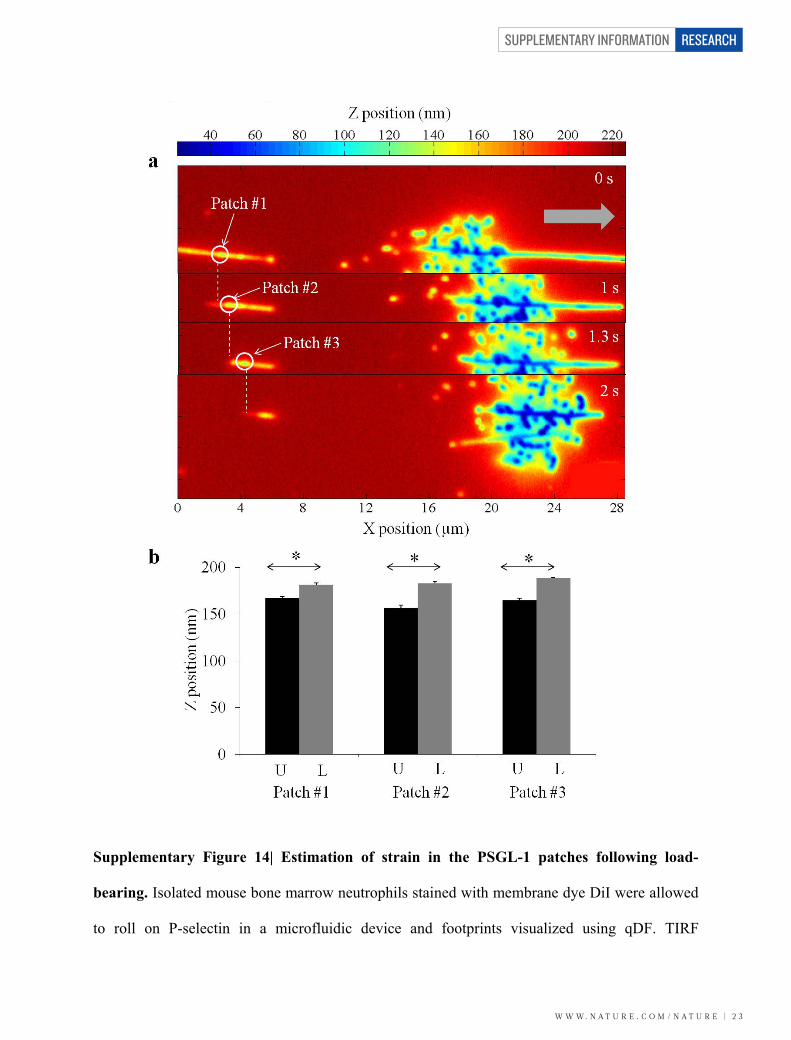
Supplementary Figure 14| Estimation of strain in the PSGL-1 patches following load-
bearing. Isolated mouse bone marrow neutrophils stained with membrane dye DiI were allowed
to roll on P-selectin in a microfluidic device and footprints visualized using qDF. TIRF

SUPPLEMENTARY INFORMATION
2 4 | W W W. N A T U R E . C O M / N A T U R E
RESEARCH
excitation 561 nm laser and incidence angle, θ = 70⁰. P-selectin 20 molecules/µm2. Wall shear
stress 10 dyn/cm2. (a) Color maps showing the z-position (30-220 nm) of the membrane from the
substrate in three PSGL-1 patches immediately before and after becoming load-bearing. Patch #1
is unloaded at 0 s (white circle) and becomes loaded at 1 s. Patch #2 is unloaded at 1 s (white
circle) and becomes loaded at 1.3 s. Patch #3 is unloaded at 1.3 s (white circle) and becomes
loaded at 2 s. The z-distance (nm) encoded by the color is defined in the color bar on top. White-
dashed vertical lines connect a patch immediately before and after becoming load-bearing. Grey
horizontal arrow denotes the direction of rolling. Refer to Methods for details. (b) Mean z-
distance from the substrate for 10x10 pixel regions containing each of the three patches in the
color maps before (U) and after (L) becoming load-bearing. ‘*’ p < 0.05. Error bars are s.e.m.
W W W. N A T U R E . C O M / N A T U R E | 2 5
SUPPLEMENTARY INFORMATION RESEARCH
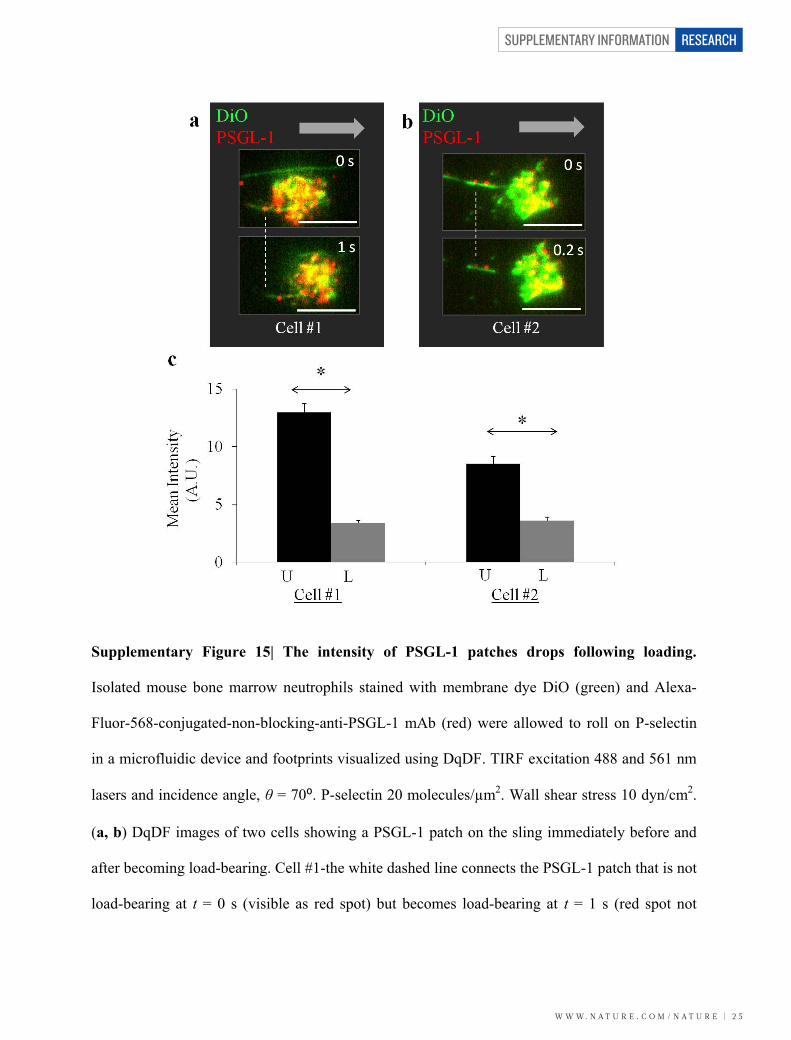
Supplementary Figure 15| The intensity of PSGL-1 patches drops following loading.
Isolated mouse bone marrow neutrophils stained with membrane dye DiO (green) and Alexa-
Fluor-568-conjugated-non-blocking-anti-PSGL-1 mAb (red) were allowed to roll on P-selectin
in a microfluidic device and footprints visualized using DqDF. TIRF excitation 488 and 561 nm
lasers and incidence angle, θ = 70⁰. P-selectin 20 molecules/µm2. Wall shear stress 10 dyn/cm2.
(a, b) DqDF images of two cells showing a PSGL-1 patch on the sling immediately before and
after becoming load-bearing. Cell #1-the white dashed line connects the PSGL-1 patch that is not
load-bearing at t = 0 s (visible as red spot) but becomes load-bearing at t = 1 s (red spot not

SUPPLEMENTARY INFORMATION
2 6 | W W W. N A T U R E . C O M / N A T U R E
RESEARCH
visible). Cell #2-the white dashed line connects the PSGL-1 patch that is not load-bearing at t = 0
s (visible as red spot) but becomes load-bearing at t = 0.2 s (red spot becomes less bright). Scale
bars 5 µm. Thick grey horizontal arrows denote the direction of rolling. Images processed to
reveal slings. (c) Mean pixel intensity of the red fluorescence for the PSGL-1 patches shown in a
and b. U-mean intensity when the patch is unloaded. L-mean intensity when the patch is loaded.
‘*’ p < 0.05. Error bars are s.e.m.

W W W. N A T U R E . C O M / N A T U R E | 2 7
SUPPLEMENTARY INFORMATION RESEARCH
Supplementary Figure 16| Rolling is stabilized by step-wise peeling of slings. Same
conditions as Figure 3g and Supplementary figure 13. Position of a rolling neutrophil plotted
as a function of time over a 1.2 s period of rolling. The rolling neutrophil has one sling and one
long tether referred as SL#1 and Te#1, respectively. Closed black circles denote the
experimentally measured position of the cell at different time points 0.12 s apart. Red solid line
denotes SL#1. Red closed triangle denotes failure of a PSGL-1 patch on SL#1 and also marks the
midpoint of the 0.12 s interval during which the patch fails. Red dashed arrow denotes the
lifetime of Te#1 starting from the time when the tether forms and ending when it fails. Wall
shear stress 10 dyn/cm2. P-selectin 20 molecules/µm2. Te#1 did not fail during the 1.2 s period of
rolling shown.

SUPPLEMENTARY INFORMATION
2 8 | W W W. N A T U R E . C O M / N A T U R E
RESEARCH
Supplementary Figure 17| Rolling is stabilized by step-wise peeling of slings. Same
conditions as Figure 3g and Supplementary figure 13. Position of a rolling neutrophil plotted
as a function of time over a 1.6 s period of rolling. The rolling neutrophil has one sling and two
long tethers referred as SL#1 and Te#1 and 2, respectively. Closed black circles denote the
experimentally measured position of the cell at each time point 0.2 s apart. Red solid line denotes
SL#1. Red closed triangle denotes the failure of a PSGL-1 patch on SL#1 (shown at the midpoint
of the 0.2 s interval during which the patch fails). Red-five-point-star symbol at t = 1.5 s
(midpoint of the 0.2 s interval) denotes the failure of the last PSGL-1 patch on SL#1 resulting in
complete detachment of SL#1. Red dashed arrows denote Te#1 and 2, respectively, starting from

W W W. N A T U R E . C O M / N A T U R E | 2 9
SUPPLEMENTARY INFORMATION RESEARCH
the time when the tether forms and ending when it fails (midpoint of the 0.2 s interval). Wall
shear stress 10 dyn/cm2. P-selectin 20 molecules/µm2.

SUPPLEMENTARY INFORMATION
3 0 | W W W. N A T U R E . C O M / N A T U R E
RESEARCH
Supplementary Figure 18| Slings slow down rolling leukocytes in vivo. DyLight-488-
conjugated-anti-LFA-1 mAb (green) was injected (via a catheter connected to the right carotid
artery) into WT mice and the rolling of leukocytes in cremaster venules was recorded using a
100X 1.45 NA oil immersion objective and intravital epifluorescence microscopy. Images were
processed to reveal slings and the instantaneous rolling velocity was measured for four cells over
1-1.5 s following sling detection. (a) Cell 1; cell detaches from the vessel wall at t = 1 s. (b) Cell
2. (c) Cell 3. (d) Cell 4. Red vertical arrow denotes the time when the sling becomes visible. In
all four cells, the rolling velocity decreased for 0.5-1 s following sling appearance. The time of
detection of a sling in a rolling leukocyte in intravital observations does not necessarily represent
the time of formation of the sling; the sling could have already existed before.

W W W. N A T U R E . C O M / N A T U R E | 3 1
SUPPLEMENTARY INFORMATION RESEARCH
Supplementary Figure 19| Scanning electron micrograph showing the peeling of a sling.
Isolated-mouse bone marrow neutrophils rolling on P-selectin in a microfluidic device were
fixed and visualized using scanning electron microscopy. View from top of the cell. The
inflection point of the sling is marked with a white thin arrow. Same situation as shown in step 3
of Figure 3f. Image was processed to reveal the inflection point of the peeling sling. Part of the
sling is hidden under the cell. White arrowhead marks a tether which is being pulled. Wall shear
stress 10 dyn/cm2. P-selectin 20 molecules/µm2. Thick-white vertical arrow denotes the direction
of rolling. Scale bar 5 µm.

SUPPLEMENTARY INFORMATION
3 2 | W W W. N A T U R E . C O M / N A T U R E
RESEARCH
Supplementary Figure 20| LFA-1 is expressed uniformly on the sling. Isolated mouse bone
marrow neutrophils stained with membrane dye DiI (red) and DyLight-488-conjugated-anti-
mouse-LFA-1 mAb (green) were allowed to roll on P-selectin in a microfluidic device and
footprints visualized using DqDF. Top row-dual color footprint of a bone marrow neutrophil
from a WT mouse rolling on P-selectin showing membrane (red) and LFA-1 (green).
Corresponding single color images of LFA-1 (green) and membrane (red) are shown in the
second and third row, respectively. Refer to Supplementary movie 9 for dual color time series
of the same cell. TIRF excitation 488 and 561 nm lasers and θ = 70⁰. Wall shear stress 10
dyn/cm2. P-selectin 20 molecules/µm2. Thick-grey arrow denotes the direction of rolling. Sling
marked with white solid arrow. Tether anchorage point marked with white arrowhead. Scale bars
5 µm.

W W W. N A T U R E . C O M / N A T U R E | 3 3
SUPPLEMENTARY INFORMATION RESEARCH
Supplementary Figure 21| LFA-1 is expressed over the entire length of slings. Mouse bone
marrow neutrophils stained with only Dylight-488-conjugated-anti-LFA-1 mAb (green) were
allowed to roll on P-selectin and footprints visualized using qDF. TIRF excitation 488 nm laser
and incidence angle θ = 70⁰. qDF footprint of a rolling neutrophil at different time points reveals
LFA-1 expression on sling (green; marked with white arrow at t = 1 and 2 s), tether anchorage
points (marked with white arrowhead at t = 1 and 2 s), and cell surface. Wall shear stress 10
dyn/cm2. P-selectin 20 molecules/µm2. Thick-grey horizontal arrow denotes the direction of
rolling. Scale bars 5 µm.
SUPPLEMENTARY INFORMATION
3 4 | W W W. N A T U R E . C O M / N A T U R E
RESEARCH
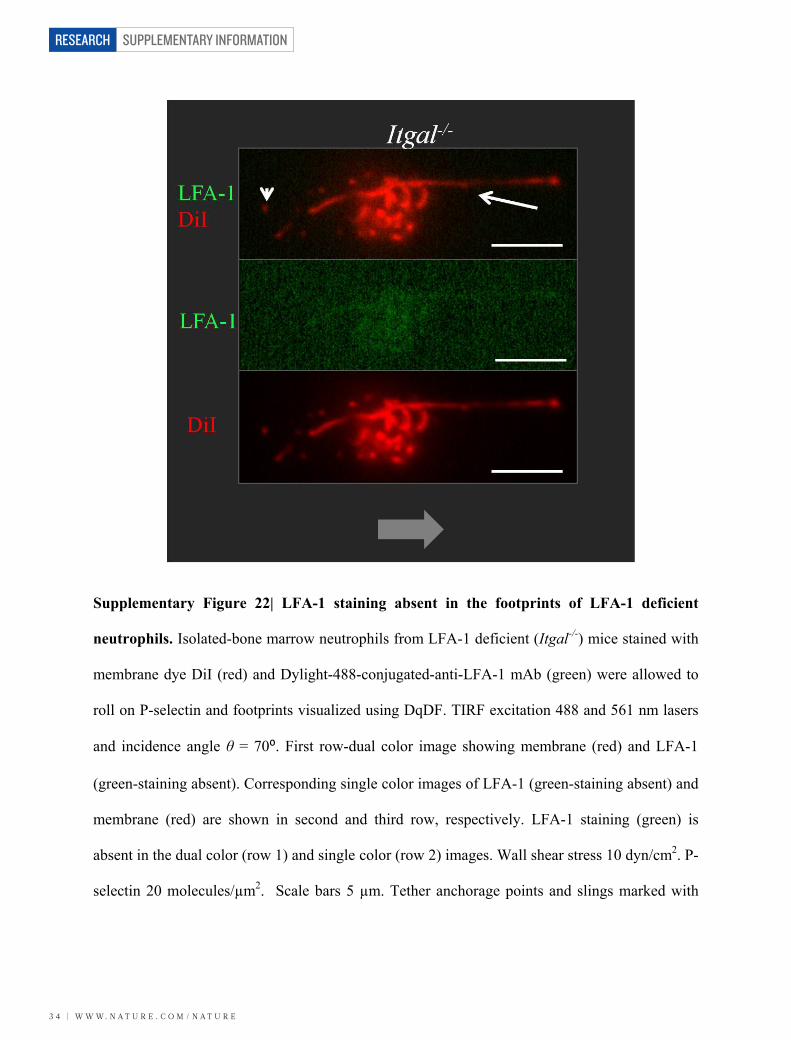
Supplementary Figure 22| LFA-1 staining absent in the footprints of LFA-1 deficient
neutrophils. Isolated-bone marrow neutrophils from LFA-1 deficient (Itgal-/-) mice stained with
membrane dye DiI (red) and Dylight-488-conjugated-anti-LFA-1 mAb (green) were allowed to
roll on P-selectin and footprints visualized using DqDF. TIRF excitation 488 and 561 nm lasers
and incidence angle θ = 70⁰. First row-dual color image showing membrane (red) and LFA-1
(green-staining absent). Corresponding single color images of LFA-1 (green-staining absent) and
membrane (red) are shown in second and third row, respectively. LFA-1 staining (green) is
absent in the dual color (row 1) and single color (row 2) images. Wall shear stress 10 dyn/cm2. P-
selectin 20 molecules/µm2. Scale bars 5 µm. Tether anchorage points and slings marked with

W W W. N A T U R E . C O M / N A T U R E | 3 5
SUPPLEMENTARY INFORMATION RESEARCH
white arrowheads and white arrows, respectively. Thick-grey horizontal arrow denotes the
direction of rolling.
SUPPLEMENTARY INFORMATION
3 6 | W W W. N A T U R E . C O M / N A T U R E
RESEARCH
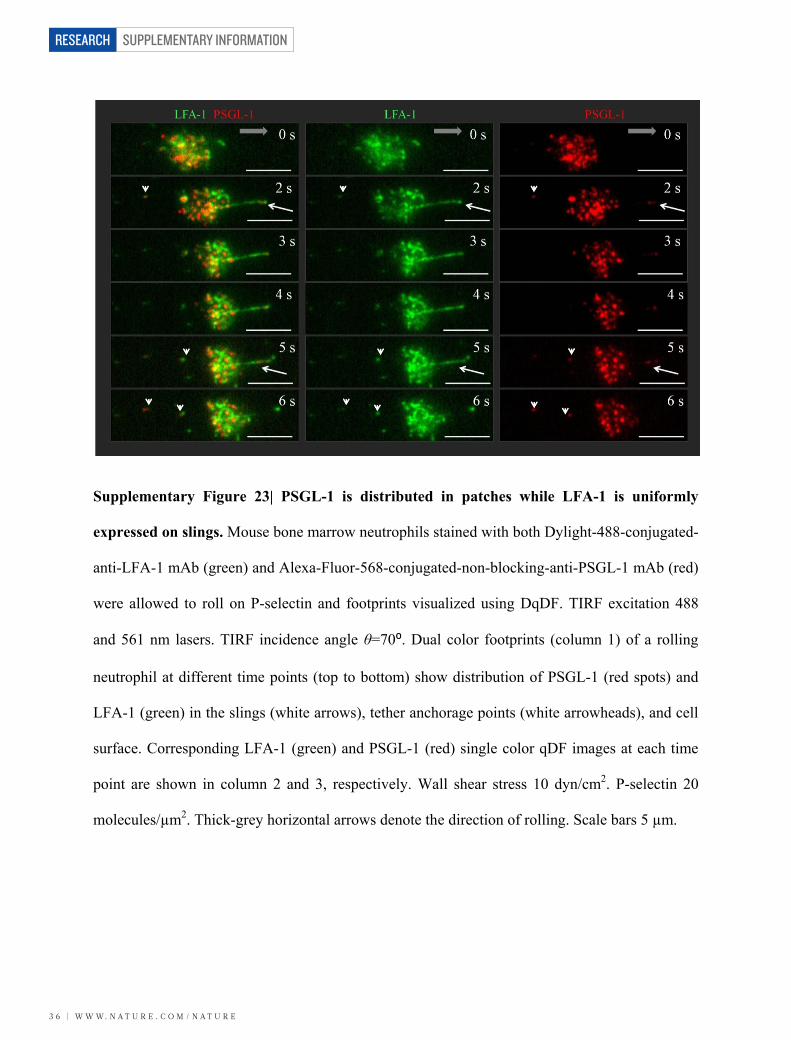
Supplementary Figure 23| PSGL-1 is distributed in patches while LFA-1 is uniformly
expressed on slings. Mouse bone marrow neutrophils stained with both Dylight-488-conjugated-
anti-LFA-1 mAb (green) and Alexa-Fluor-568-conjugated-non-blocking-anti-PSGL-1 mAb (red)
were allowed to roll on P-selectin and footprints visualized using DqDF. TIRF excitation 488
and 561 nm lasers. TIRF incidence angle θ=70⁰. Dual color footprints (column 1) of a rolling
neutrophil at different time points (top to bottom) show distribution of PSGL-1 (red spots) and
LFA-1 (green) in the slings (white arrows), tether anchorage points (white arrowheads), and cell
surface. Corresponding LFA-1 (green) and PSGL-1 (red) single color qDF images at each time
point are shown in column 2 and 3, respectively. Wall shear stress 10 dyn/cm2. P-selectin 20
molecules/µm2. Thick-grey horizontal arrows denote the direction of rolling. Scale bars 5 µm.

W W W. N A T U R E . C O M / N A T U R E | 3 7
SUPPLEMENTARY INFORMATION RESEARCH
Supplementary Figure 24| Nature of PSGL-1 and LFA-1 expression on slings is
independent of the choice of fluorochrome. The experiment shown in Supplementary figure
23 was repeated with the two fluorochromes swapped between PSGL-1 and LFA-1. Mouse bone
marrow neutrophils stained with both Alexa-Fluor-568-conjugated-anti-LFA-1 mAb (red) and
DyLight-488-conjugated-non-blocking-anti-PSGL-1 mAb (green) were allowed to roll on P-
selectin and footprints visualized using DqDF. Three different cells are shown. Top row- Dual
color image showing LFA-1 (red), PSGL-1 (green) and colocalization (yellow). Corresponding
single color images of LFA-1 (red) and PSGL-1 (green) are shown in second and third row,
respectively. Slings are marked with white solid arrows. TIRF excitation 488 and 561 nm lasers.
TIRF incidence angle θ=70⁰. Wall shear stress 10 dyn/cm2. P-selectin 20 molecules/µm2. Thick-
grey horizontal arrow denotes the direction of rolling. Scale bars 5 µm.
SUPPLEMENTARY INFORMATION
3 8 | W W W. N A T U R E . C O M / N A T U R E
RESEARCH
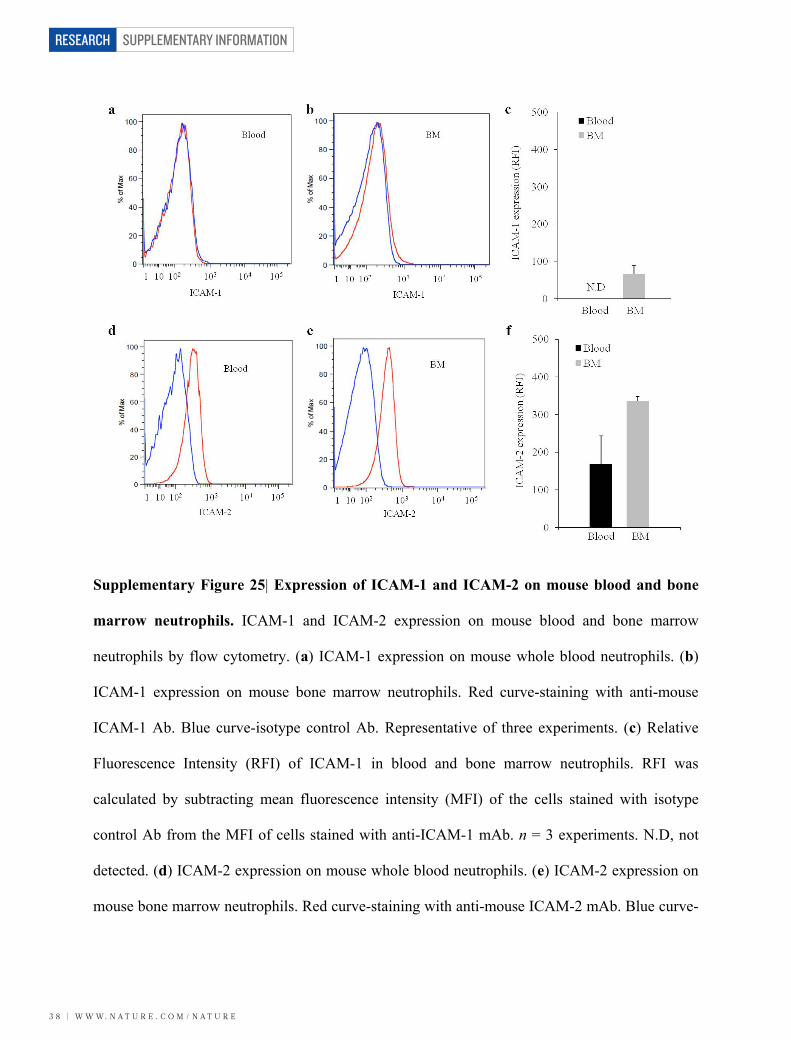
Supplementary Figure 25| Expression of ICAM-1 and ICAM-2 on mouse blood and bone
marrow neutrophils. ICAM-1 and ICAM-2 expression on mouse blood and bone marrow
neutrophils by flow cytometry. (a) ICAM-1 expression on mouse whole blood neutrophils. (b)
ICAM-1 expression on mouse bone marrow neutrophils. Red curve-staining with anti-mouse
ICAM-1 Ab. Blue curve-isotype control Ab. Representative of three experiments. (c) Relative
Fluorescence Intensity (RFI) of ICAM-1 in blood and bone marrow neutrophils. RFI was
calculated by subtracting mean fluorescence intensity (MFI) of the cells stained with isotype
control Ab from the MFI of cells stained with anti-ICAM-1 mAb. n = 3 experiments. N.D, not
detected. (d) ICAM-2 expression on mouse whole blood neutrophils. (e) ICAM-2 expression on
mouse bone marrow neutrophils. Red curve-staining with anti-mouse ICAM-2 mAb. Blue curve-

W W W. N A T U R E . C O M / N A T U R E | 3 9
SUPPLEMENTARY INFORMATION RESEARCH
isotype control Ab. Representative of three experiments. (f) RFI of ICAM-2 in blood and bone
marrow neutrophils. RFI was calculated by subtracting MFI of the cells stained with isotype
control Ab from the MFI of cells stained with anti-ICAM-2 mAb. n = 3 experiments. BM, bone
marrow. Error bars are s.d.
SUPPLEMENTARY INFORMATION
4 0 | W W W. N A T U R E . C O M / N A T U R E
RESEARCH
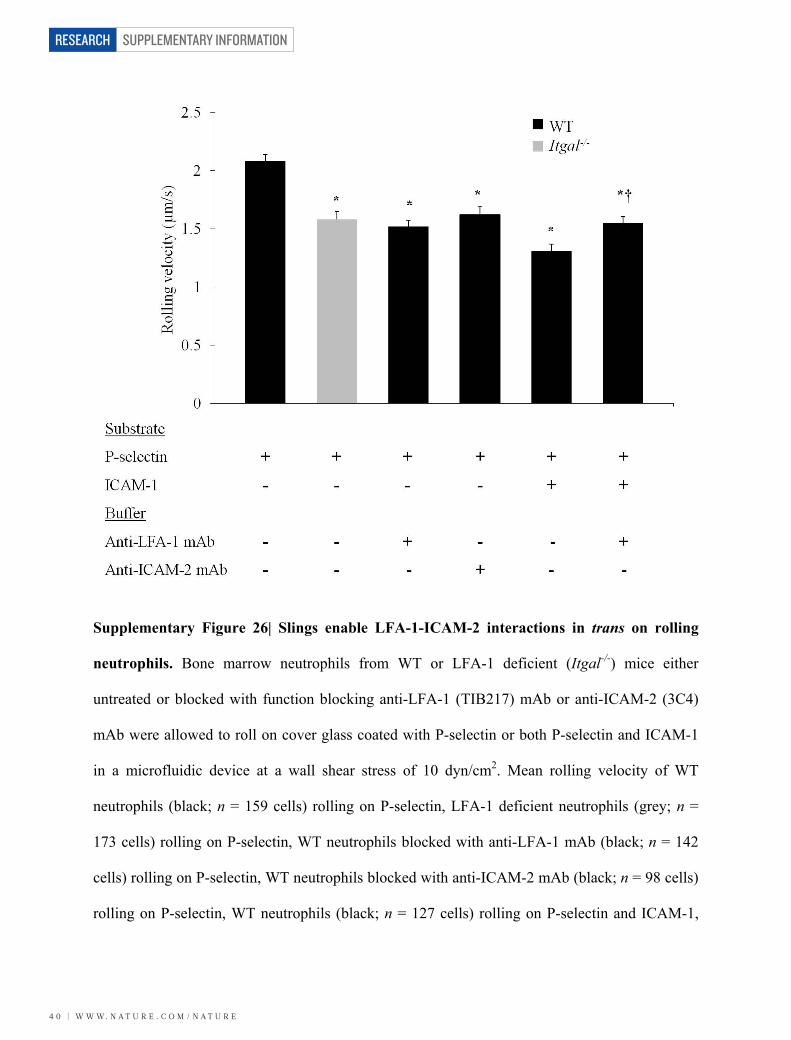
Supplementary Figure 26| Slings enable LFA-1-ICAM-2 interactions in trans on rolling
neutrophils. Bone marrow neutrophils from WT or LFA-1 deficient (Itgal-/-) mice either
untreated or blocked with function blocking anti-LFA-1 (TIB217) mAb or anti-ICAM-2 (3C4)
mAb were allowed to roll on cover glass coated with P-selectin or both P-selectin and ICAM-1
in a microfluidic device at a wall shear stress of 10 dyn/cm2. Mean rolling velocity of WT
neutrophils (black; n = 159 cells) rolling on P-selectin, LFA-1 deficient neutrophils (grey; n =
173 cells) rolling on P-selectin, WT neutrophils blocked with anti-LFA-1 mAb (black; n = 142
cells) rolling on P-selectin, WT neutrophils blocked with anti-ICAM-2 mAb (black; n = 98 cells)
rolling on P-selectin, WT neutrophils (black; n = 127 cells) rolling on P-selectin and ICAM-1,

W W W. N A T U R E . C O M / N A T U R E | 4 1
SUPPLEMENTARY INFORMATION RESEARCH
and WT neutrophils blocked with anti-LFA-1 mAb (black; n = 146 cells) rolling on P-selectin
and ICAM-1. P-selectin 20 molecules/µm2. ‘*’ p < 0.01 relative to WT neutrophils without any
blocking on P-selectin. ‘†’ p < 0.05 relative to WT neutrophils without any blocking on P-
selectin and ICAM-1. Error bars are s.e.m.

SUPPLEMENTARY INFORMATION
4 2 | W W W. N A T U R E . C O M / N A T U R E
RESEARCH
Supplementary Figure 27| ICAM-2 minimally expressed on slings but abundant on cell
surface. Mouse bone marrow neutrophils stained with both Alexa-Fluor-568-conjugated-anti-
LFA-1 mAb (red) and Alexa-Fluor-488-conjugated-anti-ICAM-2 mAb (green) were allowed to
roll on P-selectin in a microfluidic device and footprints visualized using DqDF. First column-
sequence (top-bottom) of dual color footprints of a rolling neutrophil showing LFA-1 (red) and
ICAM-2 (green). The corresponding single color images of LFA-1 (red) and ICAM-2 (green) are
shown in column two and three, respectively. TIRF excitation 488 and 561 nm laser. TIRF
incidence angle, θ=70⁰. Wall shear stress 10 dyn/cm2. P-selectin 20 molecules/µm2. Thick-grey
horizontal arrows denote the direction of rolling. Slings are marked with white solid arrows.
Scale bars 5 µm.

W W W. N A T U R E . C O M / N A T U R E | 4 3
SUPPLEMENTARY INFORMATION RESEARCH
Supplementary Figure 28| Specificity of ICAM-2 staining on rolling neutrophils. Isolated-
bone marrow neutrophils from WT mice stained with both Alexa-Fluor-568-conjugated-anti-
LFA-1 mAb (red) and Alexa-Fluor-488-Rat-IgG2aκ Ab (green; isotype matched control Ab for
Alexa-Fluor-488-anti-ICAM-2 mAb) were allowed to roll on P-selectin in a microfluidic device
and footprints visualized using DqDF. Top row-dual color footprint. Single color footprints are
shown in second and third row, respectively. LFA-1 (red) visible in dual color (top row) and
single color (middle row). Green staining absent in dual color image (top row) and single color
image (bottom row). TIRF excitation 488 and 561 nm laser. TIRF incidence angle, θ=70⁰. Wall
shear stress 10 dyn/cm2. P-selectin 20 molecules/µm2. Thick-grey horizontal arrow denotes the
direction of rolling. Slings are marked with white solid arrows. Scale bars 5 µm.

SUPPLEMENTARY INFORMATION
4 4 | W W W. N A T U R E . C O M / N A T U R E
RESEARCH
SUPPLEMENTARY NOTES Supplementary Note 1| Slings appear bright in qDF, suggesting that they are very close to the
substrate. Analysis of 7 slings shows that the average minimum distance of a sling from the
substrate is 89 ± 37 (s.d.) nm, which is similar to the resting length of the P-selectin-PSGL-1
bond (~70 nm42-44). To obtain a high resolution top view of rolling neutrophils, we fixed cells
while rolling in the microfluidic channels, keeping track of the flow direction, and subjected
them to scanning electron microscopy. Based on the SEMs, the slings were found to have an
average diameter of 209 ± 6 (s.e.m.; n = 9) nm.
42. Patel, K.D., Nollert, M.U. & McEver, R.P. P-selectin must extend a sufficient length
from the plasma membrane to mediate rolling of neutrophils. Journal of Cell Biology
131, 1893-1902 (1995).
43. Pospieszalska, M.K. & Ley, K. Dynamics of microvillus extension and tether formation
in rolling leukocytes. Cellular and Molecular Bioengineering 2, 207-217 (2009).
44. Li, F. et al. Visualization of P-selectin glycoprotein ligand-1 as a highly extended
molecule and mapping of protein epitopes for monoclonal antibodies. Journal of
Biological Chemistry 271, 6342-6348 (1996).

W W W. N A T U R E . C O M / N A T U R E | 4 5
SUPPLEMENTARY INFORMATION RESEARCH
Supplementary Note 2| Slings were rarely observed at 4 dyn/cm2. In vitro cultured endothelial
cells have been shown25,26 to express P-selectin at a molecular density of 10-50 molecules/µm2,
which formed the base for our choice of 20 molecules/µm2 in this study. At 10 and 20
molecules/µm2, we observed that 80% of rolling neutrophils formed slings at a wall shear stress
of 10 dyn/cm2 (no stable rolling was observed on P-selectin molecular density below 10
molecules/µm2).

SUPPLEMENTARY INFORMATION
4 6 | W W W. N A T U R E . C O M / N A T U R E
RESEARCH
Supplementary Note 3| In order to test whether formation of slings is associated with stabilized
rolling at high shear stress, we tested the ability of mouse naïve CD4T cells to roll on
immobilized PNAd (ligand for L-selectin15) in a microfluidic device. Rolling naïve CD4T cells
did not form long tethers or slings and could not roll at shear stress higher than 2 dyn/cm2
(Supplementary fig. 4). However, CD4T cells differentiated into Th1 cells27 formed tethers at
the rear and slings in the front and were able to roll on P-selectin at a shear stress of 8 dyn/cm2
(Supplementary fig. 5).

W W W. N A T U R E . C O M / N A T U R E | 4 7
SUPPLEMENTARY INFORMATION RESEARCH
Supplementary Note 4| Sling wrapping is less tight and allows for a longer (more favorable)
lever arm when LFA-1 does not interact with ICAM-2. We think that this effect is normally
masked by the (stronger) reduction in rolling velocity afforded by extended LFA-1 with ICAM-2
on endothelial cells. ICAM-2 is known to be constitutively expressed on endothelial cells21.

SUPPLEMENTARY INFORMATION
4 8 | W W W. N A T U R E . C O M / N A T U R E
RESEARCH
LEGENDS FOR SUPPLEMENTARY MOVIES
Supplementary Movie 1| Slings formed by DiI-stained mouse bone marrow neutrophil rolling
on P-selectin. Image processed to reveal slings. TIRF excitation 561 nm, incidence angle θ =
70⁰. P-selectin 20 molecules/µm2. Wall shear stress 10 dyn/cm2. View from the bottom. Frame
rate 5 s-1.
Supplementary Movie 2| Sling formed by an EGFP neutrophil rolling on P-selectin in whole
blood of Lyz2-EGFP mouse. Image processed to reveal sling. TIRF excitation 488 nm, incidence
angle θ = 70⁰. P-selectin 20 molecules/µm2. Wall shear stress 8 dyn/cm2. View from the bottom.
Frame rate 2 s-1.
Supplementary Movie 3| Wrapping of slings around a DiI-stained mouse bone marrow
neutrophil rolling on P-selectin. TIRF excitation 561 nm, incidence angle θ = 70⁰. P-selectin 20
molecules/µm2. Wall shear stress 10 dyn/cm2. View from the bottom. Frame rate 8 s-1.
Supplementary Movie 4| Wrapping of sling by a leukocyte rolling in the cremaster venule of a
WT mouse. Image processed to reveal sling. Cell stained with DyLight-488-anti-LFA-1 mAb
(green). View from side of the vessel. Straight lines denote vessel walls. Frame rate 1 s-1.
Supplementary Movie 5| Sling formation by a leukocyte rolling in the cremaster venule of a
WT mouse. Image processed to reveal sling. Cell stained with DyLight-488-anti-LFA-1 mAb
(green). View from top of the vessel. Straight lines denote vessel walls. Frame rate 1 s-1.
Supplementary Movie 6| Tether (arrowhead) swings over to become a sling (arrow). DiI-
stained mouse bone marrow neutrophil rolling on P-selectin. Image processed to reveal sling.

W W W. N A T U R E . C O M / N A T U R E | 4 9
SUPPLEMENTARY INFORMATION RESEARCH
TIRF excitation 561 nm, θ = 70⁰. P-selectin 20 molecules/µm2. Wall shear stress 10 dyn/cm2.
View from the bottom. Frame rate 2 s-1.
Supplementary Movie 7| Tether (arrowhead) swings over to become a sling (arrow). WT mouse
bone marrow neutrophil rolling on P-selectin. DIC microscopy. P-selectin 20 molecules/µm2.
Wall shear stress 10 dyn/cm2. View from the bottom. Frame rate 4 s-1.
Supplementary Movie 8| Step-wise peeling of a sling. PSGL-1 patches (red spots) visible on
sling (green). TIRF excitation 561 and 488 nm, incidence angle θ = 70⁰. P-selectin 20
molecules/µm2. Wall shear stress 10 dyn/cm2. View from the bottom. Frame rate 5 s-1.
Supplementary Movie 9| Staining of LFA-1 on a rolling neutrophil. Membrane (red) and LFA-1
(green). TIRF excitation 561 and 488 nm, incidence angle θ = 70⁰. P-selectin 20 molecules/µm2.
Wall shear stress 10 dyn/cm2. View from the bottom. Frame rate 3 s-1.