supplemental information -...
TRANSCRIPT
Supplemental Information
Performance of human fecal anaerobe-associated PCR-based assays in a multi-laboratory method evaluation study
Blythe A. Layton, Yiping Cao, Darcy L. Ebentier, Kaitlyn Hanley, Elisenda Ballesté, João Brandão, Muruleedhara Byappanahalli, Reagan Converse, Andreas H. Farnleitner, Jennifer
Gentry-Shields, Maribeth L. Gidley, Michèle Gourmelon, Chang Soo Lee, Jiyoung Lee, Solen Lozach, Tania Madi, Wim G. Meijer, Rachel Noble, Lindsay Peed, Georg H. Reischer, Raquel Rodrigues, Joan B. Rose, Alexander Schriewer, Chris Sinigalliano, Sangeetha Srinivasan, Jill
Stewart, Laurie C. Van De Werfhorst, Dan Wang, Richard Whitman, Stefan Wuertz, Jenny Jay, Patricia A. Holden, Alexandria B. Boehm, Orin Shanks and John F. Griffith
1. Standard Operating Procedures (SOPs) used by “core” SIPP laboratories
1.1. Five laboratories involved in planning the SIPP study (SCCWRP, Stanford University,
UC Santa Barbara, UCLA, and US EPA/Shanks, collectively known as the “core” labs)
agreed to standardize their protocols for DNA extraction, DNA quantification, q/PCR,
and data analysis. These SOPs were shared with all participating laboratories, but
adherence to these SOPs was optional. All core labs and four “outside” laboratories used
the GeneRite DNA-EZ ST kit for DNA extraction. All core labs and eight outside
laboratories used a NanoDrop spectrophotometer for DNA quantification. Four core labs
also quantified DNA using a fluorescence-based kit (Quant-iT), but only NanoDrop data
were used in the analysis for this manuscript. Detailed protocols for q/PCR are found in
Table SI-1. Manufacturer and vendor information for q/PCR reagents are found in Table
SI-2. The SIPP SOP for using the FlashGel system to visualize conventional PCR
products is given in Section 1.2 below. Details of data analysis are described in Ebentier
et al. (this issue). Briefly, all core laboratory qPCR data (from both human and general
assays) were quantified using lab-specific standard curves. These lab-specific curves
were generated by pooling data from standard curves run on each qPCR plate, as well as
a “master” standards plate containing triplicates of four separate dilution series. The
lower limit of quantification (LLOQ, copies per reaction) was defined as the lowest
point on the standard curve for which >50% of the replicates amplified. When samples
had amplification in <3 PCR triplicates, a Cq of 40 was substituted for the non-detect
replicates and the sample mean of 3 Cq values was used to quantify the copies present in
the sample. Outside lab qPCR data were used as-is (as reported by each lab) in this
manuscript, with the exception of BLOQ samples. For outside labs that reported BLOQ
as quantified copy numbers or non-detects, a LLOQ was determined from their reported
standard curves and BLOQ samples were treated as DNQ (see also Section 2 below).
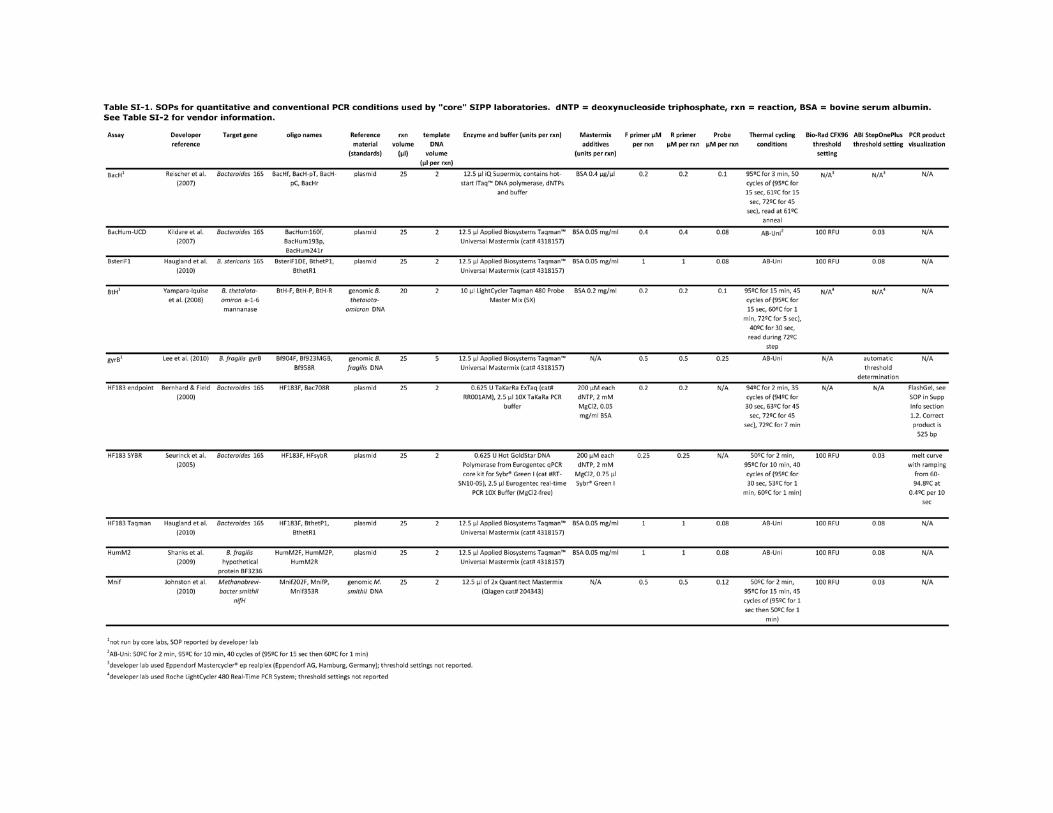
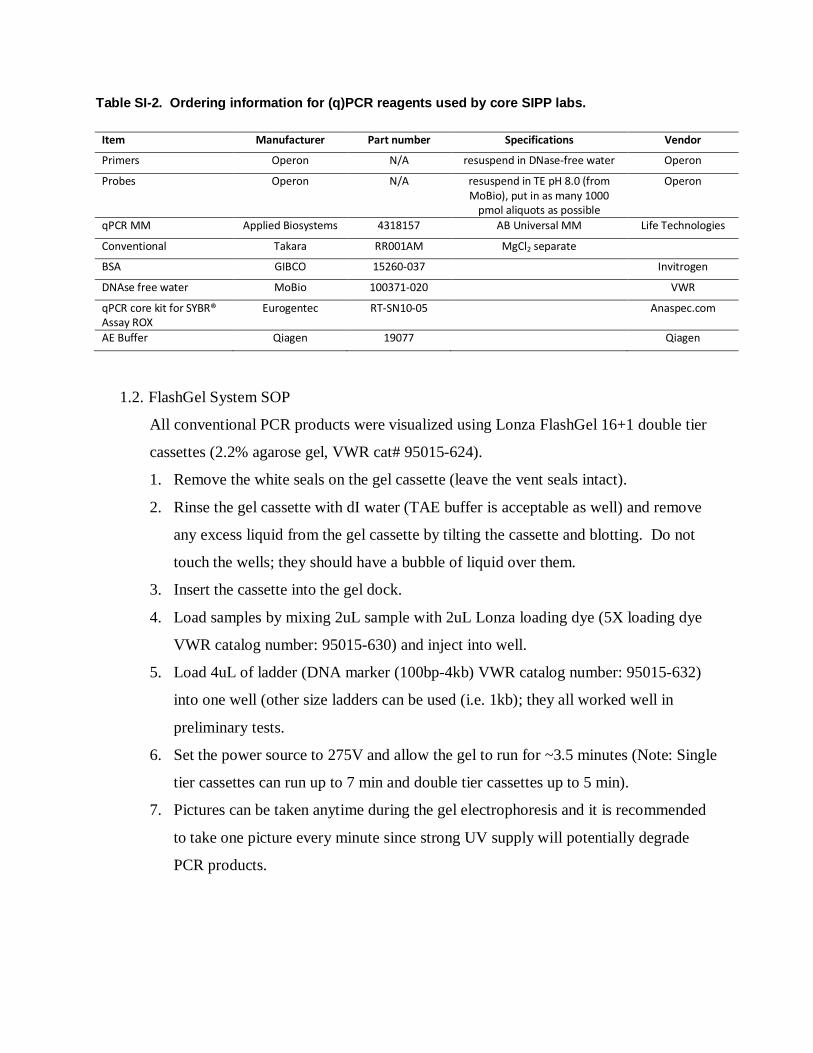
Table SI-2. Ordering information for (q)PCR reagents used by core SIPP labs.
Item Manufacturer Part number Specifications Vendor
Primers Operon N/A resuspend in DNase-free water Operon
Probes Operon N/A resuspend in TE pH 8.0 (from MoBio), put in as many 1000
pmol aliquots as possible
Operon
qPCR MM Applied Biosystems 4318157 AB Universal MM Life Technologies
Conventional Takara RR001AM MgCl2 separate
BSA GIBCO 15260-037 Invitrogen
DNAse free water MoBio 100371-020 VWR
qPCR core kit for SYBR® Assay ROX
Eurogentec RT-SN10-05 Anaspec.com
AE Buffer Qiagen 19077 Qiagen
1.2. FlashGel System SOP
All conventional PCR products were visualized using Lonza FlashGel 16+1 double tier
cassettes (2.2% agarose gel, VWR cat# 95015-624).
1. Remove the white seals on the gel cassette (leave the vent seals intact).
2. Rinse the gel cassette with dI water (TAE buffer is acceptable as well) and remove
any excess liquid from the gel cassette by tilting the cassette and blotting. Do not
touch the wells; they should have a bubble of liquid over them.
3. Insert the cassette into the gel dock.
4. Load samples by mixing 2uL sample with 2uL Lonza loading dye (5X loading dye
VWR catalog number: 95015-630) and inject into well.
5. Load 4uL of ladder (DNA marker (100bp-4kb) VWR catalog number: 95015-632)
into one well (other size ladders can be used (i.e. 1kb); they all worked well in
preliminary tests.
6. Set the power source to 275V and allow the gel to run for ~3.5 minutes (Note: Single
tier cassettes can run up to 7 min and double tier cassettes up to 5 min).
7. Pictures can be taken anytime during the gel electrophoresis and it is recommended
to take one picture every minute since strong UV supply will potentially degrade
PCR products.
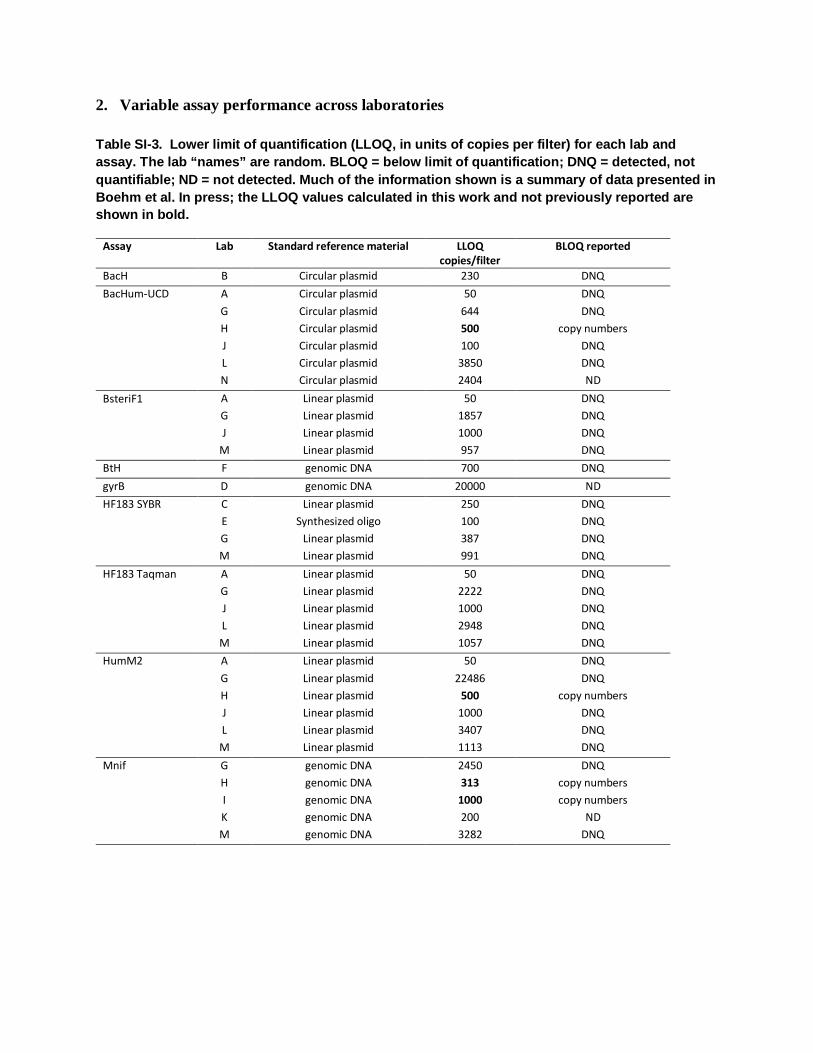
2. Variable assay performance across laboratories
Table SI-3. Lower limit of quantification (LLOQ, in units of copies per filter) for each lab and assay. The lab “names” are random. BLOQ = below limit of quantification; DNQ = detected, not quantifiable; ND = not detected. Much of the information shown is a summary of data presented in Boehm et al. In press; the LLOQ values calculated in this work and not previously reported are shown in bold.
Assay Lab Standard reference material LLOQ copies/filter
BLOQ reported
BacH B Circular plasmid 230 DNQ BacHum-UCD A Circular plasmid 50 DNQ
G Circular plasmid 644 DNQ H Circular plasmid 500 copy numbers J Circular plasmid 100 DNQ L Circular plasmid 3850 DNQ N Circular plasmid 2404 ND
BsteriF1 A Linear plasmid 50 DNQ G Linear plasmid 1857 DNQ J Linear plasmid 1000 DNQ
M Linear plasmid 957 DNQ BtH F genomic DNA 700 DNQ gyrB D genomic DNA 20000 ND HF183 SYBR C Linear plasmid 250 DNQ
E Synthesized oligo 100 DNQ G Linear plasmid 387 DNQ M Linear plasmid 991 DNQ
HF183 Taqman A Linear plasmid 50 DNQ G Linear plasmid 2222 DNQ J Linear plasmid 1000 DNQ L Linear plasmid 2948 DNQ M Linear plasmid 1057 DNQ
HumM2 A Linear plasmid 50 DNQ G Linear plasmid 22486 DNQ H Linear plasmid 500 copy numbers J Linear plasmid 1000 DNQ L Linear plasmid 3407 DNQ M Linear plasmid 1113 DNQ
Mnif G genomic DNA 2450 DNQ H genomic DNA 313 copy numbers I genomic DNA 1000 copy numbers K genomic DNA 200 ND M genomic DNA 3282 DNQ
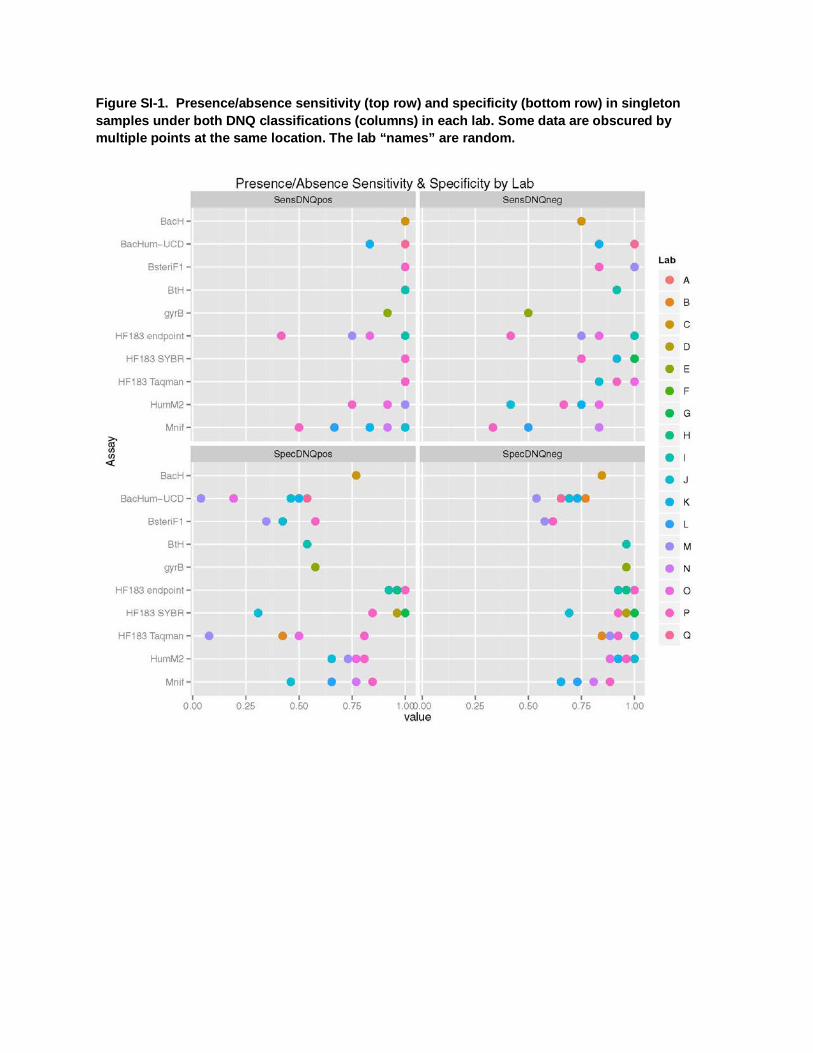
Figure SI-1. Presence/absence sensitivity (top row) and specificity (bottom row) in singleton samples under both DNQ classifications (columns) in each lab. Some data are obscured by multiple points at the same location. The lab “names” are random.
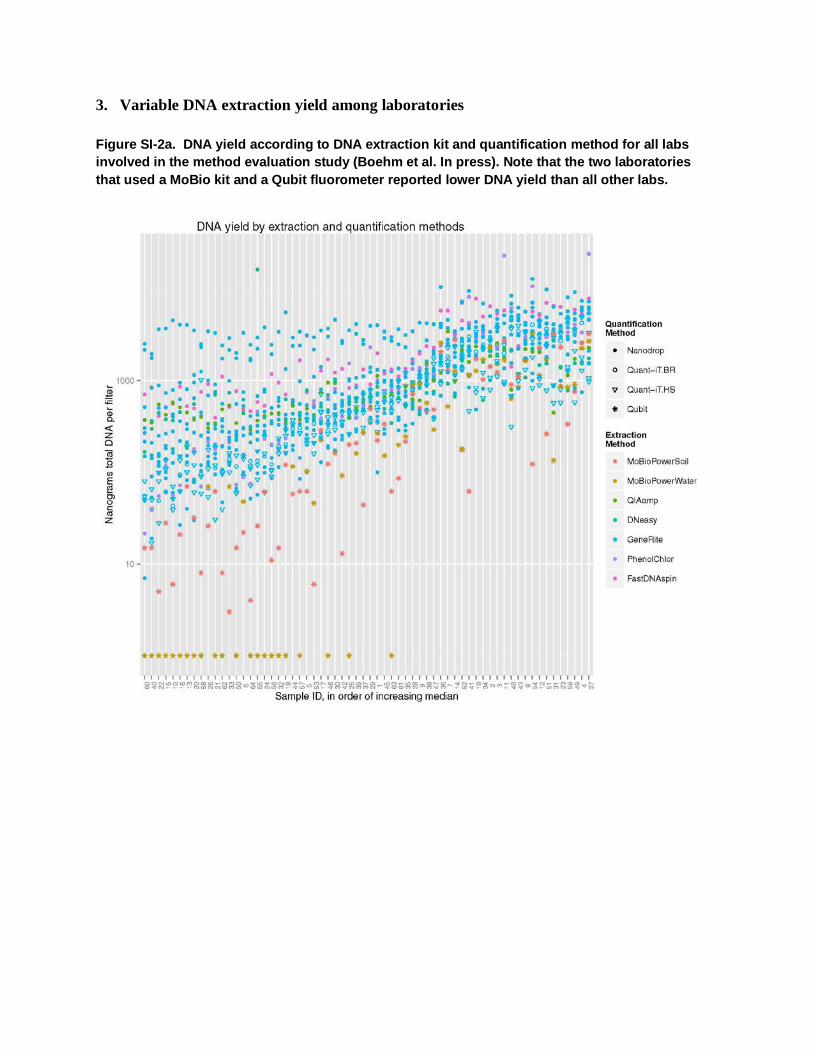
3. Variable DNA extraction yield among laboratories
Figure SI-2a. DNA yield according to DNA extraction kit and quantification method for all labs involved in the method evaluation study (Boehm et al. In press). Note that the two laboratories that used a MoBio kit and a Qubit fluorometer reported lower DNA yield than all other labs.
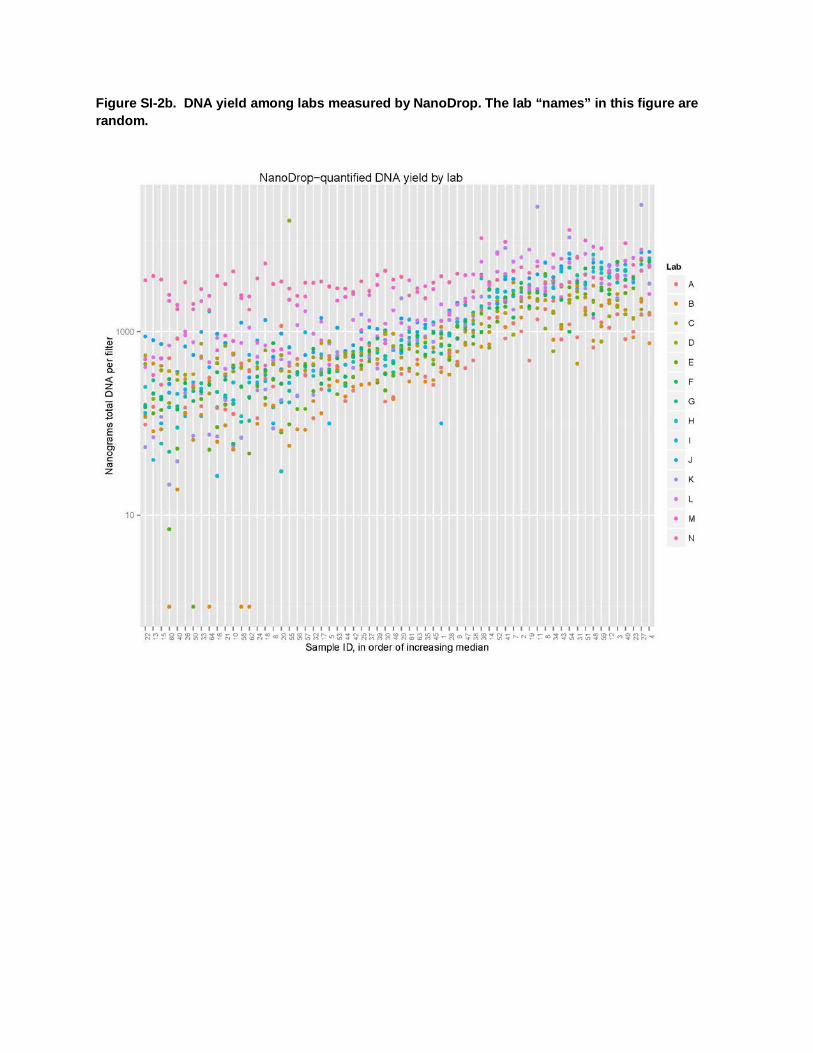
Figure SI-2b. DNA yield among labs measured by NanoDrop. The lab “names” in this figure are random.
4. Table 4 (main text) recreated with human stool and wastewater (sewage/septage) target sources considered separately
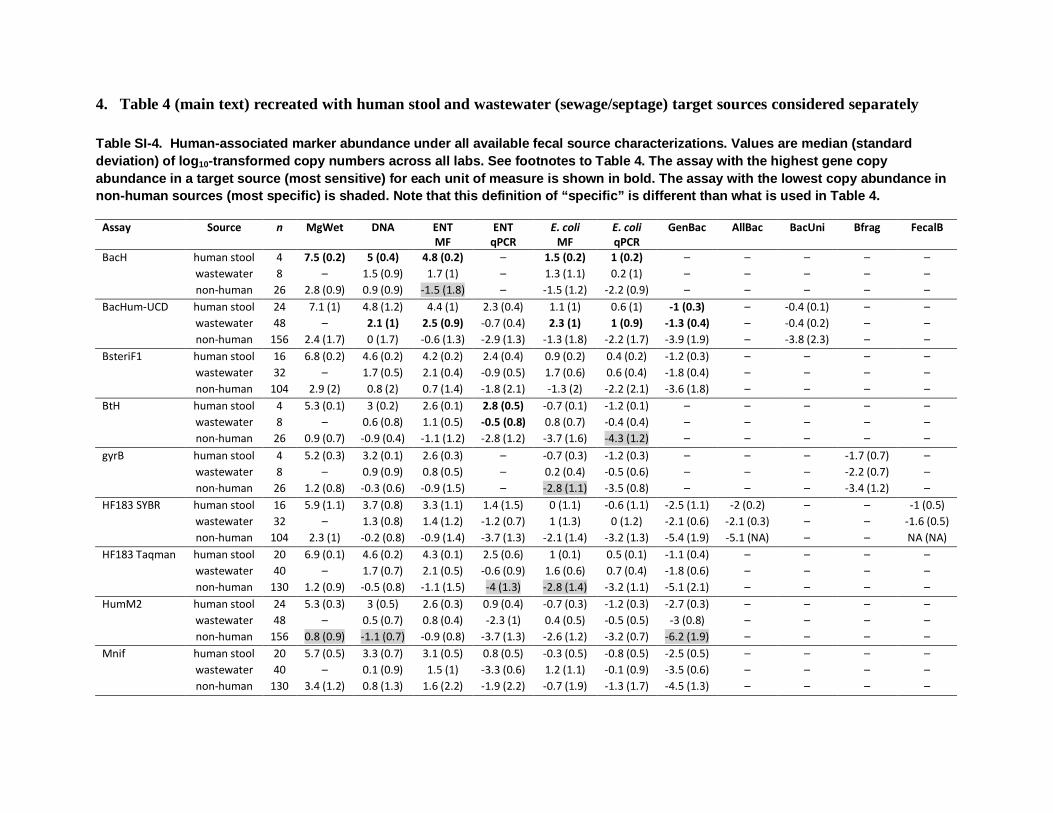
Table SI-4. Human-associated marker abundance under all available fecal source characterizations. Values are median (standard deviation) of log10-transformed copy numbers across all labs. See footnotes to Table 4. The assay with the highest gene copy abundance in a target source (most sensitive) for each unit of measure is shown in bold. The assay with the lowest copy abundance in non-human sources (most specific) is shaded. Note that this definition of “specific” is different than what is used in Table 4.
Assay Source n MgWet DNA ENT MF
ENT qPCR
E. coli MF
E. coli qPCR
GenBac AllBac BacUni Bfrag FecalB
BacH human stool 4 7.5 (0.2) 5 (0.4) 4.8 (0.2) – 1.5 (0.2) 1 (0.2) – – – – – wastewater 8 – 1.5 (0.9) 1.7 (1) – 1.3 (1.1) 0.2 (1) – – – – – non-human 26 2.8 (0.9) 0.9 (0.9) -1.5 (1.8) – -1.5 (1.2) -2.2 (0.9) – – – – –
BacHum-UCD human stool 24 7.1 (1) 4.8 (1.2) 4.4 (1) 2.3 (0.4) 1.1 (1) 0.6 (1) -1 (0.3) – -0.4 (0.1) – – wastewater 48 – 2.1 (1) 2.5 (0.9) -0.7 (0.4) 2.3 (1) 1 (0.9) -1.3 (0.4) – -0.4 (0.2) – – non-human 156 2.4 (1.7) 0 (1.7) -0.6 (1.3) -2.9 (1.3) -1.3 (1.8) -2.2 (1.7) -3.9 (1.9) – -3.8 (2.3) – –
BsteriF1 human stool 16 6.8 (0.2) 4.6 (0.2) 4.2 (0.2) 2.4 (0.4) 0.9 (0.2) 0.4 (0.2) -1.2 (0.3) – – – – wastewater 32 – 1.7 (0.5) 2.1 (0.4) -0.9 (0.5) 1.7 (0.6) 0.6 (0.4) -1.8 (0.4) – – – – non-human 104 2.9 (2) 0.8 (2) 0.7 (1.4) -1.8 (2.1) -1.3 (2) -2.2 (2.1) -3.6 (1.8) – – – –
BtH human stool 4 5.3 (0.1) 3 (0.2) 2.6 (0.1) 2.8 (0.5) -0.7 (0.1) -1.2 (0.1) – – – – – wastewater 8 – 0.6 (0.8) 1.1 (0.5) -0.5 (0.8) 0.8 (0.7) -0.4 (0.4) – – – – – non-human 26 0.9 (0.7) -0.9 (0.4) -1.1 (1.2) -2.8 (1.2) -3.7 (1.6) -4.3 (1.2) – – – – –
gyrB human stool 4 5.2 (0.3) 3.2 (0.1) 2.6 (0.3) – -0.7 (0.3) -1.2 (0.3) – – – -1.7 (0.7) – wastewater 8 – 0.9 (0.9) 0.8 (0.5) – 0.2 (0.4) -0.5 (0.6) – – – -2.2 (0.7) – non-human 26 1.2 (0.8) -0.3 (0.6) -0.9 (1.5) – -2.8 (1.1) -3.5 (0.8) – – – -3.4 (1.2) –
HF183 SYBR human stool 16 5.9 (1.1) 3.7 (0.8) 3.3 (1.1) 1.4 (1.5) 0 (1.1) -0.6 (1.1) -2.5 (1.1) -2 (0.2) – – -1 (0.5) wastewater 32 – 1.3 (0.8) 1.4 (1.2) -1.2 (0.7) 1 (1.3) 0 (1.2) -2.1 (0.6) -2.1 (0.3) – – -1.6 (0.5) non-human 104 2.3 (1) -0.2 (0.8) -0.9 (1.4) -3.7 (1.3) -2.1 (1.4) -3.2 (1.3) -5.4 (1.9) -5.1 (NA) – – NA (NA)
HF183 Taqman human stool 20 6.9 (0.1) 4.6 (0.2) 4.3 (0.1) 2.5 (0.6) 1 (0.1) 0.5 (0.1) -1.1 (0.4) – – – – wastewater 40 – 1.7 (0.7) 2.1 (0.5) -0.6 (0.9) 1.6 (0.6) 0.7 (0.4) -1.8 (0.6) – – – – non-human 130 1.2 (0.9) -0.5 (0.8) -1.1 (1.5) -4 (1.3) -2.8 (1.4) -3.2 (1.1) -5.1 (2.1) – – – –
HumM2 human stool 24 5.3 (0.3) 3 (0.5) 2.6 (0.3) 0.9 (0.4) -0.7 (0.3) -1.2 (0.3) -2.7 (0.3) – – – – wastewater 48 – 0.5 (0.7) 0.8 (0.4) -2.3 (1) 0.4 (0.5) -0.5 (0.5) -3 (0.8) – – – – non-human 156 0.8 (0.9) -1.1 (0.7) -0.9 (0.8) -3.7 (1.3) -2.6 (1.2) -3.2 (0.7) -6.2 (1.9) – – – –
Mnif human stool 20 5.7 (0.5) 3.3 (0.7) 3.1 (0.5) 0.8 (0.5) -0.3 (0.5) -0.8 (0.5) -2.5 (0.5) – – – – wastewater 40 – 0.1 (0.9) 1.5 (1) -3.3 (0.6) 1.2 (1.1) -0.1 (0.9) -3.5 (0.6) – – – – non-human 130 3.4 (1.2) 0.8 (1.3) 1.6 (2.2) -1.9 (2.2) -0.7 (1.9) -1.3 (1.7) -4.5 (1.3) – – – –
5. Abundance of general qPCR gene copies per ng total DNA
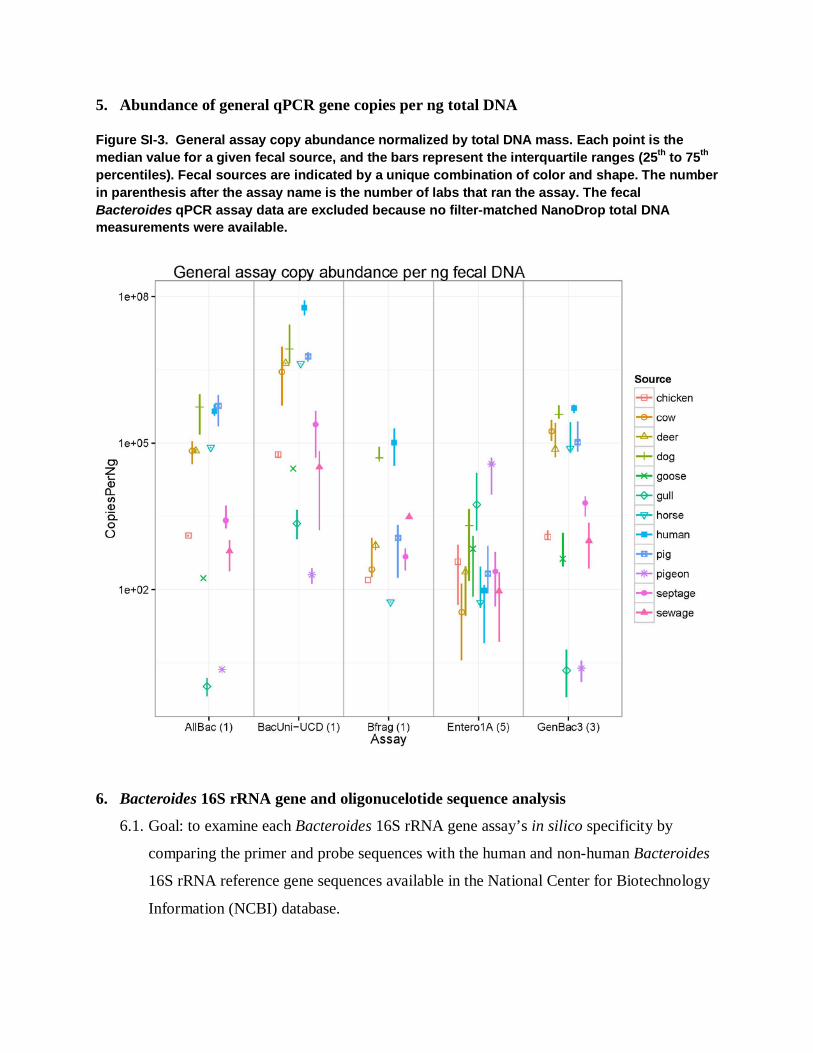
Figure SI-3. General assay copy abundance normalized by total DNA mass. Each point is the median value for a given fecal source, and the bars represent the interquartile ranges (25th to 75th percentiles). Fecal sources are indicated by a unique combination of color and shape. The number in parenthesis after the assay name is the number of labs that ran the assay. The fecal Bacteroides qPCR assay data are excluded because no filter-matched NanoDrop total DNA measurements were available.
6. Bacteroides 16S rRNA gene and oligonucelotide sequence analysis
6.1. Goal: to examine each Bacteroides 16S rRNA gene assay’s in silico specificity by
comparing the primer and probe sequences with the human and non-human Bacteroides
16S rRNA reference gene sequences available in the National Center for Biotechnology
Information (NCBI) database.
6.2. Bacteroides primer/probe sequence analysis methods
All data analyses were conducted in Geneious Pro 5.6.3 (Drummond et al. 2012). We
used sequence data available from NCBI (the Gene and Nucleotide databases, accessed
via Geneious on June 12, 2012) to examine the sequence specificity of the Bacteroides
16S rRNA gene assays. The primers and probes were aligned with 1) the reference
sequences used to develop the assays, 2) the sequences corresponding to accession
numbers reported in the assay developers’ papers and 3) 75 other human-associated
Bacteroides spp. 16S rRNA sequences, including those from fully sequenced genomes
and ATCC reference type strains. The database was also searched for non-human fecal
Bacteroides 16S rRNA sequences corresponding to the fecal sources used in the
challenge filter samples. The primers and probes were tested for specificity against the
non-human sequences, with a maximum of 2 base mismatches allowed.
6.3. Primer/probe alignment and mismatch results
The alignment of human fecal-associated Bacteroides 16S rRNA gene sequences
submitted by the assay developers’ labs with the related primers and probes reveal a fair
amount of overlap in the amplicon regions of these assays (Figure SI-4). For example,
the positions of the BacHum-UCD and forward and reverse primers are nearly identical
to the HF183 SYBR primers. Indeed, the following primer/probes overlap one another
within the same 71-bp region: BacH-pC, BacH-pT, HF183F, BacHum160f, BsteriF1DE,
BacHr, and BacHum193p (see Table SI-1 for oligo naming conventions, taken from the
original publication of the assays whenever possible). The most unique primers and
probes – those with no overlap with any other oligo in the alignment – are BacHf,
BthetP1, BthetR1, and Bac708R. While previously the Bacteroides species associated
with the HF183 marker was unknown (Bernhard and Field, 2000a), it now appears that
all of the above assays except BsteriF1 target B. dorei (Figure SI-4).
The sequence specificity of each primer and probe was tested against all available non-
human fecal-associated Bacteroides 16S rRNA gene sequences (n = 645) that
corresponded to the fecal hosts in this study. These data included sequences from cow
(n=40), chicken (65), dog (74), goose (110), gull (324), horse (19) and pig (13) hosts.
Note that no sequences were found for pigeon or deer. A maximum of two base pair
mismatches was allowed in the analysis. The BthetP1, BthetR1, HFsybR, BacHum241r
and Bac708R sequences clearly target conserved regions of the 16S gene; these oligos
had in silico binding – often without any mismatches – in the vast majority of non-
human animal sequences (summarized in Table SI-3). Thus it is the forward primers that
confer human specificity for these assays (BacHum-UCD, BsteriF1, HF183 Taqman,
HF183 SYBR and HF183 endpoint). The HF183F and BacHum160f primers matched
only one cow sequence, with two mismatches on the 3’ end. The BsteriF1 forward
primer matched one cow and one dog sequence, each with one mismatch on the 3’ end.
The BacH assay had the most specific primer/probe set according to this analysis: the
forward primer and both probes matched a few cow (n=2), dog (7) and gull (2)
sequences, while the reverse primer had no nonspecific matches at all. Accordingly,
BacH also had the least cross-reactivity to the non-human challenge samples.
Unfortunately there were not enough fecal-associated sequences in the database to
perform similar analyses for the functional gene assays (BtH, gyrB, HumM2, Mnif).
6.4. Primer/probe mismatch discussion
The most distinguishing feature of every PCR-based assay is the DNA sequences of the
primers and probes, which play an important role in the host-specificity and sensitivity
of the assay. All of the Bacteroides 16S rRNA gene-based assays in this study targeted
the exact same region of the gene – originally identified by Bernhard & Field (2000b;
2000a) – and several assays shared nearly identical primer and probe regions (Figure SI-
4). Given these similarities, one might expect the assays to perform in a similar, if not
identical fashion, but this was not quite the case. Performance differences among nearly-
identical assays can be due to annealing temperature, salt concentration, mastermix
chemistry, thermalcycler platform, and so forth. The finding that in silico the probe and
reverse primer of HF183 Taqman assay showed binding with hundreds of non-human
sequences, yet was one of the most specific assays in the study, indicates that the HF183
forward primer is robustly human-associated. The conserved nature of the reverse
primer and probe regions may also contribute to the increased sensitivity that HF183
enjoys.
While there were some parallels between the in silico sequence matching and the qPCR
results (e.g. BsteriF1 and dog), we expected to see more matches between the
oligonucleotides and non-human sequences given the number of hosts that showed
cross-reactivity. However, this analysis was limited by the number of non-human
sequences available in the NCBI database. For example, we were not able to compare
any sequences from deer. This is unfortunate, as deer was a source of false-positive
results for every assay, sometimes at levels equivalent to sewage or septage. Some
contamination was detected in a small percentage of filter blanks and sample processing
controls (see Boehm et al. In press), so it may be that the deer samples were
contaminated with a human source during the sample collection or creation process. As
such, it would have been ideal to sequence the amplicons from reactions that generated
false positive results had we had unlimited resources.
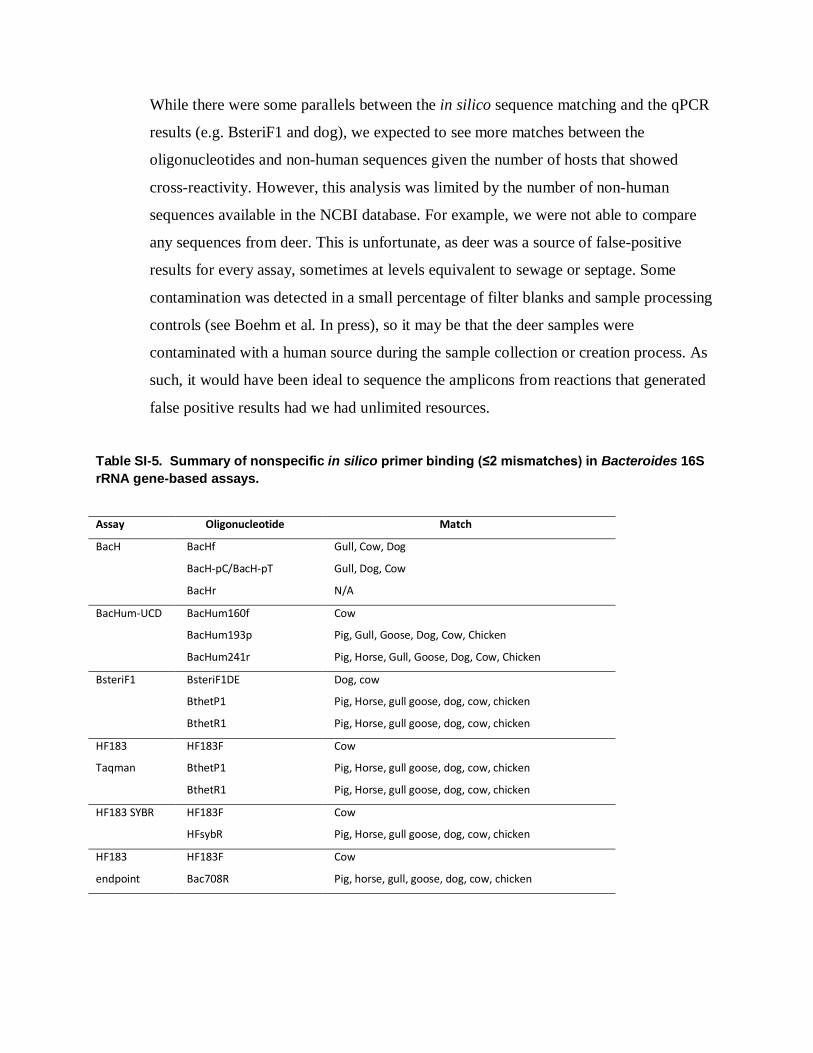
Table SI-5. Summary of nonspecific in silico primer binding (≤2 mismatches) in Bacteroides 16S rRNA gene-based assays. Assay Oligonucleotide Match
BacH BacHf Gull, Cow, Dog
BacH-pC/BacH-pT Gull, Dog, Cow
BacHr N/A
BacHum-UCD BacHum160f Cow
BacHum193p Pig, Gull, Goose, Dog, Cow, Chicken
BacHum241r Pig, Horse, Gull, Goose, Dog, Cow, Chicken
BsteriF1 BsteriF1DE Dog, cow
BthetP1 Pig, Horse, gull goose, dog, cow, chicken
BthetR1 Pig, Horse, gull goose, dog, cow, chicken
HF183
Taqman
HF183F Cow
BthetP1 Pig, Horse, gull goose, dog, cow, chicken
BthetR1 Pig, Horse, gull goose, dog, cow, chicken
HF183 SYBR HF183F Cow
HFsybR Pig, Horse, gull goose, dog, cow, chicken
HF183
endpoint
HF183F Cow
Bac708R Pig, horse, gull, goose, dog, cow, chicken
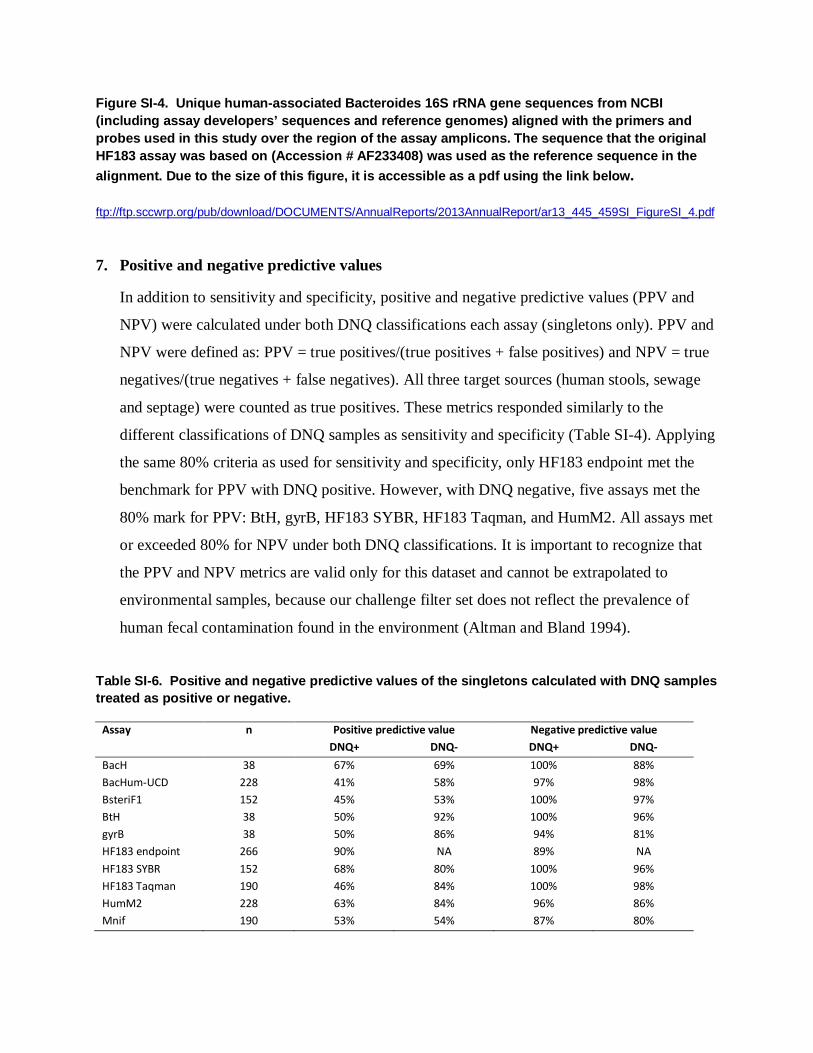
Figure SI-4. Unique human-associated Bacteroides 16S rRNA gene sequences from NCBI (including assay developers’ sequences and reference genomes) aligned with the primers and probes used in this study over the region of the assay amplicons. The sequence that the original HF183 assay was based on (Accession # AF233408) was used as the reference sequence in the alignment. Due to the size of this figure, it is accessible as a pdf using the link below. ftp://ftp.sccwrp.org/pub/download/DOCUMENTS/AnnualReports/2013AnnualReport/ar13_445_459SI_FigureSI_4.pdf 7. Positive and negative predictive values
In addition to sensitivity and specificity, positive and negative predictive values (PPV and
NPV) were calculated under both DNQ classifications each assay (singletons only). PPV and
NPV were defined as: PPV = true positives/(true positives + false positives) and NPV = true
negatives/(true negatives + false negatives). All three target sources (human stools, sewage
and septage) were counted as true positives. These metrics responded similarly to the
different classifications of DNQ samples as sensitivity and specificity (Table SI-4). Applying
the same 80% criteria as used for sensitivity and specificity, only HF183 endpoint met the
benchmark for PPV with DNQ positive. However, with DNQ negative, five assays met the
80% mark for PPV: BtH, gyrB, HF183 SYBR, HF183 Taqman, and HumM2. All assays met
or exceeded 80% for NPV under both DNQ classifications. It is important to recognize that
the PPV and NPV metrics are valid only for this dataset and cannot be extrapolated to
environmental samples, because our challenge filter set does not reflect the prevalence of
human fecal contamination found in the environment (Altman and Bland 1994).
Table SI-6. Positive and negative predictive values of the singletons calculated with DNQ samples treated as positive or negative.
Assay n Positive predictive value Negative predictive value DNQ+ DNQ- DNQ+ DNQ-
BacH 38 67% 69% 100% 88% BacHum-UCD 228 41% 58% 97% 98% BsteriF1 152 45% 53% 100% 97% BtH 38 50% 92% 100% 96% gyrB 38 50% 86% 94% 81% HF183 endpoint 266 90% NA 89% NA HF183 SYBR 152 68% 80% 100% 96% HF183 Taqman 190 46% 84% 100% 98% HumM2 228 63% 84% 96% 86% Mnif 190 53% 54% 87% 80%
8. References
Altman, D.G., Bland, J.M., 1994. Diagnostic tests 2: Predictive values. BMJ : British Medical
Journal 309 (6947), 102.
Bernhard, A.E., Field, K., 2000a. A PCR Assay To Discriminate Human and Ruminant Feces on
the Basis of Host Differences in Bacteroides-Prevotella Genes Encoding 16S rRNA.
Applied and Environmental Microbiology 66 (10), 4571–4574.
Bernhard, A.E., Field, K., 2000b. Identification of Nonpoint Sources of Fecal Pollution in
Coastal Waters by Using Host-Specific 16S Ribosomal DNA Genetic Markers from Fecal
Anaerobes. Applied and Environmental Microbiology 66 (4), 1587–1594.
Boehm, A.B., Van De Werfhorst, L.C., Griffith, J.F., Holden, P.A., Jay, J.A., Shanks, O.C.,
Wang, D., Weisberg, S.B., n.d. Performance of forty-one microbial source tracking methods:
a twenty-seven lab evaluation study. Water Research (in press).
Drummond, A.J., Ashton, B., Buxton, S., Cheung, M., Cooper, A., Duran, C., Field, M., Heled,
J., Kearse, M., Markowitz, S., Moir, R., Stones-Havas, S., Sturrock, S., Thierer, T., Wilson,
A., 2012. Geneious v5.6.
Ebentier, D.L., Hanley, K.T., Cao, Y., Badgley, B.D., Boehm, A.B., Ervin, J.S., Goodwin, K.D.,
Gourmelon, M., Griffith, J.F., Holden, P.A., Kelty, C.A., Lozach, S., McGee, C.D., Peed,
L.A., Raith, M.R., Sadowsky, M.J., Scott, E., Santo Domingo, J., Sinigalliano, C., Shanks,
O.C., Van De Werfhorst, L.C., Wang, D., Wuertz, S., Jay, J.A., n.d. Evaluation of the
repeatability and reproducibility of a suite of qPCR-based microbial source tracking
methods. Water Research (in press).