the surfer health study - sccwrpftp.sccwrp.org/.../technicalreports/943_surferhealthstudy.pdf ·...
TRANSCRIPT

SCCWRP Technical Report 943
SCCWRP
Established 1969
The Surfer Health Study
A Three-Year Study Examining Illness Rates Associated with Surfing During Wet Weather
The Surfer Health Study
A Three-Year Study Examining Illness Rates Associated with Surfing During Wet Weather
Kenneth Schiff, John Griffith, Joshua Steele Southern California Coastal Water Research Project
Benjamin Arnold, Ayse Ercumen, Jade Benjamin-Chung, John M. Colford, Jr. University of California, Berkeley
Jeff Soller Soller Environmental
Rick Wilson Surfrider Foundation
Charles McGee Orange County Sanitation District, retired
September 2016 Technical Report 943

Surfer Health Study
i
FOREWORD
This document is comprised of a summary and three stand-alone chapters: epidemiology, water quality, and quantitative microbial risk assessment. Each chapter provides an in-depth presentation of the major study elements, each linked to one another by design, and aimed to provide unbiased technical information to the environmental managers who are making difficult policy decisions about wet weather water quality and public health.
ACKNOWLEDGEMENTS
The authors are indebted to the Water Quality Management Advisory Committee (in alphabetical order):
Jonathan Bishop State Water Resources Control Board David Gibson San Diego Regional Water Quality Control Board Paul Hann State Water Resources Control Board (alternate) Keith Kezer County of San Diego, Department of Public Health (Alternate) Ruth Kolb City of San Diego, Transportation and Stormwater Department Cindy Lin US Environmental Protection Agency, Region IX Mark McPherson County of San Diego, Department of Public Health Chad Nelsen Surfrider Foundation John Ravenscroft US Environmental Protection Agency, Office of Science and Technology James Smith San Diego Regional Water Quality Control Board (alternate) Todd Snyder San Diego County Department of Environmental Health Timothy Wade US Environmental Protection Agency, Office of Research and Development JoAnn Weber San Diego County Department of Environmental Health (alternate)
Ad Hoc Members: Agnes Generoso City of San Diego, Wastewater Collection Division Peter Vroom City of San Diego, Environmental and Technical Services Particular gratitude is expressed to Cid Tesoro and David Gibson, leaders in originating the project concept.
This project was funded by the City and County of San Diego. The opinions expressed in this report are those of the authors, and the research was not directed by the funding agencies. Any use of trademarked or copyrighted material does not imply endorsement.
Surfer Health Study
ii
TABLE OF CONTENTS
Foreword ........................................................................................................................................ i
Acknowledgements ........................................................................................................................ i
Executive Summary ...................................................................................................................... 1
Background ............................................................................................................................... 1
Study Approach and Findings ................................................................................................... 2
Chapter 1: Acute Illness Associated with Ocean Exposure and Fecal Indicator Bacteria During Dry and Wet Weather: A Longitudinal Cohort Study of Surfers in San Diego, California ............. 7
Acknowledgements ................................................................................................................... 8
I. Abstract .................................................................................................................................. 9
II. Introduction ......................................................................................................................... 10
III. Methods ............................................................................................................................. 10
A. Study Setting, Design, and Enrollment ........................................................................... 10
B. Outcome Definition and Measurement ........................................................................... 14
C. Exposure Definition and Measurement .......................................................................... 14
D. Statistical Analysis .......................................................................................................... 15
IV. Results ............................................................................................................................... 19
A. Study Population ............................................................................................................. 19
B. Water Quality and Surfer Exposure ................................................................................ 19
C. Illness Associated with Ocean Exposure ........................................................................ 20
D. Illness Associated with Fecal Indicator Bacteria Levels ................................................. 24
V. Discussion .......................................................................................................................... 27
A. Key results ...................................................................................................................... 27
B. Limitations ....................................................................................................................... 27
C. Interpretation .................................................................................................................. 28
D. Conclusions .................................................................................................................... 31
VI. References ........................................................................................................................ 32
VII. Supplemental Information ................................................................................................. 35
Chapter 2: Quantification of Pathogenic Viruses and Bacteria, Host Source Markers, and Fecal Indicator Bacteria in Stormwater Discharging to Surfing Beaches in San Diego, California ....... 53
Acknowledgements ................................................................................................................. 54
I. Abstract ................................................................................................................................ 55

Surfer Health Study
iii
II. Introduction ........................................................................................................................ 56
III. Methods ............................................................................................................................. 57
A. Study Design and Water Sample Collection ................................................................... 57
B. Culture methods ............................................................................................................. 59
C. Genetic methods ............................................................................................................ 59
D. Statistical Analyses ......................................................................................................... 62
IV. Results ............................................................................................................................... 63
A. Sampling Success .......................................................................................................... 63
B. Beach FIB Concentrations .............................................................................................. 63
C. Stormwater Discharges .................................................................................................. 65
V. Discussion .......................................................................................................................... 72
VI. References ........................................................................................................................ 74
VII. Supplemental Information ................................................................................................. 77
VIII. Supplemental Investigation: Wet Weather Source Tracking Upstream in the San Diego River ........................................................................................................................................ 80
Chapter 3: Wet Weather Recreational Water Gastrointestinal Illness Risks – Quantitative Microbial Risk Assessment Harmonization with an Epidemiological Investigation ..................... 89
Acknowledgements ................................................................................................................. 90
I. Abstract ................................................................................................................................ 91
II. Introduction ......................................................................................................................... 92
III. Methods ............................................................................................................................. 93
A. QMRA Exposure Scenario .............................................................................................. 93
B. QMRA Model Parameters ............................................................................................... 94
C. Numerical simulations .................................................................................................... 97
D. Data Analysis .................................................................................................................. 98
IV. Results ............................................................................................................................... 99
A. QMRA model parameter results ..................................................................................... 99
B. QMRA Simulation Results ............................................................................................ 102
V. Discussion ........................................................................................................................ 104
VI. Conclusions ..................................................................................................................... 106
VII. References ..................................................................................................................... 107
Executive Summary Surfer Health Study
1
EXECUTIVE SUMMARY
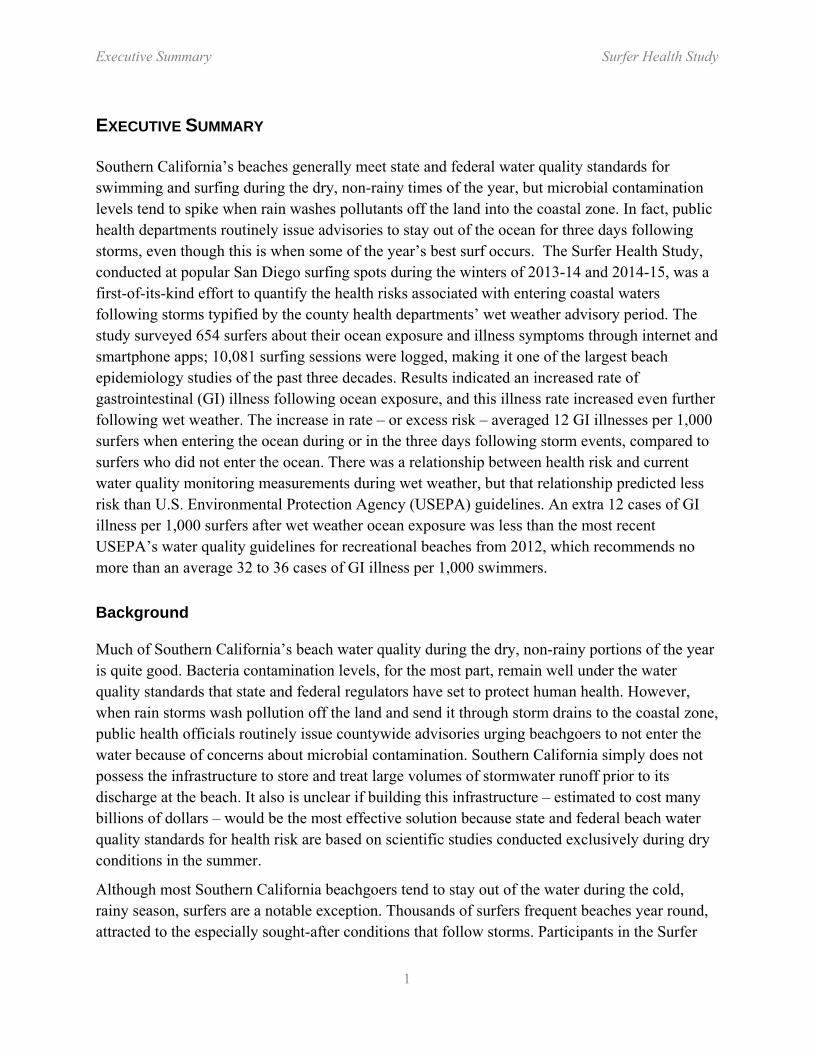
Southern California’s beaches generally meet state and federal water quality standards for swimming and surfing during the dry, non-rainy times of the year, but microbial contamination levels tend to spike when rain washes pollutants off the land into the coastal zone. In fact, public health departments routinely issue advisories to stay out of the ocean for three days following storms, even though this is when some of the year’s best surf occurs. The Surfer Health Study, conducted at popular San Diego surfing spots during the winters of 2013-14 and 2014-15, was a first-of-its-kind effort to quantify the health risks associated with entering coastal waters following storms typified by the county health departments’ wet weather advisory period. The study surveyed 654 surfers about their ocean exposure and illness symptoms through internet and smartphone apps; 10,081 surfing sessions were logged, making it one of the largest beach epidemiology studies of the past three decades. Results indicated an increased rate of gastrointestinal (GI) illness following ocean exposure, and this illness rate increased even further following wet weather. The increase in rate – or excess risk – averaged 12 GI illnesses per 1,000 surfers when entering the ocean during or in the three days following storm events, compared to surfers who did not enter the ocean. There was a relationship between health risk and current water quality monitoring measurements during wet weather, but that relationship predicted less risk than U.S. Environmental Protection Agency (USEPA) guidelines. An extra 12 cases of GI illness per 1,000 surfers after wet weather ocean exposure was less than the most recent USEPA’s water quality guidelines for recreational beaches from 2012, which recommends no more than an average 32 to 36 cases of GI illness per 1,000 swimmers.
Background
Much of Southern California’s beach water quality during the dry, non-rainy portions of the year is quite good. Bacteria contamination levels, for the most part, remain well under the water quality standards that state and federal regulators have set to protect human health. However, when rain storms wash pollution off the land and send it through storm drains to the coastal zone, public health officials routinely issue countywide advisories urging beachgoers to not enter the water because of concerns about microbial contamination. Southern California simply does not possess the infrastructure to store and treat large volumes of stormwater runoff prior to its discharge at the beach. It also is unclear if building this infrastructure – estimated to cost many billions of dollars – would be the most effective solution because state and federal beach water quality standards for health risk are based on scientific studies conducted exclusively during dry conditions in the summer.
Although most Southern California beachgoers tend to stay out of the water during the cold, rainy season, surfers are a notable exception. Thousands of surfers frequent beaches year round, attracted to the especially sought-after conditions that follow storms. Participants in the Surfer

Executive Summary Surfer Health Study
2
Health Study reflected these beach-going trends: they were just as likely to enter the ocean in wet weather as dry weather, they commonly surfed two or more times a week for at least an hour, and they nearly always dunked their heads underwater.
To alert surfers and other beachgoers to potential pathogens in coastal water, state regulators have created water-quality standards that are based on concentrations of “fecal indicator bacteria”, including Enterococcus. Enterococcus is much easier to measure than the actual pathogenic microbes that make people sick, and it almost universally co-occurs with pathogens in human sewage. The limitation of using Enterococcus, however, is that it can also come from the feces of a wide variety of other animals – dogs, cats, birds, and so forth – almost none of which contain the same level of pathogens as sewage, but all of which can get washed down storm drains to the coastal zone when it rains. Thus, the Surfer Health Study was designed to quantify the illness risk associated with entering the ocean following wet weather and document the relationship between fecal indicator bacteria such as Enterococcus, actual pathogens, and illness rates among surfers. In this way, the study illuminated not just the health risks associated with surfing in wet weather, but also evaluated existing water quality standards, providing the technical foundation for policy makers to discuss new, wet-weather-specific water quality standards.
Study Approach and Findings
The goal of the Surfer Health Study was to answer four basic questions:
• Is surfing associated with an increased rate of illness? • Are illness rates higher when surfing following wet weather compared to dry weather? • What is the association between water quality and illness following wet weather events? • What level of water quality corresponds to the same risk of illness as current water
quality objectives?
The epidemiological study used a longitudinal cohort study design, in which 654 volunteers who enrolled mostly via internet or smartphone app confidentially reported daily information on their surfing activities and the occurrence of 12 symptoms, such as gastrointestinal (GI) illness, which includes specific combinations of cramps, nausea, diarrhea, and vomiting. Surfers received a $20 gift certificate to an online surfing retailer for every four weeks of surveys they completed. Study participants collectively provided more than 33,000 days of data, including 10,081 surf sessions at beaches across San Diego County. About 13% of these surf sessions took place in wet-weather conditions, defined as days with >0.1 inch of rain and the following 72 hours, which mimics the County Public Health Officers’ official wet weather advisory.
To ascertain the relationship between illness rates and Enterococcus fecal indicator bacteria levels, researchers collected water samples at two popular San Diego surfing locations – Ocean Beach located at the mouth of the San Diego River, and Tourmaline Surfing Park at the mouth of Tourmaline Creek. Beach water was sampled daily, rain or shine. During wet weather,

Executive Summary Surfer Health Study
3
researchers also sampled flowing river and creek water, measuring not just fecal indicator bacteria levels, but also the pathogens that are responsible for illness. Although the winters of 2013-14 and 2014-15 were drought years, the region was hit with 10 storms that produced rainfall ranging from 0.1 to over 2 inches.
» Key Findings 1 & 2: There is an increased rate of gastrointestinal illness from surfing, and that rate increases following wet weather.
The study found that when surfers enter the water during or in the 72 hours following storm events, an average of 30 per 1,000 will contract GI illness, compared to 18 per 1,000 surfers who will contract GI illness without entering the water, and 25 per 1,000 who will contract GI illness when entering the water during dry weather (Figure 1). From a health risk perspective, that is an extra – or excess – risk of 12 surfers per 1,000 on average who will become ill when they enter the ocean in wet weather, compared to when they do not enter the ocean.
Figure 1. The Surfer Health Study quantified gastrointestinal (GI) illness risk among surfers during three time periods: periods when not entering the ocean (Unexposed), periods when entering the ocean during the winter at least three days after a storm event (Dry Weather Exposure), and periods when entering the ocean during or within three days of a storm event (Wet Weather Exposure). The excess health risk associated with entering the water is calculated by subtracting the risk during unexposed periods from the risk during exposed periods.
While state and federal regulations focus largely on GI illness, the Surfer Health Study also examined illness rates for six non-GI symptoms – skin rashes, open wound infections, earache/infections, sinus pain/infections, fever, and upper respiratory infections. Nearly all of the illness rates for these symptoms increased when surfers entered the ocean compared to when they didn’t go in the ocean, although not all of these symptoms can be directly related to water

Executive Summary Surfer Health Study
4
quality impairments. Cumulatively, across all infectious symptoms, there was an excess risk of 19 surfers per 1,000 on average who became ill when they entered the ocean in wet weather, compared to when they did not enter the ocean.
» Key Findings 3 & 4: There was a relationship between surfer health and water quality measurements, but that relationship predicted less risk than current USEPA guidelines.
An additional 12 cases of GI illness per 1,000 surfers during wet weather does not exceed the most recent USEPA guidance from 2012, which recommends no more than an average 32 to 36 GI illnesses per 1,000 swimmers (Figure 2).
Figure 2. Health Risk Curve (with 95% confidence intervals) showing the relationship between excess gastrointestinal illness risk per 1,000 [surfers] and concentrations of Enterococcus, a bacteria routinely measured by the Public Health Department that does not cause illness but is easier to measure than actual pathogens. The curve can translate what the concentration of Enterococcus in the ocean should be to stay below a given risk threshold, but the question of how much excess risk to allow is ultimately a policy question, not a science question.

Executive Summary Surfer Health Study
5
NEXT STEPS Local regulated and regulatory agencies now face a key policy dilemma: Should the existing water-quality standards be altered for wet-weather conditions? Under the USEPA’s 2012 guidelines, local regulatory agencies have the option to develop an alternative set of site-specific standards if supported by data. The results from the Surfer Health Study have provided the data necessary to create an analog of time-specific standards. But the question of whether existing water-quality standards are acceptable cannot be answered by science alone; setting acceptable illness risk thresholds is ultimately a public policy question.
The study team is already working with city, county, state and federal agencies to identify the sources of pathogens that are likely making surfers sick. For example, analyses of stormwater discharges from the mouths of the San Diego River and Tourmaline Creek showed the presence of human pathogens such as Norovirus, one of the most common causes of gastroenteritis in the United States. The study team is now engaged in upstream sampling in the San Diego River watershed to track these pathogens to their sources.

Executive Summary Surfer Health Study
6

Chapter 1: Epidemiology Surfer Health Study
7
CHAPTER 1: ACUTE ILLNESS ASSOCIATED WITH OCEAN EXPOSURE AND FECAL INDICATOR BACTERIA DURING DRY AND WET WEATHER: A LONGITUDINAL
COHORT STUDY OF SURFERS IN SAN DIEGO, CALIFORNIA
Benjamin F. Arnold1, Kenneth C. Schiff2, Ayse Ercumen1, Jade Benjamin-Chung1, Joshua A. Steele2, John F. Griffith2, Steven J. Steinberg2, Paul Smith2, Charles D. McGee4, Richard Wilson3, Chad Nelsen3, Stephen B. Weisberg2, and John M. Colford, Jr.1
1Division of Epidemiology, School of Public Health, University of California, Berkeley, CA 2Southern California Coastal Water Research Project, Costa Mesa, CA 3Surfrider Foundation, San Clemente, CA 4Orange County Sanitation Districts (retired)

Chapter 1: Epidemiology Surfer Health Study
8
Acknowledgements
The study was funded by the City and County of San Diego. The funders had no role in study design, data collection and analysis, decision to publish, or preparation of the manuscript. The authors are grateful to the field team members who enrolled participants at the beach and collected water samples throughout the study. The authors are also grateful to Laila Othman, Sonji Romero, Aaron Russell, Joseph Toctocan, Laralyn Asato, Zaira Valdez, and the staff at City of San Diego Marine Microbiology laboratory who generously provided laboratory space to test water specimens, and to Jeffrey Soller, Mary Schoen, and members of the study’s external advisory committee for earlier comments on the results.
Chapter 1: Epidemiology Surfer Health Study
9
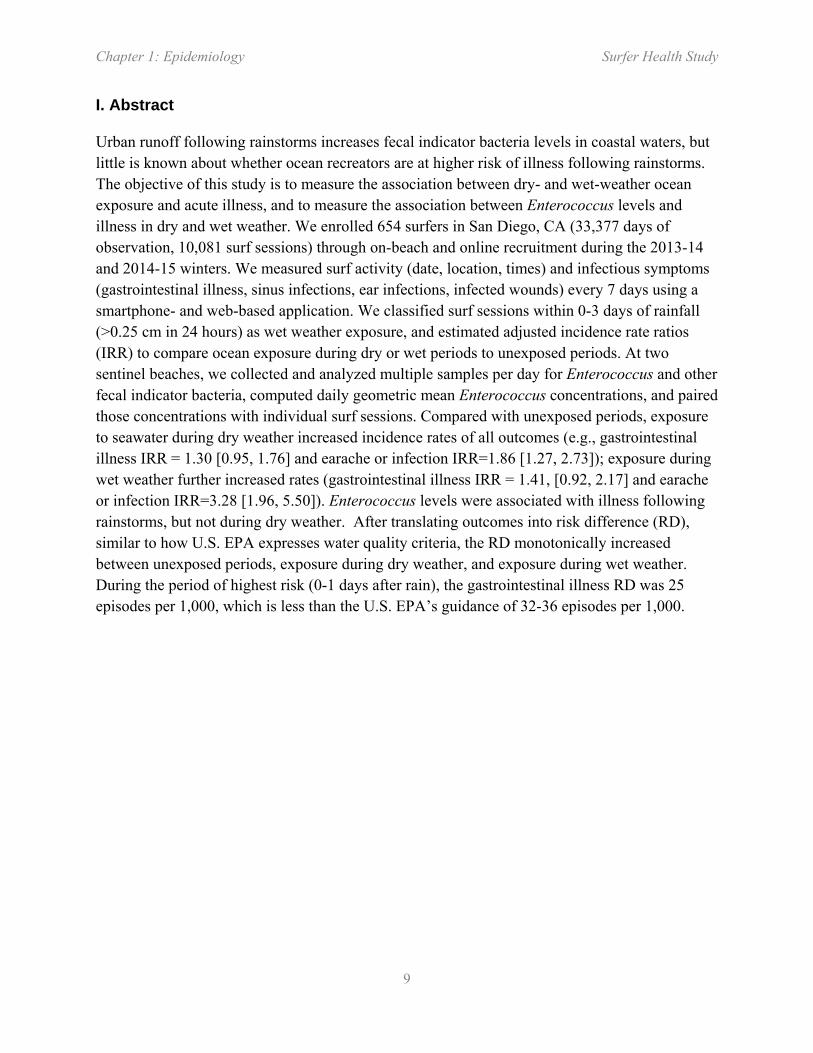
I. Abstract
Urban runoff following rainstorms increases fecal indicator bacteria levels in coastal waters, but little is known about whether ocean recreators are at higher risk of illness following rainstorms. The objective of this study is to measure the association between dry- and wet-weather ocean exposure and acute illness, and to measure the association between Enterococcus levels and illness in dry and wet weather. We enrolled 654 surfers in San Diego, CA (33,377 days of observation, 10,081 surf sessions) through on-beach and online recruitment during the 2013-14 and 2014-15 winters. We measured surf activity (date, location, times) and infectious symptoms (gastrointestinal illness, sinus infections, ear infections, infected wounds) every 7 days using a smartphone- and web-based application. We classified surf sessions within 0-3 days of rainfall (>0.25 cm in 24 hours) as wet weather exposure, and estimated adjusted incidence rate ratios (IRR) to compare ocean exposure during dry or wet periods to unexposed periods. At two sentinel beaches, we collected and analyzed multiple samples per day for Enterococcus and other fecal indicator bacteria, computed daily geometric mean Enterococcus concentrations, and paired those concentrations with individual surf sessions. Compared with unexposed periods, exposure to seawater during dry weather increased incidence rates of all outcomes (e.g., gastrointestinal illness IRR = 1.30 [0.95, 1.76] and earache or infection IRR=1.86 [1.27, 2.73]); exposure during wet weather further increased rates (gastrointestinal illness IRR = 1.41, [0.92, 2.17] and earache or infection IRR=3.28 [1.96, 5.50]). Enterococcus levels were associated with illness following rainstorms, but not during dry weather. After translating outcomes into risk difference (RD), similar to how U.S. EPA expresses water quality criteria, the RD monotonically increased between unexposed periods, exposure during dry weather, and exposure during wet weather. During the period of highest risk (0-1 days after rain), the gastrointestinal illness RD was 25 episodes per 1,000, which is less than the U.S. EPA’s guidance of 32-36 episodes per 1,000.

Chapter 1: Epidemiology Surfer Health Study
10
II. Introduction
Southern California receives nearly all of its annual rainfall during the winter months (November - April). Freshwater runoff following rainstorms increases fecal indicator bacteria measured in seawater (Noble et al. 2003), but little is known about whether ocean recreators are at higher risk of acute illness following rainstorms. Absent epidemiologic studies to inform beach management guidelines after rainstorms, managers assume elevated fecal indicator concentrations pose an elevated health risk and post public health advisories at beaches that discourage seawater contact for 72 hours after rainfall -- a practice that is based on fecal indicator bacteria profiles in stormwater outflows, which typically decline to pre-rainstorm levels within 3-5 days (Leecaster and Weisberg 2001).
Cross-sectional surveys in the western United States have reported that surfing poses a greater risk of acute illness in urban watersheds compared with more rural watersheds in seasons with exceptionally high rainfall (Dwight et al. 2004), and that surfers who reported entering the ocean often during rainstorms or during posted health advisories were also more likely to report acute illness symptoms (Harding et al. 2015). Prospective swimmer cohort studies conducted during summer months in California have confirmed that ocean exposure increases the incidence of gastrointestinal illness and other acute symptoms (e.g., eye infections, earache or infections) (Colford et al. 2007, 2012, Haile et al. 1999, Yau et al. 2014, Arnold et al. 2013). The same studies found that Enterococcus levels measured in ocean water were positively associated with incident gastrointestinal illness, but only if there was a well-defined source of human fecal inputs at the beach. To our knowledge, there have been no prospective studies to compare illness rates following ocean exposure during dry versus wet weather, and no studies that have evaluated whether Enterococcus levels are associated with incident illness during wet weather periods in California.
We conducted a longitudinal cohort study among surfers in San Diego, California. We focused on surfers because they are a well-defined population that regularly enters the ocean year round, even during and immediately after rainstorms (surfing conditions often improve during storms). Our objectives were to determine whether ocean exposure increased rates of incident illness among surfers, to determine whether exposure during or immediately after rainstorms increased rates more than exposure during dry weather, and to evaluate the relationship between Enterococcus levels in the ocean and incident illness during dry and wet weather.
III. Methods
A. Study Setting, Design, and Enrollment
Ocean water quality as measured by the presence of fecal indicator bacteria has demonstrated that San Diego County beaches are among the cleanest in the state, but as with most California beaches, water quality deteriorates following wet weather (Heal the Bay 2015). The most heavily

Chapter 1: Epidemiology Surfer Health Study
11
used beaches in the region are impacted by urban runoff following storms, and local beach managers post advisories that discourage water contact within 72 hours following rainfall. We conducted a longitudinal cohort study of surfers recruited in San Diego, CA over two winters (2013-14, 2014-15), with enrollment and follow-up periods chosen to capture the majority of rainfall events in the study region. The study targeted enrollment and conducted extensive water quality measurement at two sentinel beaches located within the city limits of San Diego – Tourmaline Surfing Park and Ocean Beach. We chose the sentinel beaches because they represented important types of storm-impacted beaches in the region, they both had storm-impacted creek, stream or storm drains near them, and they were frequented year-round by surfers. Ocean Beach is adjacent to the San Diego River that drains a 1,124 km2 varied land use watershed, with many flow control structures; Tourmaline Surfing Park is adjacent to Tourmaline creek and a storm drain, which together drain an urban, largely impervious, 3.9 km2 watershed (Figure 1). The two sentinel beaches enabled us to match daily water quality measures with the subset of surf sessions at these beaches to estimate the relationship between fecal indicator bacteria levels and incident illness.
Figure 1. Sentinel beach water quality sampling locations and Enterococcus levels in dry and wet periods in San Diego, CA during the winters of 2013-14 and 2014-15: (a) locations of the two sentinel beaches along the San Diego coastline, and the locations of the water quality sampling sites at (b) Tourmaline Surfing Park, and (c) Ocean Beach. Box plots illustrate Enterococcus levels during dry and wet weather at the sampling locations at (d) Tourmaline Surfing Park and (e) Ocean Beach. Samples at discharge locations were only collected during wet weather. Wet weather was defined as >0.25 cm of rain in 24 hours.
0
1
2
3
4
5
OBDIS OB1 OB2 OB3 OB4
Log
Ente
roco
ccus
cfu
/100
mL
DryWet
0
1
2
3
4
5
TDIS T1 T2
Log
Ente
roco
ccus
cfu
/100
mL
DryWet
B
C
AB
C
D
E
OB1
OB2
OB3
OB4
OBDIS
T2
T1 TDIS

Chapter 1: Epidemiology Surfer Health Study
12
Year 1 of the study was originally conceived as a pilot, but we included all year 1 exposure and outcome measurements in the full study because we could find no reason from a validity standpoint to exclude that information. During the first winter (recruitment window January 14, 2014-March 18, 2014, end of follow-up June 4, 2014) we enrolled surfers through in-person interviews at the two sentinel beaches and through targeted online advertising on Surfline.com, a popular website that reports surf conditions. Surfers enrolled on the beach were offered a free bar of surf wax. During the first winter, all enrolled surfers who completed 12 weeks of follow-up were entered into a drawing to win their choice of a $50 gift certificate or a year’s subscription to Surfline.com. We enrolled participants at sentinel beaches and online because we wanted to assess whether individuals enrolled through both modes were similar in their exposure and other characteristics.
Surfers enrolled at sentinel beaches were very similar, though slightly older, to those enrolled online (Table 1). Given this similarity, we only enrolled participants online during the second winter (recruitment window December 1, 2014-March 22, 2015, end of follow-up April 16, 2015). We recruited surfers through postcards distributed at the sentinel beaches and through an e-newsletter distributed by the Surfrider Foundation’s San Diego County chapter. In the second winter, we changed participant incentives in response to qualitative feedback from participants in year 1, and provided a $20 gift certificate after every 4 weeks of follow-up that participants completed. In both years, we intensified on-beach recruitment efforts (distribution of study recruitment materials) during and following rainstorms to ensure that we enrolled surfers who entered the ocean close to wet weather. Surfers were eligible if they met the following enrollment criteria: age ≥18 years, could speak and read English, planned to surf in Southern California during the study period, had a valid email address or mobile number, and could access the internet with a computer or smartphone.
Participants reported daily surf activity (location, date, time of entry and exit) and illness symptoms (details below) for the previous seven days using a web and smartphone (iOS, Android) application specifically designed for the study. The first time a participant signed into the application, they also completed a brief background questionnaire. Each Tuesday, participants received a text message or email reminder to complete the short weekly survey. We used an open cohort design in which participants were allowed to enter and exit the cohort over the follow-up period. We excluded follow-up periods when participants reported surfing outside of the continental United States or outside of Southern California. The study protocol and materials were reviewed and approved by the institutional review board at the University of California, Berkeley, and all participants provided informed consent. Consent materials explained that the study was designed to measure the relationship between ocean exposure and illness rates, but in an effort to avoid potential bias in reported exposure and illness symptoms, the materials did not emphasize our objective to compare wet versus dry weather exposure.
Chapter 1: Epidemiology Surfer Health Study
13
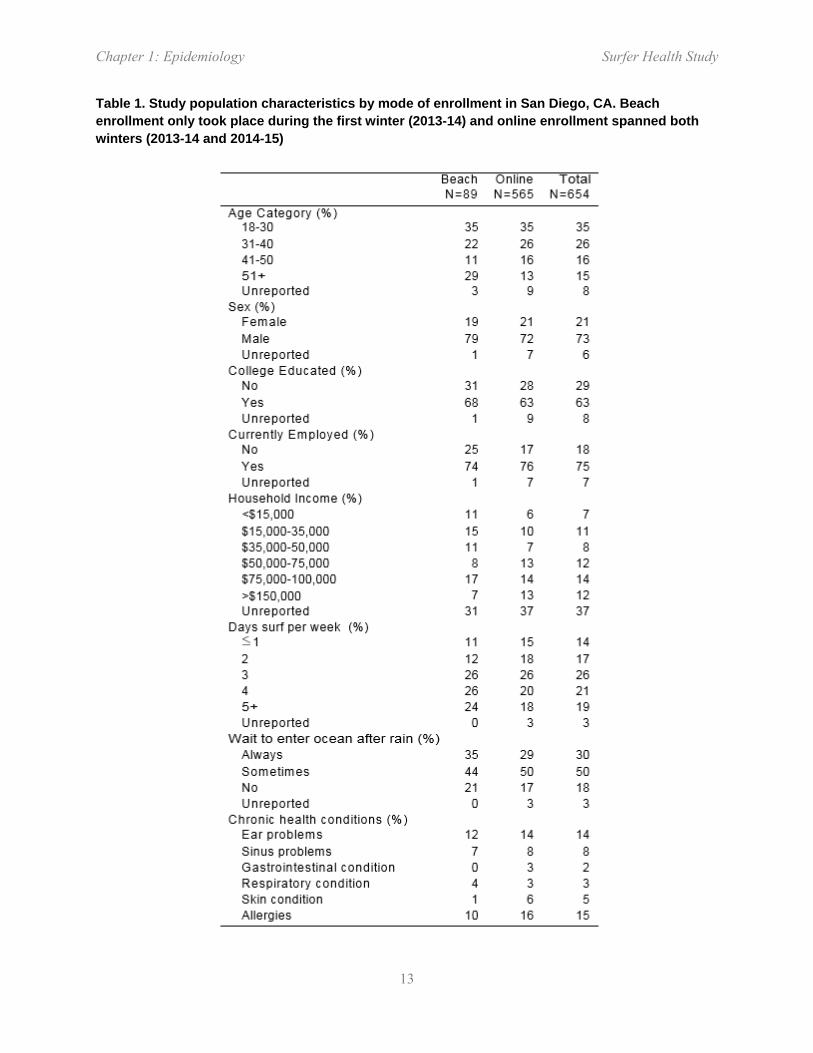
Table 1. Study population characteristics by mode of enrollment in San Diego, CA. Beach enrollment only took place during the first winter (2013-14) and online enrollment spanned both winters (2013-14 and 2014-15)
Chapter 1: Epidemiology Surfer Health Study
14
B. Outcome Definition and Measurement
In weekly surveys, participants reported whether they had any of the following symptoms: diarrhea (defined as ≥3 loose/watery stools in 24 hours (Colford et al. 2005)), sinus pain or infection, earache or infection, infection of open wound, eye infection, skin rash, and fever. Sore throat, cough, and runny nose were collected in the second winter only. The measured symptoms enabled us to create composite outcomes including: gastrointestinal illness, defined as (i) diarrhea, (ii) vomiting, (iii) nausea and stomach cramps, (iv) nausea and missed daily activities due to gastrointestinal illness, or (v) stomach cramps and missed daily activities due to gastrointestinal illness (consistent with the EPA and other recent California swimmer cohorts (Noble et al. 2003, Leecaster and Weisberg 2001, Dwight et al. 2004, Haile et al. 1999, Yau et al. 2014, Arnold et al. 2013), and upper respiratory illness, defined as any two of the following: (i) sore throat, (ii) cough, (iii) runny nose, (iv) fever (Arnold et al. 2013). Finally, we defined a composite outcome of any infectious symptom as any one of the following: gastrointestinal illness, diarrhea, vomiting, eye infection, infection of open wounds or fever, with the rationale that it would exclude outcomes that could potentially have non-infectious causes (earache or infection, sinus pain or infection, skin rash, upper respiratory illness) and would, in theory, be more sensitive to differences in waterborne pathogen transmission between dry and wet weather periods.
We defined incident episodes as the onset of symptoms preceded by ≥6 symptom-free days. Requiring ≥6 symptom-free days between episodes increased the likelihood that separate episodes represented distinct infections, following protocols used in past gastrointestinal illness studies (Colford et al. 2005, 2009). In determining incident episodes, we treated an individual’s first 6 days of follow-up time as “at risk” under the assumption that the individual did not have incident illness in the days immediately before the start of their recorded symptom history.
C. Exposure Definition and Measurement
We evaluated incident outcomes within three days of exposure. If an individual entered the ocean, the three days following that exposure were classified as exposed periods. All other days of observation were classified as unexposed periods. We examined illness within three days of exposure as a tradeoff between the high frequency of exposure in the study population and the incubation periods of common waterborne viral and bacterial pathogens -- previous studies have noted that the majority of excess gastrointestinal incidence among swimmers were in the 1-2 days following water contact (Soller et al. 2010, Yau et al. 2014, Arnold et al. 2013, Colford et al. 2012). In the analysis of exposure during wet versus dry weather, ocean exposures that took place within 0-3 days of ≥ 0.25cm of rainfall in a 24 hr period were classified as “wet weather” exposure, and all other ocean exposure was classified as “dry weather” exposure. Rainfall in excess of 0.25cm is the criterion in San Diego County for posting beach advisories. Rainfall was measured at Lindbergh Field station, San Diego, CA and reported by the National Oceanic and

Chapter 1: Epidemiology Surfer Health Study
15
Atmospheric Administration. The weather station was nearby the study’s two sentinel beaches: Ocean Beach (7km) and Tourmaline Surfing Park (15km). Large weather systems produce the majority of rainfall in San Diego, so we used station measurements to identify wet weather periods for all study region beaches. The great majority of surfer exposure took place during the morning hours, so if a storm’s precipitation started after 12:00 noon we did not classify that day as wet weather (only the following day) to reduce exposure misclassification.
Field staff collected daily water samples from January 15, 2014 to March 5, 2014 and from December 2, 2014 to March 31, 2015 at a total of six sites from the two sentinel beaches (Figure 1a-c). One-liter water samples were collected in the morning (08:30 ± 2 hrs) just below the water surface (0.5-1.0m depth) in sterilized and then site-rinsed bottles. Wet weather discharges during six storm events were collected from Tourmaline Creek and San Diego River immediately upstream from the sentinel beaches. Storm discharge samples were used to compare water quality at the discharge locations versus at the beach sampling sites, but were not used in the analyses assessing the relationship between water quality measurements and illness outcomes. Samples were tested for culturable Enterococcus (EPA method 1600), fecal coliforms (standard method 9222D), and total coliforms (standard method 9222B). All laboratory analyses met quality control objectives for absence of background contamination (blanks) and maximum precision (duplicates). Samples with indicator levels below the detection limit were imputed at the detection limit (2 CFU/100ml for Enterococcus and fecal coliforms, 20 CFU/100ml for total coliforms). In the water quality indicator exposure analyses, we matched the subset of individual surf sessions at the two sentinel beaches with concurrent indicator levels by date and beach (see details below) – surf sessions at non-sentinel beaches were not included in the analysis of fecal indicator bacteria and subsequent illness.
D. Statistical Analysis
Analyses were pre-specified (https://osf.io/nyuvm). We calculated incidence rates by dividing incident episodes by person-days in unexposed and exposed periods during follow-up. If participants missed weekly surveys during follow-up, we did not include those periods in the analysis. We measured the association between ocean exposure and subsequent illness using an incidence rate ratio (IRR). Let Yit be a binary indicator equal to 1 if individual i is ill on day t (0 otherwise), let Tit be an indicator that participant i is at risk of illness on day t. Let Eit be a binary indicator of equal to 1 if individual i entered the ocean on day t (0 otherwise). Define E*it = max(Ei,t-1 , …, Ei,t-3), which is a binary indicator of whether the individual entered the ocean in the three days prior to the outcome measurement on day t. Our first parameter of interest was the IRR associated with ocean exposure in the past three days (E* = 1), averaged over potentially confounding covariates (X). We modeled illness for individual i on day t using the following log-linear rate model (Rothman et al. 2008), subset to days at risk (Tit = 1):
log E[Yit | E*it , Xit] = α + βE*it + γ Xit (1)

Chapter 1: Epidemiology Surfer Health Study
16
where Xit is a vector of potential confounders included in adjusted analyses (details below). We estimated the IRR associated with ocean exposure from the model, exp(β), and used robust standard errors that accounted for repeated observations within individuals (Huber 1967).
Our second research question examined whether ocean exposure increased illness rates more if exposure took place within three days of wet weather compared with exposure during dry weather. Let Dt be a count of days since it rained >0.25 cm in 24 hours, with Dt = {0, 1, 2, …}. Let Rit be a binary indicator equal to 1 if individual i entered the ocean on day t and Dt ≤ 3 (0 otherwise), indicating that a surf session took place within three days of rain. Define R*it = max(Ri,t-1 , Ri,t-2 , Ri,t-3), a binary indicator of whether an individual had a wet weather exposure in the past three days. With E*it (an indicator of any ocean exposure in the past three days), we created a three level categorical exposure:
We estimated a log-linear model, subset to days at risk (Tit = 1):
log E[Yit | Wit , Xit] = α + β1I(Wit=dry) + β2I(Wit=wet) + γ Xit (2)
where Xit are covariates in adjusted models. We estimated separate IRRs from the model for surf exposure during dry versus unexposed periods, exp(β1), for surf exposure during wet versus unexposed periods, exp(β2), and for wet versus dry periods, exp(β2 - β1). For each outcome, we calculated a test of trend in the IRRs for dry and wet weather exposures (not pre-specified), in which the test for log-linear trend in incidence rates was significant if the coefficient β2 differed from zero (Vittinghoff et al. 2012).
We estimated the association between fecal indicator bacteria levels and illness using the subset of surf sessions matched to water quality indicator measurements at the sentinel beaches using log10 continuous indicator levels, Fit . For surfers with a single day of exposure matched to indicator levels in the past three days, Fit equaled the daily geometric mean value on the exposed day. For surfers with multiple exposures matched to indicator levels in the past three days, we calculated the mean concentration weighted by the number of hours spent in the water on each day. We modeled the relationship between indicator levels and illness for individual i on day t using a log-linear model, subset to days at risk (Tit = 1):
log E[Yit | Fit , Xit] = α + δFit + γ Xit (3)
where exp(δ) estimates the IRR associated with a 1-log10 increase in indicator level. In the water quality analysis, we also hypothesized that the relationship between fecal indicator bacteria and illness could be modified by whether it was dry or wet weather exposure. We allowed the exposure-response relationship to vary by exposure during dry and wet weather by including an

Chapter 1: Epidemiology Surfer Health Study
17
indicator for wet weather exposure in the past three days, R*it , and an interaction term in the model:
log E[Yit | Fit , W*it , Xit] = α + δ1Fit + δ2R*it+ δ3Fit R*it+ γ Xit (4)
We also estimated the IRR associated with values above versus below USEPA Enterococcus regulatory guidelines (USEPA 2012) by replacing Fit in equations 3 and 4 with an indicator equal to 1 if Fit exceeded 35 CFU/100ml or, in a second definition, if any single sample on the exposure day exceeded 104 CFU/100ml.
Potential confounders: Given the longitudinal design with the potential for repeated exposures and outcomes during follow-up, individual surfers contributed person-time to both unexposed and exposed periods. We selected potential confounders that could be either a cause of ocean exposure, a cause of illness, or both (VanderWeele and Shpitser 2011). We controlled for the following time-invariant potential confounders: age, sex, education, employment status, household income, years the individual has surfed, reported behavior of avoiding the ocean following wet weather, surfboard length (short board <2.1 m, fun board 2.1-2.7 m, longboard >2.7 m, potentially associated with different types of surf exposure), mode of enrollment (beach vs. web), and chronic health conditions included only for the corresponding outcomes: ear problems, sinus problems, gastrointestinal conditions (e.g., Crohn’s disease or irritable bowel syndrome), respiratory conditions (e.g., asthma or emphysema), skin conditions (e.g., psoriasis or eczema). We also controlled for time-varying potential confounders: entered the ocean for an activity other than surfing, any illness symptoms in the week preceding the risk window, outcome measurement day of recall, day of the week, rainfall total during the past three days. In the overall ocean exposure analysis, we considered in adjusted models an indicator of wet weather in the past three days, and in the water quality indicator analyses, we also considered in adjusted models an indicator for sentinel beach and an indicator for whether the individual surfed at beaches other than our two sentinel beaches in the same three-day period as their sentinel beach exposure. From this set of potential confounders, we retained those that had a univariate association with the outcome, defined as a likelihood ratio test P-value <0.20 in an unadjusted model (VanderWeele and Shpitser 2011). For categorical variables, we included a “missing” category for missing values.
Sample size: The sample size for the study was developed in two stages because little was known about outcome or exposure prevalence in the surfer population. In year 1, we aimed to enroll 100-200 surfers and follow them for up to 12 weeks to collect exposure and illness information, as well as fecal indicator bacteria levels. Using exposure and outcome information from the initial, smaller cohort in year 1, we then calculated sample size and power for the full study to inform enrollment targets for year 2 (details in Supplemental Information). We estimated that we would need 18,520 total person-days of observation (2,650 weekly surveys) to have 80% power to detect an IRR of 1.5 associated with wet weather ocean exposure. We estimated that 3,000 person-days of observation matched to water quality measurements would

Chapter 1: Epidemiology Surfer Health Study
18
have 80% power to detect an IRR of 1.75 or larger associated with a 1-log10 increase in Enterococcus levels. We targeted these recruitment goals given the relevance of the effect sizes and what was feasible given the results from the first winter of recruitment.
Sensitivity analyses: The primary analysis defined wet weather exposure as periods within 0-3 days following rainfall. This definition was consistent with current beach posting guidelines in California, which warn recreators to stay out of the water for 72 hours after rainfall. In a sensitivity analysis, we changed the length of the wet weather window in daily increments from 0 to 5 days following rainfall to determine if shorter windows were associated with larger increase in illness rates. In a second sensitivity analysis, we further stratified wet weather periods into different storm sizes based on storm rainfall totals: small (<2.5 cm), medium (2.5-4.9 cm) and large (>4.9 cm). Storm size cut points represented natural separations in the distribution of rainfall totals in the study, and were chosen before conducting the health outcome analyses. We conducted an additional pair of sensitivity analyses that dropped small subsets of the data. First, we excluded from the analysis population any participant who submitted more than one weekly survey in a single day. The submission of >1 survey in the same day could signal either confusion or fabrication of data, both of which could result in spurious exposure or outcome reporting. Second, we excluded from the analysis person-time where exposure took place at surf breaks without a confirmed location (to avoid the potential for misclassification in the event that those exposures were outside of the study region).
Negative control analysis: We matched survey data to Enterococcus levels measured at one of the sentinel beaches by date (randomly assigning either the Ocean Beach value or the Tourmaline Surfing Park value to any given day). We then limited the dataset to person-time with no ocean exposure in the past three days. In this negative control exposure analysis, there should be no plausible relationship between Enterococcus levels and subsequent illness unless there is bias from unobserved confounding or measurement error (Arnold et al. 2016, Lipsitch et al. 2010). We repeated the negative control analysis excluding all person-time with ocean exposure in the past five days.
Risk estimates (not pre-specified): The longitudinal design with varying lengths of follow-up and varying exposure periods meant that the natural measure of illness was incidence rates (episodes / person-days) (Rothman et al. 2008). However, federal water quality guidelines and quantitative microbial risk assessment models measure illness in units of cumulative incidence or “risk” (episodes / person) for gastrointestinal illness (USEPA 2012). We converted marginally adjusted incidence rate estimates from log-linear models described above into 3-day cumulative incidence using the density method (Kleinbaum et al. 1982). We compared exposure groups using the difference in cumulative incidence (“risk difference” [RD]), and estimated standard errors and 95% confidence intervals for the RD using the delta method (Wasserman 2004). We used a 3-day cumulative incidence because incidence rates were measured over 3-day periods following exposure – the high frequency of exposure made longer follow-up periods infeasible. In California swimmer cohorts, the majority of excess cases of gastrointestinal illness occurred in

Chapter 1: Epidemiology Surfer Health Study
19
the 1-2 days following ocean exposure; for this reason, a 3-day RD should be a reasonable approximation of the RD calculated over a longer 10-12 day period, as measured in past swimmer cohort studies (Yau et al. 2014, Arnold et al. 2013, Colford et al. 2012).
IV. Results
A. Study Population
The study enrolled 654 individuals (162 in year 1, 492 in year 2) who contributed on average 51 days of follow-up (range: 6 to 139 days). In some cases, surfers completed surveys intermittently during their study participation (Figure S1). Most surveys (78%) were completed on a Tuesday or Wednesday (weekly reminders sent on Tuesday). The population was 73% male, 63% college-educated, and 75% employed. The median (IQR) age was 34 (27, 45), and participants represented a range of income groups (Table 1). Follow-up time that included ocean exposure in foreign locations (343 person-days) or in locations outside of southern California (280 person-days) did not contribute to the total 33,377 person-days of observation. We excluded from adjusted analyses 47 individuals (1,599 person-days of observation) who provided outcome and exposure information but failed to complete a background questionnaire and thus had missing covariate information.
B. Water Quality and Surfer Exposure
There were 10 rainstorms >0.25 cm during the study period. Field staff collected 1,073 beach water samples and 92 wet weather discharge samples for fecal indicator bacteria analysis. Regardless of sampling site, median Enterococcus concentrations were higher during wet weather than dry weather (Figure 1). At Tourmaline Surfing Park, median wet weather discharge concentrations of Enterococcus were greatest in Tourmaline Creek and, upon mixing with ocean waters, decreased to a relatively uniform concentration regardless of distance from the creek mouth (Figure 1d). At Ocean Beach, median wet weather discharge concentrations of Enterococcus were greatest in the San Diego River discharge and, upon mixing with ocean waters, concentrations decreased with distance from the river mouth (Figure 1e). Fecal and total coliforms followed similar patterns (results available from the authors).
Surfers entered the ocean an average of two times per week. During 33,377 days of follow-up, there were 10,081 total days of ocean exposure and 1,327 days of wet weather exposure. Surfers were less likely to enter the ocean during or within one day of rain (Figure S2a). The median (IQR) ocean entry time was 08:00 (06:45, 10:30) and median (IQR) time spent in the water was 2 (1, 2) hours (Fig S2b-c). Surfers reported immersing their head in 96% and swallowing water in 38% of the 10,081 exposure days. The most frequented surf locations in the study population
Chapter 1: Epidemiology Surfer Health Study
20
were the two sentinel beaches: Tourmaline Surfing Park (25% of surf days) and Ocean Beach (16% of surf days), which reflected targeted enrollment at those beaches (Figure S3). There were 5,819 days of observation matched to water quality measurements at sentinel beaches, of which 1,358 days were during wet weather.
C. Illness Associated with Ocean Exposure
Across all weather conditions, ocean exposure in the past three days was associated with increased incidence of all outcomes except for upper respiratory illness (Table 2). Unadjusted and adjusted IRR estimates were similar and, for most outcomes, adjusted IRRs were slightly attenuated toward the null (Table 2). With the exception of fever and skin rash, there was an increase in incidence rates between unexposed periods, exposure during dry weather, and exposure during wet weather (Figure 2). Compared with unexposed periods, wet weather exposure led to the largest relative increase in earache or infection (Figure 2d, adjusted IRR = 3.28, 95% CI: 1.96, 5.50) and infection of open wounds (Figure 2e, adjusted IRR: 4.96, 95% CI: 2.18, 11.29). Converting results into cumulative incidence or “risk” did not change the relationships between ocean exposure and outcomes (Figure S4). Compared with unexposed periods, ocean exposure increased the risk of gastrointestinal illness during dry weather (RD = 7 per 1,000, 95% CI: 0.9, 13) and during wet weather (RD = 12 per 1,000, 95% CI: 0.3, 24). The differences were slightly attenuated in the adjusted analysis for dry weather exposure (adjusted RD = 6 per 1,000, 95% CI: -1, 12) and wet weather exposure (adjusted RD = 8 per 1,000, 95% CI: -3, 19) (Figure S4a). Adjusted RDs associated with dry and wet weather exposure were larger and statistically significant for earache/infection, infection of open wounds, and any infectious symptom (Figure S4).

Chapter 1: Epidemiology Surfer Health Study
21
Table 2. Incident illness and incidence rate ratios (IRR) associated with ocean exposure in the past three days among surfers in San Diego, CA during the winters of 2013-14 and 2014-15.

Chapter 1: Epidemiology Surfer Health Study
22
Figure 2. Illness incidence rates among surfers associated with ocean exposure during dry and wet weather in San Diego, CA, during the winters of 2013-14 and 2014-15. Unadjusted and adjusted incidence rate ratios (IRR) compare incidence rates in the three days following ocean exposure during dry or wet weather with incidence rates during unexposed periods. Wet weather was defined as >0.25 cm of rain in 24 hours. See the main text for definitions of composite outcomes (gastrointestinal illness, upper respiratory illness, any infectious symptom).

Chapter 1: Epidemiology Surfer Health Study
23
For most outcomes, shortening the wet weather window increased the difference in incidence rates between exposed periods during dry and wet weather (Figure 3, Figure S5). For example, shortening the wet weather window from 0-3 days (primary analysis) to 0-1 day increased the wet weather exposure incidence rate of gastrointestinal illness from 10 to 15 episodes per 1,000 person-days (Figure 3). Exposure during rainstorms or in the day following rain increased the magnitude of the RD for most symptoms (Figure S6). When we further stratified wet weather periods by storm size, there was some suggestion that larger storms were associated with larger increases in incidence rates, though due to small sample sizes within storm sizes, we limited the analysis to composite outcomes gastrointestinal illness and any infectious symptom (Figure S7). Excluding individuals that ever submitted >1 survey in a single day (N=124 surfers, 8,253 person-days of observation) did not change our inference but increased the width of the confidence intervals due to smaller sample sizes (Table S1). Excluding follow-up periods with ocean exposure in unconfirmed locations (N=419 days of observation) produced estimates nearly identical to the primary analysis (results available from the authors).
Figure 3. Sensitivity analysis of wet weather exposure period definition on incidence rates of gastrointestinal illness among surfers in San Diego, CA during the winters of 2013-14 and 2014-15. Wet weather was defined as >0.25 cm of rain in 24 hours. Incidence rates for dry and wet weather were re-calculated for varying lengths of wet weather window. The primary analysis used a period of 0-3 days.

Chapter 1: Epidemiology Surfer Health Study
24
D. Illness Associated with Fecal Indicator Bacteria Levels
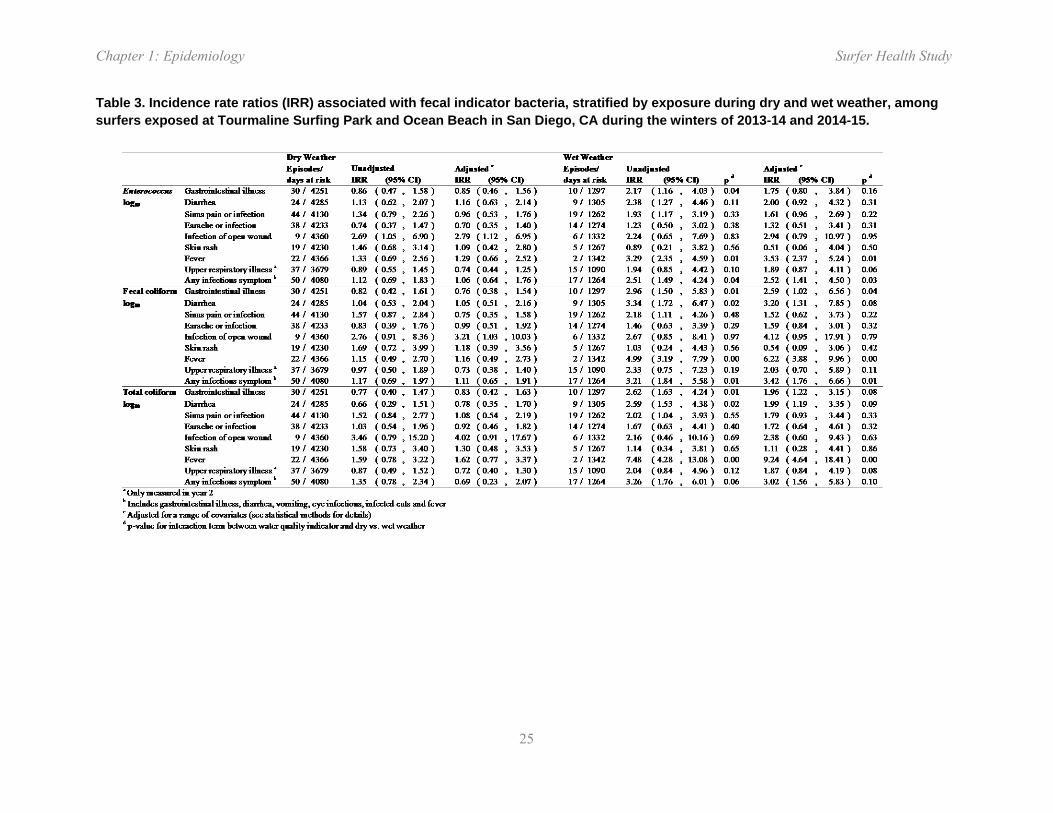
Enterococcus, total coliforms and fecal coliforms were positively associated with increased incidence of almost all outcomes (Table S2), and rainfall was a strong effect modifier of the association. During dry weather, there was no association between Enterococcus levels and illness except for infected wounds (e.g., gastrointestinal illness IRR = 0.86, 95% CI: 0.47, 1.58; any infectious symptom IRR = 1.12, 95% CI: 0.69, 1.83 for each log10 increase, Table 3). In contrast, Enterococcus was strongly associated with illness following wet weather exposure in unadjusted analyses (gastrointestinal illness IRR = 2.17, 95% CI: 1.16, 4.03; any infectious symptom IRR = 2.51, 95% CI: 1.49, 4.24 for each log10 increase, Table 3, Figure 4, Figure S8). These associations were attenuated in adjusted analyses but relationships were similar (e.g., wet IRR = 1.68, 95% CI: 0.76, 3.74 for gastrointestinal illness and wet IRR = 2.45, 95% CI: 1.35, 4.45 for any infectious symptom, Table 3). Enterococcus measured as a binary indicator of ≥35 and ≥104 CFU per 100 mL and log10 concentrations of total coliforms and fecal coliforms similarly had no association with illness during dry conditions and strong, positive associations following wet weather (Table 3, Table S3). Compared with Enterococcus, fecal coliforms and total coliforms had similar or stronger relationships with illness outcomes and had similar effect modification by dry versus wet weather exposure (Table 3).
Chapter 1: Epidemiology Surfer Health Study
25
Table 3. Incidence rate ratios (IRR) associated with fecal indicator bacteria, stratified by exposure during dry and wet weather, among surfers exposed at Tourmaline Surfing Park and Ocean Beach in San Diego, CA during the winters of 2013-14 and 2014-15.

Chapter 1: Epidemiology Surfer Health Study
26
Figure 4. Gastrointestinal illness incidence rates associated with Enterococcus levels measured during dry and wet weather periods, predicted from a log-linear model among surfers at Tourmaline Surfing Park and Ocean Beach, San Diego, CA during the winters of 2013-14 and 2014-15. Wet weather was defined as >0.25 cm of rain in 24 hours. Dashed lines indicate 95% confidence intervals and histograms show the distribution of Enterococcus exposure in the population.
Consistent with the incidence rate analysis, after converting the log-linear model predictions into cumulative incidence, there was evidence for excess risk of gastrointestinal illness at higher Enterococcus levels only during wet weather periods (Figure S9). Based on the relationship plotted in Figure S9, during wet weather, the predicted excess risk that corresponded to the current regulatory guideline of 35 CFU/100ml was 16 episodes per 1,000 (95% CI: 5, 27). Re-scaling estimates from incidence rates to risk differences for the cut point analysis led to similar estimates but differences were not statistically significant (Table S4).
Negative control analyses, where outcome measurements for individuals during unexposed periods were matched to Enterococcus counts by date, showed no overall associations between Enterococcus and illness among individuals that had not been exposed to the ocean in the past three days (IRR = 1.10, 95% CI: 0.81, 1.51 for gastrointestinal illness for each log10 increase) or
Chapter 1: Epidemiology Surfer Health Study
27
in the past five days (Table S5). Excluding individuals that ever submitted >1 survey in a single day did not change our inference (Table S6).
V. Discussion
A. Key results
In this longitudinal cohort study, we found that ocean exposure increased the incidence of acute illness. Rainstorms led to higher levels of fecal indicator bacteria at sentinel beaches, and seawater exposure within three days of rain further increased the incidence of a broad set of infectious outcomes (Figure 2). A sensitivity analysis showed that exposure during or in the day following rainstorms further increased incidence rates, and that a 3-day window captured the majority of excess incidence associated with wet weather exposure (Figure 3). Fecal indicator bacteria matched to individual surf sessions were strongly associated with subsequent illness only during wet weather periods (Table 3, Figure 4). The internal consistency between measures of water quality, patterns of illness following dry and wet weather exposure, and incidence profiles with time since rainstorms and size of rainstorms lead us to conclude that seawater exposure during or close to rainstorms at urban runoff-impacted beaches increases the incidence of a broad set of acute illnesses among surfers.
B. Limitations
The study had four main limitations. First, the use of self-reported symptoms could bias the association between ocean exposure and illness away from the null if surfers artificially over-reported illness following exposure; conversely, random (non-differential) errors in exposures or outcomes could bias associations toward the null (Copeland et al. 1977). The survey measured daily exposure and outcomes in separate modules, which was an intentional design decision to separate exposure and outcome reporting in an attempt to reduce the potential for systematic over-reporting bias. Adjusted analyses controlled for the day of recall and day of the week to reduce non-differential bias from recall errors, but would not control for systematic bias. The sensitivity analyses that dropped participants who ever submitted >1 survey in a single day – a sign of either confusion or otherwise erroneous reporting – found results consistent with the primary analysis (Table S1). We originally planned to include negative control outcomes in this study to detect possible reporting biases (Arnold et al. 2016, Lipsitch et al. 2010), but had difficulty identifying symptoms that were not plausibly associated with ocean exposure (details in the summary of changes to the study’s analysis plan: https://osf.io/nyuvm). Negative control exposure analyses found no association between Enterococcus levels and illness on days with no recent water exposure (Table S5), which means that unmeasured confounding or reporting bias is unlikely to explain the association between Enterococcus levels and illness observed in this
Chapter 1: Epidemiology Surfer Health Study
28
study following water exposure. Although more costly, the use of objective, pathogen-specific salivary antibody measures (Griffin et al. 2011) would constitute an important advance that could overcome some of the difficulties of stool collection and testing in this context (Dorevitch et al. 2012), would be free from potential reporting biases, and would provide additional information about etiologic agents responsible for illness.
Second, the analysis was limited to measures of incident outcomes to within three days of seawater exposure. We pre-specified the 3-day window following exposure because of the population’s frequency of exposure, because a 3-day period captures the majority of incubation periods for the most common waterborne pathogens (e.g., norovirus, Salmonella spp., Campylobacter spp., Vibrio parahaemolyticus), and because prospective swimmer cohorts without repeated exposures have found that the majority of excess gastrointestinal illness incidence associated with ocean exposure was in the 1-2 days following exposure (Yau et al. 2014, Arnold et al. 2013, Colford et al. 2012). However, illness caused by pathogens with longer incubation periods (e.g., Cryptosporidium spp.) could have been misclassified in this study, which could bias results toward the null.
Third, the majority of the cohort was enrolled online and therefore could not be physically verified to be surfing at study region beaches. We found that surfers enrolled at the beach and online were broadly similar – both in their demographic characteristics as well as in their exposure (Table 1). The majority of surf exposure took place at sentinel beaches and surf breaks near them (Figure S3), which were the focus of recruitment outreach efforts. Together, these observations make it exceedingly unlikely that individuals from outside the region were participating in the study.
Fourth, the two study winters took place during a drought in Southern California, which meant that there were just 10 rainstorms >0.25 cm during the study period and 13% of surf sessions took place within 0-3 days of rain. Although we planned our sample sizes under the assumption of drought conditions and exceeded our enrollment targets (Supplemental Information), a more balanced distribution between dry and wet weather exposure would have improved the precision of our wet weather exposure associations.
C. Interpretation
This is the first prospective cohort study to measure incident illness associated with wet weather ocean exposure in California, and the findings present important and novel empirical measures of incident illness associated with stormwater discharges in Southern California. The relative increase in gastrointestinal illness associated with ocean exposure (adjusted IRR = 1.33, 95% CI: 0.99, 1.78; Table 2) was similar in magnitude to relative increases in risk measured in marine swimmer cohorts in California and elsewhere in the United States (Fleisher et al. 2010, Wade et al. 2010, Colford et al. 2007, 2012, Haile et al. 1999, Yau et al. 2014, Arnold et al. 2013). Overall levels of gastrointestinal illness observed in this study were similar to those measured
Chapter 1: Epidemiology Surfer Health Study
29
among beachgoers in summer California cohorts: after reanalyzing data from four summer studies conducted in California during the last decade to align a comparison with the present study in terms of outcome measure (the summer studies used a ten day incubation period, though most of the illness occurred in the first three days following swimming) and age distribution (previous studies included children, while this one did not), we found that gastrointestinal illness rates were similar across all studies for unexposed and exposed conditions (Supplemental Information, Figure S10). Despite the similarity with swimmer studies in gastrointestinal illness, the 3-fold increase in rates of earache or infection (adjusted IRR = 3.28, 95% CI: 1.96, 5.50) and 5-fold increase in infected open wounds (adjusted IRR = 4.96, 95% CI: 2.18, 11.29) associated with exposure following rainstorms are stronger associations than have been reported in previous studies, and provide evidence for increased incidence of a broad set of infectious symptoms following seawater exposure within three days of wet weather.
The relative increase in incidence is important when evaluating etiologic relationships between exposures and outcomes, but assessing health risks on the absolute scale provides additional context for public health and regulatory decision making (Rothman et al. 2008). When we translated results to the risk difference scale, we found absolute increases in risk between unexposed periods, exposure during dry weather, and exposure during wet weather for gastrointestinal illness, diarrhea, sinus pain or infection, and earache or infection (Figure S4a-d), and risks increased closer to rainstorms (Figure S6). Seawater exposure within three days of wet weather was associated with an adjusted RD of 8 gastrointestinal illness episodes per 1,000, which was not statistically different from zero (Figure S4a); during the window of highest risk in the sensitivity analysis (within 0-1 days of rain) the RD was 25 per 1,000 (Figure S6a) – still lower than the increase of 32-36 episodes per 1,000 used in EPA recreational water quality guidelines (Rothman et al. 2008). During wet weather periods, the excess risk of gastrointestinal illness associated with Enterococcus that corresponded to the USEPA regulatory guideline of 35 CFU/100ml was 16 episodes per 1,000 (Figure S9). Together, these results show that during wet weather there is a higher risk of gastrointestinal illness associated with ocean exposure and higher Enterococcus levels, but that the relationships between the exposures and outcomes estimated in this study differ from those that informed the USEPA guidelines (USEPA 2012).
The difference between the current study and USEPA guidelines in estimated excess risk of gastrointestinal illness associated with Enterococcus levels could arise from two main sources. First, it is possible that beaches in the current study had different sources of fecal pollution from those that informed EPA guidelines. Stormwater conveyances in southern California are known to discharge, at least partially, non-human sources of Enterococcus (Griffith et al. 2010). The sources studied by EPA included known sources of human fecal inputs, including treated wastewater discharges (Wade et al. 2008, 2006, 2010). Second, there were differences in the demographics and exposure profiles of the study populations. Swimmers are rare during the winter months, and surfers’ frequent and intense exposure made them an ideal population in which to study the relationship between wet weather ocean exposure and illness (Rothman et al.
Chapter 1: Epidemiology Surfer Health Study
30
2013). The current study enrolled adult surfers (we could not guarantee adequate consent for minors through online enrollment), while past swimmer cohorts enrolled many families with children (Wade et al. 2003, 2006, 2008, 2010, Colford et al. 2007, 2012, Haile et al. 1999, Yau et al. 2014, Arnold et al. 2013). Children are known to be more susceptible and have greater risk than adult swimmers (Wade et al. 2008, Arnold et al. 2016). However, surfer exposure was also very intense: on average, participants entered the ocean 2 times per week, for 2 hours each session, with nearly universal head immersion (96% of exposures) and frequent water ingestion (38% of exposures). This far exceeds the level of exposure recorded in past swimmer cohorts. Surfers also spend most of their time offshore in large waves and spend relatively little time in shallow water near the beach. Due to these differences, we recommend caution in the direct comparison of risk estimates from this study with USEPA guidelines.
The strong association between fecal indicator bacteria levels and incident illness during wet weather exposure but not during dry weather exposure suggests that fecal indicator bacteria are a reliable marker of human pathogens in this context only when stormwater outflows impact seawater. All fecal indicator bacteria considered in this study (Enterococcus, fecal coliforms, total coliforms) had similar associations with illness during wet weather periods (Table 3). A caveat – discussed above – is that the associations estimated during wet weather were imprecise because of a relatively small number of days at risk and incident episodes compared with dry weather. The sentinel beaches in this study are similar to many in California in that they are impacted by diffuse “non-point” sources of pollution, such as urban runoff. Past swimmer cohorts conducted during the summer in California found Enterococcus levels were only associated with subsequent illness when there was a well-defined source of human fecal contamination, such as swimming in close proximity to a storm drain (Haile et al. 1999), breach of a freshwater lagoon flowing freely into the ocean (Colford et al. 2012), or higher submarine groundwater discharge (Yau et al. 2014) – in the absence of well-defined sources, there was no association between Enterococcus levels and illness (Colford et al. 2007, Arnold et al. 2013). Our results are consistent with these past studies in that stormwater discharge following rainstorms creates a well-defined source of human pathogens. Pathogen testing at the sentinel beach discharge locations (Figure 1) confirmed the consistent presence of norovirus and Campylobacter spp. in stormwater (see water quality chapter). The association between fecal indicator bacteria measured during wet weather and a range of non-enteric illness, such as sinus pain or infection (Tables 3, S2), suggest that fecal indicator bacteria may be markers of broader bacterial or viral pathogen contamination in seawater following rainstorms.
Some study outcomes could have non-infectious causes associated with surfing – for example, earache and sinus pain can result from physical incursion of saltwater through surfing’s high-intensity exposure, ingestion of saltwater can cause gastrointestinal symptoms, and wetsuit use could cause skin rashes. If the association between surf exposure and symptoms resulted from noninfectious causes, then we would expect to see similar incidence rates following wet and dry weather exposure – this was observed for skin rash (Figure 2f), but sinus, ear, and

Chapter 1: Epidemiology Surfer Health Study
31
gastrointestinal illness incidence rates were higher following wet weather exposure (Figure 2a-d).
It is also possible that some infections acquired during surfing could result from non-anthropogenic sources. The ocean was warmer than usual during the second winter due to a weak El Niño – warmer seawater creates conditions favorable to naturally occurring V. parahaemolyticus and toxin-producing marine algae that can cause illness in humans (Van Dolah 2000). Infection of open wounds was the only outcome that was strongly associated with fecal indicator bacteria measured during dry weather (Table 3) – an observation consistent with a pathogen source that covaries with fecal indicator bacteria even in non-storm conditions. Yet, the consistently higher rates of infected open wounds and other symptoms following wet weather exposure compared with dry weather exposure (Figure 2e) suggests that stormwater runoff constitutes an important pathogen source in this setting.
D. Conclusions
In conclusion, ocean exposure increased the incidence of acute illness in surfers, and exposure during or shortly after rainstorms further increased incidence rates. Fecal indicator bacteria were strongly associated with incident illness, but only during wet weather. The estimated excess risk of gastrointestinal illness following wet weather exposure was below the allowable risk recommended by USEPA guidelines. The internal consistency between water quality measurements, incidence rates following dry and wet weather exposure, and incidence profiles with time since rainstorms and size of rainstorms show that seawater exposure during or close to rainstorms at urban runoff-impacted beaches increases the incidence of a broad set of acute illness symptoms among surfers.

Chapter 1: Epidemiology Surfer Health Study
32
VI. References
Arnold BF, Wade TJ, Benjamin-Chung J, Schiff KC, Griffith JF, Dufour AP, Weisberg SB, Colford JM. (2016) Acute gastroenteritis and recreational water: highest burden among young US children. Am J Public Health. Published online July 26, 2016.
Arnold, B.F., A. Ercumen, J. Benjamin-Chung, J.M. Colford Jr. Negative controls to detect selection bias and measurement bias in epidemiologic studies. Epidemiology. 2016; Published ahead of print. doi:10.1097/EDE.0000000000000504
Arnold, B.F., K.C. Schiff, J.F. Griffith, J.S. Gruber, V. Yau, C.C. Wright, et al. Swimmer illness associated with marine water exposure and water quality indicators: impact of widely used assumptions. Epidemiology. 2013;24: 845–853.
Colford, J.M., K.C. Schiff, J.F. Griffith, V. Yau, B.F. Arnold, C.C. Wright, et al. Using rapid indicators for Enterococcus to assess the risk of illness after exposure to urban runoff contaminated marine water. Water Res. 2012;46: 2176–2186.
Colford, J.M., J.F. Hilton, C.C. Wright, B.F. Arnold, S. Saha, T.J. Wade, et al. The Sonoma Water Evaluation Trial: A Randomized Drinking Water Intervention Trial to Reduce Gastrointestinal Illness in Older Adults. Am J Public Health. 2009;99: 1988–1995.
Colford, J.M., T.J. Wade, K.C. Schiff, M.D. Sobsey, C.C. Wright, J.F. Griffith, et al. Water quality indicators and the risk of illness at beaches with nonpoint sources of fecal contamination. Epidemiology. 2007;18: 27–35.
Colford, J.M., T.J. Wade, S.K. Sandhu, M.J. van der Laan, Brookhart MA, Wright CC, et al. A randomized, controlled trial of in-home drinking water intervention to reduce gastrointestinal illness. Am J Epidemiol. 2005;161: 472–482.
Copeland, K.T., H. Checkoway, A.J. McMichael, R.H. Holbrook. Bias due to misclassification in the estimation of relative risk. Am J Epidemiol. 1977;105: 488–495.
Dorevitch, S., M.S. Dworkin, S.A. Deflorio, W.M. Janda, J. Wuellner, R.C. Hershow. Enteric pathogens in stool samples of Chicago-area water recreators with new-onset gastrointestinal symptoms. Water Res. 2012;46: 4961–4972.
Dwight, R.H., D.B. Baker, J.C. Semenza, B.H. Olson. Health effects associated with recreational coastal water use: urban versus rural California. Am J Public Health. 2004;94: 565–567.
Fleisher, J.M., L.E. Fleming, H.M. Solo-Gabriele, J.K. Kish, C.D. Sinigalliano, L. Plano, et al. The BEACHES Study: health effects and exposures from non-point source microbial contaminants in subtropical recreational marine waters. Int J Epidemiol. 2010;39: 1291–1298.

Chapter 1: Epidemiology Surfer Health Study
33
Griffin, S.M., I.M Chen, G.S. Fout, T.J. Wade, A.I. Egorov. Development of a multiplex microsphere immunoassay for the quantitation of salivary antibody responses to selected waterborne pathogens. J Immunol Methods. 2011;364: 83–93.
Griffith, J.F., K.C. Schiff, G.S. Lyon, J.A. Fuhrman. Microbiological water quality at non-human influenced reference beaches in southern California during wet weather. Mar Pollut Bull. 2010;60: 500–508.
Haile, R.W., J.S. Witte, M. Gold, R. Cressey, C. McGee, R.C. Millikan, et al. The health effects of swimming in ocean water contaminated by storm drain runoff. Epidemiology. 1999;10: 355–363.
Harding, A.K., D.L. Stone, A. Cardenas, V. Lesser. Risk behaviors and self-reported illnesses among Pacific Northwest surfers. J Water Health. ncbi.nlm.nih.gov; 2015;13: 230–242.
Heal the Bay. 2014-2015 Annual Beach Report Card [Internet]. 2015. Available: http://www.healthebay.org/sites/default/files/BRC_2015_final.pdf
Huber, P.J. The behavior of maximum likelihood estimates under nonstandard conditions. Proceedings of the fifth Berkeley symposium on mathematical statistics and probability. books.google.com; 1967. pp. 221–233.
Kleinbaum, D.G., L.L. Kupper, H. Morgenstern. Epidemiologic Research: Principles and Quantitative Methods. New York: John Wiley & Sons, Inc.; 1982.
Leecaster, M.K., S.B. Weisberg. Effect of sampling frequency on shoreline microbiology assessments. Mar Pollut Bull. 2001;42: 1150–1154.
Lipsitch, M., E.T. Tchetgen, T. Cohen. Negative controls: a tool for detecting confounding and bias in observational studies. Epidemiology. 2010;21: 383–388.
Noble, R.T., S.B Weisberg, M.K. Leecaster, C.D McGee, J.H. Dorsey, P. Vainik, et al. Storm effects on regional beach water quality along the southern California shoreline. J Water Health. 2003;1: 23–31.
Rothman, K.J., J.E.J Gallacher, E.E. Hatch. Why representativeness should be avoided. Int J Epidemiol. 2013;42: 1012–1014.
Rothman, K.J., S. Greenland, T.L. Lash. Modern Epidemiology. 3rd ed. Philadelphia: Lippincott Williams and Wilkins; 2008.
Soller, J.A., T. Bartrand, N.J. Ashbolt, J. Ravenscroft, T.J. Wade. Estimating the primary etiologic agents in recreational freshwaters impacted by human sources of faecal contamination. Water Res. 2010;44: 4736–4747.
Chapter 1: Epidemiology Surfer Health Study
34
USEPA. Recreational Water Quality Criteria. United States Environmental Protection Agency Office of Water; 2012. Report No.: 820-F-12-058.
VanderWeele, T.J., I. Shpitser. A new criterion for confounder selection. Biometrics. 2011;67: 1406–1413.
Vittinghoff, E., D.V. Glidden, S.C. Shiboski, C.E. McCulloch. Regression methods in biostatistics: linear, logistic, survival, and repeated measures models. 2nd ed. Springer Science & Business Media; 2012.
Van Dolah, F.M. Marine algal toxins: origins, health effects, and their increased occurrence. Environ Health Perspect. ncbi.nlm.nih.gov; 2000;108 Suppl 1: 133–141.
Wade, T.J., E. Sams, K.P. Brenner, R. Haugland, E. Chern, M. Beach, et al. Rapidly measured indicators of recreational water quality and swimming-associated illness at marine beaches: a prospective cohort study. Environ Health. 2010;9: 66.
Wade, T.J., R.L. Calderon, K.P. Brenner, E. Sams, M. Beach, R. Haugland, et al. High sensitivity of children to swimming-associated gastrointestinal illness: results using a rapid assay of recreational water quality. Epidemiology. 2008;19: 375–383.
Wade, T.J., R.L. Calderon, E. Sams, M. Beach, K.P. Brenner, A.H. Williams, et al. Rapidly measured indicators of recreational water quality are predictive of swimming-associated gastrointestinal illness. Environ Health Perspect. 2006;114: 24–28.
Wade, T.J., N. Pai, J.N.S. Eisenberg, J.M. Colford. Do U.S. Environmental Protection Agency water quality guidelines for recreational waters prevent gastrointestinal illness? A systematic review and meta-analysis. Environ Health Perspect. 2003;111: 1102–1109.
Wasserman, L. All of statistics: a concise course in statistical inference. Springer; 2004.
Yau, V.M., K.C. Schiff, B.F. Arnold, J.F. Griffith, J.S. Gruber, C.C. Wright, et al. Effect of submarine groundwater discharge on bacterial indicators and swimmer health at Avalon Beach, CA, USA. Water Res. 2014;59: 23–36.

Chapter 1: Epidemiology Surfer Health Study
35
VII. Supplemental Information
Sample Size Calculations The sample size for the study was developed in two stages because little was known about outcome or exposure prevalence in the surfer population. In year 1, we aimed to enroll 100-200 surfers and follow them for up to 12 weeks to collect exposure and illness information, as well as fecal indicator bacteria levels. Using exposure and outcome information from the initial, smaller cohort in year 1, we then calculated sample size and power for the full study and this informed enrollment targets for year 2.
During the first year of the study, we enrolled 162 individuals, from whom we measured 12 incident cases of gastrointestinal illness from 2,310 days at risk -- an incidence rate of 5 episodes per 1,000 person-days. We used a standard sample size equation for the comparison of two incidence rates (Hayes and Bennett 1999): y = (zα/2 + zβ)2 (λ0 + λ1) / (λ0 - λ1)2, where y is the number of person-days required in each exposure category, zα/2 and zβ are standard normal distribution values corresponding to upper tail probability values α/2 and β (we set α=0.05 and β=0.2), and λ0 and λ1 are incidence rates in the unexposed and exposed periods. Assuming a rate of 5 episodes per 1,000 person-days during unexposed periods (λ0=0.005), the Table on the next page summarizes the number of person-days of observation in each exposure group required to detect different magnitudes of effect, as measured by the incidence rate ratio (IRR).
In year 1 of the study, 55% of the days of observation were exposed because surfers entered the ocean frequently. However, only 13% of the days of observation were classified as wet weather exposure because it was a drought year. Given this, we expected that a total of 2,408 / 0.13 = 18,520 person-days of observation would be sufficient to detect an IRR of 1.50 or greater in wet weather exposed versus unexposed periods.
IRR Person-days of observation in each exposure group (y)
Total person-days required, assuming 13% of days are wet weather exposure (y / 0.13)
1.2 13,242 101,859
1.3 6,153 47,328
1.4 3,611 27,780
1.5 2,408 18,520
For associations between log10 Enterococcus and incident illness we used a simulation-based approach (Arnold et al. 2011). The simulation resampled the empirical distribution of water quality measurements from year 1 for 200 surfers with different lengths of follow-up and calculated a predicted probability of incident gastrointestinal illness on each day using the rate in the unexposed periods from year 1 and an increased rate following exposure that corresponded to different effect sizes. For a given strength of association (IRR), we then increased the length of follow-up until >80% of the 1,000 simulations had a P<0.05 (equivalent to α=0.05 and β=0.2). Simulations showed that that 3,000 days of follow-up matched to water quality indicator
Chapter 1: Epidemiology Surfer Health Study
36
measurements at sentinel beaches would provide >80% power to estimate an IRR of 1.75 or greater for a log10 increase in Enterococcus levels.
Comparison of gastrointestinal illness rates with summer cohorts
The present study used a different design that past recreational swimmer cohorts conducted in California (Arnold et al. 2016). Past swimmer cohorts enrolled beachgoers and then measured cumulative incident illness over 10-12 days after their single exposure. Such measurement was infeasible among surfers because of their frequent exposure (median of 2 times per week). For this reason, the present study estimated daily incidence rates during unexposed and exposed periods of follow-up -- the most natural measure of disease given the design. This difference in design and measure of illness complicates direct comparisons of illness between this study and past swimmer cohorts. A second difference in design that complicates direct comparison is that the present study limited enrollment to adults, whereas past swimmer cohorts included many children who have higher rates of gastrointestinal illness (Arnold et al. 2016).
We had access to participant data from four California swimmer cohorts (Arnold et al. 2016), and this enabled us to derive estimates of gastrointestinal illness rates from the past studies that were more comparable to those estimated in the surfer cohort. We subset the four California cohorts (Avalon, Doheny, Malibu, Mission Bay) to adults (18 years or older) and calculated incidence rates over the first 3 days of follow-up -- a period after exposure comparable to the present study. We calculated incidence rates separately for non-swimmers (individuals with no water contact) and swimmers with head immersion exposure. We compared these gastrointestinal incidence rates with rates among surfers during unexposed and exposed periods.
Supplemental Information References Arnold BF, Wade TJ, Benjamin-Chung J, Schiff KC, Griffith JF, Dufour AP, Weisberg SB, Colford JM. (2016) Acute gastroenteritis and recreational water: highest burden among young US children. Am J Public Health. Published online July 26, 2016.
Arnold B, Hogan D, Colford J, Hubbard A. (2011) Simulation methods to estimate design power: an overview for applied research. BMC Med Res Methodol. 2011;11: 94.
Hayes RJ, Bennett S. (1999) Simple sample size calculation for cluster-randomized trials. Int J Epidemiol. 1999;28: 319–326.
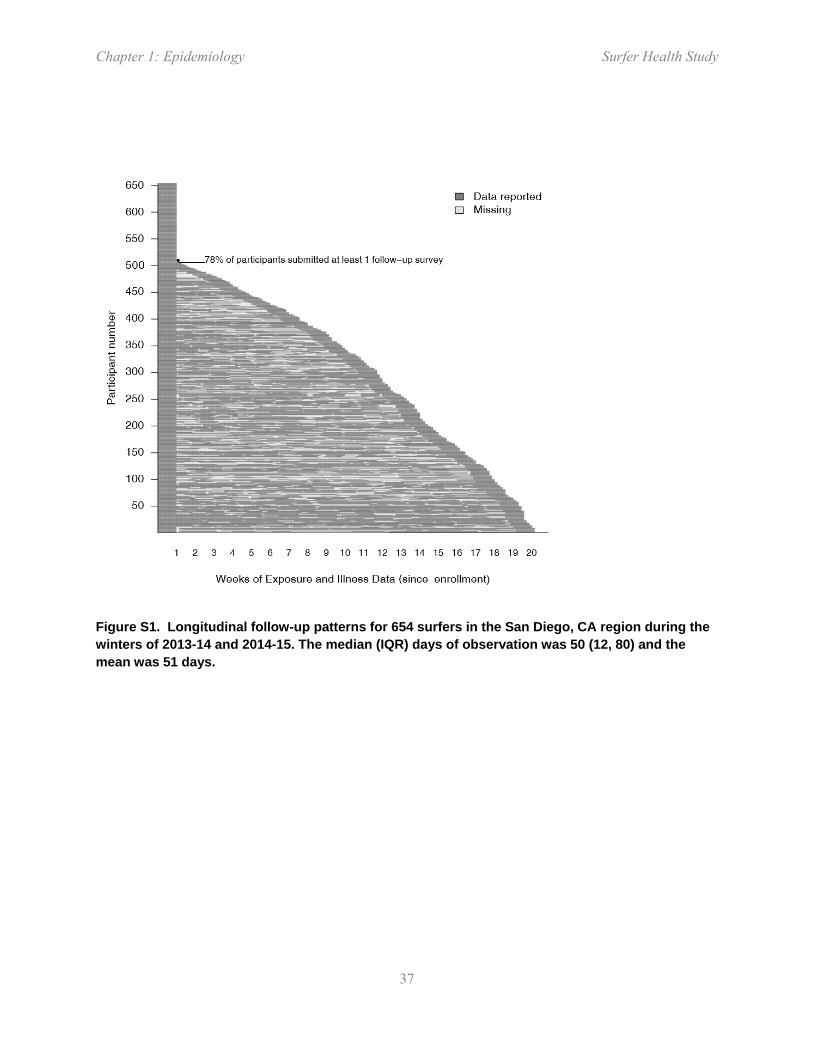
Chapter 1: Epidemiology Surfer Health Study
37
Figure S1. Longitudinal follow-up patterns for 654 surfers in the San Diego, CA region during the winters of 2013-14 and 2014-15. The median (IQR) days of observation was 50 (12, 80) and the mean was 51 days.

Chapter 1: Epidemiology Surfer Health Study
38
Figure S2. Surfer exposure during follow-up, summarized from 654 surfers (10,081 surf sessions) in the San Diego, CA region during the winters of 2013-14 and 2014-15. (a) Probability that surfers entered the ocean, stratified by days since precipitation >0.25 cm in 24 hours. Vertical lines indicate robust 95% confidence intervals and the dashed line marks the probability for >5 days after rain. (b) Distribution of ocean entry times. (c) Distribution of time spent in the ocean, rounded to hours.

Chapter 1: Epidemiology Surfer Health Study
39
Figure S3. Total surf days at the 13 most popular locations during follow-up, which represented 85% (8,518/10,081) of surf days observed in the study. Wet weather was defined as >0.25 cm of rain in 24 hours.
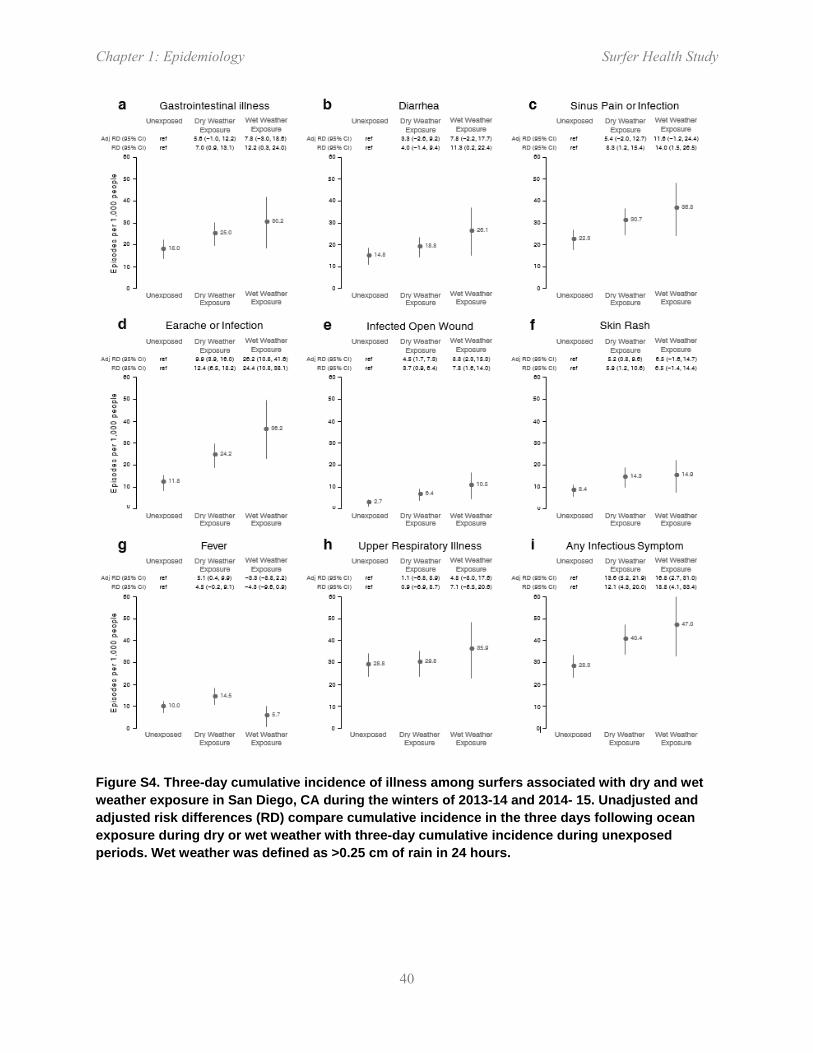
Chapter 1: Epidemiology Surfer Health Study
40
Figure S4. Three-day cumulative incidence of illness among surfers associated with dry and wet weather exposure in San Diego, CA during the winters of 2013-14 and 2014- 15. Unadjusted and adjusted risk differences (RD) compare cumulative incidence in the three days following ocean exposure during dry or wet weather with three-day cumulative incidence during unexposed periods. Wet weather was defined as >0.25 cm of rain in 24 hours.

Chapter 1: Epidemiology Surfer Health Study
41
Figure S5. Sensitivity analysis of wet weather exposure period definition on incidence rates illness among surfers in San Diego, CA during the winters of 2013-14 and 2014-15. Wet weather was defined as >0.25 cm of rain in 24 hours. Incidence rates for dry and wet weather were re-calculated for varying lengths of wet weather window. The primary analysis used a period of 0-3 days.
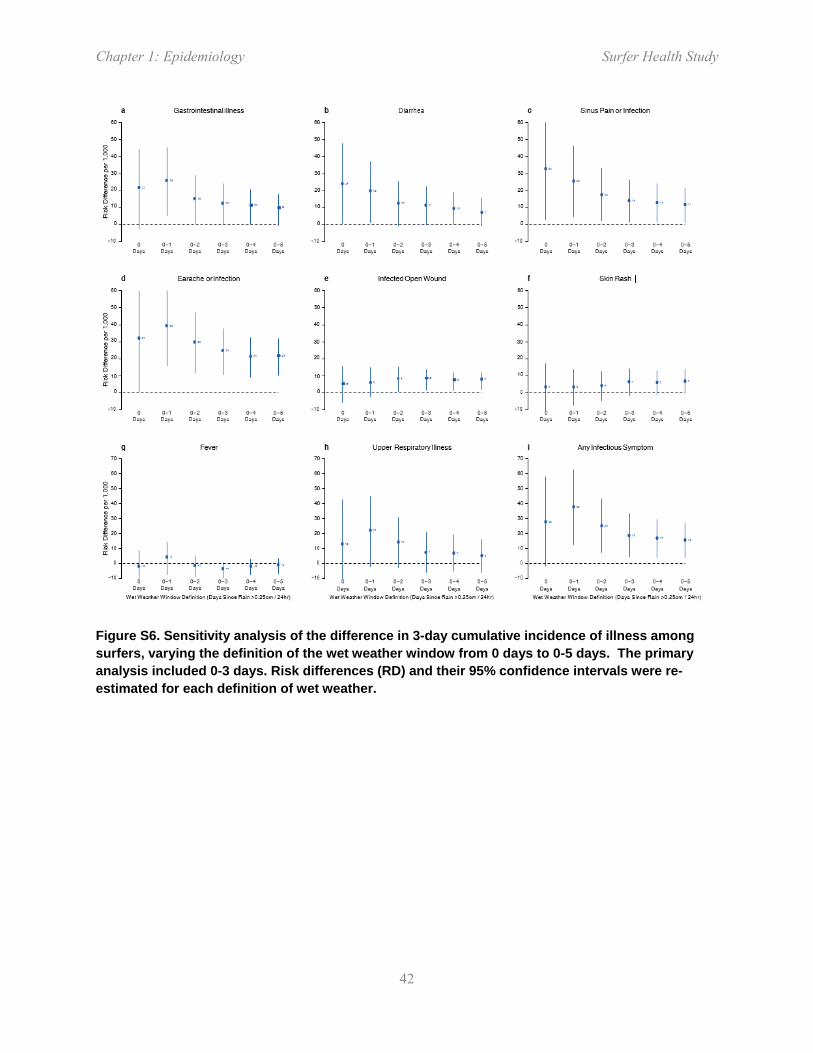
Chapter 1: Epidemiology Surfer Health Study
42
Figure S6. Sensitivity analysis of the difference in 3-day cumulative incidence of illness among surfers, varying the definition of the wet weather window from 0 days to 0-5 days. The primary analysis included 0-3 days. Risk differences (RD) and their 95% confidence intervals were re-estimated for each definition of wet weather.

Chapter 1: Epidemiology Surfer Health Study
43
Figure S7. Sensitivity analysis of incidence rates among surfers with wet weather periods further stratified by storm size in San Diego, CA during the winters of 2013-14 and 2014-15. Storm sizes based on storm rainfall totals: small (<2.5 cm), medium (2.5 - 4.9 cm) and large (>4.9 cm). Incidence rate ratios (IRR) calculated using unexposed periods as the reference group. Adjusted IRRs were not estimated due to small sample sizes in different storm strata.
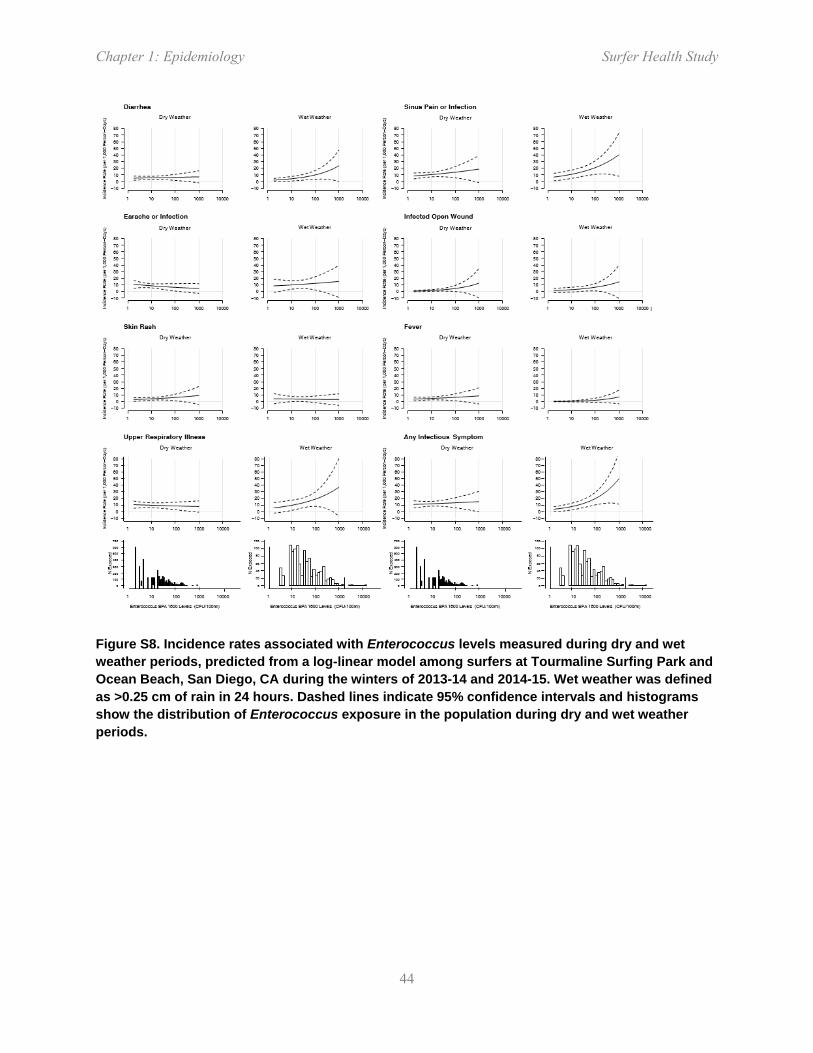
Chapter 1: Epidemiology Surfer Health Study
44
Figure S8. Incidence rates associated with Enterococcus levels measured during dry and wet weather periods, predicted from a log-linear model among surfers at Tourmaline Surfing Park and Ocean Beach, San Diego, CA during the winters of 2013-14 and 2014-15. Wet weather was defined as >0.25 cm of rain in 24 hours. Dashed lines indicate 95% confidence intervals and histograms show the distribution of Enterococcus exposure in the population during dry and wet weather periods.

Chapter 1: Epidemiology Surfer Health Study
45
Figure S9. Excess risk of gastrointestinal illness associated with Enterococcus levels measured during dry and wet weather periods, predicted from a log-linear model among surfers at Tourmaline Surfing Park and Ocean Beach, San Diego, CA during the winters of 2013-14 and 2014-15. Dashed lines indicate 95% confidence intervals and histograms show the distribution of Enterococcus exposure in the population during dry and wet weather periods.

Chapter 1: Epidemiology Surfer Health Study
46
Figure S10. Incidence rates of gastrointestinal (GI) illness per 1,000 person-days in the present study (denoted SHS) and four previous summer swimmer cohort studies conducted in California. Swimmer cohorts were limited to adults (18 years or older) and swimmers included those with head immersion exposure. Rates in the present study are presented overall (dry and wet weather periods) and stratified by dry and wet weather. Vertical lines mark 95% confidence intervals. Horizontal dashed lines mark the present study rates to facilitate comparison with other estimates. Mission Bay = Mission Bay, San Diego (Colford et al. 2007); Avalon = Avalon beach, Catalina island (Yau et al. 2014); Doheny = Doheny State Beach (Colford et al. 2012); Malibu = Malibu Surfrider State Beach (Arnold et al. 2013).

Chapter 1: Epidemiology Surfer Health Study
47
Table S1. Sensitivity analysis of incidence after dropping individuals with >1 survey per day and unknown surf locations.

Chapter 1: Epidemiology Surfer Health Study
48
Table S2. Incidence rate ratios (IRR) associated with fecal indicator bacteria among surfers exposed at Tourmaline Surfing Park and Ocean Beach in San Diego, CA during the winters of 2013-14 and 2014-15.

Chapter 1: Epidemiology Surfer Health Study
49
Table S3. Incidence rate ratios (IRR) associated with regulatory guideline values for Enterococcus, stratified by exposure during dry and wet weather, among surfers exposed at Tourmaline Surfing Park and Ocean Beach in San Diego, CA during the winters of 2013-14 and 2014-15.
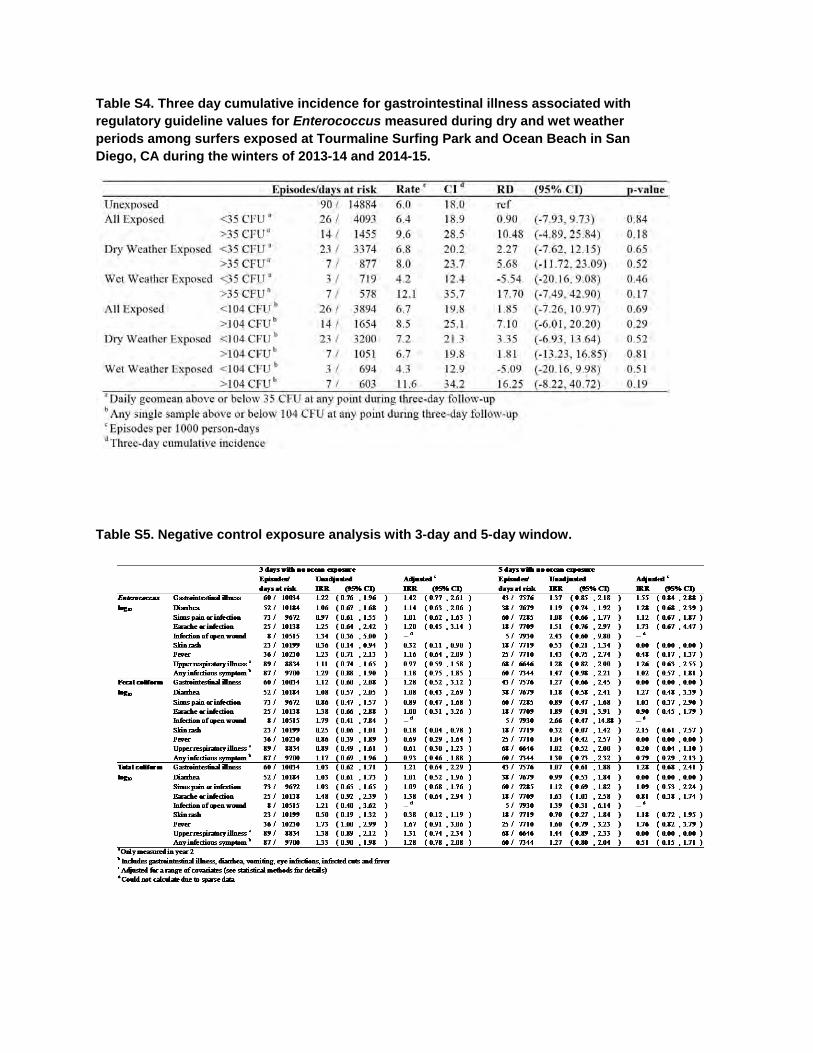
Table S4. Three day cumulative incidence for gastrointestinal illness associated with regulatory guideline values for Enterococcus measured during dry and wet weather periods among surfers exposed at Tourmaline Surfing Park and Ocean Beach in San Diego, CA during the winters of 2013-14 and 2014-15.
Table S5. Negative control exposure analysis with 3-day and 5-day window.
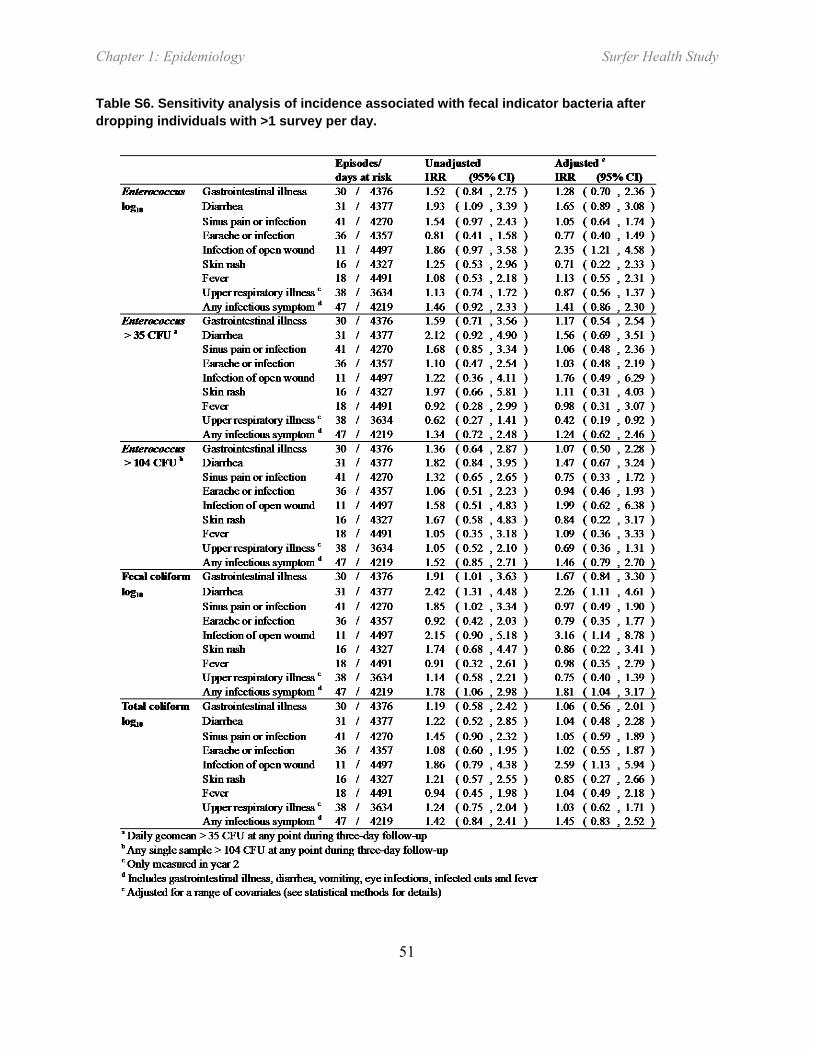
Chapter 1: Epidemiology Surfer Health Study
51
Table S6. Sensitivity analysis of incidence associated with fecal indicator bacteria after dropping individuals with >1 survey per day.

Chapter 1: Epidemiology Surfer Health Study
52

Chapter 2: Water Quality Surfer Health Study
53
CHAPTER 2: QUANTIFICATION OF PATHOGENIC VIRUSES AND BACTERIA, HOST
SOURCE MARKERS, AND FECAL INDICATOR BACTERIA IN STORMWATER
DISCHARGING TO SURFING BEACHES IN SAN DIEGO, CALIFORNIA
Joshua A. Steele1, John F. Griffith1, Rachel T. Noble2, and Kenneth C. Schiff1
1Southern California Coastal Water Research Project, Costa Mesa, CA 2UNC Institute of Marine Science, Morehead City, NC

Chapter 2: Water Quality Surfer Health Study
54
Acknowledgements
This study was funded by the City and County of San Diego. The authors thank the following for their invaluable contribution to the project: Southern California Coastal Water Research Project (Yiping Cao, Meredith Raith, Lucy Mao), University of North Carolina Chapel Hill (Denene Blackwood, Emelie Andersson), and the Microbiology Laboratory staff at the City of San Diego Laboratory (Laila Othman).
Chapter 2: Water Quality Surfer Health Study
55
I. Abstract
The concentrations of fecal indicator bacteria (FIB) used to measure microbial water quality in coastal waters typically increase following storm events at California beaches. FIB are measured because the bacterial and viral pathogens that are the presumed causes of illness in beachgoers exposed to stormwater have traditionally been difficult to measure. Here, we use droplet digital Polymerase Chain Reaction (digital PCR) and digital reverse transcriptase (digital RT-PCR) assays to increase sensitivity for direct quantification of pathogenic viruses and bacteria in stormwater discharges. We applied these assays across multiple storm events from two distinctly different types of watersheds draining to popular surfing beaches in San Diego, CA. Regardless of watershed or storm event size, discharges increased FIB concentrations at beaches, often by an order of magnitude or more following storm events. Multiple lines of evidence indicated the stormwater discharges contained human fecal contributions, despite the presence of separate storm sewer and sanitary sewer systems in both watersheds. Human source markers (up to 100% of samples quantified HF183) and human specific pathogens (up to 96% of samples quantified Norovirus) were routinely detected in stormwater discharges. Other human pathogens were also detected and quantified, including Campylobacter (< 100% of samples), Salmonella (< 25% of samples), and Adenovirus (< 22% of samples); no Enterovirus was detected in any stormwater discharge sample. Non-human sources were also routinely detected, including avian and canine source markers, which likely contributed FIB and some pathogens. For example, the stormwater discharge located immediately downstream of a large bird sanctuary had much greater avian source marker concentrations, greater Campylobacter concentrations, and different Campylobacter species composition than the watershed that had no bird sanctuary. This study, one of the few that directly measures several pathogens in stormwater discharges to marine beaches, helps demonstrate the utility of digital PCR technology in developing foundational exposure information for bathing water health risk assessments, such as epidemiology studies or quantitative microbial risk assessments (QMRA).

Chapter 2: Water Quality Surfer Health Study
56
II. Introduction
Coastal southern California receives >95% of its precipitation during the winter season, and 70% of the precipitation occurs between January and March (Ackerman and Weisberg 2003). Urban stormwater runoff in southern California (and elsewhere) is known to have large concentrations of fecal indicator bacteria (FIB) such as total and fecal coliforms and Enterococcus (Griffith et al. 2010, Schiff et al. 2001, Gannon and Busse 1989, Brownell et al. 2007, Tiefenthaler et al. 2011, Parker et al. 2010). The result is a consistent increase in FIB concentrations at marine bathing beaches following storm events (Ackerman and Weisberg 2003, Noble et al. 2003) and concerns about human health effects (Given et al. 2006), culminating in routine recreational body contact advisories from Public Health Departments for up to 72 hours following rain events (Thoe et al. 2014).
While monitoring FIB at marine beaches is useful for assessing public health risk because they are relatively easy and inexpensive to measure compared to actual pathogens, they do not cause illness. Instead, FIB co-occur with the pathogens found in human feces that may cause illness including viruses, pathogenic bacteria, or protists (Prüss 1998); however, the correlations between presence of FIB and actual human pathogens are unpredictable (Wu et al. 2011). This is especially important in southern California where storm drainage systems are separate from sanitary sewer systems, so there is no a priori expectation to find human pathogens in stormwater runoff. Instead, the FIB may come from other non-human host sources, including mammals (i.e., pets, feral animals or rodents), birds, or growth in the environment, all of which are thought to be less likely to cause illness than human fecal pollution (Soller et al. 2010).
New technological applications of droplet digital polymerase chain reaction (digital PCR) have enhanced the ability to measure genetic markers of host organisms and even the human specific pathogens that might be present in stormwater runoff (Cao et al. 2015). This information would greatly help beach managers address questions about health risk of body contact recreation, especially for recreational activities that occur during the winter, such as surfing. In southern California, surfers regularly enter the ocean following rain storms despite the well-advertised health risks by the public health departments because that is often when the best surf conditions occur.
The objective of this study was to measure FIB, genetic host markers, and human pathogens in stormwater using an array of culture and genetic methods, including digital PCR. We specifically selected two distinctly different watersheds that discharge to popular surfing beaches in San Diego, CA to assess how the results compare across the variation in land use and watershed size, as well as differences in storm size.

Chapter 2: Water Quality Surfer Health Study
57
III. Methods
A. Study Design and Water Sample Collection
The basic study design had two elements: ocean receiving waters and stormwater discharges. The ocean receiving water element focused exclusively on cultured FIB measurements, but was sampled at multiple sites at differing distances from the stormwater discharge point every day during the winter, rain or shine. In this way, we could measure the spatial and temporal influence of the stormwater discharges on the beach receiving water environment.
The stormwater discharge element focused on multiple microbial targets, but was limited to a single sampling location at the end of each watershed just before discharging to the beach, and exclusively during wet weather. Wet weather was defined to be consistent with the County of San Diego Public Health Department rain advisory; the day of rain > 2.54 mm (> 0.1 inch), plus 72 hours (3 days). The additional measurements (in addition to the same FIB measured in the ocean) included host specific genetic markers (human, avian, canine), somatic and F+ coliphage, viral pathogens (human Norovirus I and II, enterovirus, human adenovirus), and bacterial pathogens (Campylobacter, Salmonella).
1. Beaches
Daily ocean water samples were collected from January 15, 2014 to March 5, 2014 and from December 2, 2014 to March 31, 2015 at a total of six sites from two California beaches: Tourmaline Surfing Park (N=4) and Ocean Beach in San Diego, CA (N=2) (Figure 1). Water samples were collected in the morning (08:30 + 2 hrs), coinciding with most intense surfing activity. One-liter water samples were collected on incoming flow just below the water surface at 0.5-1.0 m depth in clean, pre-sterilized, and then sample-rinsed bottles. All samples were transported on ice in the dark to the laboratory for processing within 6-hour holding times.
2. Watersheds
Tourmaline Creek is a small highly urban watershed (Figure 1). The watershed is approximately 3.9 km2 and 89% developed land use, almost all of which is urban residential and commercial. The San Diego River is a much larger and more diverse watershed (Figure 1). In total, the San Diego River is 1,124 km2, but two major dams are located on this system, and neither dam discharged during the study period. The watershed area below the dams is 451 km2, and 64% is developed land use. The development is composed of urban residential, commercial and industrial land uses, with a relatively small proportion of agricultural area, especially in the lower floodplain. A bird sanctuary is located along the lower 1.5 km estuarine portion of the San Diego River.

Chapter 2: Water Quality Surfer Health Study
58
Figure 1. Map of (A) two popular surfing beaches in San Diego, CA with insets of (B) Tourmaline Surfing Park and (C) Ocean Beach showing study sampling locations, including stormwater discharges for Tourmaline Creek (TDIS) and San Diego River (OBDIS).
3. Discharges
Six storms were sampled from Tourmaline Creek and San Diego River immediately upstream from the Tourmaline Surfing Park and Ocean Beach, respectively (Figure 1). At the Tourmaline Creek site, sampling was initiated at the onset of flow because this channel was naturally dry without rain. At the San Diego River site, located in the estuary where ocean water was always present, sampling was initiated when salinity dropped below 22 parts-per-thousand (ppt), indicating freshwater had begun to mix in the estuary. At both sites, time-weighted composite samples were collected comprised of grab samples every 30 minutes until flow decreased below sampleable levels at Tourmaline Creek or above 22 ppt at San Diego River, or six hours had elapsed, whichever occurred first. If rainfall persisted after six hours, a second time-weighted composite was started to sample from 6 to 12 hours. At both sites, composite samples were collected in clean, pre-sterilized and site rinsed 20 L containers. In addition, at both discharge sites, 20 L grab samples were collected each day over the next three days consistent with the wet

Chapter 2: Water Quality Surfer Health Study
59
weather definition. Upon filling, all discharge samples were transported on ice in the dark to the laboratory for processing within the six-hour holding time.
4. Environmental Observations
Water temperature and salinity were measured at the time of sampling using a handheld YSI temperature and conductivity meter (YSI Pro30). Tidal data were taken at the NOAA observation station in Quivira Basin, San Diego (NOAA number TWC0413, 32.7667N, 117.2333W), located in between the two study beaches. Wind speed and direction were measured at the time of sampling. Observations were recorded at the time of sampling for wave height, number of surfers in the water, number of dogs on the beach, and number of birds on the beach or in the water.
B. Culture methods
1. FIB Membrane Filtration
For both beaches and stormwater discharges, Enterococcus, fecal coliforms, and total coliforms were measured using standard culture-based methods: EPA method 1600, Standard Methods 9222D and Standard method 9222B, respectively. All analyses met quality control objectives for absence of background contamination (blanks) and minimum precision (duplicates) of <10%.
2. Coliphage
For San Diego River and Tourmaline Creek stormwater discharge samples, F+RNA and somatic coliphage plaques were assayed using the single agar layer method USEPA 1601.
C. Genetic methods
1. Filtration for Bacteria and Viruses
To collect bacterial DNA, 100 ml of seawater or stormwater was filtered on 0.4 μm polycarbonate filters. The filters were flash frozen in liquid nitrogen and stored at -80°C until extraction. A filter blank was also collected for every sampling event as follows: autoclaved PBS solution was filtered, flash frozen in liquid nitrogen and stored at -80°C until extraction.
To collect viruses, an adsorption method using electronegative mixed cellulose ester filters was employed for both brackish and fresh stormwater samples (Katayama et al., Conn REF). Briefly, replicate samples of 500 ml of stormwater were adjusted to pH 3.5 using 20% HCl, and MgCl2
Chapter 2: Water Quality Surfer Health Study
60
was added to a final concentration of 25mM. The water was then immediately filtered onto Millipore type HA 0.45 μm nominal pore size filters. The filters were flash frozen in liquid nitrogen and stored at -80°C until extraction. A filter blank was also collected for every sampling event as follows: autoclaved PBS solution was adjusted to pH 3.5 using 20% HCl and MgCl2 was added to a final concentration of 25mM. The PBS was immediately filtered onto a type HA 0.45 μm (Millipore) filter, flash frozen in liquid nitrogen and stored at -80°C until extraction.
2. Extraction
Filters taken for bacterial DNA were extracted using commercial kits (DNA EZ MST1, GeneRite) following previously published methods (Cao et al. 2015, Boehm et al. 2013, Layton et al. 2013). Salmon testes DNA (Sketa) was added to the lysis buffer as an external extraction and inhibition control following previously published methods (EPA 1611). Extraction blanks, i.e., with only RNAse and DNAse free water and Sketa DNA, were performed contemporaneously with the sample extractions.
Virus filters were split, with each set extracted using commercial kits. Adenovirus was extracted using the MoBio PowerViral Environmental RNA/DNA Kit (MoBio) with additions of bead-beating, phenol:chloroform, and beta-mecaptoethanol according to the manufacturer’s instructions (Steele et al. 2016 in prep), and one set was extracted using a modified version of the Qiagen Viral RNA kit (Conn et al. 2012, Steele et al. 2016 in prep). Mouse lung RNA was added to each extraction in order to serve as carrier nucleic acids and as a combined extraction and inhibition control. Extraction blanks, i.e., with only RNAse and DNAse free water and mouse lung RNA, were performed contemporaneously with the sample extractions (Hruz et al. 2011). Extracts were separated into aliquots and frozen at -80°C. Aliquots were thawed once and immediately analyzed to avoid nucleic acid degradation by freeze-thaw cycles.
3. Digital PCR assays
Human, gull, and dog-associated source tracking markers, Campylobacter, Salmonella, human adenovirus, human Norovirus genotypes I and II, and pan-enterovirus were quantified using digital PCR assays. For each digital PCR assay, each 24 µl reaction setup contained 1X Droplet PCR Supermix (Bio-Rad), 6 µl of sample DNA, RNAse and DNAse free water (Ambion). Primer and probe sequences, fluors, and concentrations are listed in Table S1. The reaction mixture was combined with droplet generation oil (20 µl reaction mixture + 70 µl oil) via microfluidics in the Droplet Generator (Bio-Rad). Following droplet generation, the water-in-oil droplets were transferred using a multichannel pipettor to a standard 96-well PCR plate, which was heat sealed with foil plate seal (Bio-Rad) and placed on a Bio-Rad CFX96 thermocycler (ramping speed at 2.5 C per second) for PCR amplification. Amplification conditions for each assay are listed below. Upon completion of PCR, the plate was transferred to a Droplet Reader

Chapter 2: Water Quality Surfer Health Study
61
(Bio-Rad) for automatic measurement of fluorescence in each droplet in each well (approximately 2 min per well), with the RED (rare event detection) setting. In all cases, a minimum of two reactions and a total of ≥20,000 droplets were required to quantify a sample. At least five no template control (NTC) reactions and two positive control reactions were run per 96-well plate. A minimum of 2 extraction blanks and 2 filtration blanks were run per assay.
4. Source Tracking Markers
Molecular source tracking markers were quantified using previously published digital PCR assays or QPCR assays adapted to digital PCR as follows. Human-associated Bacteroidales and Enterococcus were measured using a duplex digital PCR assay following previously published protocol (Cao et al. 2015). Avian Catellicoccus markers were quantified via digital PCR by adapting a previously published QPCR assay (LeeSeaGull), one of two avian marker assays recommended by a large intercalibration study (Lee et al. 2012, Sinigalliano et al. 2013). Canine-associated Bacteroidales were quantified via digital PCR by adapting a previously published QPCR assay (DG3, Green et al. 2014). Primer and probe sequences used in these assays are described in detail in Table S1.
5. Bacterial Pathogens
Bacterial pathogens were quantified using digital PCR assays adapted from previously published QPCR assays as described in (Jothikumar et al. 2005, Gregory et al. 2006, da Silva et al. 2007). Briefly, Salmonella spp. were quantified via a duplex digital PCR assay adapted from QPCR assays targeting a gene found on the pathogenic island (invA; González-Escalona et al. 2009) and a broadly distributed tetrathiol reductase gene (ttrBCA; Malorny et al. 2004). Genus-wide Campylobacter spp. were quantified via a published digital PCR assay targeting the 16S rRNA gene (Cao et al. 2016, Lund et al. 2004). Species specific assays for Campylobacter were quantified via an optimized digital PCR based on previously published QPCR assays (LaGier et al. 2006, He et al. 2010, Vondrakova et al. 2014). Briefly, Campylobacter coli and Campylobacter jejuni were quantified via a duplex digital PCR assay adapted from a triplex QPCR assay targeting single-copy housekeeping genes for C. coli (glyA, LaGier et al. 2006, Vondrakova et al. 2014) and for C. jejuni (hipO; He et al. 2010, Vondrakova et al. 2014). Campylobacter lari was quantified via digital PCR assay adapted from a triplex QPCR assay targeting a single-copy housekeeping gene (pepT; He et al. 2010; Vondrakova et al. 2014). Primer and probe sequences and concentrations, and reaction conditions, used in these assays are described in detail in Table SI1.

Chapter 2: Water Quality Surfer Health Study
62
6. Viral Pathogens
Viral pathogens were quantified using digital PCR assays adapted from previously published quantitative PCR assays as follows. Human adenovirus was quantified via an optimized digital PCR assay adapted from a previously published QPCR assay (Jothikumar et al. 2005). Human Norovirus genogroups I and II were quantified using an optimized single step digital RT-PCR assay based on a previously published RT-QPCR assay (daSilva et al. 2007). Enterovirus gene copies were quantified using an optimized single step digital RT-PCR assay based on a previously published RT-QPCR assay (Gregory et al. 2006). Primer and probe sequences and concentrations, and reaction conditions, used in these assays are described in detail in Table SI1.
D. Statistical Analyses
The data analysis used a two-step approach, consistent with the two elements of the study design. The first step examines spatial distributions of FIB relative to the stormwater discharge location at both surfing beaches. The spatial distributions are contrasted in dry versus wet weather.
The second data analysis step examines different assay targets in stormwater discharges (in this order): human pathogens, human source markers, non-human source markers. Within each assay target, data analysis begins with detection frequency. For those assay target with sufficient detection frequency, geometric mean concentrations are compared between watersheds and among storm events. The test statistic for differences between watershed means was a Welch Two Sample, two-tailed t-test. Relationships of concentrations to storm event characteristics was based on Pearson’s correlation t-distribution of Spearman Rank correlations, depending upon homogeneity of variance. All statistics were estimated using R software version 3.2.2 (R Core Team 2015).
All data were transformed as the log10 of the measured concentrations. Samples that were below detection (nominally 3 copies), were assigned a value of 2 copies, preserving the information present in those samples below detection without substantially affecting the statistical analyses. Human norovirus genogroups I and II (GI and GII) were combined for statistical analyses. Digital PCR and digital RT-PCR quantifications were not adjusted for inhibition. For presenting the FIB, source tracking markers, and pathogen concentrations, the geometric mean was calculated as the arithmetic mean of the log10 transformed data for each storm event, and confidence intervals were presented as the standard error of the mean of the log10 transformed data. Grand geometric means for the season were calculated as the arithmetic mean of the individual storm geometric means.

Chapter 2: Water Quality Surfer Health Study
63
IV. Results
A. Sampling Success
In total, 1160 beach samples were collected for FIB analysis from Tourmaline Surfing Park and Ocean Beach; 67 stormwater discharge samples were collected during six storm events (Table 1) from Tourmaline Creek and San Diego River immediately upstream from the Tourmaline Surfing Park and Ocean Beach, respectively. This represents all but one storm during the sampling period that met our wet weather definition.
Table 1. Storm date, precipitation amounts, and what was measured in the stormwater discharge from each of the sampled events.
Storm Dates Precipitation in mm (inches)
Fecal Indicator Bacteria
Human Pathogens
Host Source Markers
Coliphage
2/28-3/5/2014 48.3 (1.9) X
12/2- 12/5/2014
64.3 (2.53) X X X
12/12- 12/15/2014
26.7 (1.05) X X X
3/1-3/4/2015 26.2 (1.03) X X X X
1/11- 1/14/2015
9.4 (0.37) X X X X
2/23- 2/26/2015
4.8 (0.19) X X X X
The sampled storm events ranged from 4.8 to 64.3 mm precipitation (Table 1), straddling the long-term average for single storm precipitation in the region (ca. 13 mm). Both of the sample years were below the long-term annual average rainfall (ca. 300-350 mm per year): 129 mm annual precipitation in October 2013-September 2014 water year and 303 mm annual precipitation in the October 2014-September 2015 water year (as measured at the San Diego Airport).
B. Beach FIB Concentrations
Regardless of beach, and regardless of which site at either beach, wet weather concentrations of Enterococcus were higher during wet weather than during dry weather (Figure 2). At Ocean Beach, there was a decreasing gradient of Enterococcus concentrations from sites closest to the

Chapter 2: Water Quality Surfer Health Study
64
wet weather discharge to sites furthest from the discharge. At Tourmaline Surfing Park, where surf zone mixing is less distinct, the gradient in Enterococcus concentrations between sites was less distinct.
Figure 2. Box plots1 of cultured Enterococcus concentrations in wet2 versus dry weather at (A) Tourmaline Surfing Park and (B) Ocean Beach3 during the 2013-14 and 2014-15 wet season. 1 Boxes represent median, 25 and 75 percentile, 3 times the standard deviation, and individual outlier samples. 2 Wet weather defined by the County Health Department as >2.5 mm precipitation in 24 hr plus three days.
3 See Figure 1 for sampling site locations.

Chapter 2: Water Quality Surfer Health Study
65
C. Stormwater Discharges
1. Human Pathogens
The pathogen detection frequency in stormwater varied among the different pathogens measured in discharges from San Diego watersheds (Table 2). Norovirus was the most commonly detected virus. All but one sample contained Norovirus in the San Diego River stormwater discharges, and three-quarters of the discharge samples contained Norovirus in Tourmaline Creek. Of the two strains measured, Norovirus II dominated the detection frequency in San Diego stormwater discharge samples. In contrast, Enterovirus was not detected in any stormwater discharge sample. Adenovirus was only marginally detected, being quantified in roughly one of five stormwater discharge samples from San Diego River and nearly one of ten samples from Tourmaline Creek.
Table 2. Pathogen and source marker detection frequency by watershed
Proportion of Samples Above Detection Limit
San Diego River
(N=23)
Tourmaline Creek
(N=21)
PATHOGENS
Norovirus 0.96 0.72
Norovirus I 0.09 0.05
Norovirus II 0.96 0.72
Adenovirus 0.22 0.09
Enterovirus 0.00 0.00
Campylobacter sp. 1.00 0.45
C. coli 0.87 0.10
C. jejuni 0.17 0.29
C. lari 0.78 0.48
Salmonella 0.25 0.10
SOURCE MARKERS
Human (HF183) 1.00 0.95
Somatic Coliphagea 1.00 1.00
F+ Coliphagea 0.62 0.38
Avian (LeeSeagull) 1.00 0.83
Canine (DG3) 0.83 0.57 a N=13 from both watersheds

Chapter 2: Water Quality Surfer Health Study
66
Campylobacter was the most commonly detected bacterial pathogen (Table 2). Every stormwater discharge sample from San Diego River detected Campylobacter, but just less than half of the discharge samples detected Campylobacter in Tourmaline Creek. Salmonella was detected in only one-quarter and one-tenth of the stormwater discharge samples from the San Diego River and Tourmaline Creek, respectively.
The two watersheds differed in their detection frequency among Campylobacter species (Table 2). C. coli (87%) and C. lari (78%) were the most frequently detected species of Campylobacter in stormwater discharges from the San Diego River. In contrast, C. lari (48%) was the most commonly detected species of Campylobacter in Tourmaline Creek.
1.1. Norovirus Concentrations
Norovirus geometric mean concentrations in stormwater discharges from the San Diego River were significantly greater than Tourmaline Creek (Figure 3; geometric means by storm t=2.4, p=0.049; all concentrations, t=2.5 p=0.02). Across all five storms, geometric mean Norovirus concentrations ranged from 41.8 to 175.6 gene copies per 100 ml in San Diego River stormwater discharges (grand geometric mean 111.4 gene copies per 100 ml). Tourmaline Creek stormwater discharge geometric mean concentrations ranged from 5.2 to 110.9 gene copies per 100 ml (grand geomean 33.9 gene copies per 100 ml). There was no relationship between storm size and Norovirus concentration in either watershed (all p-values > 0.15).

Chapter 2: Water Quality Surfer Health Study
67
Figure 3. Norovirus concentrations measured by digital PCR in stormwater discharges from San Diego River and Tourmaline Creek during multiple storm events of the 2013-14 and 2014-15 storm seasons.
1.2. Campylobacter Concentrations
Overall, Campylobacter concentrations were higher in stormwater discharges from the San Diego River than Tourmaline Creek (Figure 4). Presumably, this was largely due to the presence of C. coli and C. lari. Concentrations of C. coli in stormwater discharges from San Diego River ranged from 23.4 to 116.2 (grand geometric mean 61.4) gene copies per 100 ml, while C. coli concentrations in stormwater discharges from Tourmaline Creek ranged from 3.0 to 5.33 (grand geometric mean 3.7) gene copies per 100 ml. Likewise, concentrations of C. lari in stormwater discharges from San Diego River ranged from 15.2 to 30.9 (grand geometric mean 18.7) gene copies per 100ml, while C. lari concentrations in stormwater discharges from Tourmaline Creek ranged from 3.8 to 7.2 (grand geometric mean 4.7) gene copies per 100 ml.
Storm Number
1 2 3 4 5
Log
Nor
oviru
s co
pies
/100
mL
(+ S
E)
0.0
0.5
1.0
1.5
2.0
2.5
3.0 San Diego RiverTourmaline Creek

Chapter 2: Water Quality Surfer Health Study
68
Figure 4. Concentrations of Campylobacter coli, Campylobacter jejuni, and Campylobacter lari measured by digital PCR in stormwater discharges from (A) Tourmaline Creek and (B) San Diego River. BD=below detection limit.
1 2 3 4 5
Log
copi
es/1
00 m
L (+
SE)
0
1
2
3
B)
A)
BDBD
Storm Number
1 2 3 4 5
Log
copi
es/1
00 m
L (+
SE)
0
1
2
3C. coliC. jejuniC. lari
BD BD
BD BD
Chapter 2: Water Quality Surfer Health Study
69
The concentrations of C. jejuni were much more comparable between watersheds. Concentrations of C. jejuni in stormwater discharges from San Diego River ranged from below detection to 8.0 (grand geometric mean 3.5) gene copies per 100 ml, while C. jejuni concentrations in stormwater discharges from Tourmaline Creek ranged from below detection to 11.36 (grand geometric mean 5.0) gene copies per 100 ml.
2. Human Source Markers
Consistent with the frequent presence of human pathogens, the presence of the human source marker HF183 was also frequent (Table 2). HF183 was detected in every stormwater discharge sample from the San Diego River and nearly every sample from Tourmaline Creek. Similarly, Somatic coliphage was detected in every sample from both stormwater discharges. F+ coliphage was detected at a decreased frequency, roughly two-thirds of the samples from San Diego River and one-third of the samples from Tourmaline Creek (Table 2). Neither San Diego River nor Tourmaline Creek has an NPDES permit for discharge from a publicly owned wastewater treatment plant.
The concentrations of HF183 in stormwater discharges were significantly greater in Tourmaline Creek compared to the San Diego River (Figure 5; t=3.08, p= 0.004). Geometric mean concentrations of HF183 ranged from 19.5 to 175.1 (grand geometric mean 82.4) gene copies per 100ml in stormwater discharges from the San Diego River, and 281.6 to 904.4 (grand geometric mean 525.5) gene copies per 100ml in stormwater discharges from Tourmaline Creek. There was no relationship of HF183 concentrations to storm size in either watershed (all p-values >0.1).
3. Non-human Source Markers
Like the human source markers, non-human source markers were also detected frequently in San Diego stormwater discharges (Table 2). The avian source marker was detected more frequently in the stormwater discharge from the San Diego River than Tourmaline Creek (100% vs. 83%, respectively). The estuary of the San Diego River upstream of the sample site is a protected bird sanctuary. Similarly, the canine source marker was detected more frequently in the stormwater discharge from the San Diego River than Tourmaline Creek (83% vs. 57%, respectively). Both watersheds have large residential land use components.
There were significant differences in concentrations of avian markers and apparent, but not statistically significant, differences in concentrations of canine markers in stormwater discharges between the San Diego River and Tourmaline Creek (Figure 5; Gull: t=12.2 p <0.001; Dog: t=1.8, p=0.08). However, the concentration patterns of the non-human markers were opposite the human marker. Geometric mean concentrations of avian markers were two orders of magnitude
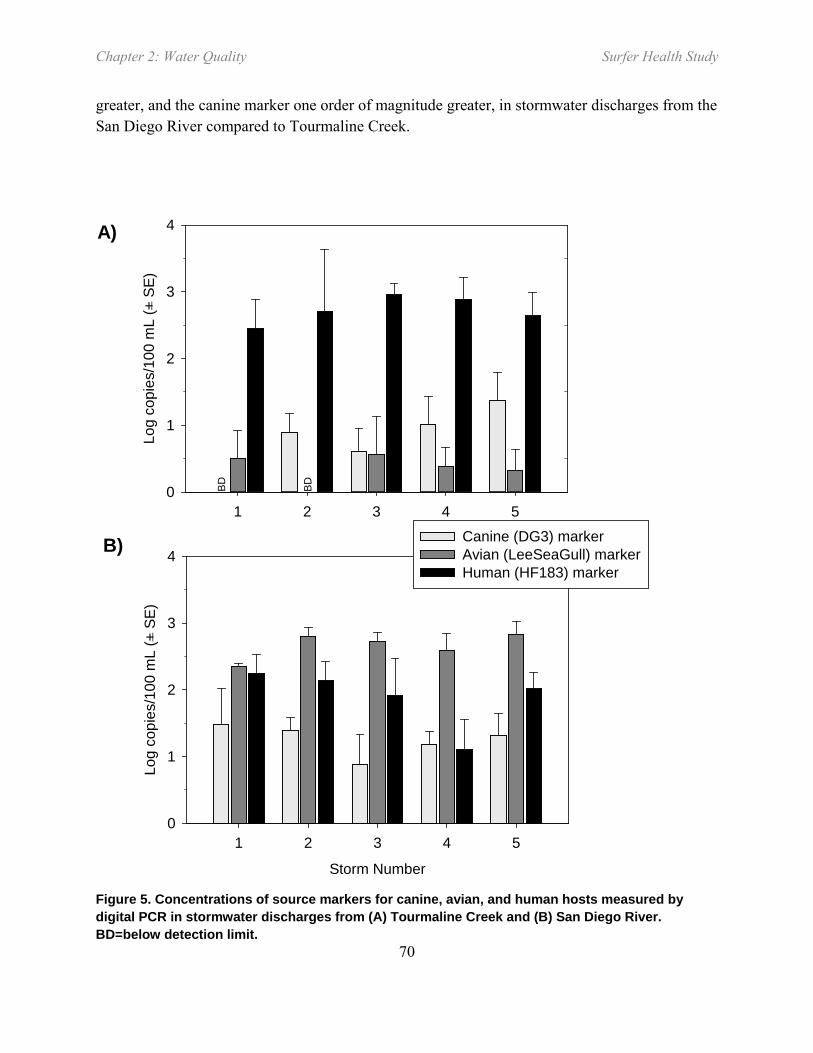
Chapter 2: Water Quality Surfer Health Study
70
greater, and the canine marker one order of magnitude greater, in stormwater discharges from the San Diego River compared to Tourmaline Creek.
Figure 5. Concentrations of source markers for canine, avian, and human hosts measured by digital PCR in stormwater discharges from (A) Tourmaline Creek and (B) San Diego River. BD=below detection limit.
1 2 3 4 5
Log
copi
es/1
00 m
L (+
SE)
0
1
2
3
4
B)
A)
BDBD
Storm Number
1 2 3 4 5
Log
copi
es/1
00 m
L (+
SE)
0
1
2
3
4Canine (DG3) markerAvian (LeeSeaGull) markerHuman (HF183) marker

Chapter 2: Water Quality Surfer Health Study
71
4. Inhibition
Only 5% of San Diego River and 10% of Tourmaline Creek stormwater discharge samples were inhibited for DNA-based digital PCR, and these samples showed minimal inhibition as measured using spikes of salmon testes DNA (Figure 6). In contrast, 100% of samples from both watersheds were at least partially inhibited for digital RT-PCR, as measured using spikes of mouse lung RNA. Inhibition ranged from 100% to 67% (Figure 6) and was not correlated to concentration (Fig SI-1; r2 <0.014; p>0.10).
Figure 6. Percent recovery of pre-extraction control spikes of mouse lung Beta-actin RNA (for RNA targets) and salmon testes DNA (for DNA targets) control material. Loss is likely due to inhibition during the RT process.
RNA DNA
Perc
ent R
ecov
ery
0
20
40
60
80
100
120
Chapter 2: Water Quality Surfer Health Study
72
V. Discussion
Stormwater discharges had a dramatic impact on FIB concentrations at the study beaches in San Diego. The FIB concentrations at the beach sites closest to the discharge locations increased an order of magnitude between wet weather and dry weather. This increase occurred consistently across storms and across watersheds, and this trend is not limited to just the two San Diego beaches in this study. Similarly dramatic increases were observed at most other beaches in southern California (Noble et al 2003). What cannot be discerned from the increased contributions of FIB from stormwater is whether the sources of FIB in stormwater were primarily human or non-human.
Multiple lines of evidence presented here pointed towards human fecal contamination in San Diego wet weather discharges, despite the municipal storm sewer system being separate from the sanitary sewer system. First, there was consistent detection, and in relatively high concentrations, of the human source marker HF183. HF183 is known to be both sensitive and specific to human sources of fecal contamination (Boehm et al. 2013, Layton et al. 2013). Second, there was consistent detection, and in relatively high concentrations, of human specific pathogens such as Norovirus. Norovirus is one of the primary etiologic agents of swimming associated gastrointestinal illness in the United States (Teunis et al. 2008, Mead et al. 1999, Scallan et al. 2011).
There were also non-human FIB contributions. Clearly, one non-human source of FIB was avian based on the ubiquity of avian source marker detections. The concentration of the avian marker was greater in the San Diego River stormwater discharge than the Tourmaline Creek discharge, which is consistent with the presence of a bird sanctuary located immediately upstream of the San Diego River sampling location. This is also consistent with the increased frequency of detection, increased concentrations, and greater abundance of Campylobacter lari in the San Diego River stormwater discharge samples compared to the Tourmaline discharge. Campylobacter is a known pathogen to be found in marine birds, including seagulls (Lu et al. 2011). Canine source marker was also found consistently, but not ubiquitously in both watersheds. Both avian and canine hosts have the capacity to contribute large quantities of FIB to runoff sources (Sinigilliano et al. 2013, Schriewer et al. 2013).
We employed a new technology for quantification of pathogens and source markers by molecular assays: digital PCR. Digital PCR performs a quantitative PCR reaction for DNA-based assays or a quantitative reverse transcriptase-PCR reaction for RNA-based assays by partitioning the PCR reaction into tens of thousands of individual nanoliter-sized droplets (Huggett et al. 2013, Cao et al. 2015, 2016). While the primers and probes are nearly identical between traditional QPCR and digital PCR, the partitioning allows for absolute quantification via poisson statistics, while at the same time substantially increasing the sensitivity over traditional QPCR (our detection limit was 3 molecular targets). Finally, the nanoliter partitioning of the
Chapter 2: Water Quality Surfer Health Study
73
digital PCR reaction mixture provides robustness to inhibitory substances such as humic acids (Cao et al. 2015, 2016), and we observed essentially no inhibition of DNA targets. All three issues – quantification, sensitivity, inhibition – are major reasons why pathogens have so rarely been measured in stormwater discharges in the past. Nonetheless, stormwater is still a difficult matrix, especially for the reverse transcriptase steps associated with RNA targets. Even with digital RT-PCR, we still experienced inhibition in most San Diego stormwater samples. However, the increased sensitivity of digital RT-PCR particularly helped when using dilution to overcome inhibition and, when detected, digital RT-PCR enabled the quantification of RNA targets rarely seen in previous studies when using QPCR (Noble et al. 2006, Sidu et al. 2011). Ultimately, we chose not to adjust results for inhibition, but reported the results directly as a conservative but precise measure of the marker and pathogen concentration in stormwater.
Size of watershed and size of storm played little role in water quality of the stormwater discharge. This could be, in part, due to small sample size. With additional storms, a more pronounced pattern could have emerged. Instead, it appeared that host source strength played a more important role in the water quality patterns observed during wet weather. For example, avian source marker and Campylobacter species assemblages differed between watersheds, likely due to the bird sanctuary on one of the watersheds, but not the other. In contrast, there was little difference between watersheds or storm events in detection of human specific virus, which suggests the strength of the human sources was similar.
The type of information in this type of study is critical for human health risk assessments and public health policy discussions for beaches impacted by stormwater runoff. The new technology afforded by digital PCR for direct pathogen and source marker measurements directly addresses exposure. In fact, the beach data from this study were used to support the exposure component an epidemiology study of beach users (surfers) at the two beaches in San Diego (see epidemiology chapter). Additionally, the stormwater discharge water quality measurements, in combination with the beach water quality measurements, were used for the dose component of the quantitative microbial risk assessment (QMRA) conducted at the two study beaches (see Chapter 3: QMRA). In combination, these studies can be used by beach managers to make decisions about public health and water quality management.
Chapter 2: Water Quality Surfer Health Study
74
VI. References
Ackerman, D., S.B. Weisberg. 2003. Relationship between rainfall and beach bacterial concentrations on Santa Monica Bay beaches. Journal of Water and Health 01(2): 85-89.
Boehm, A.B., L.C. Van De Werfhorst, J.F. Griffith, P.A. Holden, J.A. Jay, O.C. Shanks, D. Wanga, S.B. Weisberg. 2013. Performance of forty-one microbial source tracking methods: A twenty-seven lab evaluation study. Water Research doi:47:6812-6828
Brownell, M.J., V.J. Harwood, R.C. Kurz, S.M. McQuaig, J. Lukasik, T.M. Scott. 2007. Confirmation of putative stormwater impact on water quality at a Florida beach by microbial source tracking methods and structure of indicator organism populations. Water Research, 41(16), pp.3747-3757.
Cao, Y., M.R. Raith, J.F. Griffith. 2015. Droplet digital PCR for simultaneous quantification of general and human-associated fecal indicators for water quality assessment. Water Research 70:337–349
da Silva AK, Le Saux JC, Parnaudeau S, Pommepuy M, Elimelech M, Le Guyader FS. 2007. Evaluation of Removal of Noroviruses during Wastewater Treatment, Using Real-Time Reverse Transcription-PCR: Different Behaviors of Genogroups I and II. Applied and Environmental Microbiology 73:7891–7897
Gannon, J.J., M.K. Busse. 1989. E. coli and enterococci levels in urban stormwater, river water and chlorinated treatment plant effluent. Water Research, 23(9), pp.1167-1176.
Given, S., L.H. Pendleton, A.B. Boehm. 2006. Regional public health cost estimates of contaminated coastal waters: a case study of gastroenteritis at Southern California beaches. Environmental Science & Technology, 40(16), pp.4851-4858.
Gregory JB, Litaker RW, Noble RT (2006) Rapid One-Step Quantitative Reverse Transcriptase PCR Assay with Competitive Internal Positive Control for Detection of Enteroviruses in Environmental Samples. Applied and Environmental Microbiology 72:3960–3967
Griffith, J.F., K.C. Schiff, G.S. Lyon, J.A. Fuhrman. 2010. Microbiological water quality at non-human influenced reference beaches in southern California during wet weather. Marine Pollution Bulletin 60:500-508.
He, Y., Yao, X., Gunther, N.W., Xie, Y., Tu, S.-I., and Shu, S.X. 2010. Simultaneous Detection and Differentiation of Campylobacter jejuni, C. coli, and C. lari in Chickens Using a Multiplex Real-Time PCR Assay. Food Anal Methods 3:321–329.
Hruz, T., M. Wyss, M. Docquier, M.W. Pfaffl, S. Masanetz, L. Borghi, P. Verbrugghe, L. Kalaydjieva, S. Bleuler, O. Laule, P. Descombes, W. Gruissem, P. Zimmermann. 2011.

Chapter 2: Water Quality Surfer Health Study
75
RefGenes: identification of reliable and condition specific reference genes for RT-qPCR data normalization. BMC Genomics 12: 156–14. http://doi.org/10.1186/1471-2164-12-156
Jothikumar N, Cromeans TL, Hill VR, Lu X, Sobsey MD, Erdman DD (2005) Quantitative Real-Time PCR Assays for Detection of Human Adenoviruses and Identification of Serotypes 40 and 41. Applied and Environmental Microbiology 71:3131–3136
LaGier MJ, Joseph LA, Passaretti TV, Musser KA, Cirino NM (2004) A real-time multiplexed PCR assay for rapid detection and differentiation of Campylobacter jejuni and Campylobacter coli. Molecular and Cellular Probes 18:275–282
Lu, J., H. Ryu, J.W. Santo Domingo, J.F. Griffith, N. Ashbolt. 2011. Molecular detection of Campylobacter spp. in California gull (Larus californicus) excreta. Applied and Environmental Microbiology 77:5034-5039
Lund M, Nordentoft S, Pedersen K, Madsen M (2004) Detection of Campylobacter spp. in Chicken Fecal Samples by Real-Time PCR. Journal of Clinical Microbiology 42:5125–5132
Malorny B, Lofstrom C, Wagner M, Kramer N, Hoorfar J (2008) Enumeration of Salmonella Bacteria in Food and Feed Samples by Real-Time PCR for Quantitative Microbial Risk Assessment. Applied and Environmental Microbiology 74:1299–1304
Mead, P.S., L. Slutsker, V. Dietz, L.F. McCaig, J.S. Bresee, C. Shapiro, P.M. Griffin, R.V. Tauxe. 1999. Food related illness and death in the United States. Emerging Infectious Diseases 5(5): 607-625.
Noble R.T., S.B. Weisberg, M.K. Leecaster, C.D. McGee, J.H. Dorsey, P. Vainik, V. Orozco-Borbon. 2003. Storm effects on regional beach water quality along the southern California shoreline. Journal of Water and Health 1:23-31.
Noble, R.T., J.F. Griffith, A.D. Blackwood, J.A. Fuhrman, J.B. Gregory, X. Hernandez, X. Liang, A.A. Bera, K.D. Schiff. 2006. Multitiered approach using quantitative PCR to track sources of fecal pollution affecting Santa Monica Bay, California. Applied and Environmental Microbiology, 72:1604-1612.
Parker, J.K., D. McIntyre, R.T. Noble. 2010. Characterizing fecal contamination in stormwater runoff in coastal North Carolina, USA. Water Research 44(14):4186-4194.
Prüss, A. 1998. Review of epidemiological studies on health effects from exposure to recreational water. Int J Epidemiol 27(1): 1-9.
R Core Team. 2015. R: A language and environment for statistical computing. R Foundation for Statistical Computing, Vienna, Austria. URL https://www.R-project.org/.

Chapter 2: Water Quality Surfer Health Study
76
Scallan, E., R.M. Hoekstra, F.J. Angulo, R.V. Tauxe, M.A. Widdowson, S.L. Roy, J.L. Jones, P.M. Griffin. 2011. Foodborne illness acquired in the United States--major pathogens. Emerging Infectious Diseases 17(1): 7-15.
Schiff, K., P. Kinney. 2001. Tracking sources of bacterial contamination in stormwater discharges to Mission Bay, California. Water Environment Research 73:534-542
Schriewer, A., K.D. Goodwin, C.D. Sinigalliano, A.M. Cox, D. Wanless, J. Bartkowiak, D.L. Ebentier, K.T. Hanley, J. Ervin, L.A. Deering, O.C. Shanks, L.A. Peed, W.G. Meijer, J.F. Griffith, J. SantoDomingo, J.A. Jay, P.A. Holden, S. Wuertz. 2013. Performance evaluation of canine-associated Bacteroidales assays in a multi-laboratory comparison study. Water Research 47:6909-6920.
Sinigalliano, C.D., J. Ervin, L.C. Van De Werfhorst, B.D. Badgley, E. Ballesté, J. Bartkowiak, A.B. Boehm, M. Byappanahalli, K.D. Goodwin, M. Gourmelon, J.F. Griffith, P.A. Holden, J.A. Jay, B.A. Layton, C. Lee, J. Lee, W.G. Meijer, R. Noble, M. Raith, H. Ryu, M.J. Sadowsky, A. Schriewer, D. Wang, D. Wanless, R.L. Whitman, S. Wuertz, J.W. Santo Domingo. 2013. Multi-laboratory evaluations of the performance of Catellicoccus marimammalium PCR assays developed to target gull fecal sources. Water Research 47:6883-6896
Soller, J.A., M.E. Schoen, T. Bartrand, J. Ravenscroft, N.J. Ashbolt. 2010. Estimated human health risks from exposure to recreational waters impacted by human and non-human sources of faecal contamination. Water Research 44(16): 4674-4691.
Tiefenthaler, L., E.D. Stein, K.C. Schiff. 2011. Levels and patterns of fecal indicator bacteria in stormwater runoff from homogenous land use sites and urban watersheds. Journal of Water and Health, 9(2), pp.279-290.
Thoe, W., M. Gold, A. Griesbach, M. Grimmer, M.L. Taggart, A.B. Boehm. 2014. Predicting water quality at Santa Monica Beach: evaluation of five different models for public notification of unsafe swimming conditions. Water Research 67:105-117.
Teunis, P.F., C.L. Moe, P. Liu, L. Lindesmith, R.S. Baric, J. Le Pendu, R.L. Calderon. 2008. Norwalk virus: How infectious is it? Journal of Medical Virology 80(8): 1468-1476.
Vondrakova L., Pazelrova, J., Demnerova, K. 2014. Detection, identification and quantification of Campylobacter jejuni, coli and lari in food matrices all at once using multiplex qPCR. Gut Pathogens 6:12, doi: 10.1186/1757-4749-6-12).
Wu, J., S.C. Long, D. Das, S.M. Dorner. 2011. Are microbial indicators and pathogens correlated? A statistical analysis of 40 years of research. Journal of Water and Health 9:265-78.
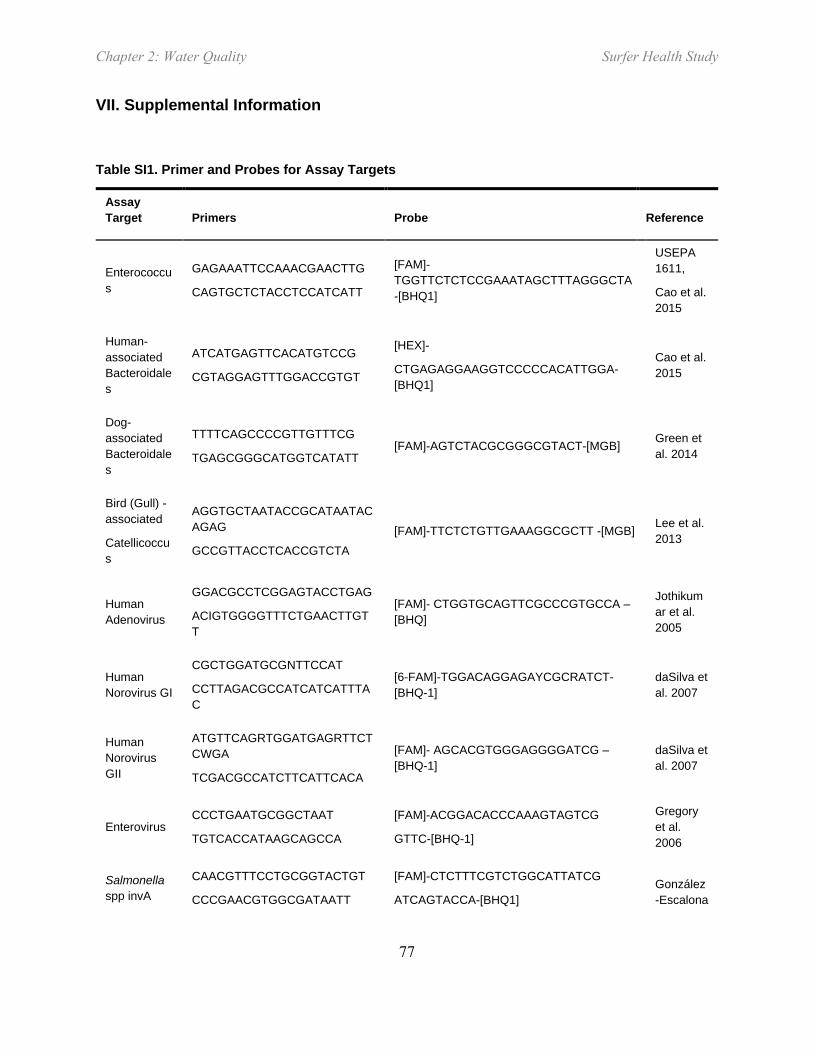
Chapter 2: Water Quality Surfer Health Study
77
VII. Supplemental Information
Table SI1. Primer and Probes for Assay Targets
Assay Target Primers Probe Reference
Enterococcus
GAGAAATTCCAAACGAACTTG
CAGTGCTCTACCTCCATCATT
[FAM]-TGGTTCTCTCCGAAATAGCTTTAGGGCTA-[BHQ1]
USEPA 1611,
Cao et al. 2015
Human-associated Bacteroidales
ATCATGAGTTCACATGTCCG
CGTAGGAGTTTGGACCGTGT
[HEX]-
CTGAGAGGAAGGTCCCCCACATTGGA-[BHQ1]
Cao et al. 2015
Dog-associated Bacteroidales
TTTTCAGCCCCGTTGTTTCG
TGAGCGGGCATGGTCATATT [FAM]-AGTCTACGCGGGCGTACT-[MGB] Green et
al. 2014
Bird (Gull) - associated
Catellicoccus
AGGTGCTAATACCGCATAATACAGAG
GCCGTTACCTCACCGTCTA [FAM]-TTCTCTGTTGAAAGGCGCTT -[MGB] Lee et al.
2013
Human Adenovirus
GGACGCCTCGGAGTACCTGAG
ACIGTGGGGTTTCTGAACTTGTT
[FAM]- CTGGTGCAGTTCGCCCGTGCCA –[BHQ]
Jothikumar et al. 2005
Human Norovirus GI
CGCTGGATGCGNTTCCAT
CCTTAGACGCCATCATCATTTAC
[6-FAM]-TGGACAGGAGAYCGCRATCT-[BHQ-1]
daSilva et al. 2007
Human Norovirus GII
ATGTTCAGRTGGATGAGRTTCTCWGA
TCGACGCCATCTTCATTCACA
[FAM]- AGCACGTGGGAGGGGATCG –[BHQ-1]
daSilva et al. 2007
Enterovirus CCCTGAATGCGGCTAAT
TGTCACCATAAGCAGCCA
[FAM]-ACGGACACCCAAAGTAGTCG
GTTC-[BHQ-1]
Gregory et al. 2006
Salmonella spp invA
CAACGTTTCCTGCGGTACTGT
CCCGAACGTGGCGATAATT
[FAM]-CTCTTTCGTCTGGCATTATCG
ATCAGTACCA-[BHQ1] González-Escalona

Chapter 2: Water Quality Surfer Health Study
78
Assay Target Primers Probe Reference
et al. 2009
Salmonella spp. ttr
CTCACCAGGAGATTACAACATGG
AGCTCAGACCAAAAGTGACCATC
[FAM]-CACCGACGGCGAGACCGACTTT-[BHQ1]
Malorny et al. 2004
Campylobacter spp.
CACGTGCTACAATGGCATAT
GGCTTCATGCTCTCGAGTT
[FAM]-CAGAGAACAATCCGAACTGGGACA-[BHQ1]
Lund et al. 2004
Cao et al. 2016
Campylobacter jejuni
TGCACCAGTGACTATGAATAACGA
TCCAAAATCCTCACTTGCCATT
[FAM]-TTGCAACCTCACTAGCAAAATCCACAGCT-[BHQ1]
He et al. 2010, Vondrakova 2014
Campylobacter coli
CATATTGTAAAACCAAAGCTTATCGTG
AGTCCAGCAATGTGTGCAATG
[HEX]-TAAGCTCCAACTTCATCCGCAATCTCTCTAAATTT-[BHQ1]
LaGier et al. 2004 Vondrakova et al. 2014
Campylobacter lari
TTAGATTGTTGTGAAATAGGCGAGTT
TGAGCTGATTTGCCTATAAATTCG
[FAM]-TGAAAATTGGAACGCAGGTG-[BHQ1]
He et al. 2010,
Vondrakova et al. 2014
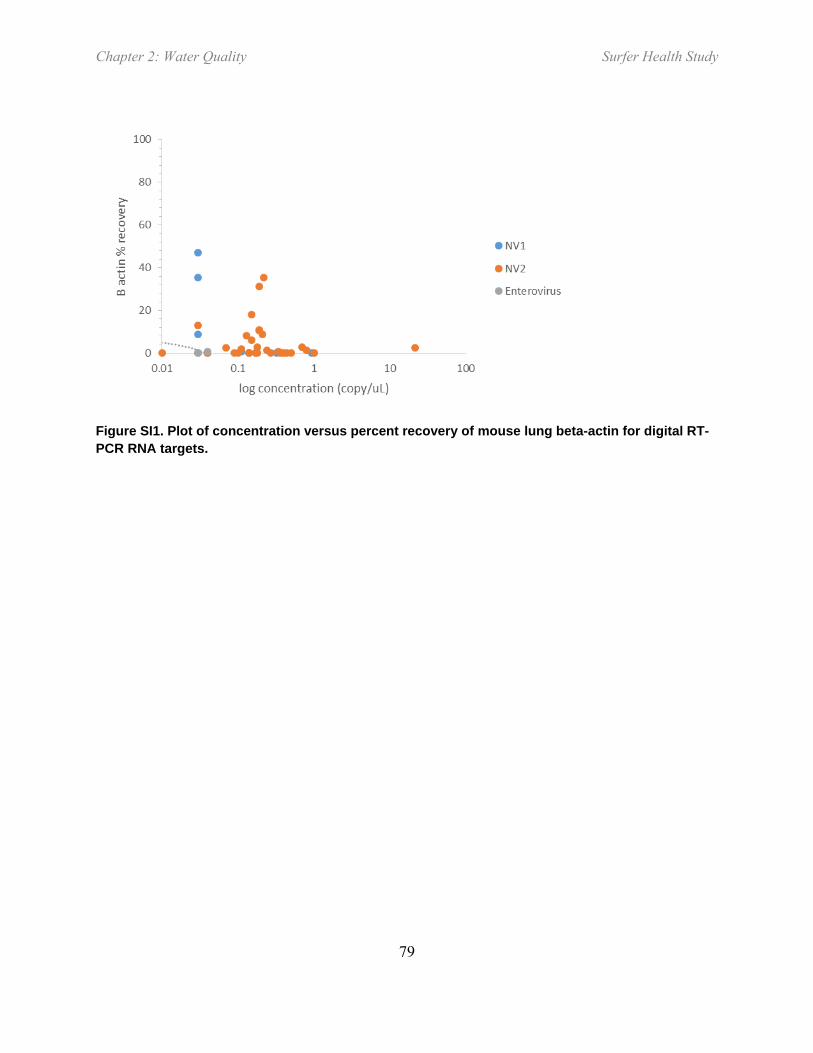
Chapter 2: Water Quality Surfer Health Study
79
Figure SI1. Plot of concentration versus percent recovery of mouse lung beta-actin for digital RT-PCR RNA targets.
Chapter 2: Water Quality Surfer Health Study
80
VIII. Supplemental Investigation: Wet Weather Source Tracking Upstream in the
San Diego River
1. Abstract
The Surfer Health Study observed an increase in several acute illnesses, including gastrointestinal illnesses, following wet weather. In addition, water quality measurements from wet weather discharges found human fecal markers and human specific pathogens. The goal of this screening study was to begin tracking the source(s) of human fecal markers and pathogens during wet weather in the San Diego River upstream of Ocean Beach. A mass-based approach was used, sampling at intervals along the mainstem and at the bottom of each major tributary. Flow, fecal indicator bacteria (FIB), human marker (HF183) and human pathogen (norovirus) were collected in flow composited samples from 13 sites during a single storm event on January 31-February 1, 2016. Rainfall ranged from 0.36 to 0.63 inches across the watershed. No flow was observed at the most upstream site because large dams did not release any water, and flow accumulated moving downstream. Concentrations of Enterococcus were high, ranging from 102 to 105 cfu/100 mL among the 12 remaining sites, with no discernable pattern. The greatest HF183 concentration (105 copies/100 mL) was observed at the Morena Blvd outfall. This site also had the greatest concentration of norovirus and enterovirus (280 and 470 copies/100 mL, respectively). This site clearly had human fecal inputs and are now the subject to enforcement investigations. However, HF183 was detected at every site sampled, indicating that human fecal inputs are widespread in this watershed.
Chapter 2: Water Quality Surfer Health Study
81
2. Background
The Surfer Health Study observed an increased risk of several acute symptoms following ocean exposure including gastrointestinal illnesses, sinus and ear pain, infected wounds, and eye infections, and this risk increased when ocean exposure occurred during or immediately following wet weather (0.25 cm rainfall in 24 hour and the following 72 hours). In addition, water quality samples were collected at the mouths of two urban watersheds – Tourmaline Creek and San Diego River – during wet weather discharges. These water quality measurements observed the human fecal marker HF183 in nearly every storm sampled from both sites. The wet weather discharge samples also observed human specific pathogens, such as norovirus, in the majority of the wet weather discharge samples. Finally, a quantitative microbial risk assessment (QMRA), modeled the health risk of norovirus from the wet weather discharges, and concluded that norovirus was one of the likely pathogens that could account for the illness observed at the beaches downstream of Tourmaline Creek and San Diego River.
Based on this evidence, the next logical step is to determine the source(s) of the human fecal inputs, including norovirus, and remediate it. This screening study is the first attempt to identify human fecal sources during wet weather in the San Diego River. One of two outcomes are expected: (1) the human fecal inputs are predominantly from a single location within the watershed, indicating a sanitary sewer overflow, illicit connection, or illegal discharge, or (2) the human fecal inputs are dispersed and widespread, indicating a more systemic source such as a leaking sanitary sewer collection system. Either outcome will likely result in additional follow up studies to narrow the source location(s) and confirm them for remediation.
3. Approach
A mass-based approach was used to estimate sources of human fecal pollution. This approach examines flow and volume of wet weather runoff, plus concentrations and mass of human fecal indicators and pathogens, at selected sites along the mainstem and the bottom of major tributaries (Figure S1). Thirteen sites were selected in the San Diego River watershed, 6 were mainstem sites and 7 were major tributaries.
The sites were sampled for a single storm event on Jan 31-Feb 1, 2016. Rainfall totals for the storm ranged from 0.36 to 0.63 inches (0.91 to 1.6 cm), generally increasing from the coast towards the foothills. All but one site generated flow; the one dry site was furthest upstream and located immediately below the major reservoirs of San Vicente and El Capitan. No dam overflow was recorded at either reservoir during this storm event.
Of the 12 sites that observed wet weather flow, all measured flow successfully except two (Table 1). The mainstem site San Diego River at Mission Road and tributary site Los Coches provided unreliable flow data mid-storm due to sediment burial. Volume for San Diego River at Mission Road site was estimated by summing the volume from the sites immediately upstream (San Diego River at Mission Trails and Alvarado Creek). Total storm volume recorded at Fashion Valley was 18.9 x 106 ft3.
All 12 sites successfully collected composite samples (Table S1). Sufficient volume was collected to conduct all analyses. The only site that did not collect flow-composite sample was the mainstem site at Ingraham Bridge, since this site is tidally influenced and flow is not quantifiable; a time-weighted

Chapter 2: Water Quality Surfer Health Study
82
composite sample was used for this site instead. Time weighted composite sampling is consistent with the sampling strategy and location used during the SHS.
Microbial methods mirrored those used for the SHS. FIB, including Enterococcus, fecal and total coliforms, were measured using standard methods. HF183 and enterovirus was measured using droplet digital Polymerase Chain Reaction (ddPCR). Norovirus I and II was measured using reverse transcriptase ddPCR.
4. Results and Discussion
Enterococcus concentrations ranged from 270 to 30,342 MPN/100 mL, without a discernable pattern. This is consistent with other studies that have measured Enterococcus in wet weather. Enterococcus concentrations in wet weather from southern California typically range from 102-105 MPN/100 mL regardless of land use, including open space (Tiefenthaler et al 2011, Griffith et al 2010, Schiff and Kinney 2001).
The human fecal marker (HF183) was detected at every site sampled, but concentrations were greatest at Morena Blvd outfall (Table S2). The concentration of HF183 at the Morena Blvd outfall was 105 copies/100 mL. The concentrations of HF183 at the remaining 11 sites ranged from 101-104 copies/100 mL. HF183 is known to be both a specific and sensitive indicator of human fecal inputs (Boehm et al 2013).
Consistent with the HF183 results, the greatest human virus concentrations were detected at Morena Blvd outfall (Table 2). Norovirus concentrations (280 copies/100 mL) and enterovirus concentrations (470 copies/100 mL) were an order of magnitude greater at Morena Blvd outfall than at any other site. Clearly, this site has a dramatic human influence, and enforcement actions are underway upstream of this location.
San Diego River mainstem sites at Mission Road and Fashion Valley did not have the greatest HF183 concentrations, but did have the greatest mass flux of HF183 (Figure 3). Mass flux contributions are a function of both concentration and volume; these two sites had the two greatest volumes of stormwater flow (Table S1). However, these two sites also had measureable human virus detected (Table 2). In fact, San Diego River at Mission Road had amongst the lowest HF183 concentrations, but detected both norovirus and enterovirus. While specific sources cannot be identified using this study design, both of these mainstem sites were selected, in part, because they are located downstream of transient encampments.
HF183 concentrations measured at San Diego River at Ingraham during the wet weather upstream tracking were within the range of HF183 concentrations measured at the same location during the SHS (Table S3). Pathogen concentrations at this same site were non-detectable during the wet weather upstream tracking, which is at the low end of the range from the SHS. However, the range of pathogen concentrations upstream of Ingraham during the wet weather tracking were within the range measured at the mouth of the San Diego River during SHS. Altogether, these data support not just an ongoing potential for human fecal contributions in wet weather runoff from San Diego River, but the presence of human pathogens support an ongoing risk to surfer health at Ocean Beach following storm events.
The HF183 and pathogen levels observed during the wet weather upstream source tracking were much lower, at least one to two orders of magnitude lower, than concentrations of HF183 and pathogens

Chapter 2: Water Quality Surfer Health Study
83
measured in samples of Point Loma Wastewater Treatment Plant influent. Since HF183 was widely distributed at low levels, one potential source is leaking sanitary sewer collection systems. The influent results, which includes collections systems outside of the San Diego River watershed, provides some relative context between raw sewage and wet weather runoff.
5. References
Boehm, AB, LC Van De Werfhorst, JF Griffith, PA Holden, JA Jay, OC Shanks, D Wanga, SB Weisberg. Performance of forty-one microbial source tracking methods: A twenty-seven lab evaluation study. Wat Res 2013. doi:47:6812-6828.
Griffith, JF, KC Schiff, GS Lyon, JA Fuhrman. Microbiological water quality at non-human influenced reference beaches in southern California during wet weather. Mar Pol Bull. 201060:500-508
Schiff, K, P Kinney. Tracking sources of bacterial contamination in stormwater discharges to Mission Bay, California. Water Env Res. 2001 73:534-542
Tiefenthaler, L, ED Stein, KC Schiff. Levels and patterns of fecal indicator bacteria in stormwater runoff from homogenous land use sites and urban watersheds. J Wat Health. 2011 9:279-290
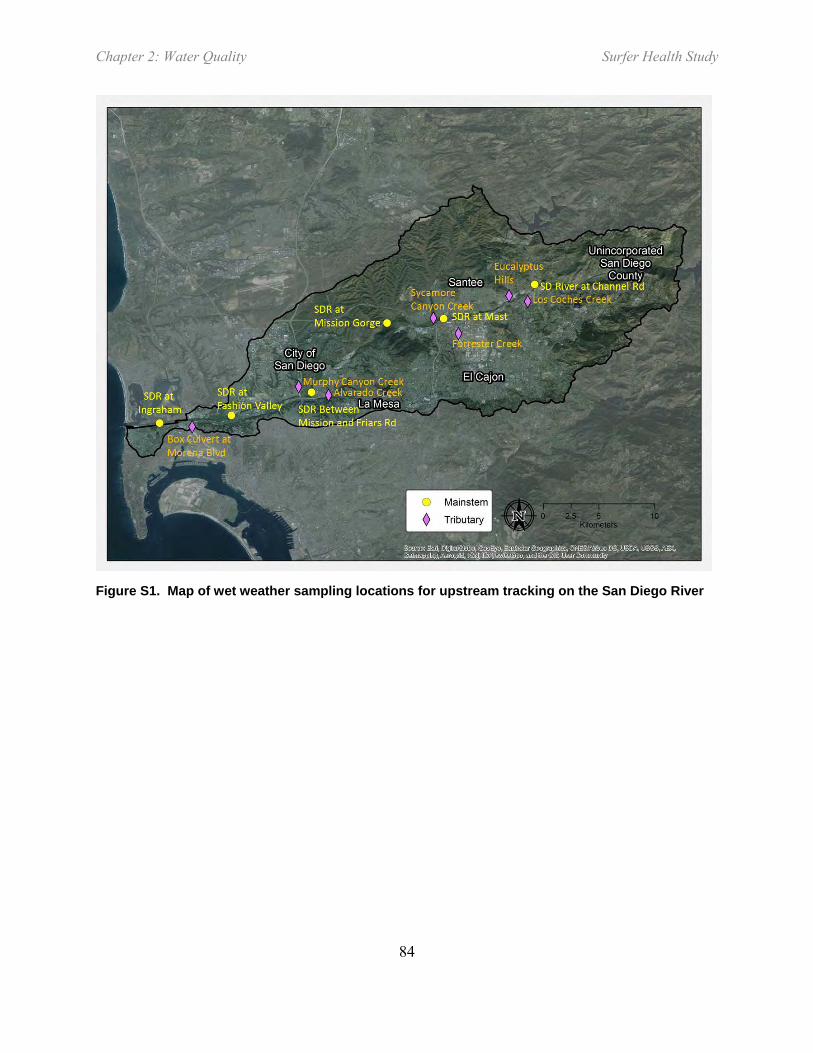
Chapter 2: Water Quality Surfer Health Study
84
Figure S1. Map of wet weather sampling locations for upstream tracking on the San Diego River

Chapter 2: Water Quality Surfer Health Study
85
Table S1. Summary of storm sampling success January 30 – February 1, 2016. Percent storm capture less than total storm volume due to holding time restrictions that limited sampling to the first 12 hours of the event.
Site Mainstem
or Tributary
Rainfall (in)
Total Storm Volume (106 ft3)
Estimated Total Flow Captured (106 ft3)
No. Aliquots
per composite
% Volume Capture During
Sampling
% Volume Capture For
Entire Storm
Comments
SDR @ Channel Rd Main 0.56 e 0 NA NA NA NA No flow observed
Upper Eucalyptus Hills Trib 0.56 e NM NA 14 100% NA
Los Coches Creek Trib 0.56 1.9 0.1 50 (of 68) 81% 62% Sediment clogging intake resulted in percent capture
<100%. SDR @ Carlton
Hills Main 0.50 4.1 0.4 68 100% 12%
Forrester Creek Trib 0.63 3.7 3.6 57 100% 96%
Sycamore Canyon Creek Trib 0.50 c 1.8 1.1 45 100% 65%
SDR @ Mission Trails Main 0.65 13.3 6.1 57 100% 46%
Alvarado Creek Trib 0.49 4.9 3.6 116 100% 74%
SDR @ SD Mission Rd Main 0.48 18.2 NM 127 100% NM
Flow measurements unreliable; total volume estimated as sum of SDR@MIssion Trails and Alvarado Ck
Murphy Canyon Creek Trib 0.41 2.1 1.1 67 100% 54%
SDR @ Fashion Valley USGS Main 0.41 b 18.9 3.9 92 100% 21%
Morena Blvd Outfall Trib 0.36 a 0.06 0.03 24 100% 44%
SDR @ Ingraham St Bridge Main 0.36 a NM NA 46 100% NA Same site sampled for discharge during SHS
a Average of San Diego at Lindbergh Field and La Jolla NWS gauges b Murphy Canyon gauge c Carlton Hills gauge
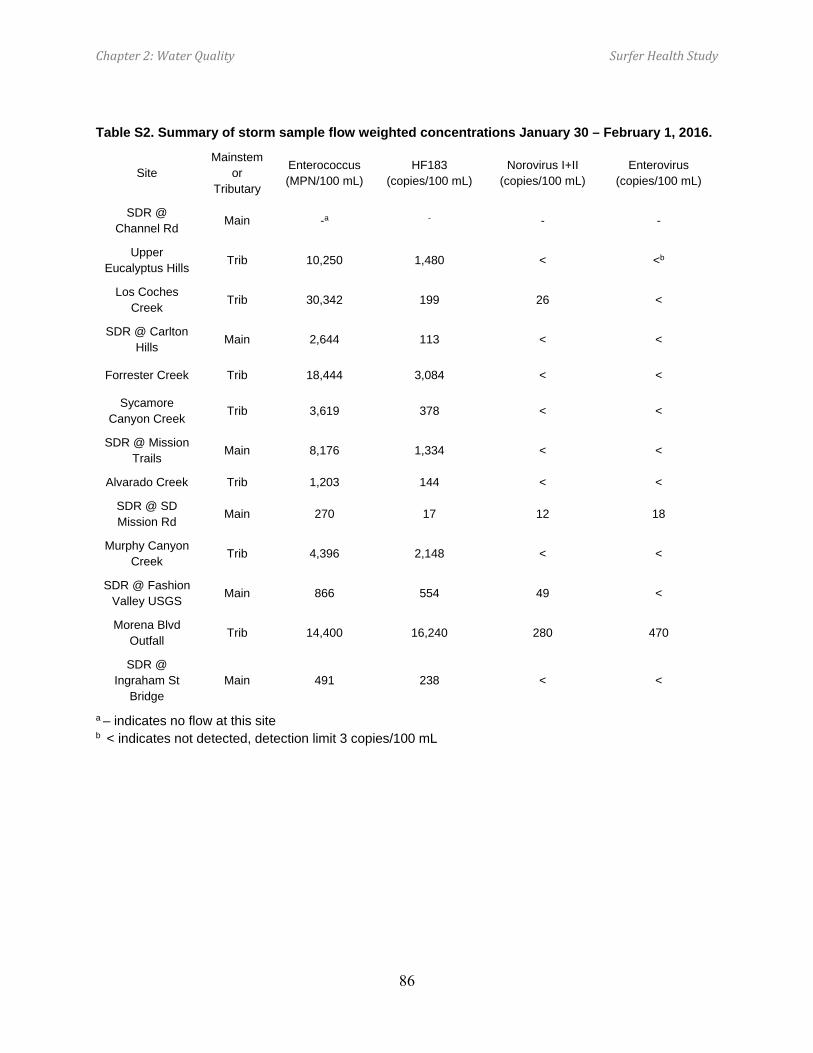
Chapter 2: Water Quality Surfer Health Study
86
Table S2. Summary of storm sample flow weighted concentrations January 30 – February 1, 2016.
Site Mainstem
or Tributary
Enterococcus (MPN/100 mL)
HF183 (copies/100 mL)
Norovirus I+II (copies/100 mL)
Enterovirus (copies/100 mL)
SDR @ Channel Rd Main -a - - -
Upper Eucalyptus Hills Trib 10,250 1,480 < <b
Los Coches Creek Trib 30,342 199 26 <
SDR @ Carlton Hills Main 2,644 113 < <
Forrester Creek Trib 18,444 3,084 < <
Sycamore Canyon Creek Trib 3,619 378 < <
SDR @ Mission Trails Main 8,176 1,334 < <
Alvarado Creek Trib 1,203 144 < <
SDR @ SD Mission Rd Main 270 17 12 18
Murphy Canyon Creek Trib 4,396 2,148 < <
SDR @ Fashion Valley USGS Main 866 554 49 <
Morena Blvd Outfall Trib 14,400 16,240 280 470
SDR @ Ingraham St
Bridge Main 491 238 < <
a – indicates no flow at this site b < indicates not detected, detection limit 3 copies/100 mL
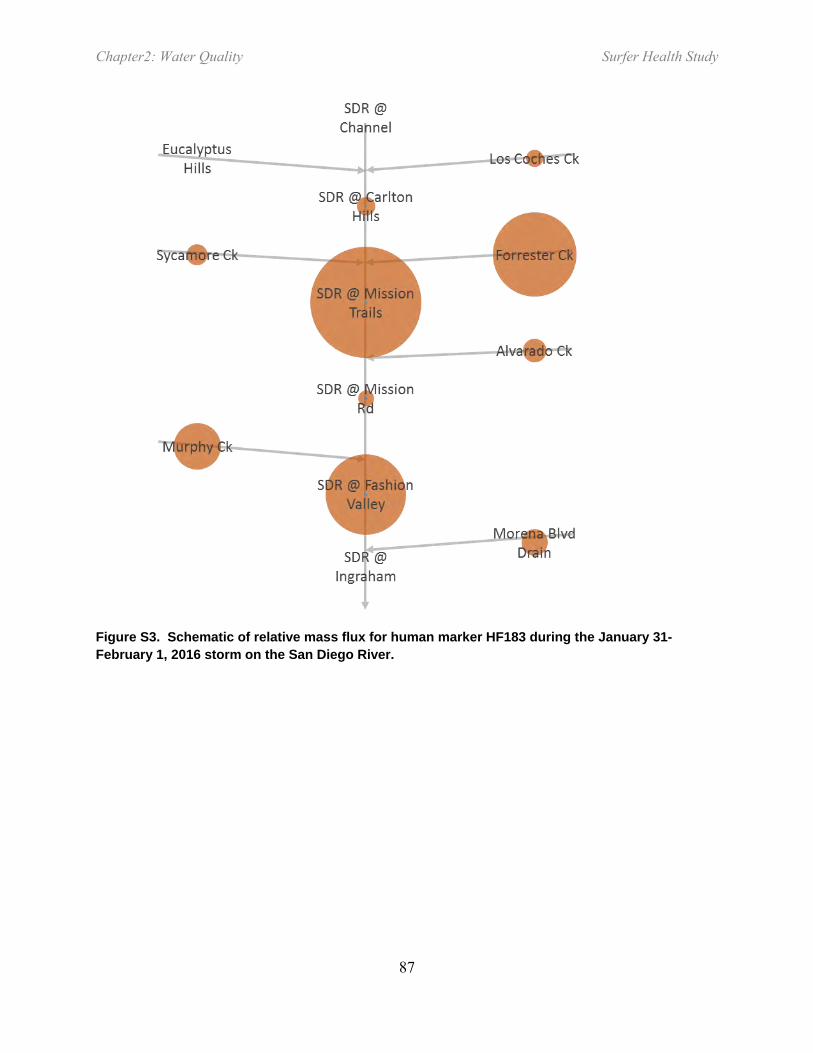
Chapter2: Water Quality Surfer Health Study
87
Figure S3. Schematic of relative mass flux for human marker HF183 during the January 31-February 1, 2016 storm on the San Diego River.

Chapter2: Water Quality Surfer Health Study
88
Table S3. Concentration ranges for human marker (HF183) and three human pathogenic viruses in San Diego River wet weather flows and wastewater treatment plant influent. SHS indicates wet weather samples collected during the epidemiology study and upstream tracking refers to the January 31-February 1, 2016 storm.
SHS @Ingraham Upstream Tracking
@Ingraham
Upstream Tracking All
Sites
Pt Loma Wastewater
Treatment Plant Influent
Year 2013-2015 2016 2016 2016a
Sample size 23 1 12 5
HF183 < to 3363 238 17 to 16240 106 to 107 Norovirus I < to 32 < < to 168 180 to 4350 Norovirus II < to 495 < < to 112 < to 1800 Enterovirus < < < to 188 260 to 833
a samples collected between Dec and Feb 2016, SCCWRP unpublished data
Chapter 3: QMRA Surfer Health Study
89
CHAPTER 3: WET WEATHER RECREATIONAL WATER GASTROINTESTINAL
ILLNESS RISKS – QUANTITATIVE MICROBIAL RISK ASSESSMENT HARMONIZATION
WITH AN EPIDEMIOLOGICAL INVESTIGATION
Jeffrey A. Soller1*, Mary Schoen1, Joshua A. Steele2, John F. Griffith2, and Kenneth C. Schiff2
1Soller Environmental, LLC, Berkeley, CA 2Southern California Coastal Water Research Project, Costa Mesa, CA *Corresponding author

Chapter3: QMRA Surfer Health Study
90
Acknowledgements
This study was funded by the City and County of San Diego. The authors are grateful to the field team members who collected water samples throughout the study. The authors are also grateful to Benjamin Arnold, Ayse Ercumen, Charles McGee, Richard Wilson, Chad Nelsen, John M. Colford, and John Ravenscroft, along with members of the study’s external advisory committee, for comments on the results and manuscript drafts.

Chapter3: QMRA Surfer Health Study
91
I. Abstract
We modeled the risk of gastrointestinal (GI) illness associated with recreational exposures to marine water following storm events in San Diego County, CA. We estimated GI illness risks via quantitative microbial risk assessment (QMRA) techniques by consolidating site specific pathogen stormwater monitoring data, site-specific dilution estimates, literature-based water ingestion data, and literature based pathogen dose-response and morbidity information. We evaluated a series of approaches to account for uncertainty in the norovirus dose response model selection and compared our model results with a concurrently conducted epidemiological study that provided empirical estimates for illness risk following ocean exposure. Our water quality results indicated that human sources of contamination contribute viral and bacterial pathogens to streams draining an urban watershed during wet weather that then enter the ocean and affect nearshore water quality. Human enteric viruses were present in the stormwater at levels that were predicted to dominate human health risks. The preferred norovirus dose-response approach yielded median risk estimates for water recreation-associated illness (15 GI illnesses per 1000 recreation events) that closely matched the reported epidemiological results (12 excess GI illnesses per 1000 wet weather recreators). The results suggest norovirus was the etiologic agent of primary concern in this setting. This study demonstrates the applicability of QMRA for recreational water risk estimation, even under wet weather conditions, and contributes to our understanding for considering site-specific water quality criteria in this and other locations.

Chapter3: QMRA Surfer Health Study
92
II. Introduction
Epidemiology studies have historically been the standard basis for setting marine recreational water quality criteria in the United States (U.S. EPA 1986, 2012a). These studies have focused on beaches known to be impacted by human sources of fecal contamination from Publicly Owned Treatment Works (POTWs). The result has been water quality standards based on relationships between gastrointestinal illness and fecal indicator bacteria such as enterococci (Prüss 1998, Wade et al. 2003).
In its most recent water quality criteria, the USEPA recognized that not all beaches may be impacted exclusively by POTWs, or even exclusively by human sources of fecal contamination (U.S. EPA 2012a). This recognition acknowledges that non-human sources may have different illness-enterococci relationships than human sources of fecal contamination (Soller et al. 2010b). To address the difference in health risk relationships among fecal sources, the USEPA now allows for the development of site-specific objectives using health risk (QMRA) models (U.S. EPA 2012a, b).
Marine beaches in southern California represent an ideal opportunity to test the new USEPA approach of using QMRA. During the summer, ~98% of southern California shorelines meet State water quality criteria (Noble et al. 2000). The infrastructure investments that have improved beach water quality have paid large dividends; during the long dry summers, more than 175 million beachgoers each year (Schiff et al. 2003) drive an economic engine estimated at roughly $40B annually (Schiff et al. 2015). When it rains, however, the story is quite different. On average, 10-12 storms occur annually in southern California from October to April (Ackerman et al. 2005). These few, but frequently intense, storms result in large volumes of surface runoff and substantially increased levels of enterococci at marine beaches. In fact, nearly two-thirds of beaches exceed the State water quality standards for maximum daily levels during periods of wet weather (Noble et al. 2003). By default, most County Health Agencies routinely warn the public to stay out of the ocean for at least three days following rainstorms > 0.25 cm (Thoe et al. 2014). Since sanitary sewer and storm sewer systems are separate in southern California, there is no treatment of storm water prior to discharge, and there are no combined sewer overflows that often plague other parts of the U.S. However, at this point, it is not clear the extent to which the enterococci associated with stormwater discharges are of human origin.
Although most Southern California beachgoers tend to stay out of the water during the cold, rainy season, surfers are a notable exception. Thousands of surfers frequent beaches year-round, attracted to the especially sought-after conditions that follow storms. In fact, San Diego beach managers recently funded a first-of-its-kind effort, the Surfer Health Study (SHS), to quantify the health risks associated with entering coastal waters following storm events (Arnold et al. 2016). The SHS surveyed 654 surfers about their ocean exposure and illness symptoms through internet and smartphone apps, logging 10,081 surfing sessions and making it one of the largest beach epidemiology studies of the past 30 years.

Chapter3: QMRA Surfer Health Study
93
The goal of the study presented here was to model the risk of gastrointestinal (GI) illness associated with wet weather marine water recreational exposures in San Diego County, CA. There are several factors that make this study unique: (1) This is the first QMRA at a marine beach on the U.S. West Coast, (2) the study focuses on wet weather associated stream flows affecting coastal nearshore waters, and (3) we compare our model results with a concurrently conducted recreational water epidemiological study (Arnold et al. 2016).
III. Methods
A. QMRA Exposure Scenario
We modeled an exposure scenario that is conceptually as similar as possible to the concurrently conducted epidemiological surfer health study (SHS) that measured the associations between ocean exposure in dry versus wet weather and acute illness (Arnold et al. 2016). The SHS evaluated symptoms from multiple exposure sites in Southern California. Illness was defined as gastrointestinal illness (GI) as defined previously (Colford et al. 2007, 2012; Dwight et al. 2004; U.S. EPA 2012a). Exposure was limited to surfing (largely head underwater exposure), and the wet weather definition mimicked the County Public Health Department: within 3 days of 0.1 inch or more of rain in 24 hours.
Specifically, we modeled the ingestion of water through ocean recreation during a wet weather period at a hypothetical recreational site that was constructed to be broadly representative of the SHS area in terms of ocean water quality. Pathogen data were collected from two areas influenced by wet-weather associated flows: the San Diego River Watershed discharge and the Tourmaline Watershed discharge during storm events between December 2014-March 2015 (Figure 1). Fecal indicator data collected during storm events over two winters (January-March 2014 and December 2014-March 2015) were included as well. All these data construct a hypothetical ocean discharge representative of pathogen and FIB stormwater discharges in the SHS area.
Conceptually, the QMRA analyses require the density of pathogens at the point of exposure, the volume of water ingested during recreation, pathogen dose response relationships, and the fraction of infections that result in illness. Since we collected pathogen concentration data in the stormwater discharge in nearshore areas rather than in the further offshore (where surfing, and thus, exposure actually occurs), we used the fecal indicator measurements collected at differing distances from the point of discharge to characterize dilution from the discharge to the exposure point to estimate the concentration of pathogens at the point of exposure.

Chapter3: QMRA Surfer Health Study
94
Figure 1. Map of study area and sampling locations with inset of (B) Tourmaline Watershed discharge and (C) San Diego River Watershed discharge.
B. QMRA Model Parameters
Reference pathogens. The reference pathogens in this study include norovirus (NoV), adenovirus (AdV), enterovirus, Campylobacter jejuni, and Salmonella enterica. Together these pathogens (1) make up a large portion of all non-foodborne illnesses from known pathogens in the U.S. (calculated based on data from Mead et al. (1999) and Scallan et al., (2011)), (2) are representative of other pathogens potentially of concern from the waterborne exposure route (Soller et al. 2010a, 2010b; U.S. EPA 2010), and (3) have corresponding dose-response relationships in the peer-reviewed literature (Crabtree et al. 1997, Haas et al. 1999, Medema et al 1996, Messner et al. 2014, Teunis et al. 2008). The use of reference pathogens is an accepted practice in the field of QMRA (Regli et al. 1991, Roser and Ashbolt 2007, Schoen et al. 2011, Soller et al. 2003, Soller and Eisenberg 2008, U.S. EPA 2012a) to represent the potential adverse health effects of members of each microbial group, as well as the infectivity of known and unknown members of each microbial group (WHO 2004).
Pathogen and fecal indicator density. Sample collection and processing is described in Chapter 2: Quantification of Pathogenic Viruses and Bacteria, Host Source Markers, and Fecal Indicator Bacteria in Stormwater. Briefly, time-weighted composite Tourmaline Watershed discharge and

Chapter3: QMRA Surfer Health Study
95
San Diego River Watershed discharge stormwater samples were collected during the first 6-12 hours of rainfall, and then daily grab samples were collected for tailing flows in the following 72 hours following the initial rainfall (Figure 1). In total, 6 storm events were sampled over the 2013-14 and 2014-15 wet seasons, ranging in size from <0.25 cm to >25 cm. Stormwater samples were processed for fecal indicator bacteria using standard methods. Viral RNA and DNA, and bacterial DNA were extracted using commercial kits. Enterococcus and human marker (HF183) were quantified using a previously described digital PCR assay (Cao et al. 2015). AdV, enterovirus, human NoV genotypes I and II were quantified using digital PCR and digital RT-PCR assays (Jothikumar et al. 2005, Gregory et al. 2006, da Silva et al. 2007). Salmonella spp. were quantified using digital PCR assays adapted from qPCR assays that targeted pathogenic and non-pathogenic Salmonella spp. (Malorny et al. 2004, González-Escalona et al. 2009). Campylobacter spp. were quantified using a genus-wide digital PCR assay (Lund et al. 2004). Samples which were identified as containing Campylobacter using the genus-wide assay were investigated using single-copy gene digital PCR assays specific to C. coli and C. jejuni adapted from qPCR assays ((La Gier et al. 2004, He et al. 2010, Vondrakova et al. 2014). All quantifications had to meet minimum quality standards (Cao et al. 2015).
Volume ingested. A statistical distribution for the volume of water ingested was derived based on a pilot study of recreational swimmers in an outdoor community swimming pool (Dufour et al. 2006). For this analysis, we assume that surfers ingest similar amounts of water that occurred during swimming in swimming pools (Stone et al. 2008). The best-fit volume distribution (in mL) is ln-normal with ln mean (2.92) and ln standard deviation (1.43) (Dufour et al. 2006, Soller et al. 2007, U.S. EPA 2010). The median value of this distribution is 0.0186 L. The ingestion volume distribution is based on data from adults and children (≤18 years of age) combined (Dufour et al. 2006). The SHS study focused on adults >18 years of age. We truncated the volume ingested distribution at 0.06 L, which represents a volume that is both greater than the 95th percentile of the predicted distribution for adults and greater than any value observed for adults (>18 yrs of age) in the Dufour et al. study.
Dose response relationships and probability of illness given infection. The dose response relationships and conditional probabilities of illness given infection are presented in Table 1 (Atmar et al. 2008, Atmar et al. 2014, Crabtree et al. 1997, Haas et al. 1999, Medema et al. 1996, Messner et al. 2014, Teunis et al. 2008). The use of these relationships and the conditional morbidity probabilities is consistent with prior work (Schoen et al. 2011, Soller et al. 2015a, Soller et al. 2010a, Soller et al. 2010b, Viau et al. 2011).
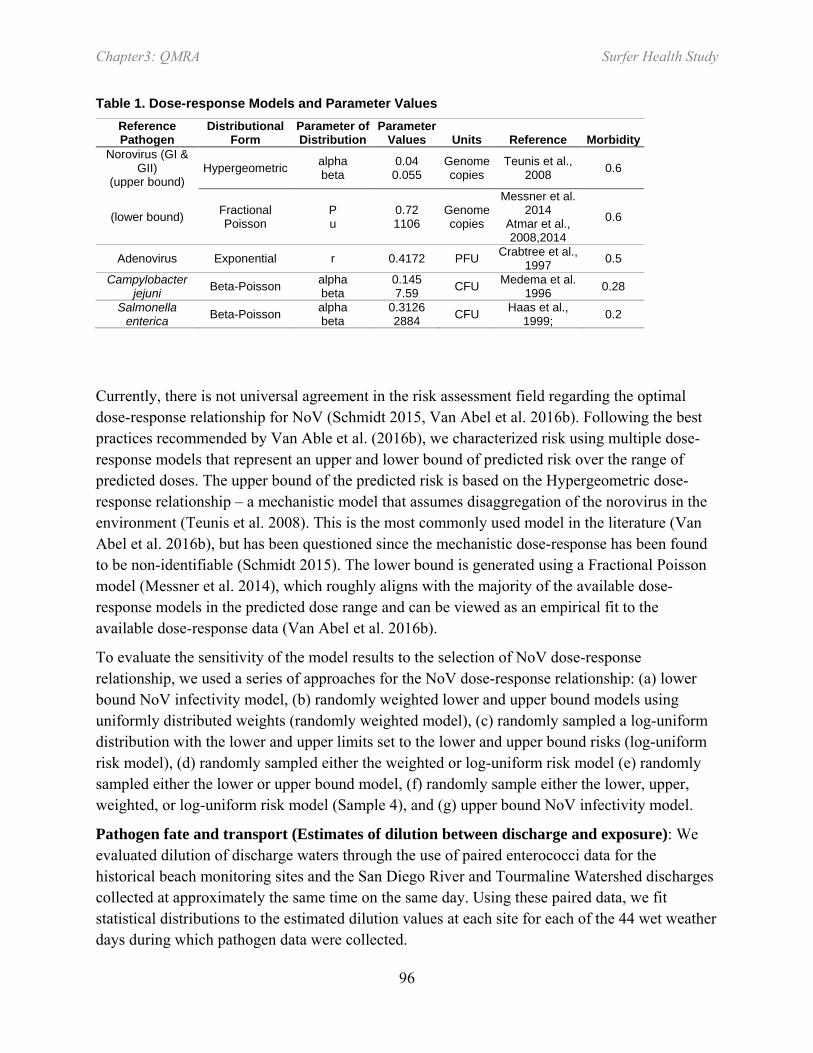
Chapter3: QMRA Surfer Health Study
96
Table 1. Dose-response Models and Parameter Values Reference Pathogen
Distributional Form
Parameter of Distribution
Parameter Values Units Reference Morbidity
Norovirus (GI & GII)
(upper bound) Hypergeometric alpha
beta 0.04
0.055 Genome copies
Teunis et al., 2008 0.6
(lower bound) Fractional Poisson
P u
0.72 1106
Genome copies
Messner et al. 2014
Atmar et al., 2008,2014
0.6
Adenovirus Exponential r 0.4172 PFU Crabtree et al., 1997 0.5
Campylobacter jejuni Beta-Poisson alpha
beta 0.145 7.59 CFU Medema et al.
1996 0.28
Salmonella enterica Beta-Poisson alpha
beta 0.3126 2884 CFU Haas et al.,
1999; 0.2
Currently, there is not universal agreement in the risk assessment field regarding the optimal dose-response relationship for NoV (Schmidt 2015, Van Abel et al. 2016b). Following the best practices recommended by Van Able et al. (2016b), we characterized risk using multiple dose-response models that represent an upper and lower bound of predicted risk over the range of predicted doses. The upper bound of the predicted risk is based on the Hypergeometric dose-response relationship – a mechanistic model that assumes disaggregation of the norovirus in the environment (Teunis et al. 2008). This is the most commonly used model in the literature (Van Abel et al. 2016b), but has been questioned since the mechanistic dose-response has been found to be non-identifiable (Schmidt 2015). The lower bound is generated using a Fractional Poisson model (Messner et al. 2014), which roughly aligns with the majority of the available dose-response models in the predicted dose range and can be viewed as an empirical fit to the available dose-response data (Van Abel et al. 2016b).
To evaluate the sensitivity of the model results to the selection of NoV dose-response relationship, we used a series of approaches for the NoV dose-response relationship: (a) lower bound NoV infectivity model, (b) randomly weighted lower and upper bound models using uniformly distributed weights (randomly weighted model), (c) randomly sampled a log-uniform distribution with the lower and upper limits set to the lower and upper bound risks (log-uniform risk model), (d) randomly sampled either the weighted or log-uniform risk model (e) randomly sampled either the lower or upper bound model, (f) randomly sample either the lower, upper, weighted, or log-uniform risk model (Sample 4), and (g) upper bound NoV infectivity model.
Pathogen fate and transport (Estimates of dilution between discharge and exposure): We evaluated dilution of discharge waters through the use of paired enterococci data for the historical beach monitoring sites and the San Diego River and Tourmaline Watershed discharges collected at approximately the same time on the same day. Using these paired data, we fit statistical distributions to the estimated dilution values at each site for each of the 44 wet weather days during which pathogen data were collected.

Chapter3: QMRA Surfer Health Study
97
Assumptions used to develop the exposure scenario: Consistent with prior work, we employed a series of assumptions to conduct the modeling (Schoen and Ashbolt 2010, Soller et al. 2010a, Soller et al. 2010b, Soller et al. 2015b). We assumed that surfing and recreation (i.e., swimming) result in similar levels of water ingestion. This assumption is necessary because little data are available to quantitatively characterize the volume of water ingested during surfing (Dorevitch et al. 2011, Dufour et al. 2006, Schijven and de Roda Husman 2006, Stone et al. 2008). We assumed that exposure occurs in the ocean rather than in the discharges. No adjustment for the recovery of pathogens in the analytical methods was employed. We assumed that pathogen loading to the ocean derives from the discharges and that paired culturable enterococci data (discharge and standard monitoring sites) can be used to estimate pathogen dilution between the discharge and the exposure sites. Because the time between discharges and exposures are assumed to be relatively short (minutes to hours), we assumed that the contamination is fresh and thus assumed no die-off of pathogens between discharge and exposure. We assumed that pathogen densities in units of genome copies/100mL represent viable and infectious pathogens, and that the strains/genogroups are consistent with dose response relationships. For Campylobacter spp., we assumed that C. jejuni and C. coli are infectious to humans, and that other strains are not. We also assumed that each Campylobacter copy approximates one colony forming unit (CFU) consistent with the dose response relationship because Campylobacter spp. are presumed to be fragile in the environment and decay quickly with exposure to UV (Sinton et al. 2007) at similar rates to Bacteroidales in freshwater (Bae and Wuertz 2012); in addition, we used single copy gene assays which correlated to CFUs from cultures (He et al. 2010, Steele et al. 2016b, Vondrakova and Jarmila 2014) and in spiking experiments in San Diego River stormwater (Steele et al. 2016a).
C. Numerical simulations
We used a stochastic, static QMRA methodology to estimate illness from pathogenic microorganisms through ingestion of water from ocean recreation (Soller and Eisenberg 2008, U.S. EPA 2014). Computations were performed in R. For each Monte Carlo iteration (N=10,000), the probability of illness (Pillp,b) associated with pathogen (p) for a surfing event at beach (b) was calculated as:
𝑃𝑃𝑃𝑃𝑃𝑃𝑃𝑃𝑝𝑝,𝑏𝑏 = 𝐷𝐷𝐷𝐷𝑝𝑝�𝑉𝑉 ∗ 𝐶𝐶𝑝𝑝,𝑏𝑏 ∗ 𝐷𝐷𝑃𝑃𝑃𝑃𝑏𝑏� ∗ 𝑀𝑀𝑝𝑝 Eq. 1
Where
DRp is the dose-response function for pathogen p
V is the volume of water ingested
Cp,b is the pathogen concentration (i.e. density) at discharge b
Dilb is the estimated dilution from the discharge point b to the exposure point
Mp is morbidity for pathogen p

Chapter3: QMRA Surfer Health Study
98
Using Eq. 1, the Monte Carlo approach accounted for variation in V, Cp,b, and Dilb. The total probability of illness (TPillb) (accounting for all pathogens) for a surfing event at beach (b) was calculated as:
𝑇𝑇𝑃𝑃𝑃𝑃𝑃𝑃𝑃𝑃𝑏𝑏 = 1 −∏ (1 − 𝑃𝑃𝑃𝑃𝑃𝑃𝑃𝑃𝑝𝑝,𝑏𝑏 𝑝𝑝 ) Eq. 2
D. Data Analysis
Pathogen and fecal indicator data were tabulated and fit to statistical distributions. We developed statistical distributions to characterize the concentration of each of the pathogens in the discharges and in the hypothetical combined discharge. The combined discharge represents overall discharge water quality in the SHS area. Briefly, two types of distributions were used – bimodal and lognormal. For pathogens in which a large proportion (greater than 50%) of observations were reported below detectable limits, we used a bimodal distribution. For the bimodal distribution, the probability of a zero density was set equal to the proportion of observations reported below detectable limits, with the complement equal to a log-uniform distribution with bounds equal to the minimum and maximum of the observed detectable densities (Eisenberg et al. 2005, Soller et al. 2006, Soller and Eisenberg 2008). For pathogens in which a small proportion of observations were reported below detectable limits, a lognormal distribution was used using the best-fit parameter values derived as maximum likelihood estimates (U.S. EPA 1991).
The epidemiological study used water quality data from daily monitoring of culturable enterococci taken at representative monitoring sites at the sentinel beaches (Figure 1) (Arnold et al. 2016). In cases where a single exposure occurred within the 3-day wet weather timeframe, the water quality data for that day was used to represent the water quality for that exposure. In cases where multiple exposures occurred within the 3-day timeframe, the water quality data were aggregated by time spent in the ocean each day to generate a single representative estimate of water quality for that exposure. Use of monitoring data in this way indicates that the water quality characterization is intended to be reasonably representative of the water quality at each of the sites for the entire day (or days) in which those exposures occurred. Data from this study are consolidated and used in the QMRA model in a manner to be consistent with that interpretation.
We used a Classification and Regression Tree (CART) algorithm to determine which parameters or combinations of parameters in the model impacted the model output most strongly (Steinberg and Colla 1997). In general terms, the CART algorithm categorizes the 10,000 iterations of model simulations into distinct bins based on specific model parameter combinations, and then produces a tree structure that quantifies the importance of each model parameter, in this case with respect to TPillb (Eisenberg and McKone 1998, Soller and Eisenberg 2008).

Chapter3: QMRA Surfer Health Study
99
IV. Results
A. QMRA model parameter results
Pathogen and indicator density. The FIB data and the HF183 data collected during storm events in the San Diego River and Tourmaline discharges are described in detail by Steele et al. (2016d) and briefly summarized in Table 2. High levels of total coliform, E. coli and enterococci were observed at both discharge sites. Observed median levels of enterococci exceeded 103 MPN/100mL in discharges at both beaches. The observed discharge pathogen data are summarized in Table 3. Nov GI was below detectable limits in 93% (41/44) of the samples. NoV GII was present much more commonly (< MDL in ~15% of samples) and found at median levels of ~100 copies/100mL. Enterovirus, Adenovirus, and salmonellae were reported <MDL in the vast majority of samples. Campylobacters were always observed above the MDL in the San Diego River Discharge and observed above the MDL in the Tourmaline Discharge in about half of the samples (10/21).
Table 2. Summary results of fecal indicator bacteria (cfu/100mL) and human marker data in stormwater discharges (gene copies/100mL) \
Indicator Site N # <
MDL # >
TNTC Median Mean Max Fecal Coliform San Diego River Discharge 32 1 0 520 1456 6000
Tourmaline Watershed Discharge 29 1 0 800 1547 6000
Total Coliform San Diego River Discharge 57 0 15 24196 45415 280000
Tourmaline Watershed Discharge 57 3 22 24196 78726 560000
E. coli San Diego River Discharge 28 0 0 2940 2818 6131
Tourmaline Watershed Discharge 30 0 1 5271 5534 24196
Enterococcus San Diego River Discharge 60 1 1 3665 5385 26000
Tourmaline Watershed Discharge 60 2 4 7717 10385 50000
HF183 San Diego River Discharge 35 4 0 213 706 3363
Tourmaline Watershed Discharge 35 7 0 310 1165 12440
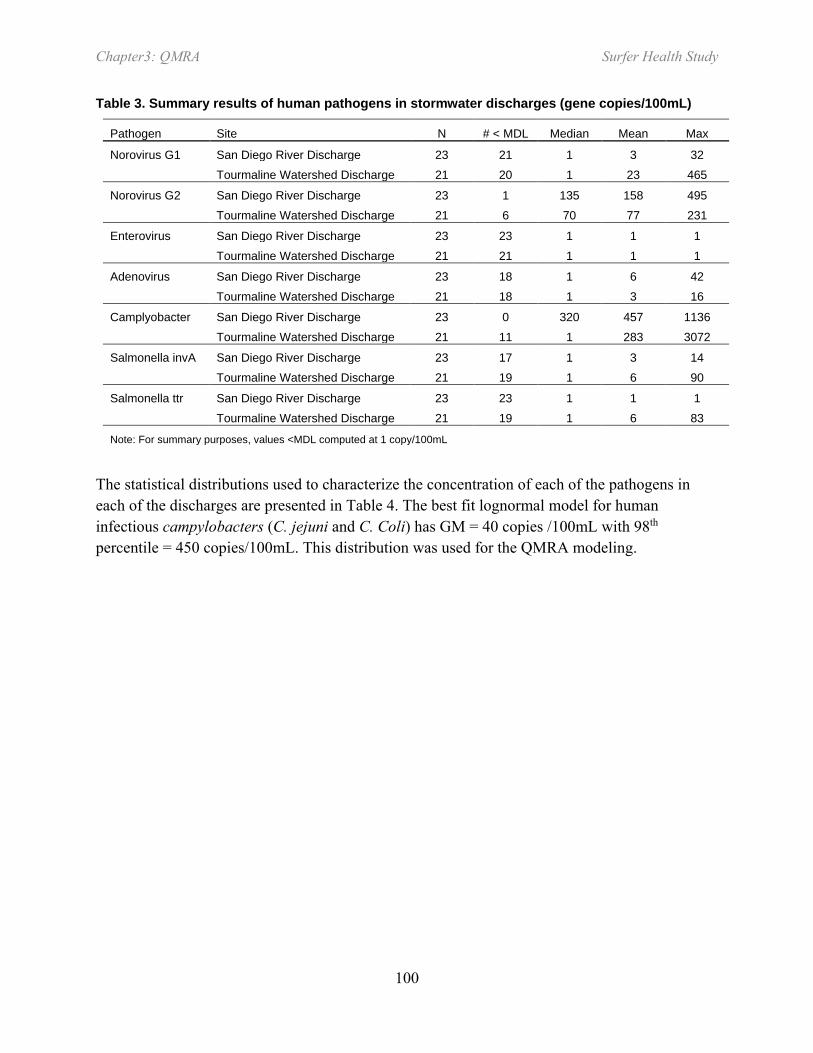
Chapter3: QMRA Surfer Health Study
100
Table 3. Summary results of human pathogens in stormwater discharges (gene copies/100mL)
Pathogen Site N # < MDL Median Mean Max
Norovirus G1 San Diego River Discharge 23 21 1 3 32 Tourmaline Watershed Discharge 21 20 1 23 465
Norovirus G2 San Diego River Discharge 23 1 135 158 495 Tourmaline Watershed Discharge 21 6 70 77 231
Enterovirus San Diego River Discharge 23 23 1 1 1 Tourmaline Watershed Discharge 21 21 1 1 1
Adenovirus San Diego River Discharge 23 18 1 6 42 Tourmaline Watershed Discharge 21 18 1 3 16
Camplyobacter San Diego River Discharge 23 0 320 457 1136 Tourmaline Watershed Discharge 21 11 1 283 3072
Salmonella invA San Diego River Discharge 23 17 1 3 14 Tourmaline Watershed Discharge 21 19 1 6 90
Salmonella ttr San Diego River Discharge 23 23 1 1 1 Tourmaline Watershed Discharge 21 19 1 6 83
Note: For summary purposes, values <MDL computed at 1 copy/100mL
The statistical distributions used to characterize the concentration of each of the pathogens in each of the discharges are presented in Table 4. The best fit lognormal model for human infectious campylobacters (C. jejuni and C. Coli) has GM = 40 copies /100mL with 98th percentile = 450 copies/100mL. This distribution was used for the QMRA modeling.
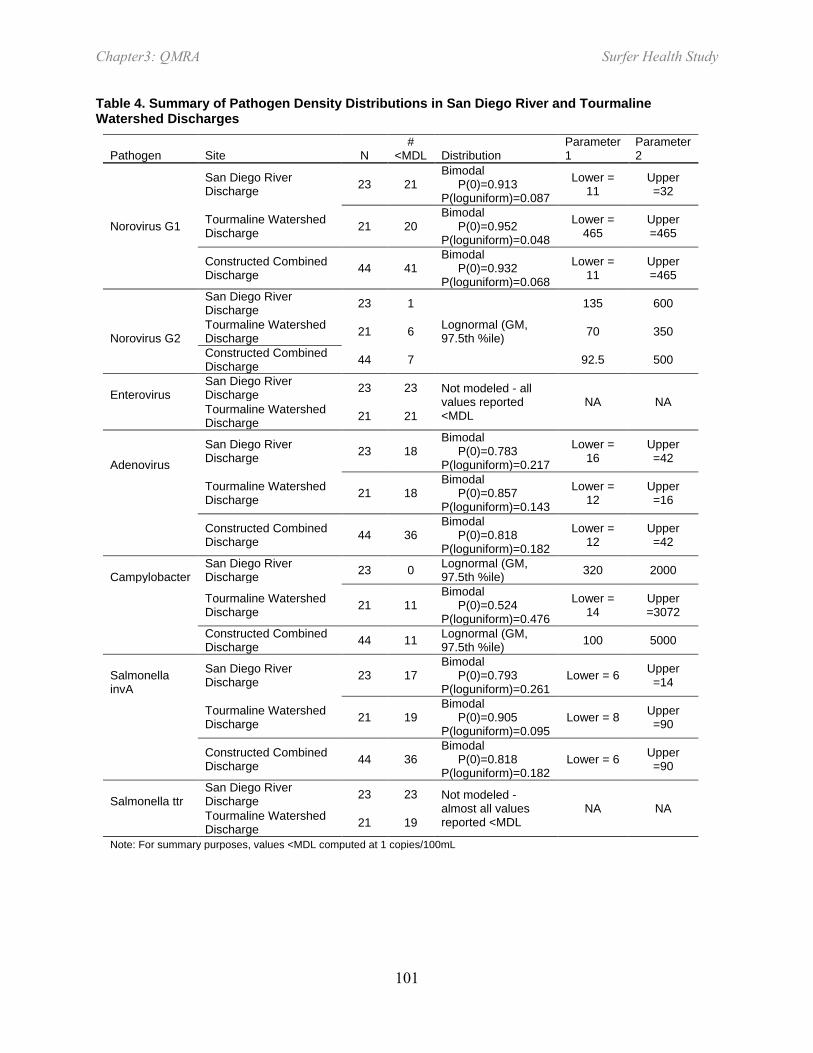
Chapter3: QMRA Surfer Health Study
101
Table 4. Summary of Pathogen Density Distributions in San Diego River and Tourmaline Watershed Discharges
Pathogen Site N #
<MDL Distribution Parameter 1
Parameter 2
Norovirus G1
San Diego River Discharge 23 21
Bimodal P(0)=0.913 P(loguniform)=0.087
Lower = 11
Upper =32
Tourmaline Watershed Discharge 21 20
Bimodal P(0)=0.952 P(loguniform)=0.048
Lower = 465
Upper =465
Constructed Combined Discharge 44 41
Bimodal P(0)=0.932 P(loguniform)=0.068
Lower = 11
Upper =465
San Diego River Discharge 23 1
Lognormal (GM, 97.5th %ile)
135 600
Norovirus G2 Tourmaline Watershed Discharge 21 6 70 350
Constructed Combined Discharge 44 7 92.5 500
Enterovirus San Diego River Discharge 23 23 Not modeled - all
values reported <MDL
NA NA
Tourmaline Watershed Discharge 21 21
Adenovirus
San Diego River Discharge 23 18
Bimodal P(0)=0.783 P(loguniform)=0.217
Lower = 16
Upper =42
Tourmaline Watershed Discharge 21 18
Bimodal P(0)=0.857 P(loguniform)=0.143
Lower = 12
Upper =16
Constructed Combined Discharge 44 36
Bimodal P(0)=0.818 P(loguniform)=0.182
Lower = 12
Upper =42
Campylobacter San Diego River Discharge 23 0 Lognormal (GM,
97.5th %ile) 320 2000
Tourmaline Watershed Discharge 21 11
Bimodal P(0)=0.524 P(loguniform)=0.476
Lower = 14
Upper =3072
Constructed Combined Discharge 44 11 Lognormal (GM,
97.5th %ile) 100 5000
Salmonella invA
San Diego River Discharge 23 17
Bimodal P(0)=0.793 P(loguniform)=0.261
Lower = 6 Upper =14
Tourmaline Watershed Discharge 21 19
Bimodal P(0)=0.905 P(loguniform)=0.095
Lower = 8 Upper =90
Constructed Combined Discharge 44 36
Bimodal P(0)=0.818 P(loguniform)=0.182
Lower = 6 Upper =90
Salmonella ttr San Diego River Discharge 23 23 Not modeled -
almost all values reported <MDL
NA NA
Tourmaline Watershed Discharge 21 19
Note: For summary purposes, values <MDL computed at 1 copies/100mL

Chapter3: QMRA Surfer Health Study
102
Dilution estimate results. Our modeling of the paired enterococci data indicated that lognormal distributions fit the observed dilution data reasonably well and that dilution varied substantially between monitoring sites (Figure 2). The median dilution factors among ocean monitoring sites ranged from 25 to 150 relative to the discharges. We used these median values in the QMRA for the lower and upper bounds of a triangular distribution, with a most likely value of 85, which was the median among all sites.
Figure 2. Enterococci dilution estimates for (a) San Diego River Watershed/Ocean Beach and (b) Tourmaline Monitoring Sites.
B. QMRA Simulation Results
The QMRA analyses estimate wet weather risks from recreational exposure in the ocean impacted by stormwater. The QMRA analyses used the fitted pathogen distributions for the “combined discharge,” including the infectious Campylobacter distribution, a lognormal ingestion distribution truncated at 60 mL, a triangular distribution of dilution, and reported morbidity and dose response relationships, including a range of possible interpretation of the NoV dose response relationship. A summary of the QMRA simulation results is presented in Table 5 along with the estimated excess risk of GI illness from wet weather ocean exposure (excess cases per 1,000 people compared to unexposed periods) yielded by the epidemiological study for comparison (Arnold et al. 2016). The lower and upper bound NoV dose response models, are presented in Table 5, along with the series of optional approaches to account for the full spectrum of uncertainty associated with the NoV dose-response relationship (Atmar et al. 2014, Teunis et al. 2008, Van Abel et al. 2016a).
The randomly weighted NoV dose-response model most closely described the potential health risks reported in the epidemiological study (Table 5). The other approaches for NoV dose response modeling were less effective at predicting the observed illness rate. This parsimonious approach effectively models a dose-response “envelope” rather than a simple line by
Percent of Observations Less Than Corresponding Value
1 10 30 50 70 90 99
Ente
roco
cci D
ilutio
n
0.1
1
10
100
1000
OB2 -Site PL110 OB3 -Site PL100 OB4 - Pier Site
Percent of Observations Less Than Corresponding Value
1 10 30 50 70 90 99
Ente
roco
cci D
ilutio
n
0.1
1
10
100
1000
10000
T1 -Tourmaline South SiteT2 - Site FM030
a b

Chapter3: QMRA Surfer Health Study
103
acknowledging and taking on all of the known uncertainty in the various previously published dose-response relationships. The results for the weighted model closely approximate the reported epidemiological results, particularly at the lower 95% CI and median values.
Table 5. QMRA results – stormwater-impacted ocean exposure
Predicted or Observed Illnesses / 1000 Approach 5th %ile Median 95th %ile Epidemiology results 0.3 12.2 24.0 Lower bound NoV 0.0 0.6 25.2 Randomly weighted NoV 0.5 15.5 146.2 Loguniform risk NoV 0.0 2.3 77.3 Sample weighted/loguniform 0.0 7.0 121.2 Sample lower/upper 0.0 7.1 120.6 Sample 4 0.0 6.8 157.7 Upper bound NoV 1.9 36.0 226.2
The QMRA results also strongly suggest that NoV is the pathogen of primary concern (Figure 3), with other pathogens predicted to contribute a small fraction of the total predicted risk. Both the epidemiological study results and the QMRA results predict risk levels during wet weather to be below the USEPA threshold mean of 32 (excess) illnesses/1000 (U.S. EPA 2012a).
Figure 3. Risk of illness from wet weather ocean exposure

Chapter3: QMRA Surfer Health Study
104
The confidence interval of the QRMA results is wider than that reported by the epidemiological study. The CART analysis indicates that about 75% of the simulations produced results that were within the 95% CI of the epidemiological study. The simulation risks outside of those reported results occur when one or more of three model parameters (volume of water ingested, NoV density, and NoV dose-response) are in the upper percentiles of their respective distributions. The highest simulation results occurred when all three of these model parameters occurred in the upper percentiles of their respective distributions simultaneously.
V. Discussion
To our knowledge this is the first study in which an epidemiological investigation and QMRA were conducted concurrently in temperate marine water not impacted by POTW effluent. A QMRA was conducted concurrently with an epidemiological study at a tropical marine location and helped to interpret the empirical results (Soller et al. 2015b). Dorevitch et al. (2015) evaluated indicator microbes, protozoan pathogens, and turbidity as predictors of gastrointestinal illness following a cohort study of incidental contact water recreation at wastewater impacted freshwater sites in the Chicago, IL area.
The average illness rates predicted by the QMRA for the present study were in broad agreement with the epidemiological results from the same location (Arnold et al. 2016). Average illness rates were nearly identical, but the study results differed in two aspects. The QMRA provided wider confidence estimates (described in more detail below), an artifact of taking on the full range of uncertainty in the model and not just measured uncertainty about the mean. In contrast, the epidemiology study lacked the ability to confirm the etiologic agent(s); doing so was not part of the study design as laboratory analyses are resource intensive. Epidemiological studies do not typically include specific pathogen monitoring (Fleisher et al. 2010, Griffith et al. 2016, Wade et al. 2010). The QMRA was able to predict the etiological agents of primary concern, in this case NoV. Human enteric viruses are also suspected to be of concern in marine and freshwaters impacted by wastewater effluent sources (Cabelli et al. 1982, Soller et al. 2010a) and tropical waters impacted by dry weather run-off (Viau et al. 2011).
There are several important lessons we learned during the conduct of this evaluation. First, we wanted to evaluate the importance of uncertainty from NoV dose response model selection. Several researchers have published dose response relationships, infectivity data, and perspectives on issues with prior work (Atmar et al. 2014, Messner et al. 2014, Schmidt 2015, Teunis et al. 2008, Van Abel et al. 2016a). Rather than selecting one dataset or dose-response relationship over another from those reported in the literature, we chose to model the dose-response relationship in a number of ways to take on the existing uncertainty in the dose-response model selection. The approach that performed the best relative to the observational component of this study essentially modeled the dose-response as an envelope, or cloud, rather than as a line. The downside to this approach was that it did cause a large uncertainty range in our results, particularly in iterations where high infectivity was matched with large ingestion volumes and/or

Chapter3: QMRA Surfer Health Study
105
high NoV densities. This was most apparent in the CART analysis. We also realized the interdependence of our assumptions on our results. For example, if the fecal contamination was not fresh, as we assumed, our predicted results would have been different, and may have influenced our interpretation about the most appropriate dose-response model. Nevertheless, in the absence of new information, our recommendation would be that future QMRAs addressing recreational risks from exposures that include NoV consider the same approach as we used in this study.
Second, a priori, we believed that dilution from the discharges to the points of exposure would be a critically important factor in our evaluation. Given the spectrum of choices to conduct fate and transport modeling, and the potential associated costs and levels of effort, we chose a simple approach over more complex and costly alternatives. There are limitations to our choice. Notably, our small sample size limits our ability to critically evaluate conditions which require compartmentalizing our results into smaller sub-units. For example, we attempted to model risks from various storm sizes to determine if a differential risk exists between small (<0.5 inch), medium (0.5-1.5 inch) or large (>1.5 inch) storms. We found our lack of sample size limited our ability to match or refine the observational estimates (Arnold et al. 2016). Furthermore, given that our dilution estimates are site-specific, this component of our work should not be applied to other locations or settings. Our efforts do, however, highlight the need to critically evaluate the necessary complexity of fate and transport modeling for other locations with similar contamination dynamics and where QMRA is used to estimate potential human health risks from recreational exposures to the contaminated waters.
Third, we found that the combined and incremental use of sanitary survey data collection, fecal indicator monitoring, human marker monitoring, and pathogen monitoring was a reasonable and prudent undertaking, particularly given the potential costs associated with remediation and/or water quality criteria refinement. Finally, we found that transparent discussion of the results from this study is yielding a healthy and fruitful conversation about potential management decisions and remedial actions within the watershed.
Our findings highlight an interesting and challenging management situation. Human enteric viruses were found in the discharges and are predicted to be important etiologic agents. The use of HF183 as a human marker confirmed the presence of human contamination. The predicted average illness levels were substantially lower at substantially higher levels of culturable enterococci (and other FIB) when compared to the sites characterized by EPA during the NEEAR study (U.S. EPA 2012a; Wade et al. 2006, 2008, 2010). The predicted and observed illness levels in this study are shorter term predictions than specified by the federal water quality criteria, and thus are likely represent more of a worst case scenario than an average illness level for a 30-day period since they are only based on wet weather exposures, and wet weather is unlikely to persist for any continuous 30-day period in southern California. This set of circumstances highlights the potential utility of the vetted and tuned QMRA to inform future

Chapter3: QMRA Surfer Health Study
106
regional decision-making as managers consider how to efficiently allocate resources to ensure public health protection.
VI. Conclusions
This study provided QMRA estimates of GI illness from recreational exposure to stormwater impacted marine beaches due to municipal separate storm sewer system discharges not known to be impacted by POTW effluents. The QMRA estimates matched empirical measurements from the concurrent epidemiology study well. Sensitivity analysis indicated several factors that QMRA practitioners at marine beaches can use for future applications, including utilizing the full range of Norovirus dose-response uncertainty to capture the accuracy of predicted GI illness.

Chapter3: QMRA Surfer Health Study
107
VII. References
Ackerman, D., K.C. Schiff, S.B. Weisberg. 2005. Evaluating HSPF in an arid, urbanized watershed. J Amer Water Resources Assn 41(2): 477-486.
Arnold, B.F., K.C. Schiff, A. Ercumen, J. Bemnjamen-Chung, J.A. Steele, J.F. Griffith, S.J Steinberg, P.D Smith, C. McGee, R. Wilson, C. Nelson, S.B. Weisberg, J.M. Colford Jr. 2016. Acute illness associated with ocean exposure and fecal indicator bacteria during dry and wet weather: a longitudinal cohort study of surfers in San Diego, California. In preparation.
Atmar, R.L., A.R. Opekun, M.A. Gilger, M.K. Estes, S.E. Crawford, F.H. Neill, D.Y. Graham. 2008. Norwalk virus shedding after experimental human infection. Emerg Infect Dis 14(10): 1553-1557.
Atmar, R.L., A.R. Opekun, M.A. Gilger, M.K. Estes, S.E. Crawford, F.H. Neill, S. Ramani, H. Hill, J. Ferreira, D.Y. Graham. 2014. Determination of the 50% human infectious dose for Norwalk virus. J Infect Dis 209(7): 1016-1022.
Bae, S., S. Wuertz. 2012. Survival of host-associated bacteroidales cells and their relationship with Enterococcus spp., Campylobacter jejuni, Salmonella enterica serovar Typhimurium, and adenovirus in freshwater microcosms as measured by propidium monoazide-quantitative PCR. Appl Environ Microbiol 78(4): 922-932.
Cabelli, V.J., A.P. Dufour, L.J. McCabe, M.A Levin. 1982. Swimming-associated gastroenteritis and water quality. Am J Epidemiol 115:606-616.
Cao, Y., M.R. Raith, J.F. Griffith. 2015. Droplet digital PCR for simultaneous quantification of general and human-associated fecal indicators for water quality assessment. Water Res 70:337-349.
Colford, J.M., Jr., T.J. Wade, K.C. Schiff, C.C. Wright, J.F. Griffith, S.K. Sandhu, S. Burns, M. Sobsey, G. Lovelace, S.B. Weisberg. 2007. Water quality indicators and the risk of illness at beaches with nonpoint sources of fecal contamination. Epidemiology 18(1): 27-35.
Colford, J.M., Jr., K.C. Schiff, J.F. Griffith, V. Yau, B.F. Arnold, C.C. Wright, J.S. Gruber, T.J. Wade, S. Burns, J. Hayes, C. McGee, M. Gold, Y. Cao, R.T. Noble, R. Haugland, and S.B. Weisberg. 2012. Using rapid indicators for Enterococcus to assess the risk of illness after exposure to urban runoff contaminated marine water. Water Res 46(7): 2176-2186.
Crabtree, K.D., C.P. Gerba, J.B. Rose, C.N. Haas. 1997. Waterborne adenovirus: A risk assessment. Water Sci Technol 35(11-12): 1-6.
da Silva AK, Le Saux JC, Parnaudeau S, Pommepuy M, Elimelech M, Le Guyader FS. 2007. Evaluation of Removal of Noroviruses during Wastewater Treatment, Using Real-Time Reverse Transcription-PCR: Different Behaviors of Genogroups I and II. Applied and Environmental Microbiology 73:7891–7897

Chapter3: QMRA Surfer Health Study
108
Dorevitch, S., S. Panthi, Y. Huang, H. Li,, A.M. Michalek, P. Pratap, M. Wroblewski, L. Liu, P.A Scheff, and A. Li. 2011. Water ingestion during water recreation. Water Res 45(5): 2020-2028.
Dorevitch, S., S. DeFlorio-Barker, R.M. Jones, and L. Liu. 2015. Water quality as a predictor of gastrointestinal illness following incidental contact water recreation. Water Res 83(94-103.
Dufour, A.P., O. Evans, T. Behymer, and R. Cantu. 2006. Water ingestion during swimming activities in a pool: a pilot study. J Water Health 4(4): 425-430.
Dwight, R.H., D.B. Baker, J.C. Semenza, and B.H. Olson. 2004. Health effects associated with recreational coastal water use: Urban versus rural California. American Journal Of Public Health 94(4): 565-567.
Eisenberg, J.N.S., and T.E. McKone. 1998. Decision tree method for the classification of chemical pollutants: Incorporation of across-chemical variability and within-chemical uncertainty. Environ Sci Technol 32(21): 3396-3404.
Eisenberg, J.N.S., X.D. Lei, A.H. Hubbard, M.A. Brookhart, and J.M. Colford. 2005. The role of disease transmission and conferred immunity in outbreaks: Analysis of the 1993 Cryptosporidium outbreak in Milwaukee, Wisconsin. American Journal of Epidemiology 161(1): 62-72.
Fleisher, J.M., L.E. Fleming, H.M. Solo-Gabriele, J.K. Kish, C.D. Sinigalliano, L. Plano, S.M. Elmir, J.D. Wang, K. Withum, T. Shibata, M.L. Gidley, A. Abdelzaher, G. He, C. Ortega, X. Zhu, M. Wright, J. Hollenbeck, and L.C. Backer. 2010. The BEACHES Study: health effects and exposures from non-point source microbial contaminants in subtropical recreational marine waters. Int J Epidemiol: dyq084.
Gregory JB, Litaker RW, Noble RT. 2006. Rapid One-Step Quantitative Reverse Transcriptase PCR Assay with Competitive Internal Positive Control for Detection of Enteroviruses in Environmental Samples. Applied and Environmental Microbiology 72:3960–3967
Griffith, J.F., S.B. Weisberg, B.F. Arnold, Y. Cao, K.C. Schiff, and J.M. Colford, Jr. 2016. Epidemiologic evaluation of multiple alternate microbial water quality monitoring indicators at three California beaches. Water Res 94(371-381.
Haas, C.N., J.B. Rose, and C.P. Gerba. 1999. Quantitative microbial risk assessment(eds), J.W. Wiley, Inc.,
He, Y., X. Yao, N.W. Gunther, Y. Xie, S.-I. Tu, and S.X. Shu. 2010. Simultaneous Detection and Differentiation of Campylobacter jejuni, C. coli, and C. lari in Chickens Using a Multiplex Real-Time PCR Assay. Food Anal Methods 3(321–329.
Jothikumar N, Cromeans TL, Hill VR, Lu X, Sobsey MD, Erdman DD. 2005. Quantitative Real-Time PCR Assays for Detection of Human Adenoviruses and Identification of Serotypes 40 and 41. Applied and Environmental Microbiology 71:3131–3136

Chapter3: QMRA Surfer Health Study
109
LaGier MJ, Joseph LA, Passaretti TV, Musser KA, Cirino NM. 2004. A real-time multiplexed PCR assay for rapid detection and differentiation of Campylobacter jejuni and Campylobacter coli. Molecular and Cellular Probes 18:275–282
Lund M, Nordentoft S, Pedersen K, Madsen M. 2004. Detection of Campylobacter spp. in Chicken Fecal Samples by Real-Time PCR. J Clin Microbiol 42:5125–5132
Malorny B, Lofstrom C, Wagner M, Kramer N, Hoorfar J. 2008. Enumeration of Salmonella Bacteria in Food and Feed Samples by Real-Time PCR for Quantitative Microbial Risk Assessment. Applied and Environmental Microbiology 74:1299–1304
Mead, P.S., L. Slutsker, V. Dietz, L.F. McCaig, J.S. Bresee, C. Shapiro, P.M. Griffin, and R.V. Tauxe. 1999. Food related illness and death in the United States. Emerging Infectious Diseases 5(5): 607-625.
Medema, G.J., P.F. Teunis, A.H. Havelaar, and C.N. Haas. 1996. Assessment of the dose-response relationship of Campylobacter jejuni. Int J Food Microbiol 30(1-2): 101-111.
Messner, M.J., P. Berger, and S.P. Nappier. 2014. Fractional Poisson--a simple dose-response model for human norovirus. Risk Anal 34(10): 1820-1829.
Noble, R.T., M. Dorsey, M.K. Leecaster, V. Orozco-Borbon, D. Reid, K. Schiff, and S.B. Weisberg. 2000. A regional survey of the microbiological water quality along the shoreline of the southern California bight. Environmental Monitoring and Assessment 64(435-447.
Noble, R.T., D.F. Moore, M.K. Leecaster, C.D. McGee, and S.B. Weisberg. 2003. Comparison of total coliform, fecal coliform, and enterococcus bacterial indicator response for ocean recreational water quality testing. Water Research 37(1637-1643.
Prüss, A. 1998. Review of epidemiological studies on health effects from exposure to recreational water. Int J Epidemiol 27(1): 1-9.
Regli, S., J.B. Rose, C.N. Haas, and C.P. Gerba. 1991. Modeling the risk from Giardia and viruses in drinking-water. Journal of the American Water Works Association 83(11): 76-84.
Roser, D., and N. Ashbolt. 2007. Source Water Quality Assessment and the Management of Pathogens in Surface Catchments and Aquifers. Research Report 29. Cooperative Research Centre for Water Quality and Treatment (Australia)
Scallan, E., R.M. Hoekstra, F.J. Angulo, R.V. Tauxe, M.A. Widdowson, S.L. Roy, J.L. Jones, and P.M. Griffin. 2011. Foodborne illness acquired in the United States--major pathogens. Emerging Infectious Diseases 17(1): 7-15.
Schiff, K.C., J. Morton, and S.B. Weisberg. 2003. Retrospective evaluation of shoreline water quality along Santa Monica Bay beaches. Marine Environmental Research 56(1-2): 245-253.
Schiff, K.C., D. Greenstein, N. Dodder, and D. Gillett. 2015. Southern California Bight regional monitoring. Regional Studies in Marine Science. http://dx.doi.org/10.1016/j.rsma.2015.09.003.

Chapter3: QMRA Surfer Health Study
110
Schijven, J., and A.M. de Roda Husman. 2006. A survey of diving behavior and accidental ingestion among dutch occupational and sport divers to assess the risk of infection with waterborne pathogenic microorganisms. Environmental Health Perspectives 114(5): 712-717.
Schmidt, P.J. 2015. Norovirus Dose-Response: Are Currently Available Data Informative Enough to Determine How Susceptible Humans Are to Infection from a Single Virus? Risk Anal 35(7): 1364-1383.
Schoen, M.E., and N.J. Ashbolt. 2010. Assessing pathogen risk to swimmers at non-sewage impacted recreational beaches. Environ Sci Technol 44(7): 2286-2291.
Schoen, M.E., J.A. Soller, and N.J. Ashbolt. 2011. Evaluating the importance of faecal sources in human-impacted waters. Water Res 45(8): 2670-2680.
Sinton, L., C. Hall, and R. Braithwaite. 2007. Sunlight inactivation of Campylobacter jejuni and Salmonella enterica, compared with Escherichia coli, in seawater and river water. J Water Health 5(3): 357-365.
Soller, J., T. Bartrand, M. Molina, G. Whelan, M. Schoen, and A. Ashbolt. 2015a. Estimated human health risks from recreational exposures to stormwater containing animal faecal material. Envrion Modelling & Software 72(21-32.
Soller, J.A., A. Olivieri, J. Crook, R. Parkin, R. Spear, G. Tchobanoglous, and J.N.S. Eisenberg. 2003. Risk-based approach to evaluate the public health benefit of additional wastewater treatment. Environmental Science & Technology 37(9): 1882-1891.
Soller, J.A., J.N.S. Eisenberg, J.F. DeGeorge, R.C. Cooper, G. Tchobanoglous, and A.W. Olivieri. 2006. A public health evaluation of recreational water impairment. Journal of Water and Health 4(1): 1-19.
Soller, J.A., E.Y. Seto, and A.W. Olivieri. 2007. Application of microbial risk assessment techniques to estimate risk due to exposure to reclaimed waters(eds), WateReuse Foundation Report WRF-04-011,
Soller, J.A., and J.N.S. Eisenberg. 2008. An evaluation of parsimony for microbial risk assessment models. Environmetrics 19(1): 61-78.
Soller, J.A., T. Bartrand, N.J. Ashbolt, J. Ravenscroft, and T.J. Wade. 2010a. Estimating the primary etiologic agents in recreational freshwaters impacted by human sources of faecal contamination. Water Res 44(16): 4736-4747
Soller, J.A., M.E. Schoen, T. Bartrand, J. Ravenscroft, and N.J. Ashbolt. 2010b. Estimated human health risks from exposure to recreational waters impacted by human and non-human sources of faecal contamination. Water Res 44(16): 4674-4691.
Soller, J.A., S. Eftim, T.J. Wade, A.M. Ichida, J.L. Clancy, T. Johnson, K. Schwab, G. Ramirez-Toro, S. Nappier, and J.E. Ravenscroft. 2015b. Use of quantitative microbial risk assessment to

Chapter3: QMRA Surfer Health Study
111
improve interpretation of a recreational water epidemiological study. Microbial Risk Analysis 1(1).
Steinberg, D., and P. Colla. 1997. CART - classification and regression trees. San Diego, CA, Salford Systems
Stone, D.L., A.K. Harding, B.K. Hope, and S. Slaughter-Mason. 2008. Exposure assessment and risk of gastrointestinal illness among surfers. J Toxicol Environ Health A 71(24): 1603-1615.
Teunis, P.F., C.L. Moe, P. Liu, S.E Miller, L. Lindesmith, R.S. Baric, J. Le Pendu, and R.L. Calderon. 2008. Norwalk virus: How infectious is it? Journal of medical virology 80(8): 1468-1476.
Thoe, W., M. Gold, A. Griesbach, M. Grimmer, M.L. Taggart, and A.B. Boehm. 2014. Predicting water quality at Santa Monica Beach: evaluation of five different models for public notification of unsafe swimming conditions. Water Res 67(105-117.
U.S. EPA.1986. Ambient Water Quality Criteria for Bacteria. U.S. Environmental Protection Agency, Office of Water Regulations and Standards
U.S. EPA. 1991. Technical Support Document Water Quality-based Toxics Control, EPA/505/2-90-001 Office of Water,
U.S. EPA. 2010. Quantitative Mircobial Risk Assessment to Estimate Illness in Freshwater Impacted by Agricultureal Animal Sources of Fecal Contamination, EPA 822-R-10-005, Office of Science and Technology, Washington, D.C.
U.S. EPA. 2012a. Recreational Water Quality Criteria, 820-F-12-058, Office of Water, Washington, D.C.
U.S. EPA. 2012b. Microbiological risk assessment tools, methods, and approaches for water media, In preparation, Office of Science and Technology, Washington, D.C.
U.S. EPA. 2014. Microbiological Risk Assessment (MRA) tools, methods, and approaches for water media, EPA-820-R-14-009, Office of Science and Technology,
Van Abel, N., M. Schoen, and J.S. Meschke. 2016a. Comparison of Risk Predicted by Multiple Norovirus Dose-Response Models and Implications for Quantitative Microbial Risk Assessment. Risk Analysis, In Press.
Van Abel, N., M. Schoen, and J.S. Meschke. 2016b. Comparison of Risk Predicted by Multiple Norovirus Dose-Response Models and Implications for Quantitative Microbial Risk Assessment. Risk Analysis.
Viau, E.J., D. Lee, and A.B. Boehm. 2011. Swimmer risk of gastrointestinal illness from exposure to tropical coastal waters impacted by terrestrial dry-weather runoff. Environ Sci Technol 45(17): 7158-7165.
Chapter3: QMRA Surfer Health Study
112
Vondrakova, L., Pazelrova, J., Demnerova, K. 2014. Detection, identification and quantification of Campylobacter jejuni, coli and lari in food matrices all at once using multiplex qPCR. Gut Pathogens 6:12, doi: 10.1186/1757-4749-6-12).
Wade, T.J., N. Pai, J. Eisenberg, and J.M. Colford. 2003. Do US EPA water quality guidelines for recreational waters prevent gastrointestinal illness? A systematic review and meta-analysis. Environ Heal Perspec 111(8): 1102-1109.
Wade, T.J., R.L. Calderon, E. Sams, M. Beach, K.P. Brenner, A.H. Williams, and A.P. Dufour. 2006. Rapidly measured indicators of recreational water quality are predictive of swimming-associated gastrointestinal illness. Environ Health Perspect 114(1): 24-28.
Wade, T.J., R.L. Calderon, K.P. Brenner, E. Sams, M. Beach, R. Haugland, L. Wymer, and A.P. Dufour. 2008. High sensitivity of children to swimming-associated gastrointestinal illness: results using a rapid assay of recreational water quality. Epidemiology 19(3): 375-383.
Wade, T.J., E. Sams, K.P. Brenner, R. Haugland, E. Chern, M. Beach, L. Wymer, C.C. Rankin, D. Love, Q. Li, R. Noble, and A.P. Dufour. 2010. Rapidly measured indicators of recreational water quality and swimming-associated illness at marine beaches: A prospective cohort study. Environ Health 9(1): 66.
WHO. 2004. Guidelines for drinking-water quality. Third edition. Volume 1 World Health Organization, Geneva.