superdata 2018 year in review fortnite earning figures in this report do not encompass the game’s...
TRANSCRIPT
2018 YEAR IN REVIEW | © 2019 SuperData, A Nielsen Company. All rights reserved.
2018 YEAR IN REVIEW DIGITAL GAMES AND INTERACTIVE MEDIA
�2
SuperData, A Nielsen Company
SuperData, a Nielsen company, was acquired by Nielsen in September 2018. With this acquisiIon, SuperData’s clients will now have greater access to global market intelligence around digital video gaming use, sales and audiences, in addiIon to exisIng areas of experIse such as consumer research, video game tracking, esports sponsorship valuaIon and consulIng services.
SuperData provides relevant market data and insight on digital games and playable media. Founded by veteran games industry researchers, SuperData covers the market for free-to-play gaming, digital console, mobile, PC downloadable, gaming video content and esports.
Monthly analyses and industry reports using digital point-of-sale data. Using digital point-of-sale data received from publishers, developers and payment service providers, we base our analyses on the monthly spending of 185 million paying digital gamers worldwide.
Understand what people play, connect to and spend on. Our research combines transacIon-level data with qualitaIve consumer insight. Our leadership team has experience spanning across major research firms, including NPD, Nielsen, DFC Intelligence, Comscore, Experian, Jupiter and Forrester.
A next gen approach for next gen entertainment. Our customer base includes legacy publishers (e.g. AcIvision/Blizzard, Ubiso]), digital-only publishers (e.g. Nexon, Tencent, Wargaming), media companies (e.g. Google, Coca-Cola) and industry service providers (e.g. PayPal, Visa, GameStop).
2018 YEAR IN REVIEW | © 2019 SuperData, A Nielsen Company. All rights reserved.
2018 YEAR IN REVIEW | © 2019 SuperData, A Nielsen Company. All rights reserved.
�3
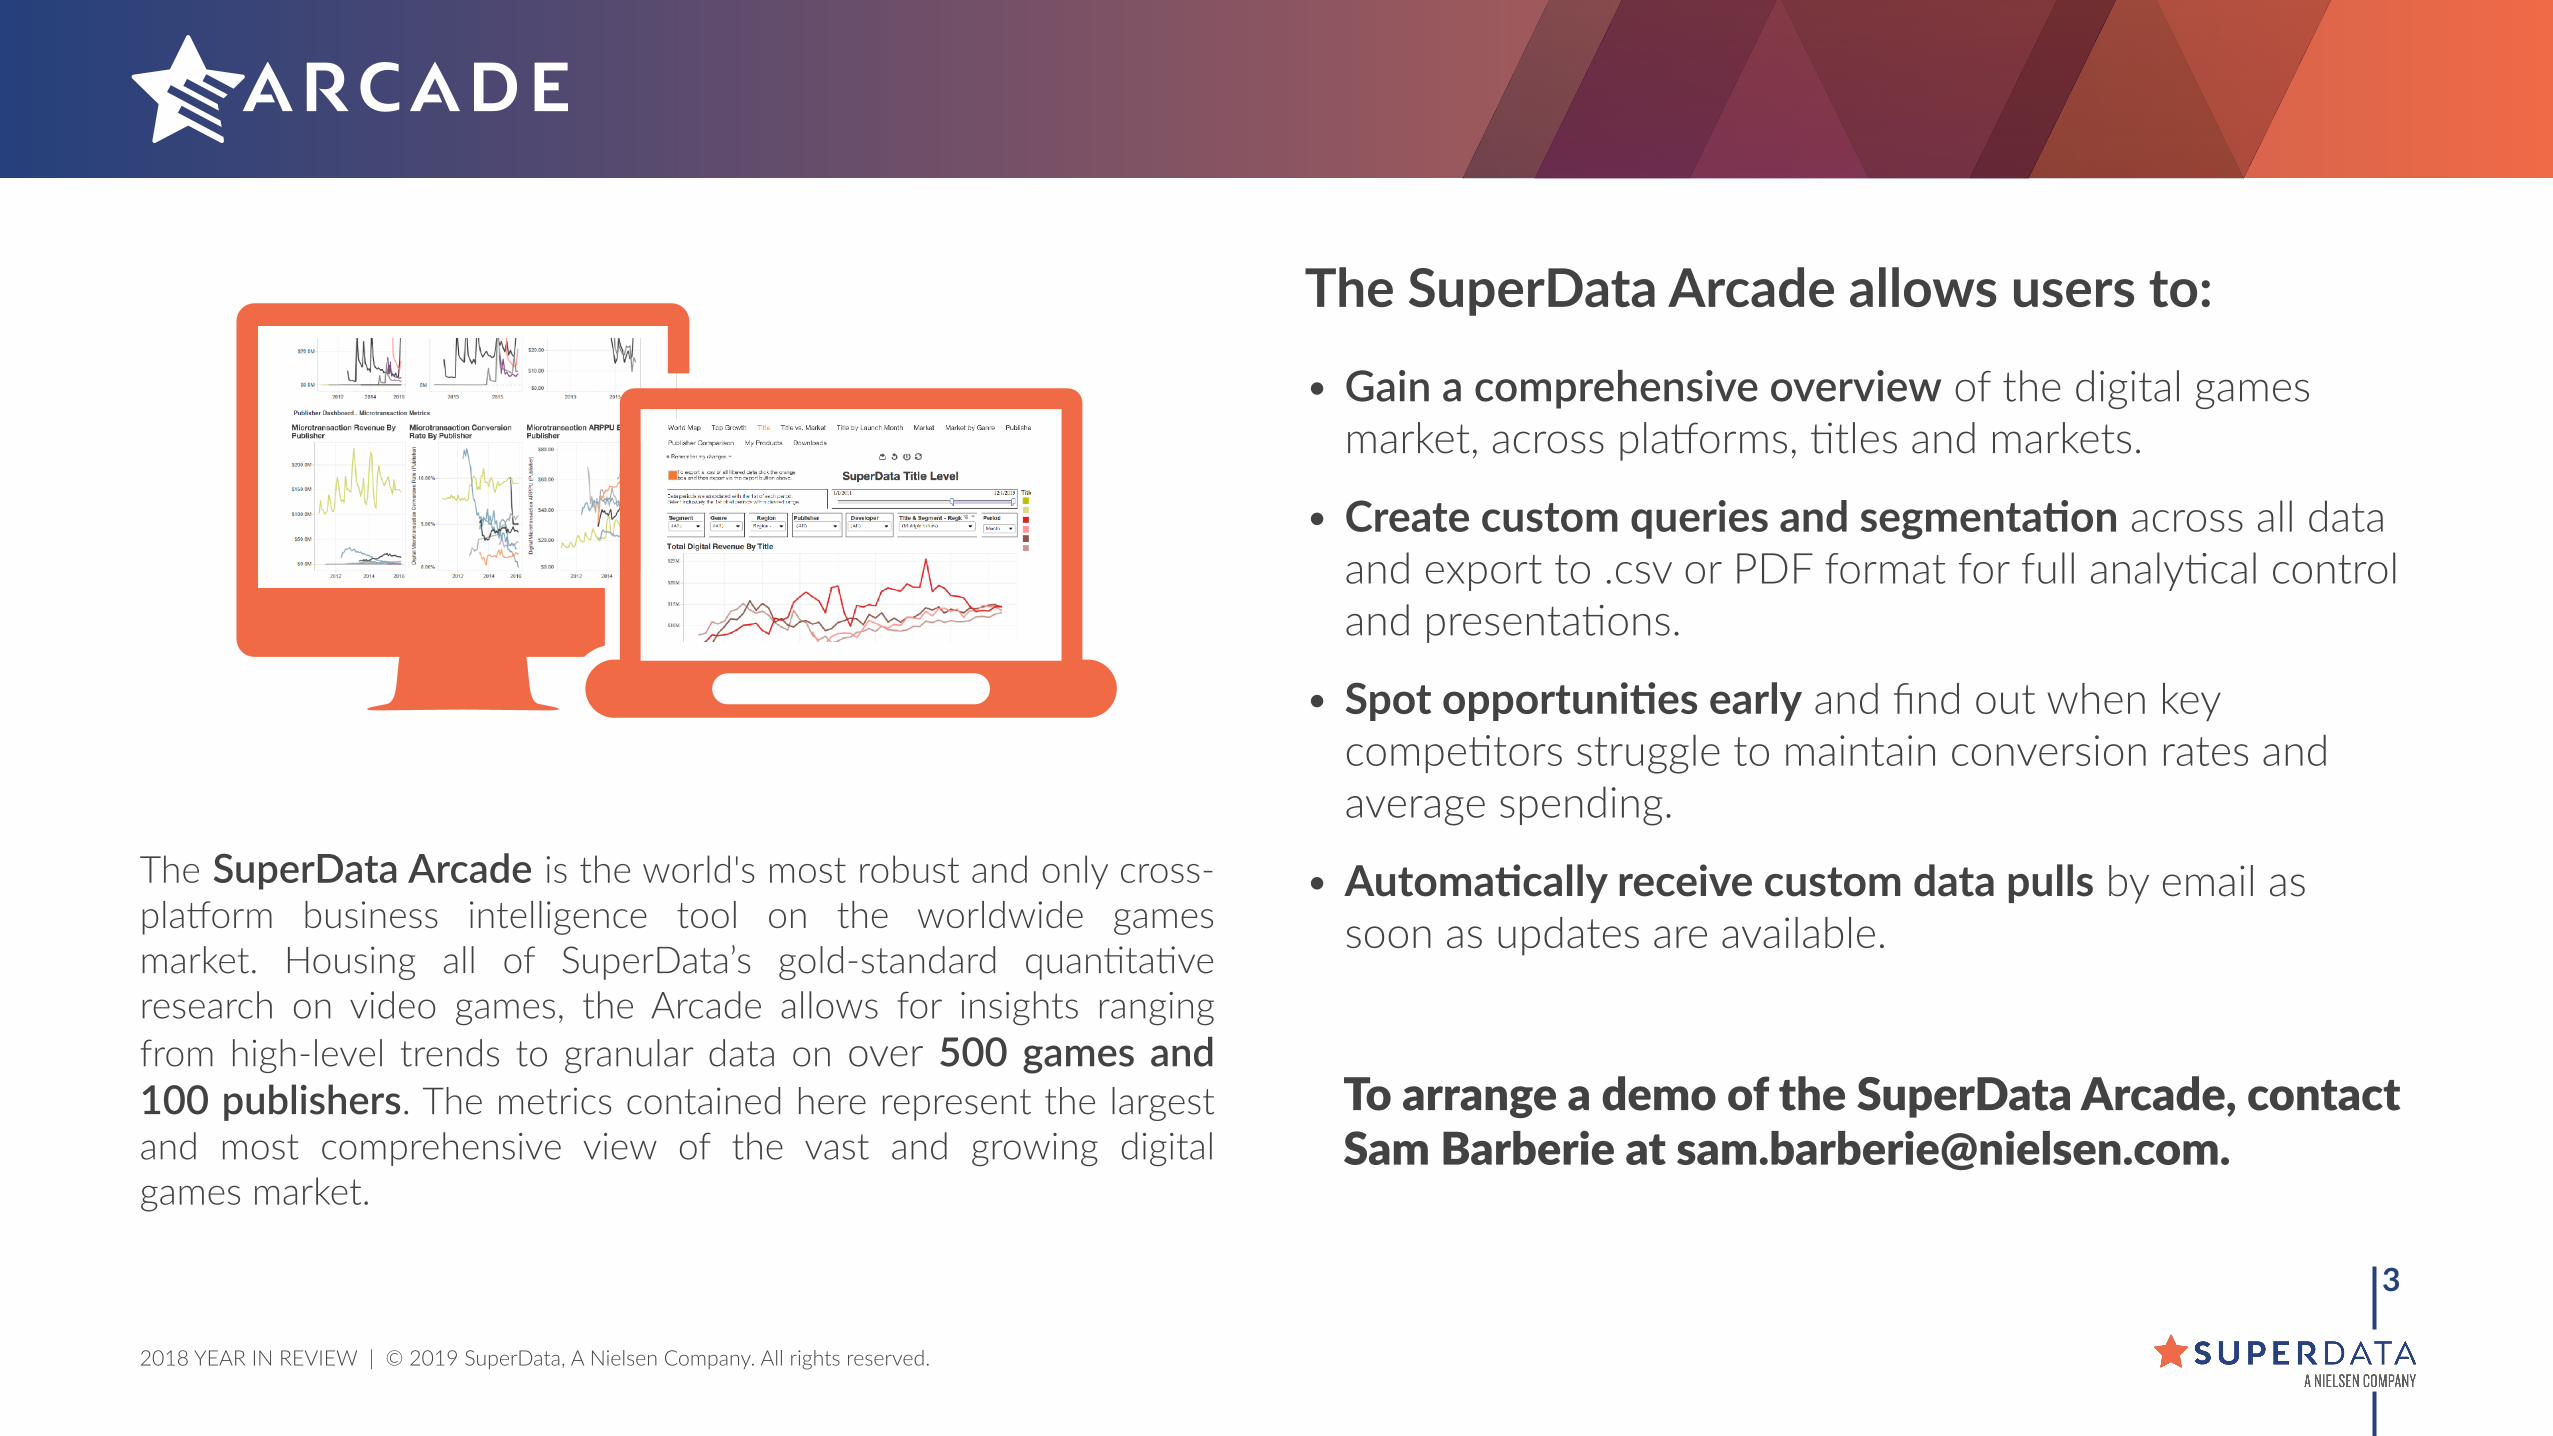
The SuperData Arcade is the world's most robust and only cross-plaborm business intelligence tool on the worldwide games market. Housing all of SuperData’s gold-standard quanItaIve research on video games, the Arcade allows for insights ranging from high-level trends to granular data on over 500 games and 100 publishers. The metrics contained here represent the largest and most comprehensive view of the vast and growing digital games market.
The SuperData Arcade allows users to:
• Gain a comprehensive overview of the digital games market, across plaborms, Itles and markets.
• Create custom queries and segmenta=on across all data and export to .csv or PDF format for full analyIcal control and presentaIons.
• Spot opportuni=es early and find out when key compeItors struggle to maintain conversion rates and average spending.
• Automa=cally receive custom data pulls by email as soon as updates are available.
To arrange a demo of the SuperData Arcade, contact Sam Barberie at [email protected].

2018 YEAR IN REVIEW | © 2019 SuperData, A Nielsen Company. All rights reserved.
EXECUTIVE SUMMARY
�4
2018 YEAR IN REVIEW | © 2019 SuperData, A Nielsen Company. All rights reserved.
�5
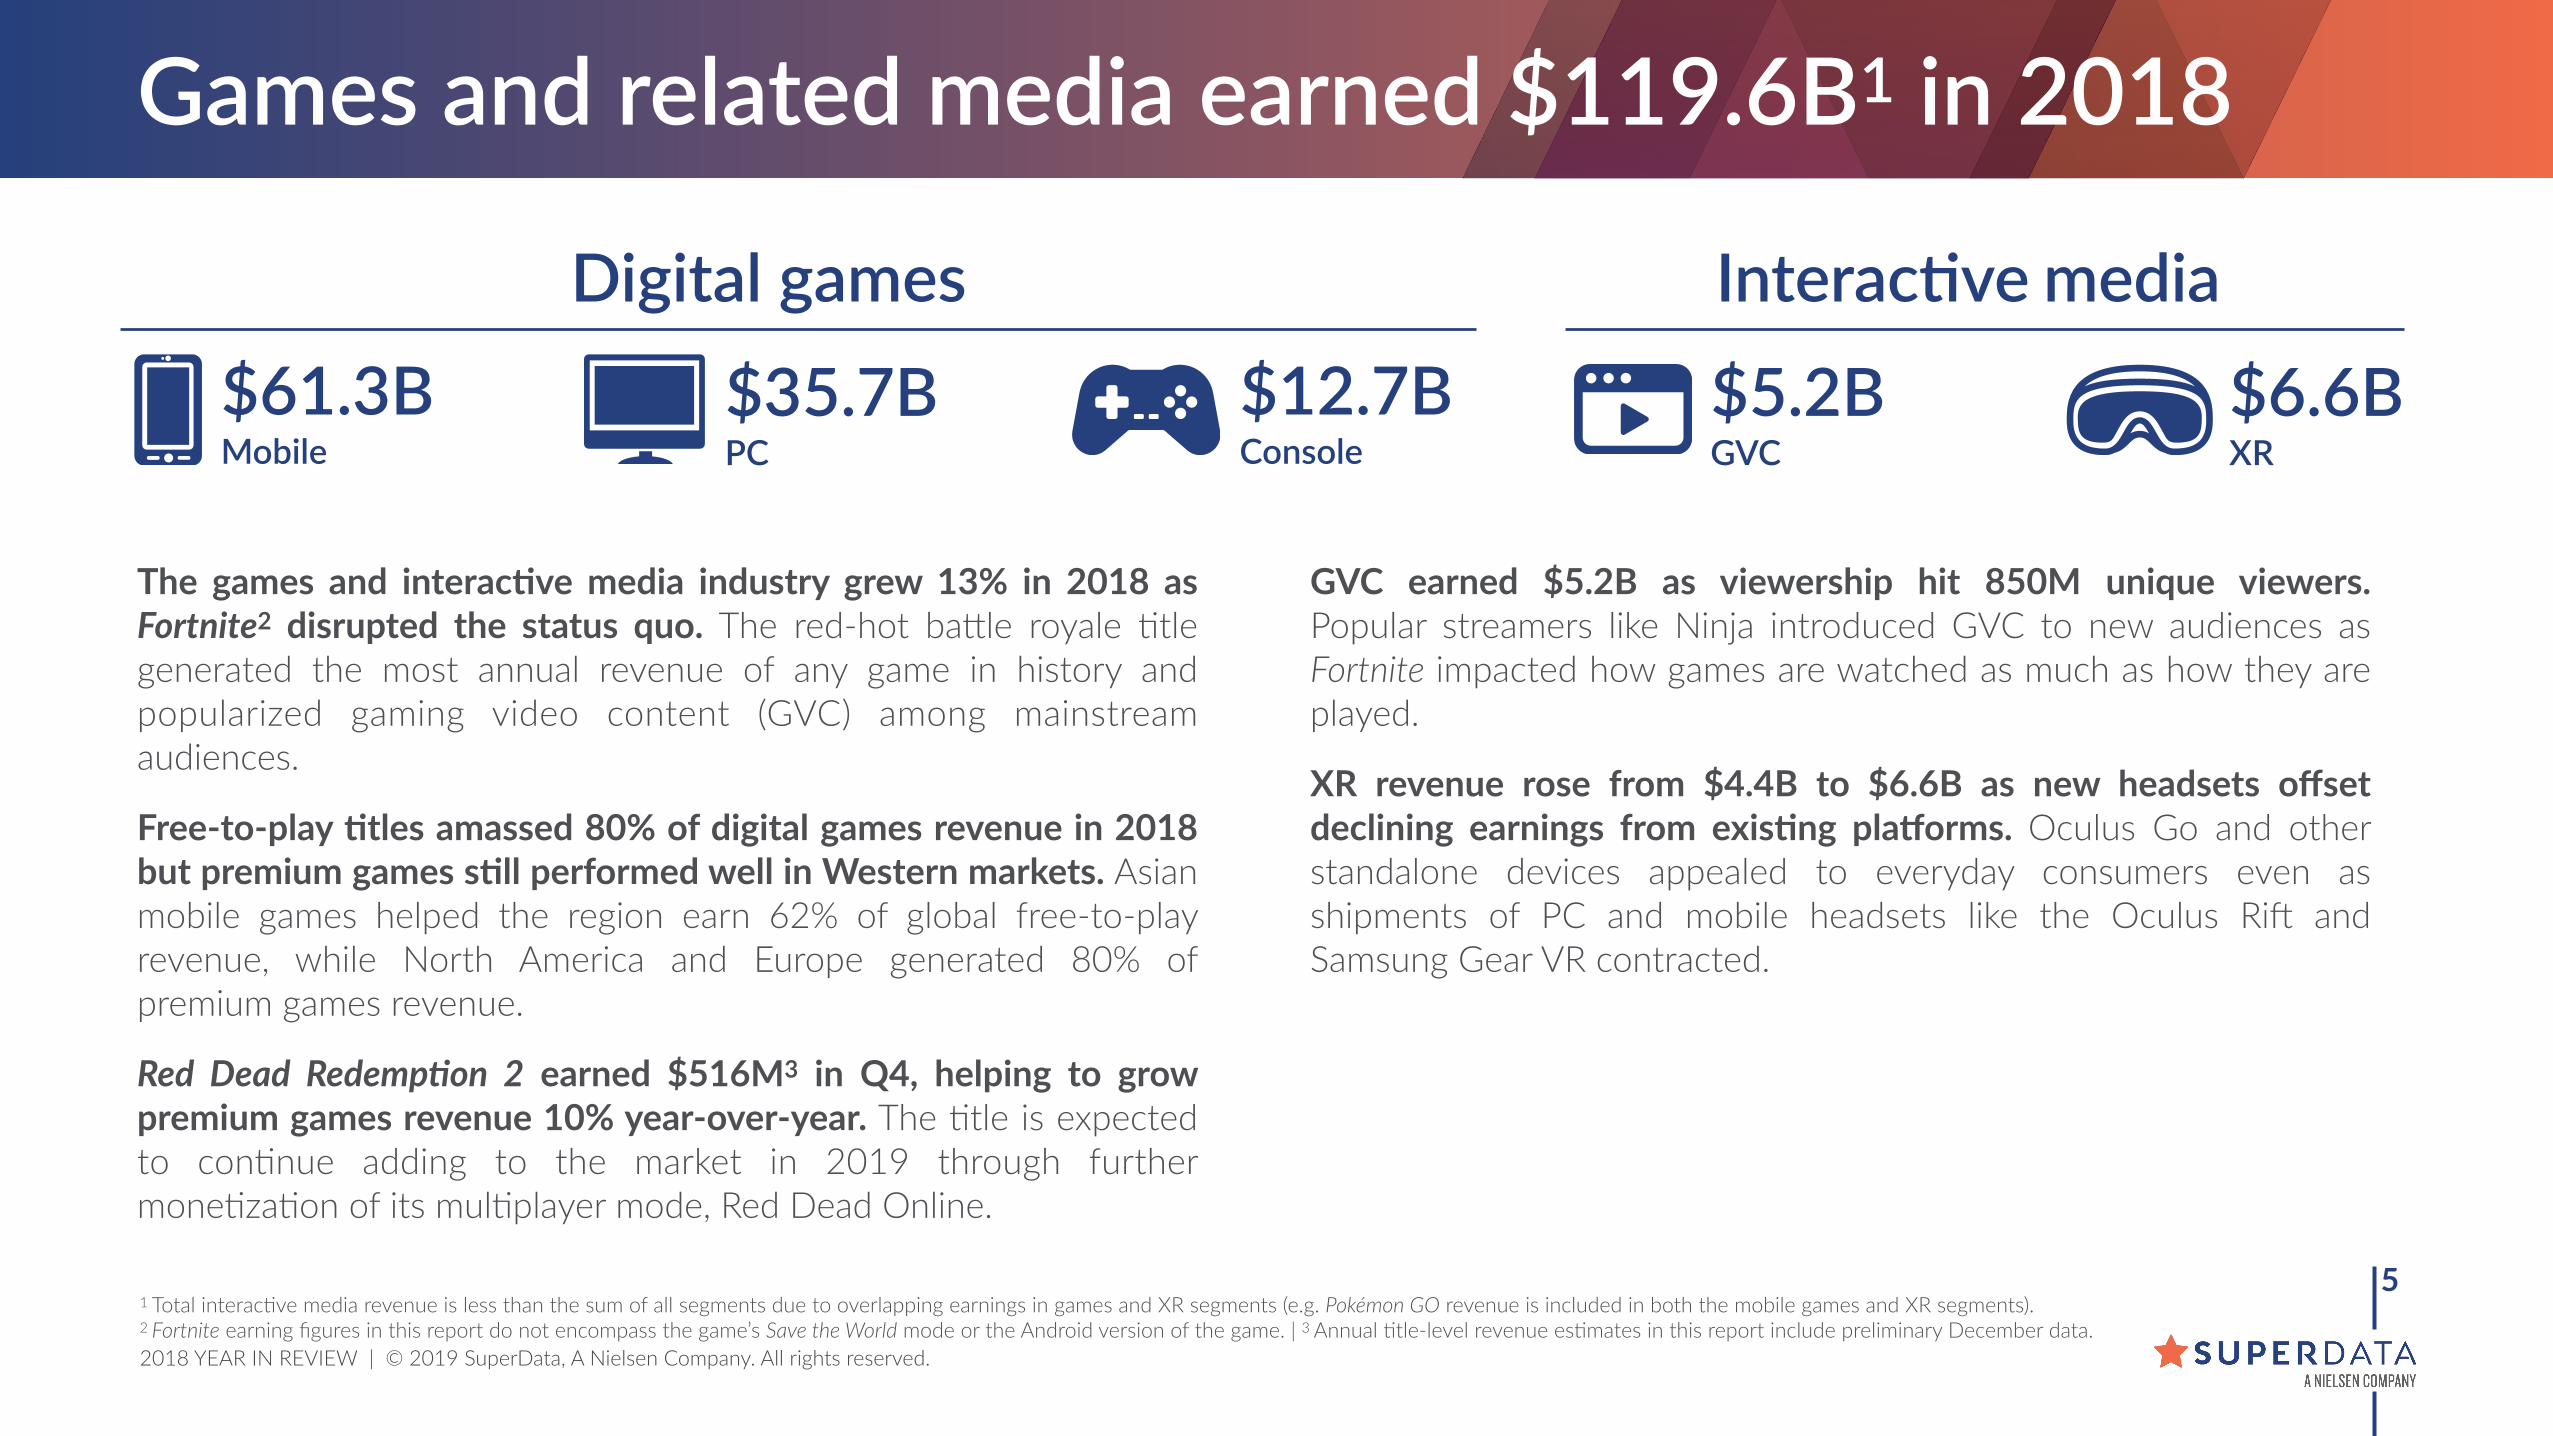
Games and related media earned $119.6B1 in 2018
1 Total interacIve media revenue is less than the sum of all segments due to overlapping earnings in games and XR segments (e.g. Pokémon GO revenue is included in both the mobile games and XR segments). 2 Fortnite earning figures in this report do not encompass the game’s Save the World mode or the Android version of the game. | 3 Annual Itle-level revenue esImates in this report include preliminary December data.
$61.3B Mobile
$35.7B PC
$12.7B Console
$5.2B GVC
$6.6B XR
InteracQve mediaDigital games
The games and interac=ve media industry grew 13% in 2018 as Fortnite2 disrupted the status quo. The red-hot bagle royale Itle generated the most annual revenue of any game in history and popularized gaming video content (GVC) among mainstream audiences.
Free-to-play =tles amassed 80% of digital games revenue in 2018 but premium games s=ll performed well in Western markets. Asian mobile games helped the region earn 62% of global free-to-play revenue, while North America and Europe generated 80% of premium games revenue.
Red Dead Redemp/on 2 earned $516M3 in Q4, helping to grow premium games revenue 10% year-over-year. The Itle is expected to conInue adding to the market in 2019 through further moneIzaIon of its mulIplayer mode, Red Dead Online.
GVC earned $5.2B as viewership hit 850M unique viewers. Popular streamers like Ninja introduced GVC to new audiences as Fortnite impacted how games are watched as much as how they are played.
XR revenue rose from $4.4B to $6.6B as new headsets offset declining earnings from exis=ng plaYorms. Oculus Go and other standalone devices appealed to everyday consumers even as shipments of PC and mobile headsets like the Oculus Ri] and Samsung Gear VR contracted.

2018 YEAR IN REVIEW | © 2019 SuperData, A Nielsen Company. All rights reserved.
DIGITAL GAMES
�6
2018 YEAR IN REVIEW | © 2019 SuperData, A Nielsen Company. All rights reserved.
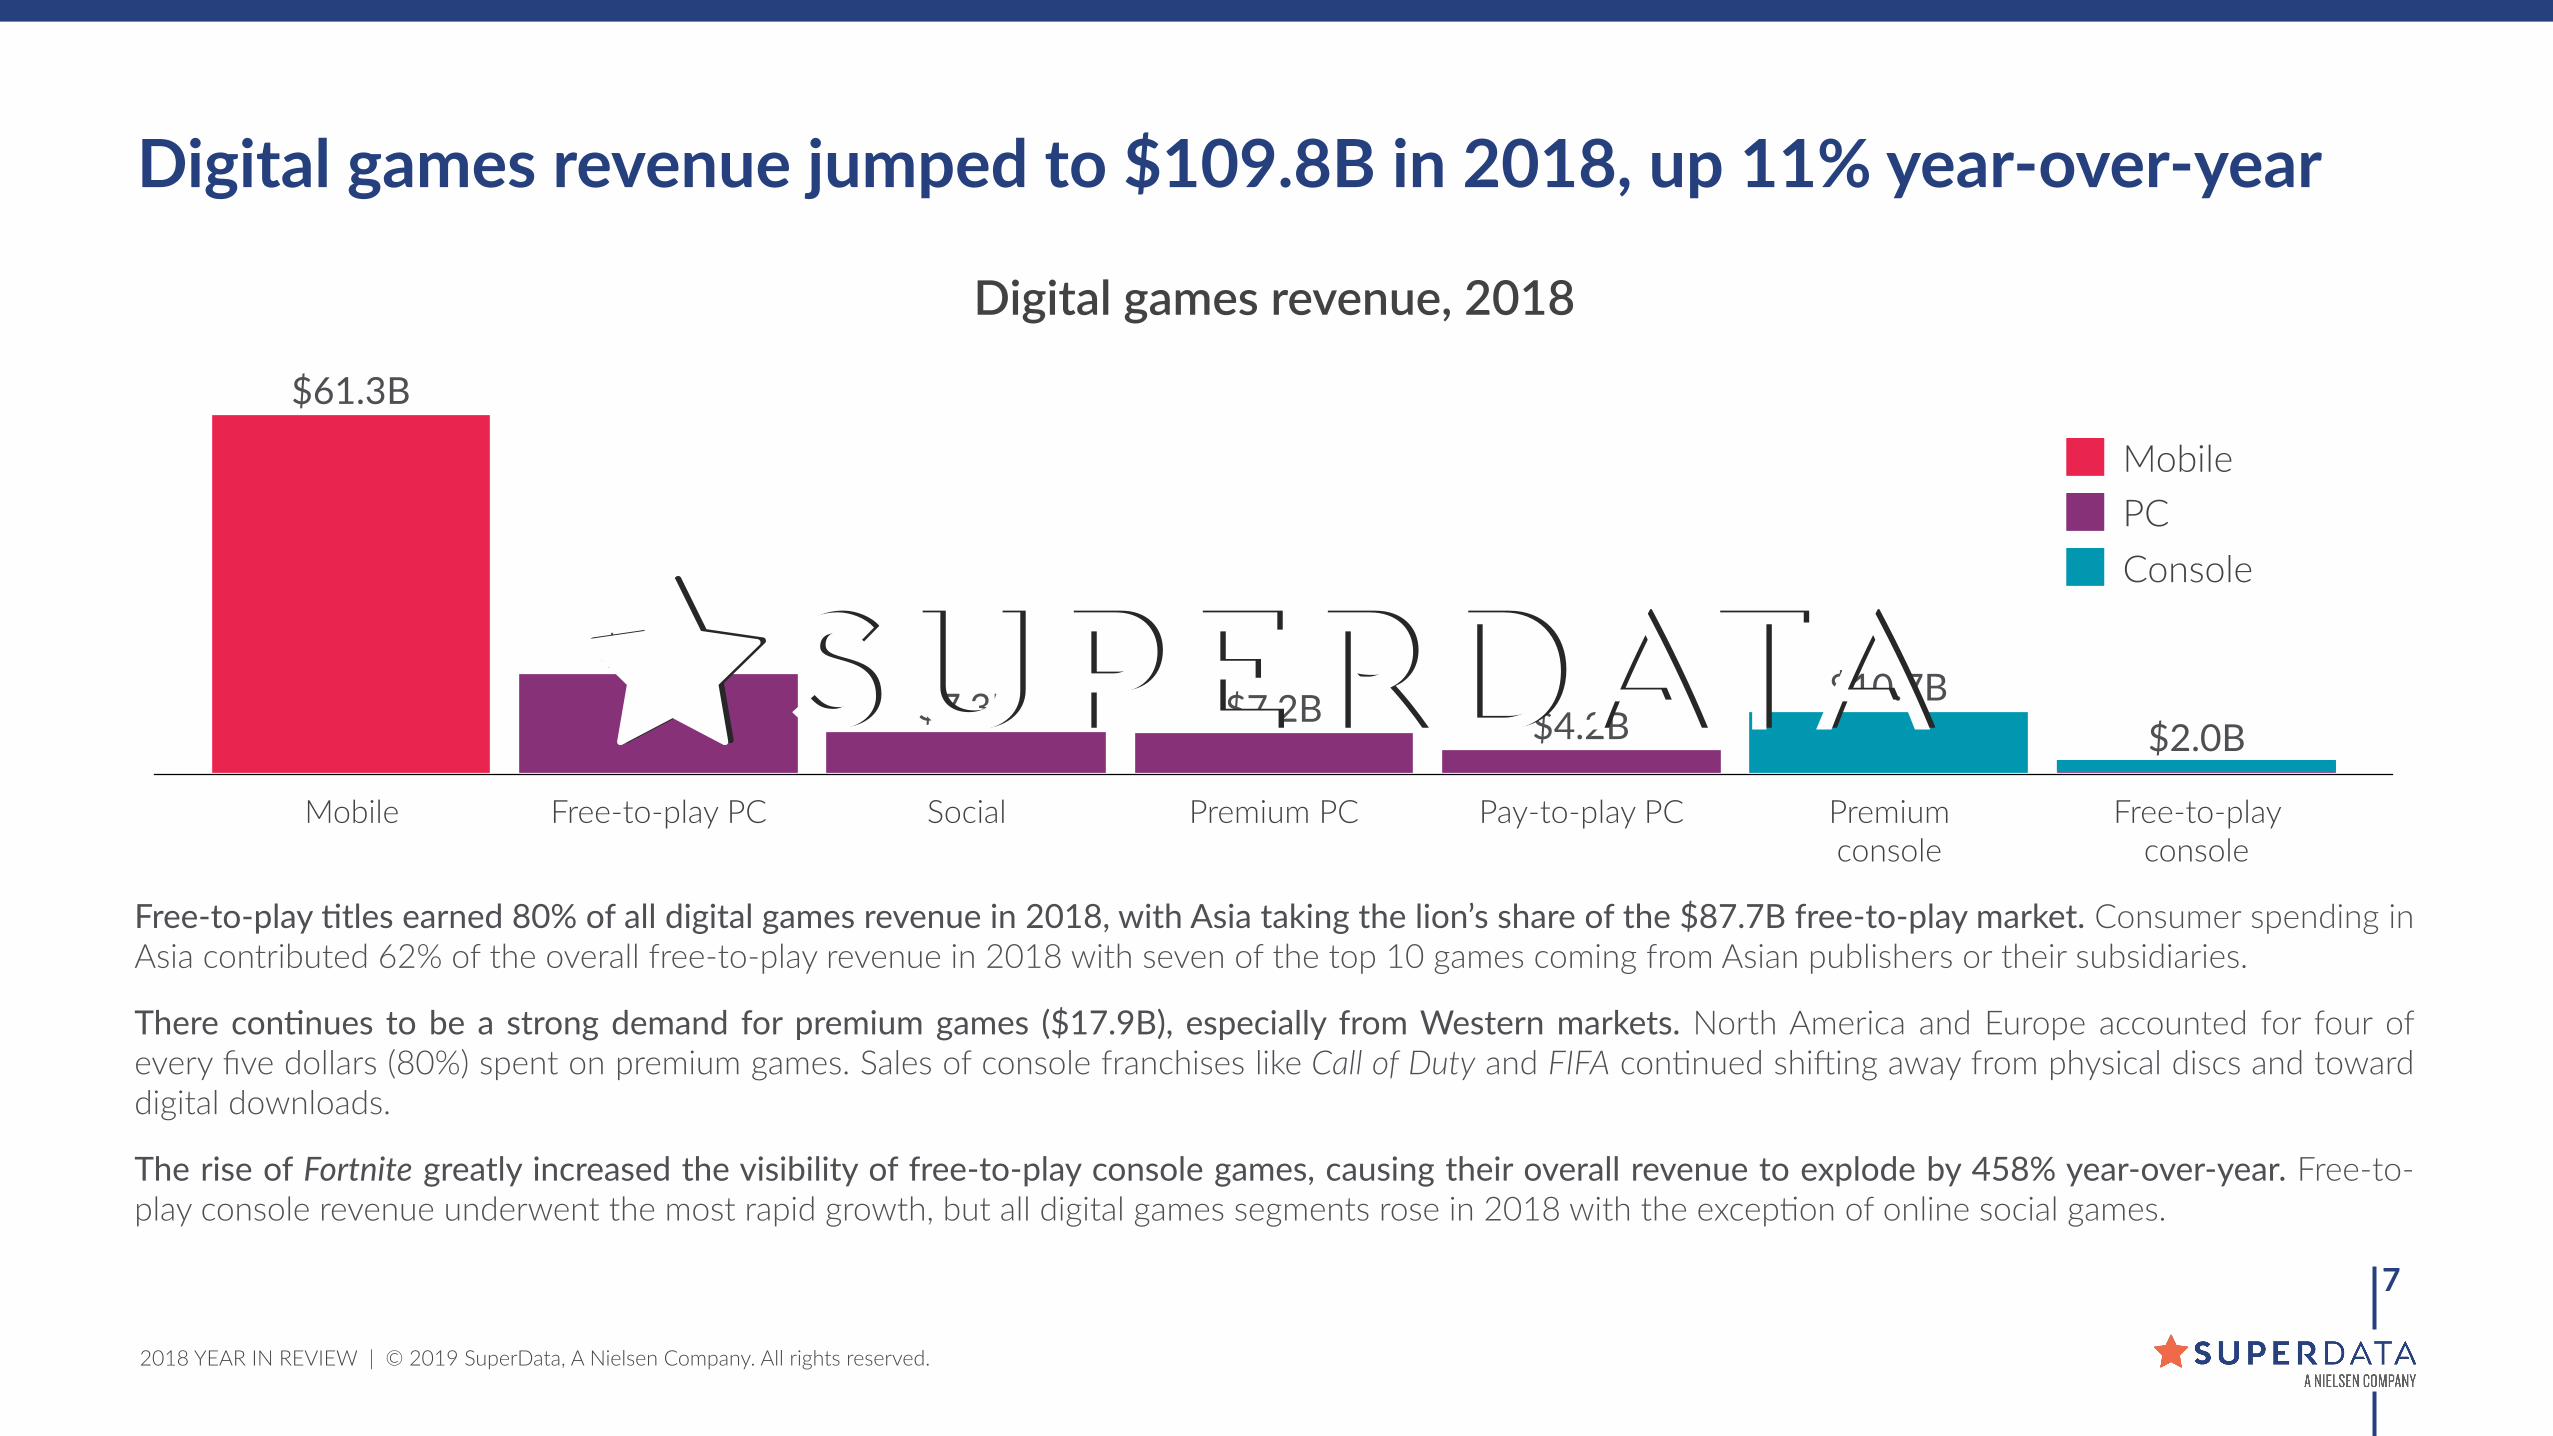
Free-to-play 9tles earned 80% of all digital games revenue in 2018, with Asia taking the lion’s share of the $87.7B free-to-play market. Consumer spending in Asia contributed 62% of the overall free-to-play revenue in 2018 with seven of the top 10 games coming from Asian publishers or their subsidiaries.
There con9nues to be a strong demand for premium games ($17.9B), especially from Western markets. North America and Europe accounted for four of every five dollars (80%) spent on premium games. Sales of console franchises like Call of Duty and FIFA conInued shi]ing away from physical discs and toward digital downloads.
The rise of Fortnite greatly increased the visibility of free-to-play console games, causing their overall revenue to explode by 458% year-over-year. Free-to-play console revenue underwent the most rapid growth, but all digital games segments rose in 2018 with the excepIon of online social games.
�7
Digital games revenue jumped to $109.8B in 2018, up 11% year-over-year
Digital games revenue, 2018
Mobile Free-to-play PC Social Premium PC Pay-to-play PC Premium console
Free-to-play console
$2.0B$10.7B
$4.2B$7.2B$7.3B$17.0B
$61.3B
MobilePCConsole
2018 YEAR IN REVIEW | © 2019 SuperData, A Nielsen Company. All rights reserved.
2017 2017 2017
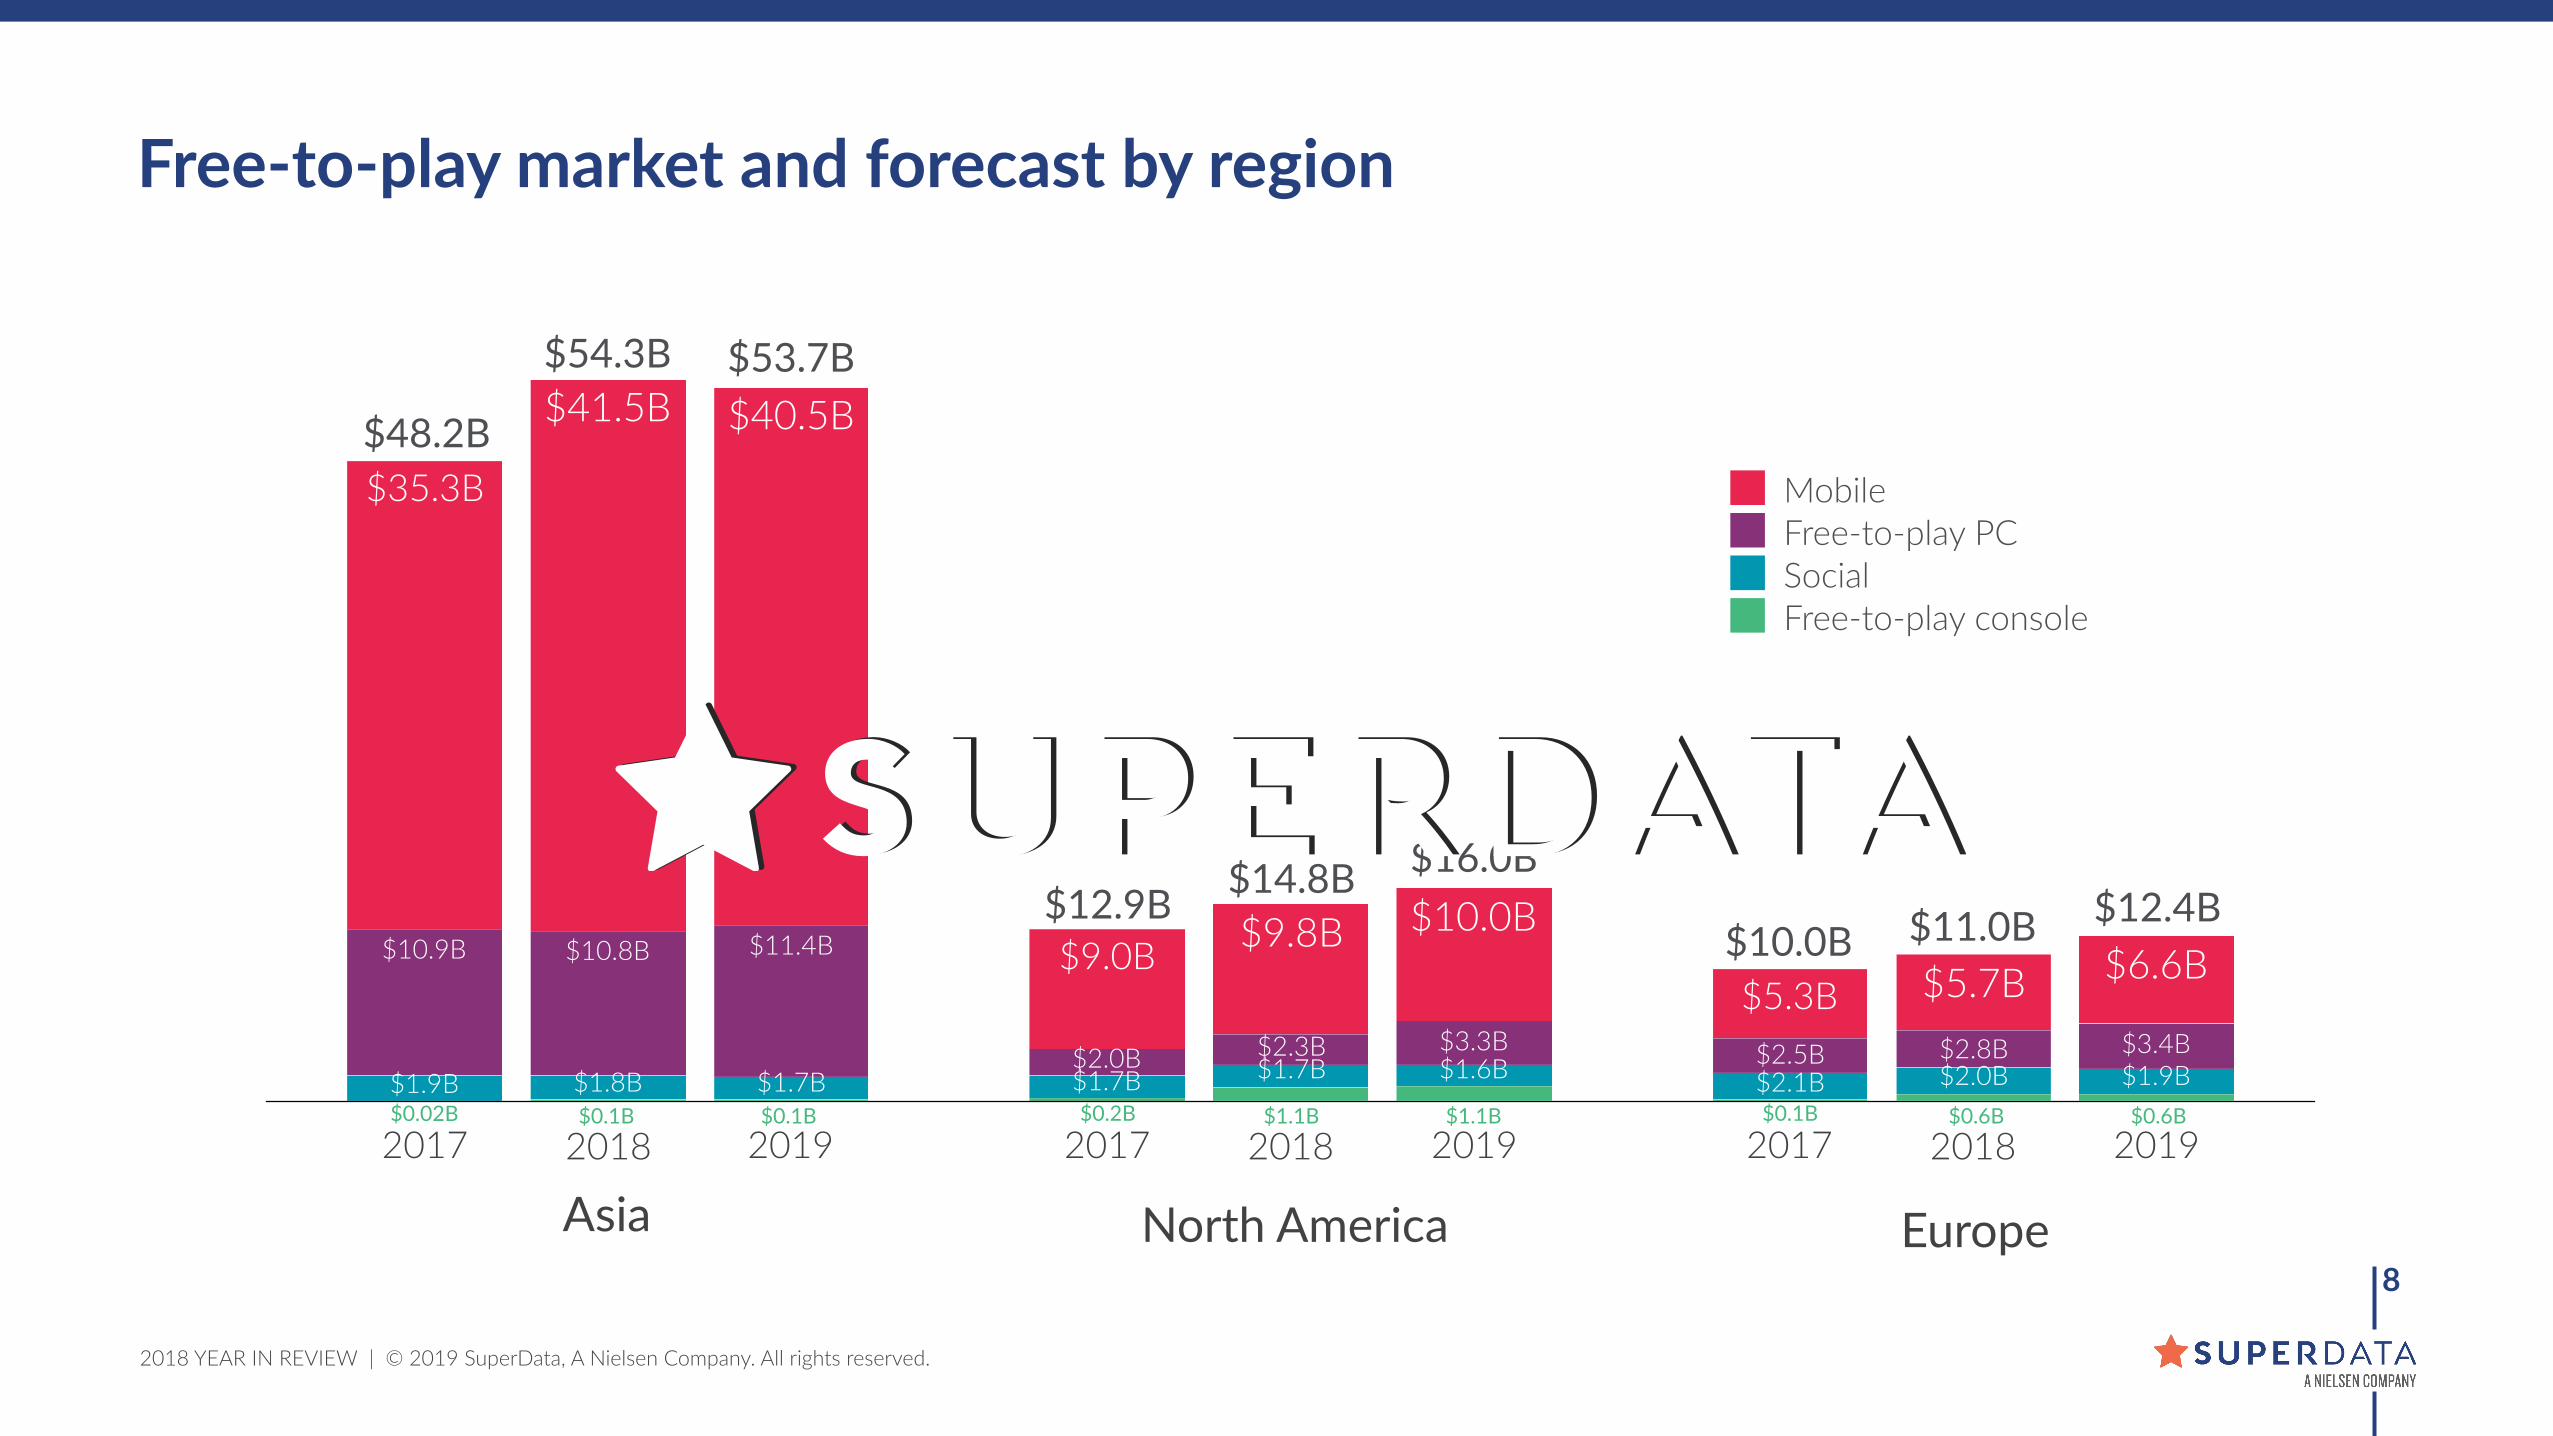
$5.3B$9.0B
$35.3B
$2.5B$2.0B
$10.9B
$2.1B$1.7B$1.9B$0.1$0.2$0.0
2018 2018 2018
$5.7B$9.8B
$41.5B
$2.8B$2.3B
$10.8B
$2.0B$1.7B$1.8B
Free-to-play consoleSocialFree-to-play PCMobile
2019 2019 2019
$6.6B$10.0B
$40.5B
$3.4B$3.3B
$11.4B
$1.9B$1.6B$1.7B
$53.7B
$16.0B$12.4B
$14.8B$11.0B
�8
Free-to-play market and forecast by region
$0.1B $1.1B $0.6B
$48.2B
$12.9B$10.0B
$0.02B $0.2B $0.1B$0.1B $1.1B $0.6B
$54.3B
Asia North America Europe

2018 YEAR IN REVIEW | © 2019 SuperData, A Nielsen Company. All rights reserved.
�9
Rank Title Publisher Genre Revenue
1 Fortnite Epic Games Shooter $2.4B
2 Dungeon Fighter Online Nexon RPG $1.5B
3 League of Legends Riot Games, Tencent MOBA $1.4B
4 Pokemon GO NianIc Adventure $1.3B
5 Crossfire Neowiz Games Shooter $1.3B
6 Honour of Kings2 Tencent MOBA $1.3B
7 Fate/Grand Order Aniplex RPG $1.2B
8 Candy Crush Saga King, AcIvision Blizzard Puzzle $1.1B
9 Monster Strike Mixi RPG $1.0B
10 Clash Royale Supercell, Tencent Strategy $0.9B
Top free-to-play games by revenue, 20181
The rise of Fortnite shook up the $87.7B free-to-play games market in 2018Fortnite earned $2.4B on its way to becoming a global phenomenon. As a mulIplaborm release on PC, console and mobile, Fortnite reached a massive addressable audience. To conInue its momentum, Epic Games regularly updated the game with new modes, weapons and environments, giving players a reason to log in regularly.
Fortnite had a major impact on games mone9za9on with the ba^le pass, a limited-9me in-game purchase that rewards players with digital items as they complete challenges. Games like Dota 2 have sold bagle passes in the past, but Fortnite made them a core part of its moneIzaIon strategy, with 34% of US Fortnite players buying them regularly. Titles such as PlayerUnknown’s BaClegrounds, Rocket League and Call of Duty: Black Ops 4 were keen to recreate Fortnite’s success, adding their own versions of the bagle pass soon a]er.
Despite a regulatory freeze of new game launches in China, Asia’s mobile games market grew by 18% year-over-year thanks to endemic hardcore 9tles. Revenue from Tencent’s mobile MOBA Honour of Kings2 nearly rivaled the publisher’s own PC Itle League of Legends. In North America and Europe, casual and midcore games like Pokémon GO contributed to global mobile games revenue rising by 13% overall.
1 Annual Itle-level revenue esImates in this report include preliminary December data. | 2 Also known as Arena of Valor in the West.
2018 YEAR IN REVIEW | © 2019 SuperData, A Nielsen Company. All rights reserved.
�10
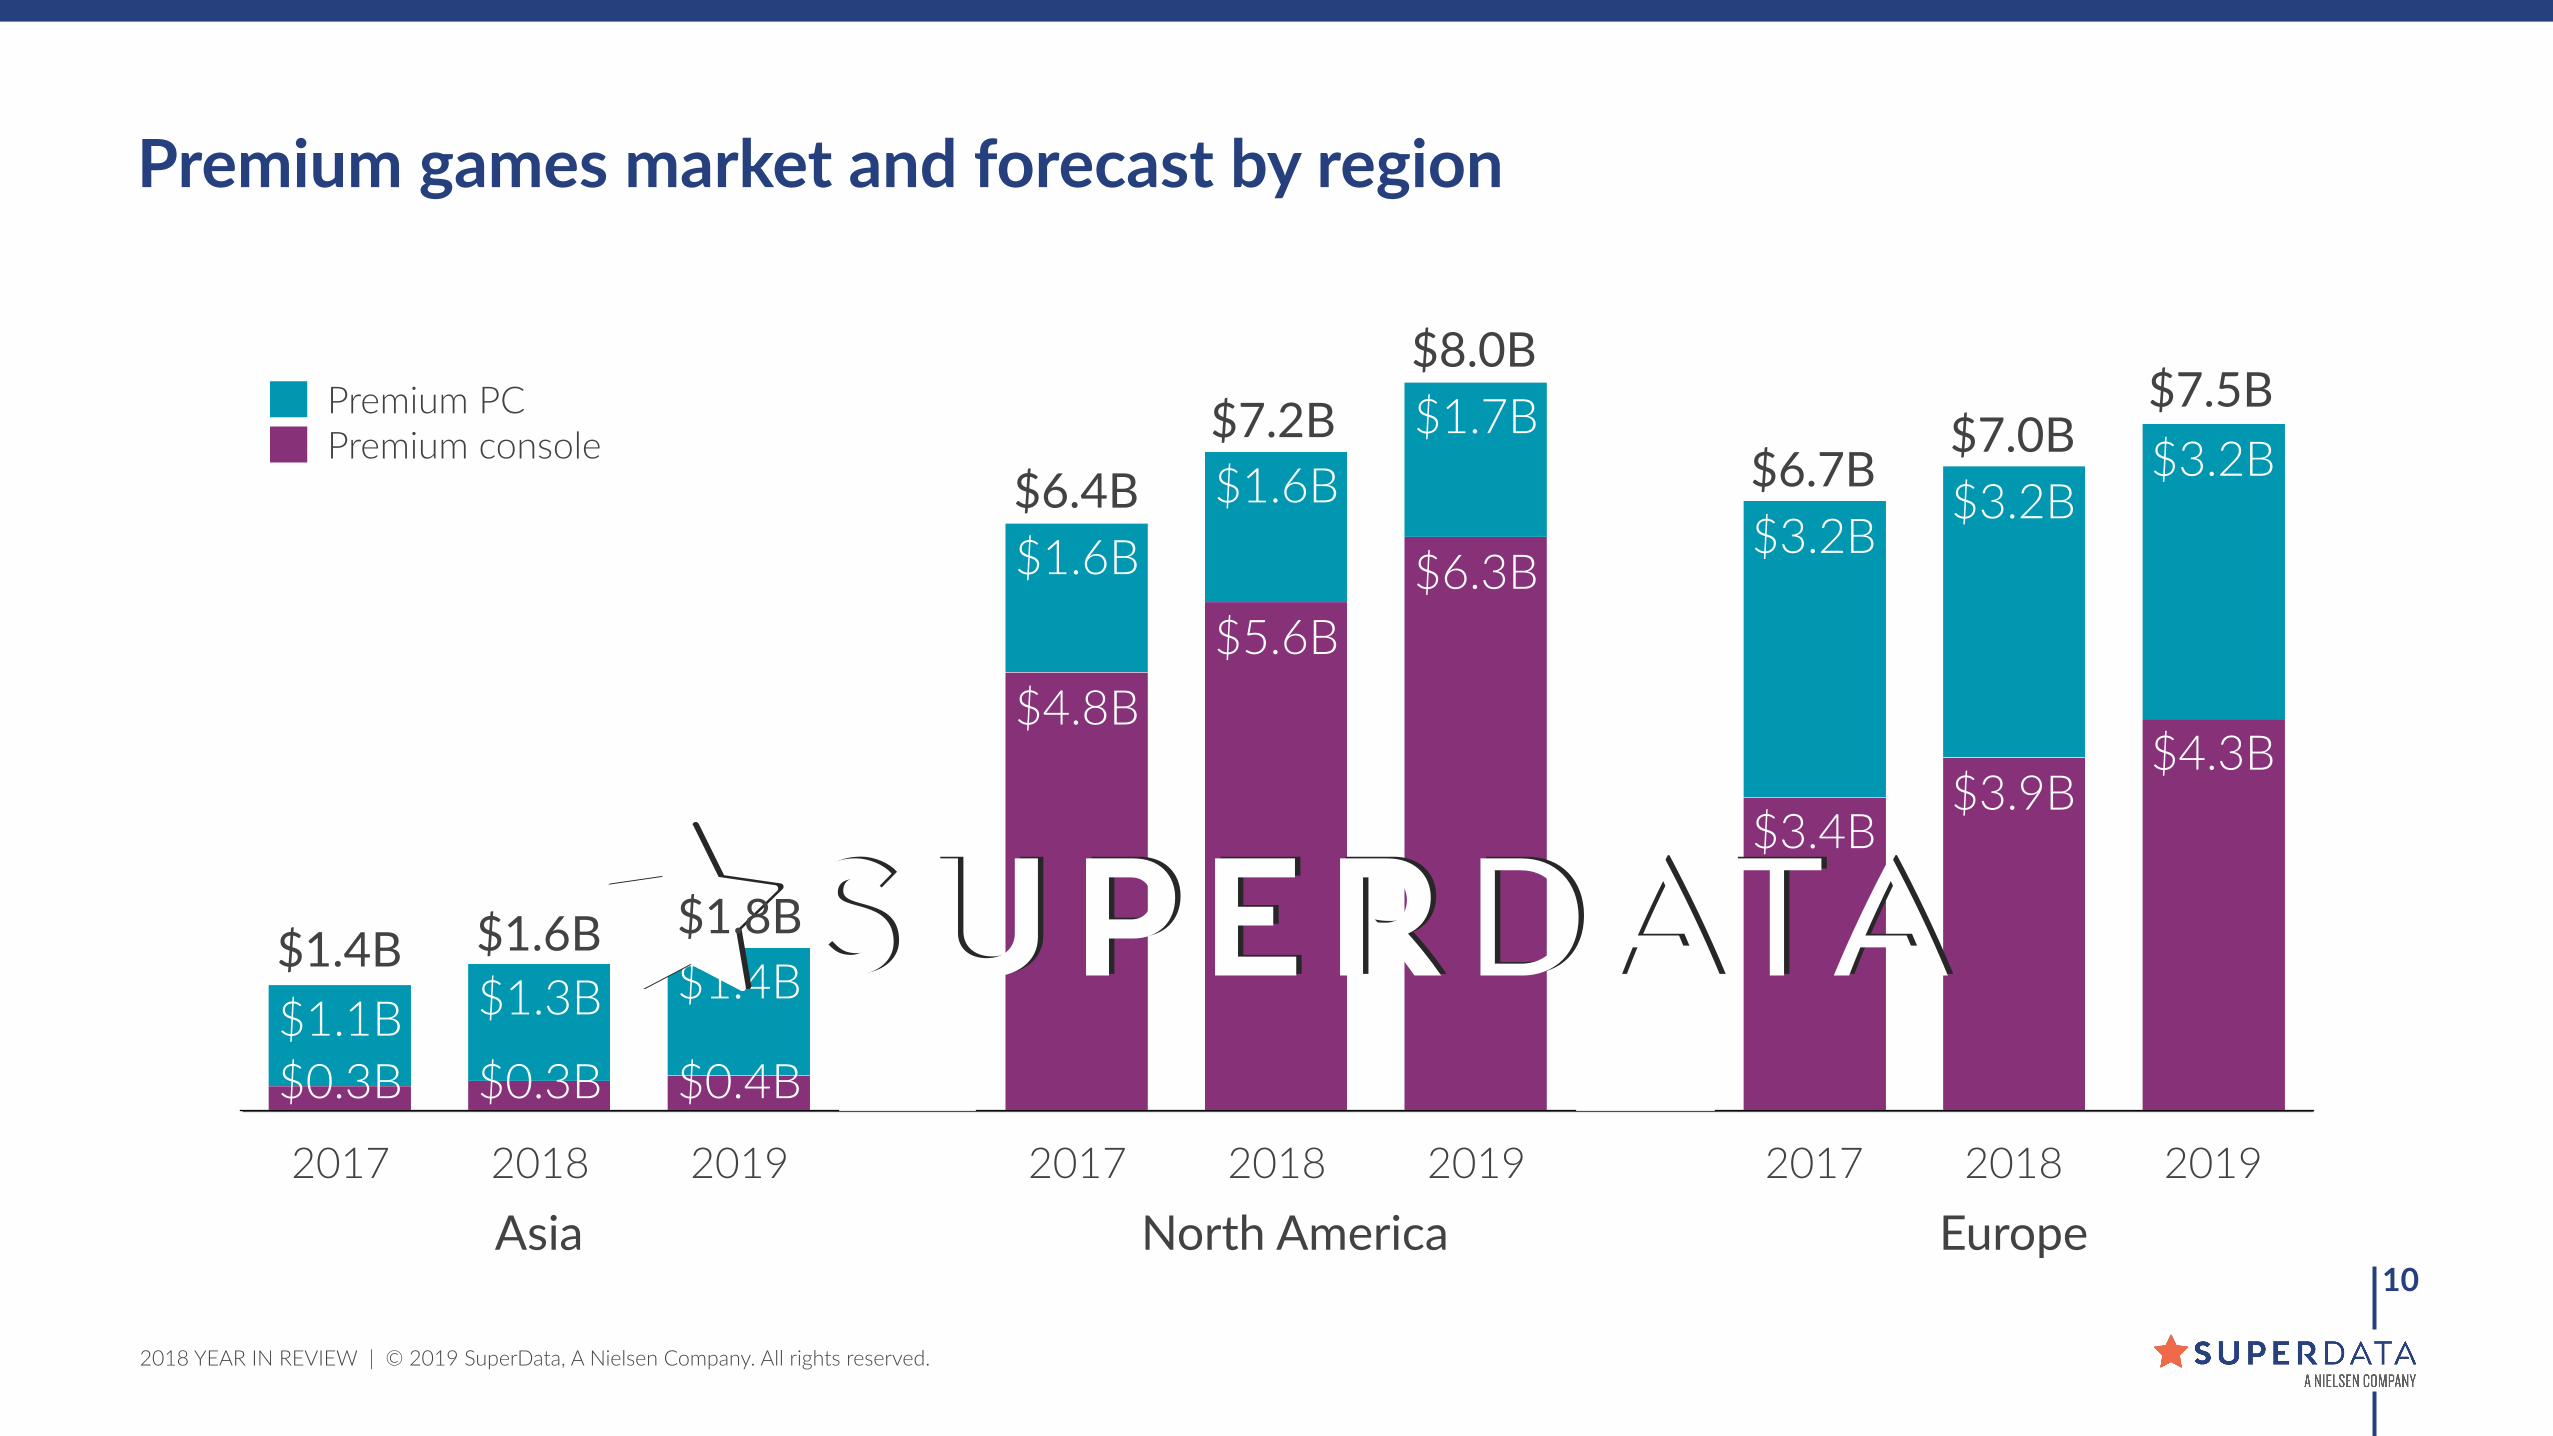
Premium games market and forecast by region
2017 2018 2019
$1.4B$1.3B$1.1B$0.4B$0.3B$0.3B
Premium consolePremium PC
2017 2018 2019
$1.7B$1.6B
$1.6B $6.3B$5.6B
$4.8B
2017 2018 2019
$3.2B$3.2B
$3.2B
$4.3B$3.9B
$3.4B
Asia North America Europe
$1.6B$1.4B
$7.2B $7.0B
$8.0B
$6.7B$6.4B
$1.8B
$7.5B
2018 YEAR IN REVIEW | © 2019 SuperData, A Nielsen Company. All rights reserved.
�11
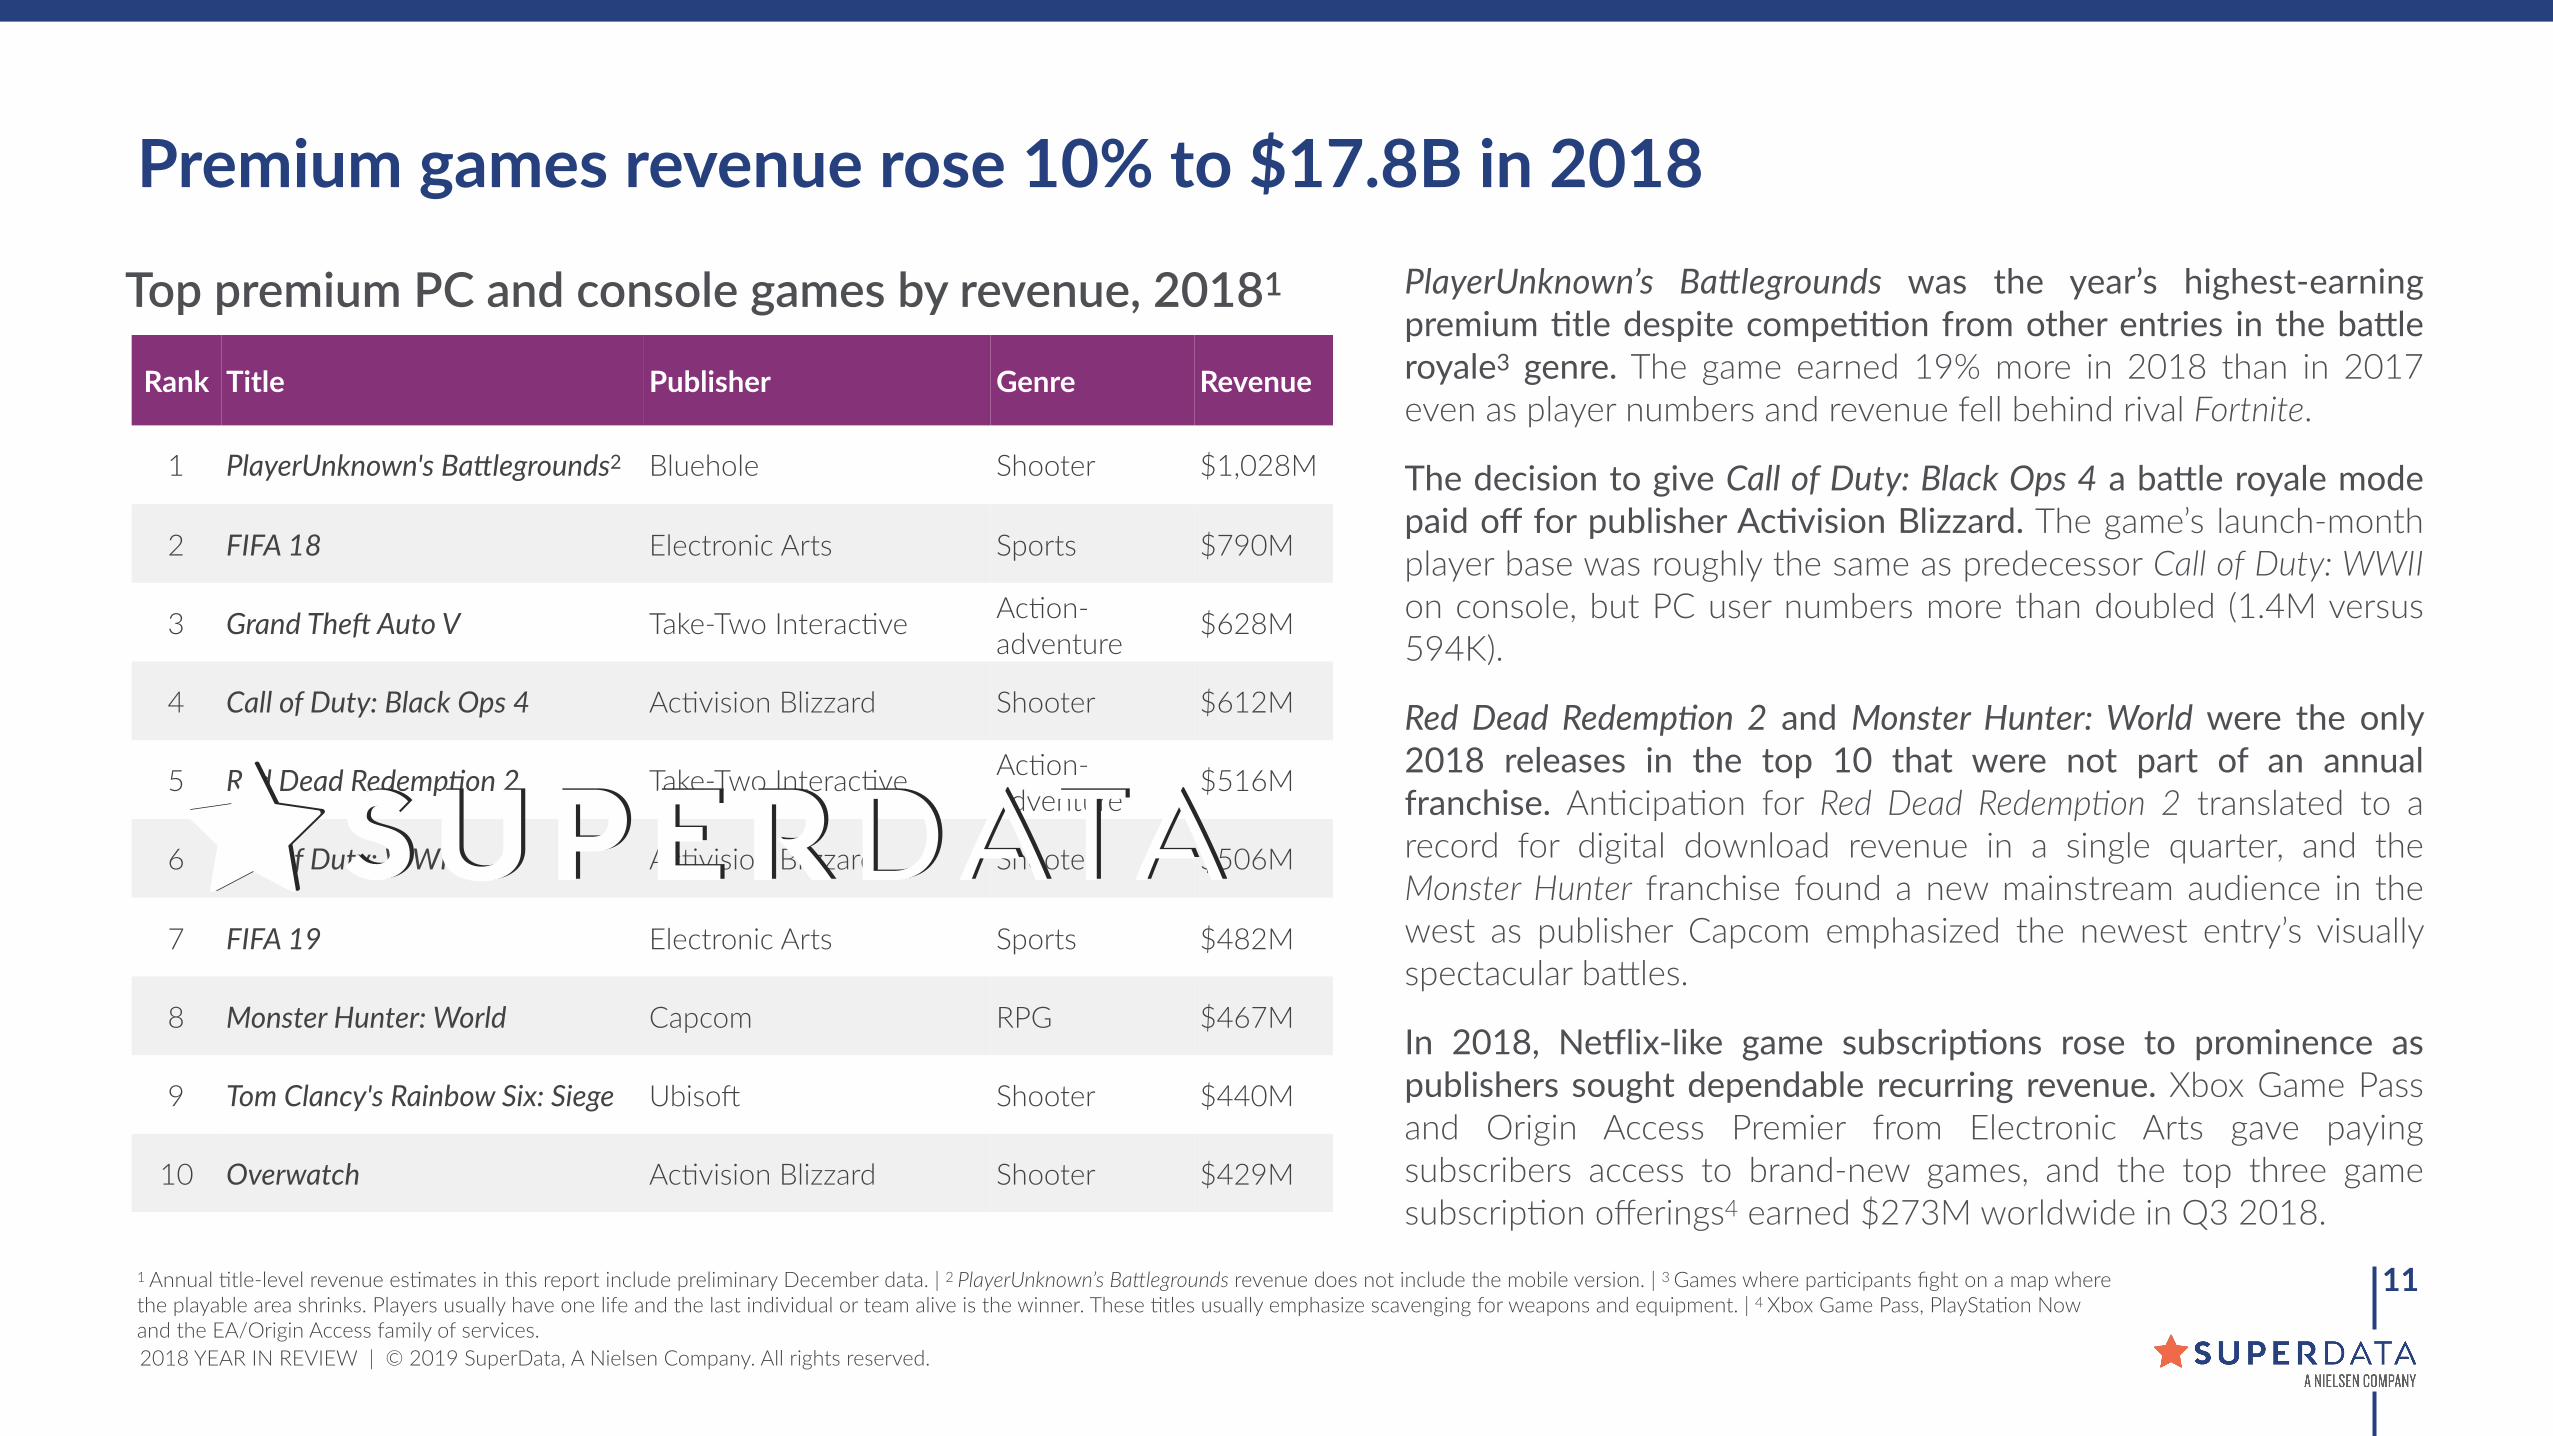
Rank Title Publisher Genre Revenue
1 PlayerUnknown's BaElegrounds2 Bluehole Shooter $1,028M
2 FIFA 18 Electronic Arts Sports $790M
3 Grand TheK Auto V Take-Two InteracIve AcIon-adventure
$628M
4 Call of Duty: Black Ops 4 AcIvision Blizzard Shooter $612M
5 Red Dead RedempQon 2 Take-Two InteracIve AcIon-adventure
$516M
6 Call of Duty: WWII AcIvision Blizzard Shooter $506M
7 FIFA 19 Electronic Arts Sports $482M
8 Monster Hunter: World Capcom RPG $467M
9 Tom Clancy's Rainbow Six: Siege Ubiso] Shooter $440M
10 Overwatch AcIvision Blizzard Shooter $429M
Top premium PC and console games by revenue, 20181
Premium games revenue rose 10% to $17.8B in 2018PlayerUnknown’s BaElegrounds was the year’s highest-earning premium 9tle despite compe99on from other entries in the ba^le royale3 genre. The game earned 19% more in 2018 than in 2017 even as player numbers and revenue fell behind rival Fortnite.
The decision to give Call of Duty: Black Ops 4 a ba^le royale mode paid off for publisher Ac9vision Blizzard. The game’s launch-month player base was roughly the same as predecessor Call of Duty: WWII on console, but PC user numbers more than doubled (1.4M versus 594K).
Red Dead RedempQon 2 and Monster Hunter: World were the only 2018 releases in the top 10 that were not part of an annual franchise. AnIcipaIon for Red Dead RedempNon 2 translated to a record for digital download revenue in a single quarter, and the Monster Hunter franchise found a new mainstream audience in the west as publisher Capcom emphasized the newest entry’s visually spectacular bagles.
In 2018, Ne`lix-like game subscrip9ons rose to prominence as publishers sought dependable recurring revenue. Xbox Game Pass and Origin Access Premier from Electronic Arts gave paying subscribers access to brand-new games, and the top three game subscripIon offerings4 earned $273M worldwide in Q3 2018.
1 Annual Itle-level revenue esImates in this report include preliminary December data. | 2 PlayerUnknown’s BaClegrounds revenue does not include the mobile version. | 3 Games where parIcipants fight on a map where the playable area shrinks. Players usually have one life and the last individual or team alive is the winner. These Itles usually emphasize scavenging for weapons and equipment. | 4 Xbox Game Pass, PlayStaIon Now and the EA/Origin Access family of services.

2018 YEAR IN REVIEW | © 2019 SuperData, A Nielsen Company. All rights reserved.
GAMING VIDEO CONTENT
�12

2018 YEAR IN REVIEW | © 2019 SuperData, A Nielsen Company. All rights reserved.
The audience for gaming video content (GVC) grew 10% to reach 850M unique viewers in 2018
�13
23%
31%
45%
Twitch $1.6B
Other $2.4B
YouTube $1.2B
Gaming video content market, 2018
$5.2B Total revenue
Twitch was the highest-earning GVC pla`orm despite having a much smaller audience than YouTube (183M versus 594M). DonaIons and channel subscripIons accounted for 32% of GVC revenue on Twitch compared to only 9% on YouTube. Twitch supports a wide range of moneIzaIon opIons and agracts devoted viewers who are willing to spend to directly support their favorite content creators.
Online videos influence what 46% of US PC and console gamers under the age of 25 play, making GVC pivotal to a game’s success. Publishers like Epic Games are incenIvizing streamers to play their games by giving them referral bonuses for others’ purchases of Fortnite in-game currency and Itles in the Epic Games Store.

2018 YEAR IN REVIEW | © 2019 SuperData, A Nielsen Company. All rights reserved.1 Based on surveys of US viewers available in the SuperData Arena.
�14
Tyler “Ninja” Blevins was watched more than the second- and third-most popular channels combined. Ninja rose to prominence by establishing himself as one of the best Fortnite players when the game was sIll new. Thanks to his Ireless streaming regimen and brand-friendly image, he popularized the concept of game streaming to mainstream audiences by playing with rapper Drake and appearing on The Ellen DeGeneres Show and The Tonight Show.
Two in five Fortnite viewers (44%) are under 25.1 The Itle’s reach has been parIcularly large among kids and teens. In response to his channel’s young audience, Ninja decided in 2018 to limit his swearing during most livestreams.
Ninja and other Fortnite video creators rose to the top of the Twitch charts in 2018
Channel Hours Watched Channel Hours Watched
1Ninja 218M
6sodapoppin 44M
The most talked about streamer of the year who has made forays into mainstream media such as streaming with rapper Drake and appearing on The Ellen DeGeneres Show
American variety streamer that originally gained fame from top-ranked World of WarcraR play
2Riot Games 95M
7ELEAGUE TV 43M
The official account that the League of Legends developer uses to broadcast esports The official channel for ELEAGUE, an esports series owned by Turner BroadcasIng which broadcasts key matches on the TBS TV staIon
3shroud 86M
8Tfue 43M
Canadian streamer and former Counter-Strike: Global Offensive pro player that primarily plays first-person shooters Professional Fortnite player for FaZe clan
4OverwatchLeague 71M
9summit1g 39M
The official channel for Blizzard’s esports league Former Counter-Strike: Global Offensive pro player that has streamed Call of Duty, Sea of Thieves and bagle royale Itles in 2018
5 dakotaz 47M 10 loltyler1 38MTop streamer known for Fortnite content Controversial League of Legends streamer that made a comeback in January 2018
Top Twitch channels, 2018

2018 YEAR IN REVIEW | © 2019 SuperData, A Nielsen Company. All rights reserved.
VIRTUAL, AUGMENTED AND MIXED REALITY
�15
2018 YEAR IN REVIEW | © 2019 SuperData, A Nielsen Company. All rights reserved.
�16
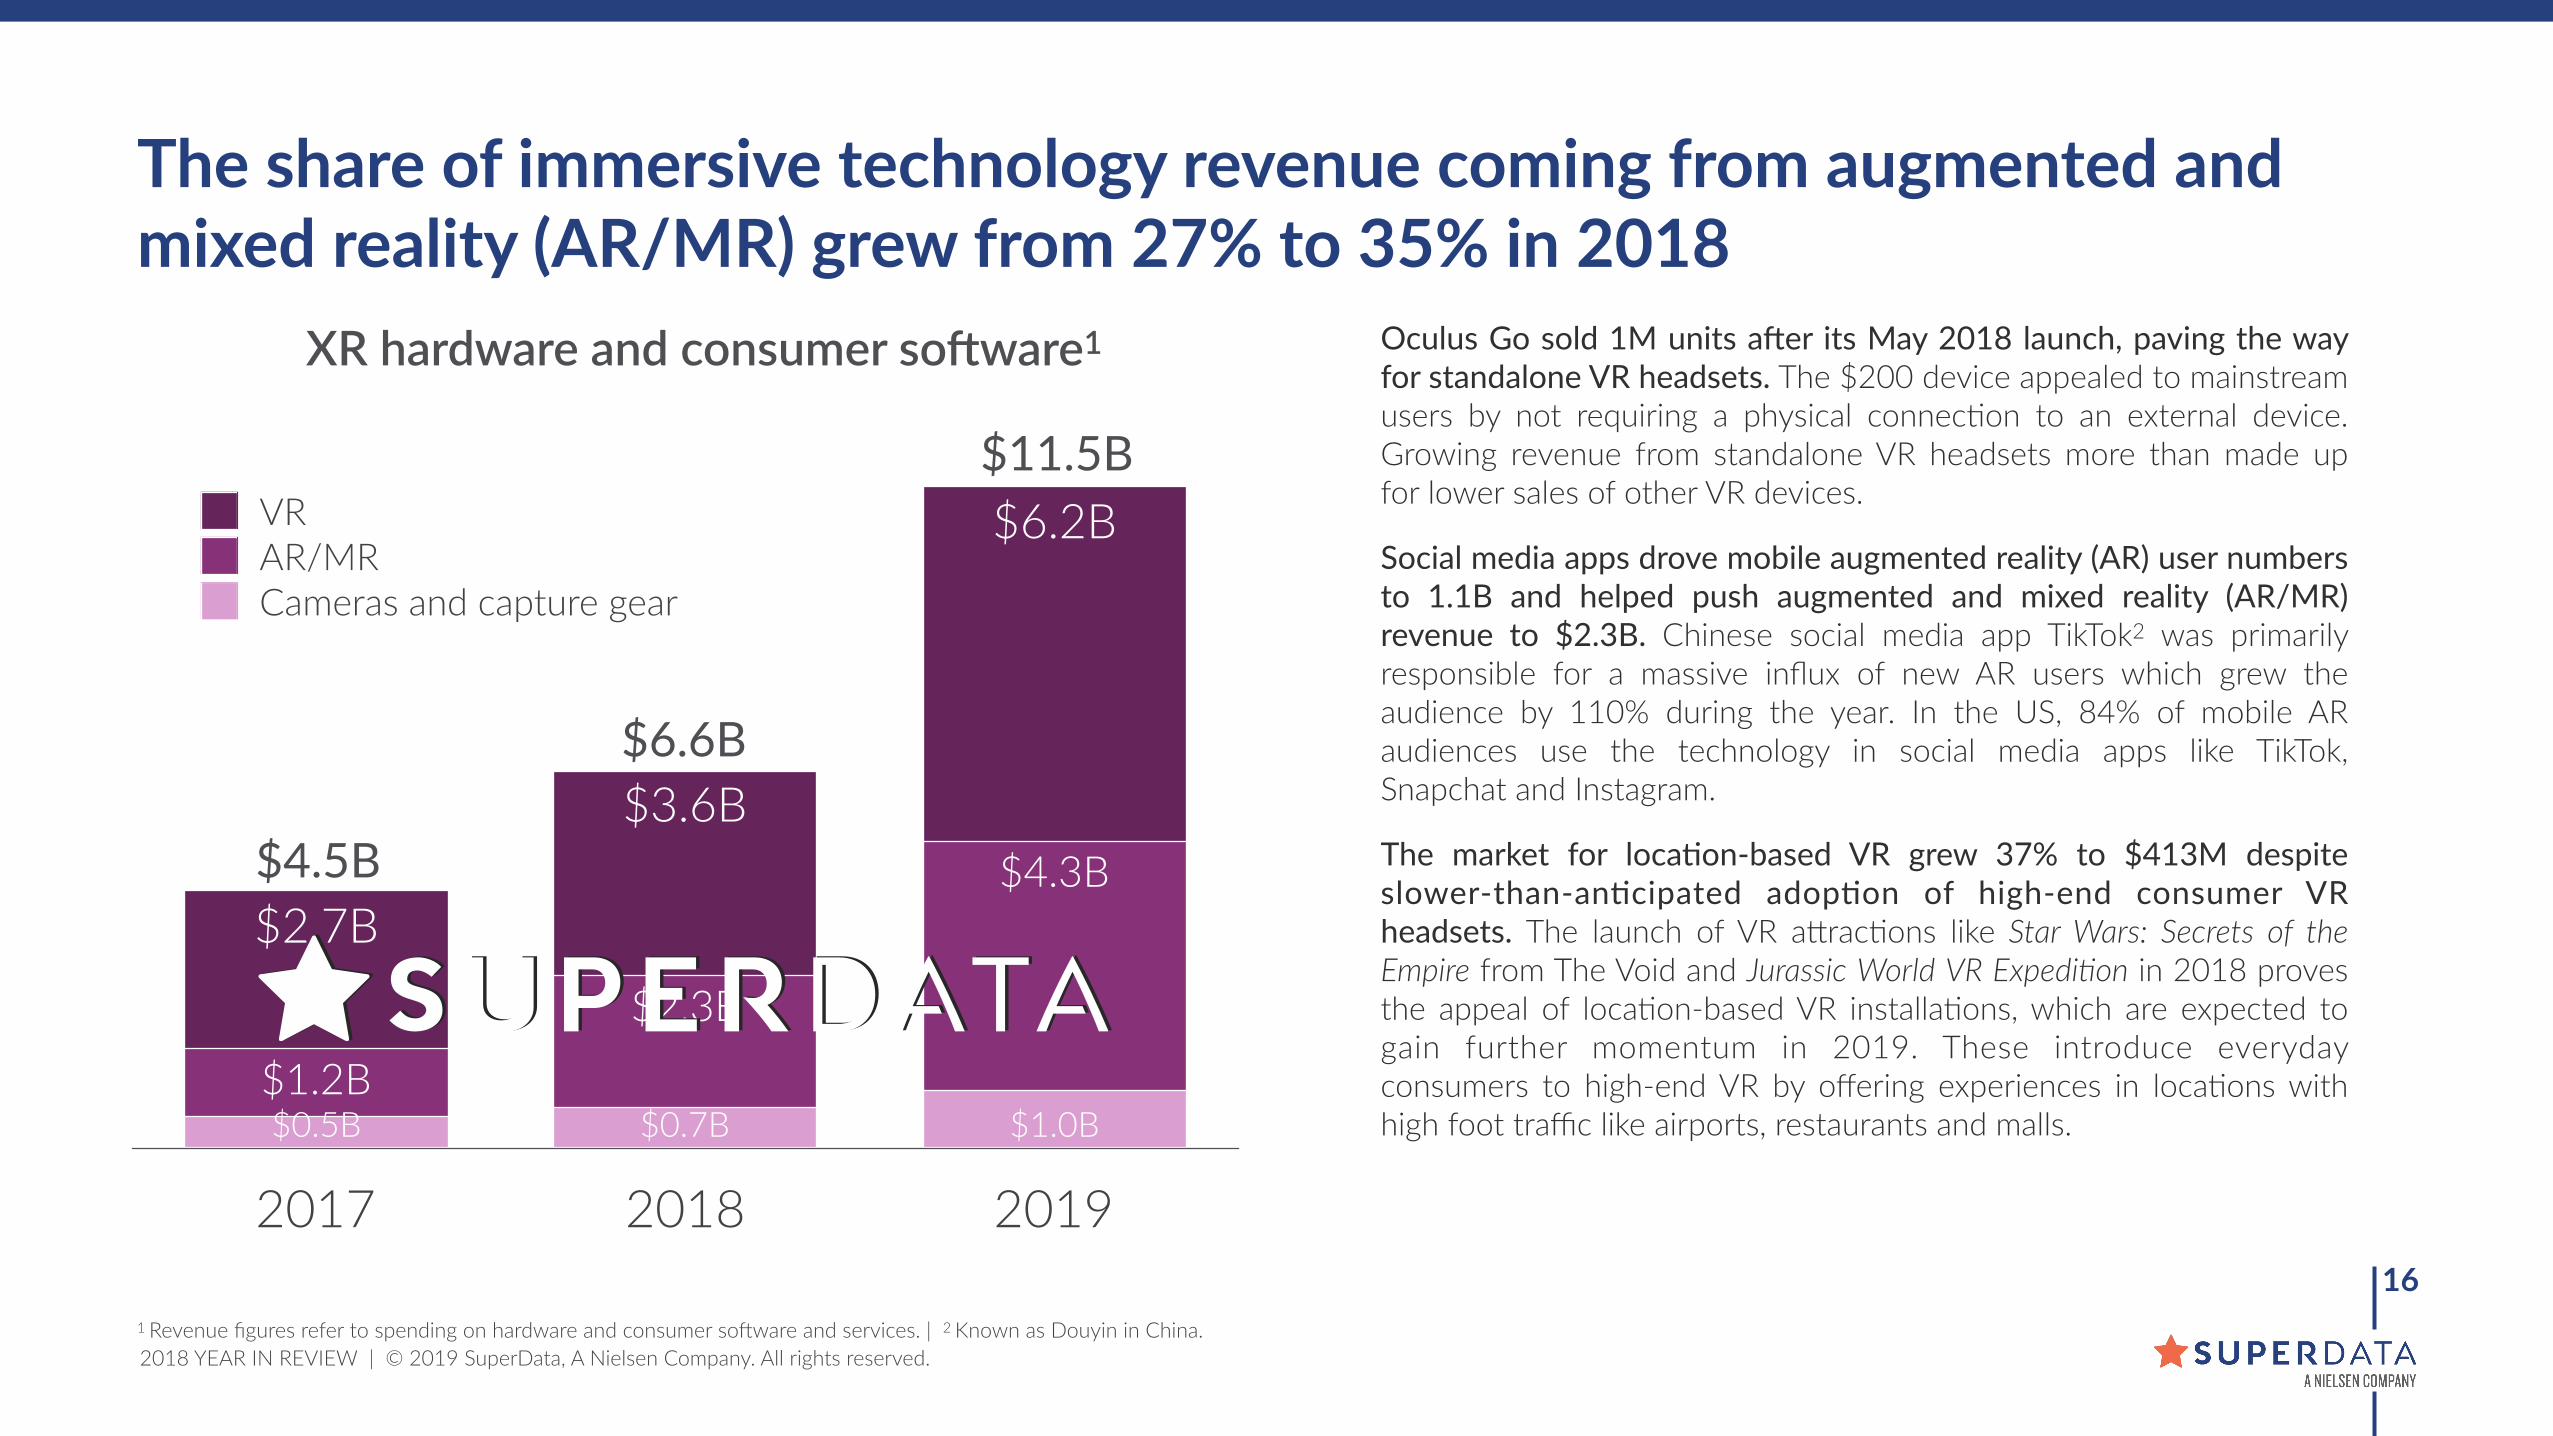
The share of immersive technology revenue coming from augmented and mixed reality (AR/MR) grew from 27% to 35% in 2018
2017 2018 2019
$6.2B
$3.6B
$2.7B$4.3B
$2.3B
$1.2B$1.0B$0.7B$0.5B
Cameras and capture gearAR/MRVR
1 Revenue figures refer to spending on hardware and consumer so]ware and services. | 2 Known as Douyin in China.
Oculus Go sold 1M units aier its May 2018 launch, paving the way for standalone VR headsets. The $200 device appealed to mainstream users by not requiring a physical connecIon to an external device. Growing revenue from standalone VR headsets more than made up for lower sales of other VR devices.
Social media apps drove mobile augmented reality (AR) user numbers to 1.1B and helped push augmented and mixed reality (AR/MR) revenue to $2.3B. Chinese social media app TikTok2 was primarily responsible for a massive influx of new AR users which grew the audience by 110% during the year. In the US, 84% of mobile AR audiences use the technology in social media apps like TikTok, Snapchat and Instagram.
The market for loca9on-based VR grew 37% to $413M despite slower-than-an9cipated adop9on of high-end consumer VR headsets. The launch of VR agracIons like Star Wars: Secrets of the Empire from The Void and Jurassic World VR ExpediNon in 2018 proves the appeal of locaIon-based VR installaIons, which are expected to gain further momentum in 2019. These introduce everyday consumers to high-end VR by offering experiences in locaIons with high foot traffic like airports, restaurants and malls.
XR hardware and consumer soUware1
$6.6B
$4.5B
$11.5B
2018 YEAR IN REVIEW | © 2019 SuperData, A Nielsen Company. All rights reserved.
�17
2017 2018 2019
$8.0B
$6.0B
$4.3B
$5.1B$5.1B$4.0B
VRAR/MR
$13.1B
$11.0B
$8.4B
1 Includes spending on internal R&D and on external firms offering XR services, hardware and so]ware. | 2 Among firms that uIlize VR in their business.
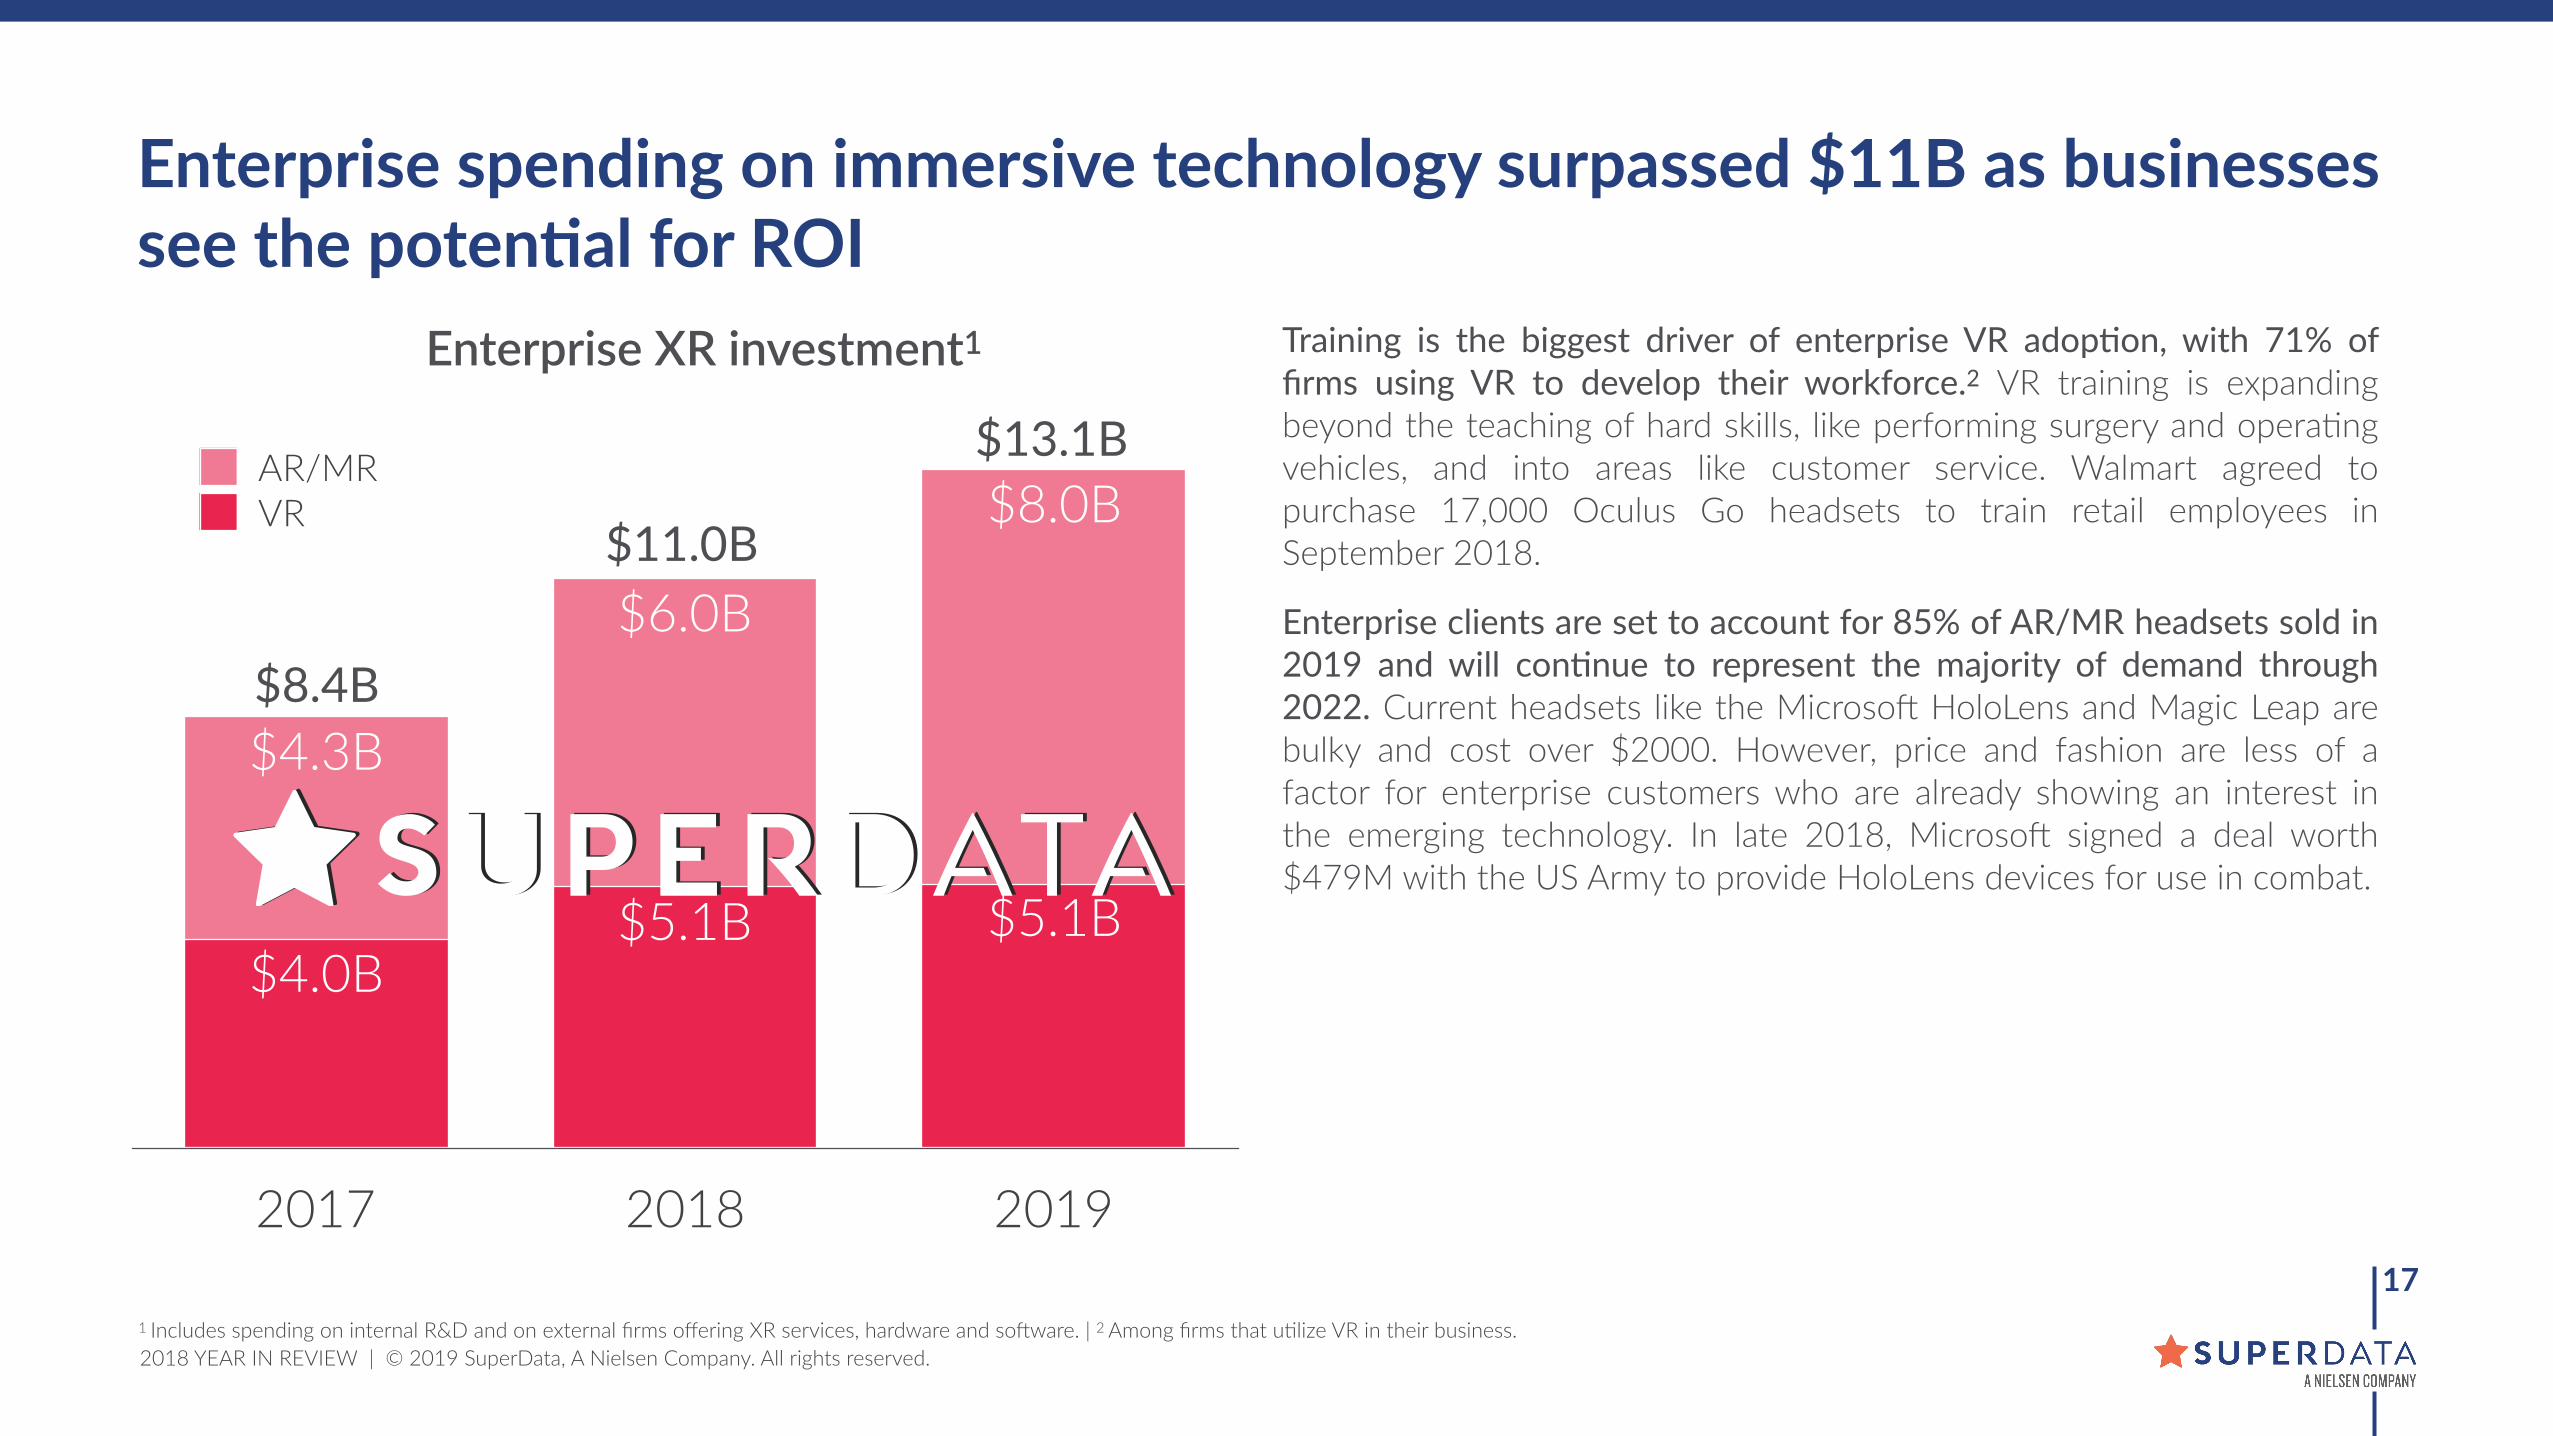
Enterprise XR investment1
Enterprise spending on immersive technology surpassed $11B as businesses see the poten=al for ROI
Training is the biggest driver of enterprise VR adop9on, with 71% of firms using VR to develop their workforce.2 VR training is expanding beyond the teaching of hard skills, like performing surgery and operaIng vehicles, and into areas like customer service. Walmart agreed to purchase 17,000 Oculus Go headsets to train retail employees in September 2018.
Enterprise clients are set to account for 85% of AR/MR headsets sold in 2019 and will con9nue to represent the majority of demand through 2022. Current headsets like the Microso] HoloLens and Magic Leap are bulky and cost over $2000. However, price and fashion are less of a factor for enterprise customers who are already showing an interest in the emerging technology. In late 2018, Microso] signed a deal worth $479M with the US Army to provide HoloLens devices for use in combat.
2018 YEAR IN REVIEW | © 2019 SuperData, A Nielsen Company. All rights reserved.
TRENDS TO WATCH IN 2019
�18
2018 YEAR IN REVIEW | © 2019 SuperData, A Nielsen Company. All rights reserved.
�191 Among those who know their internet speed.
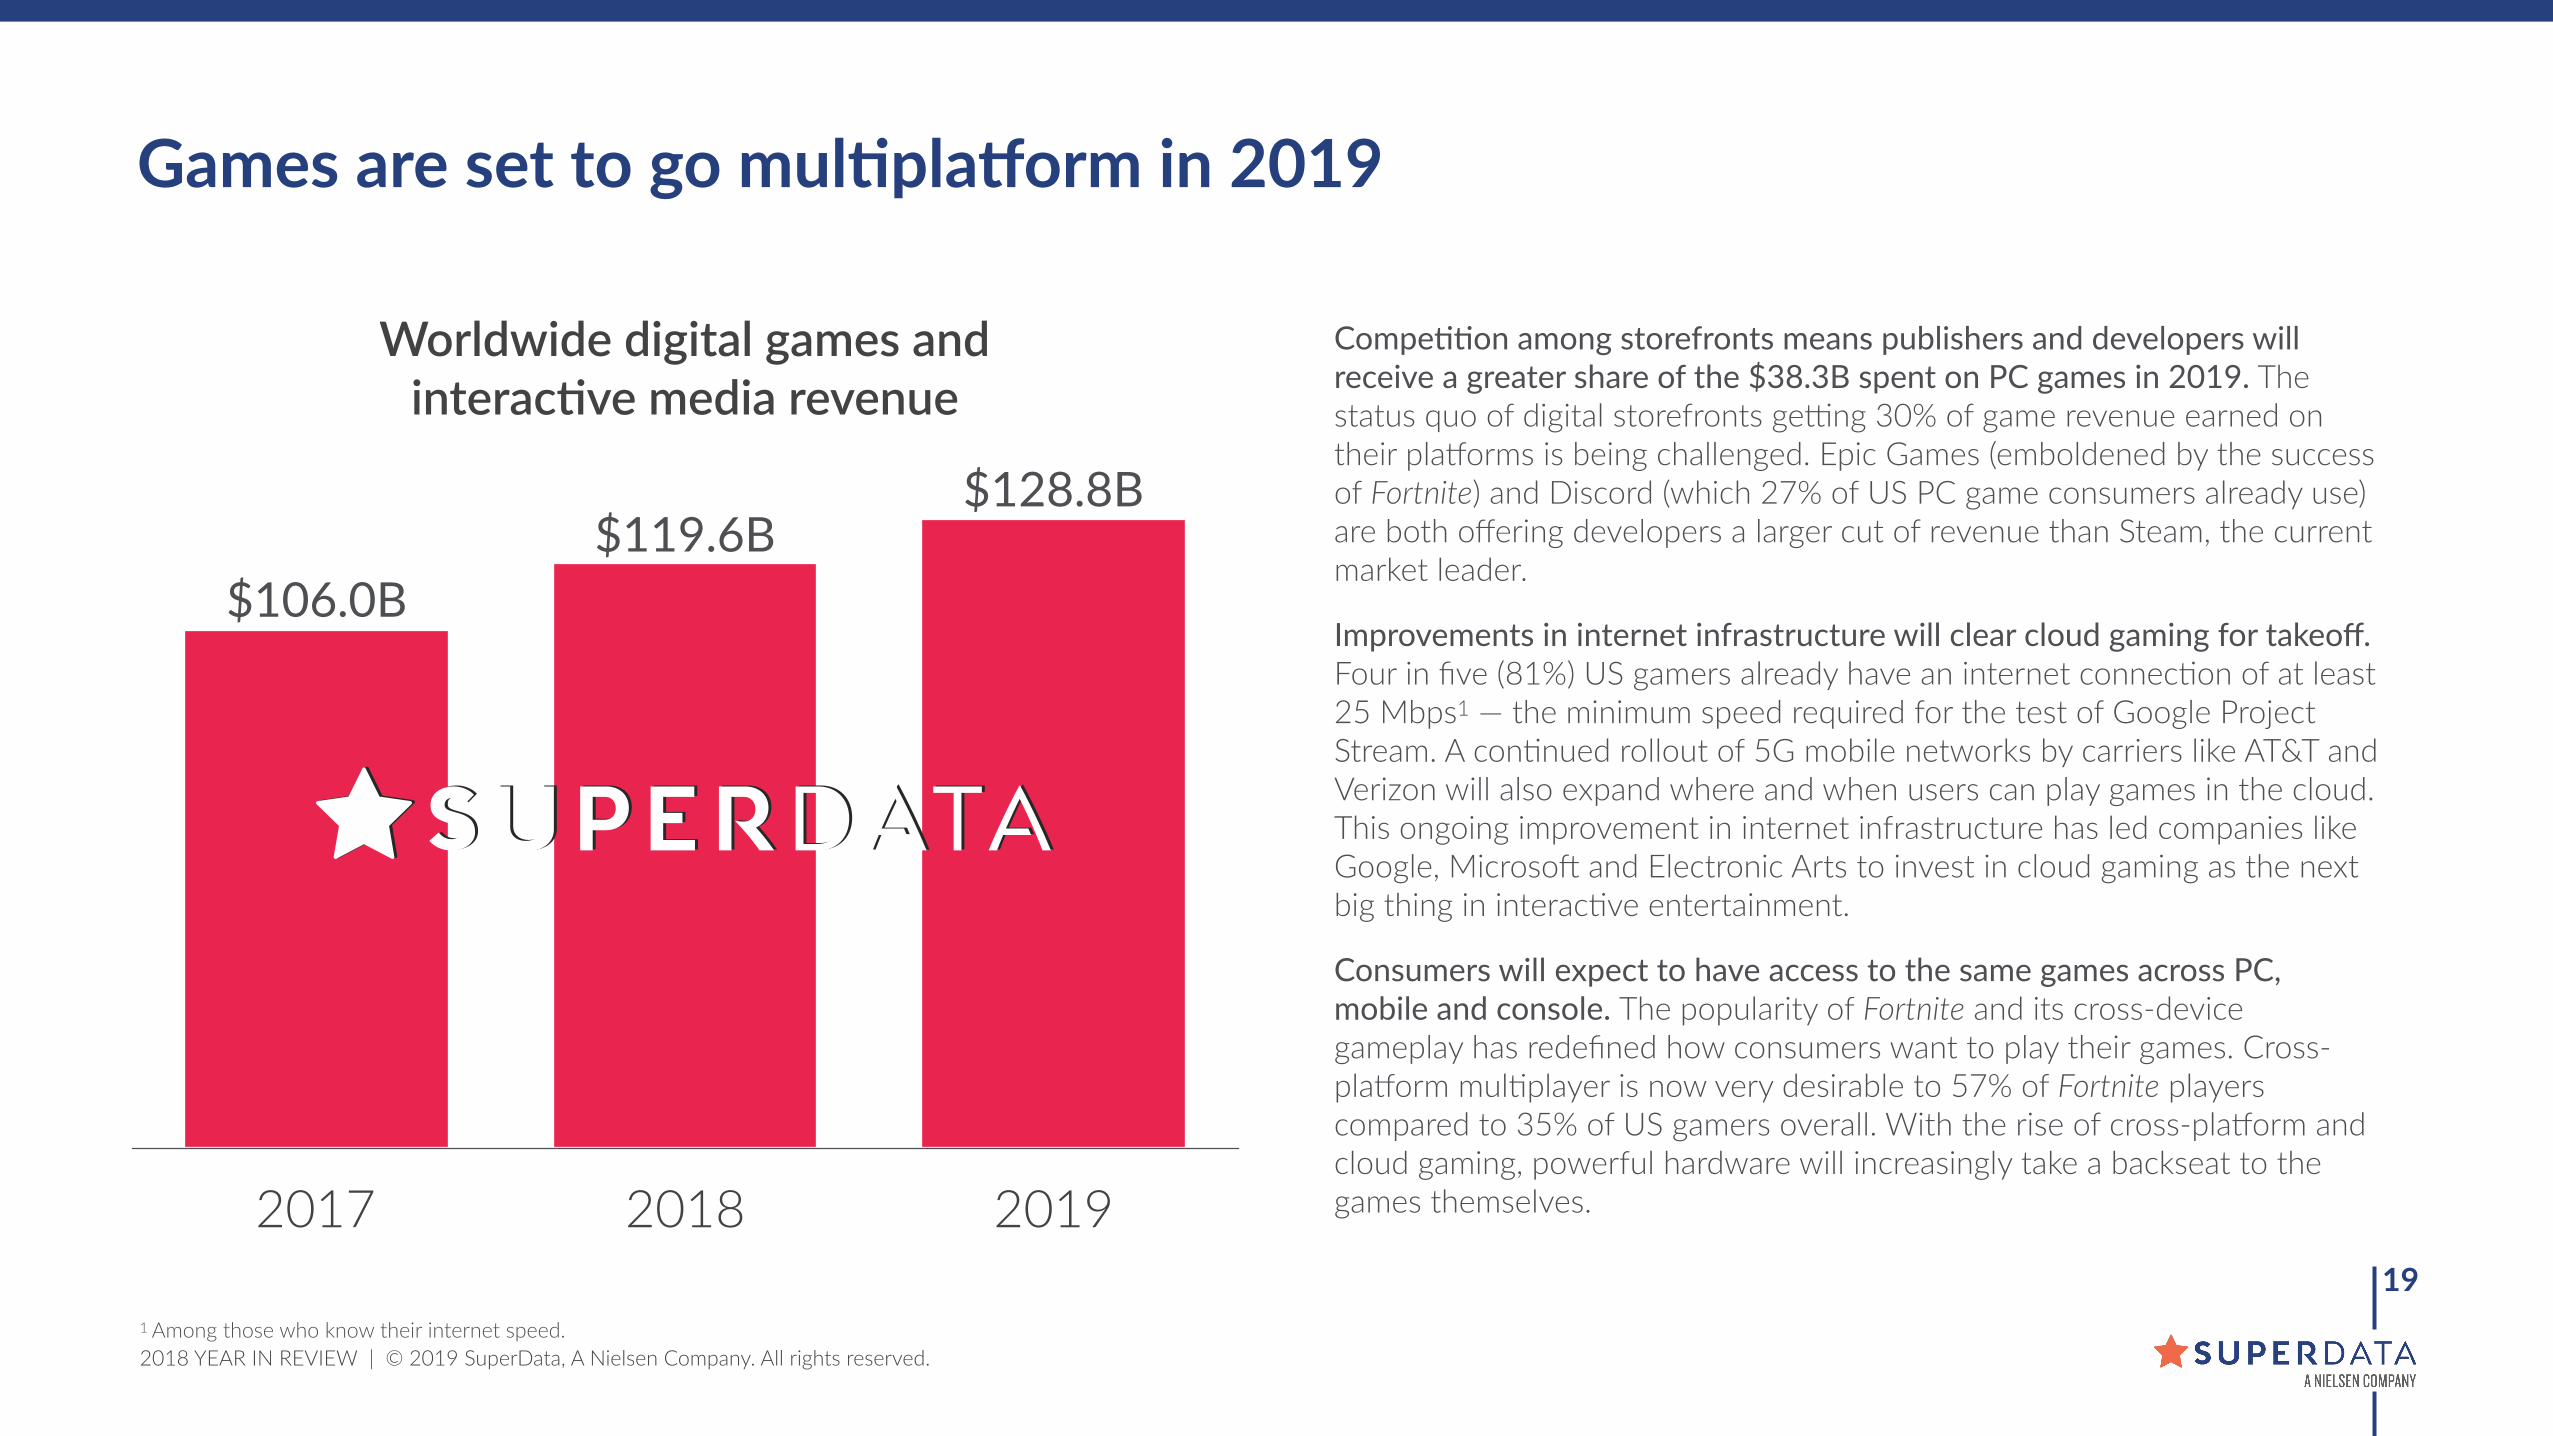
Games are set to go mul=plaYorm in 2019
2017 2018 2019
$128.8B$119.6B
$106.0B
Compe99on among storefronts means publishers and developers will receive a greater share of the $38.3B spent on PC games in 2019. The status quo of digital storefronts gevng 30% of game revenue earned on their plaborms is being challenged. Epic Games (emboldened by the success of Fortnite) and Discord (which 27% of US PC game consumers already use) are both offering developers a larger cut of revenue than Steam, the current market leader.
Improvements in internet infrastructure will clear cloud gaming for takeoff. Four in five (81%) US gamers already have an internet connecIon of at least 25 Mbps1 — the minimum speed required for the test of Google Project Stream. A conInued rollout of 5G mobile networks by carriers like AT&T and Verizon will also expand where and when users can play games in the cloud. This ongoing improvement in internet infrastructure has led companies like Google, Microso] and Electronic Arts to invest in cloud gaming as the next big thing in interacIve entertainment.
Consumers will expect to have access to the same games across PC, mobile and console. The popularity of Fortnite and its cross-device gameplay has redefined how consumers want to play their games. Cross-plaborm mulIplayer is now very desirable to 57% of Fortnite players compared to 35% of US gamers overall. With the rise of cross-plaborm and cloud gaming, powerful hardware will increasingly take a backseat to the games themselves.
Worldwide digital games and interacQve media revenue

www.superdataresearch.com
2018 YEAR IN REVIEW | © 2019 SuperData, A Nielsen Company. All rights reserved.