summary report of the 2015 uis innovation data...
TRANSCRIPT

1 Information Paper N. 37 March 2017
Summary Report of the 2015 UIS Innovation Data Collection

2
UNESCO The constitution of the United Nations Educational, Scientific and Cultural Organization (UNESCO) was adopted by 20 countries at the London Conference in November 1945 and entered into effect on 4 November 1946. The Organization currently has 195 Member States and 10 Associate Members.
The main objective of UNESCO is to contribute to peace and security in the world by promoting collaboration among nations through education, science, culture and communication in order to foster universal respect for justice, the rule of law, and the human rights and fundamental freedoms that are affirmed for the peoples of the world, without distinction of race, sex, language or religion, by the Charter of the United Nations.
To fulfil its mandate, UNESCO performs five principal functions: 1) prospective studies on education, science, culture and communication for tomorrow's world; 2) the advancement, transfer and sharing of knowledge through research, training and teaching activities; 3) standard-setting actions for the preparation and adoption of internal instruments and statutory recommendations; 4) expertise through technical cooperation to Member States for their development policies and projects; and 5) the exchange of specialized information.
UNESCO Institute for Statistics The UNESCO Institute for Statistics (UIS) is the statistical office of UNESCO and is the UN depository for global statistics in the fields of education, science, technology and innovation, culture and communication.
The UIS was established in 1999. It was created to improve UNESCO's statistical programme and to develop and deliver the timely, accurate and policy-relevant statistics needed in today’s increasingly complex and rapidly changing social, political and economic environments.
This report was prepared by Luciana Marins, assisted by Lora Milusheva and reviewed by Martin Schaaper, UNESCO Institute for Statistics.
Published in 2017 by:
UNESCO Institute for Statistics P.O. Box 6128, Succursale Centre-Ville Montreal, Quebec H3C 3J7 Canada
Tel: +1 514-343-6880 Email: [email protected] http://www.uis.unesco.org
ISBN 978-92-9189-211-2 Ref: UIS/2017/SCC/TD/1
https://doi.org/10.15220/978-92-9189-211-2-en
© UNESCO-UIS 2017
This publication is available in Open Access under the Attribution-ShareAlike 3.0 IGO (CC-BY-SA 3.0 IGO) license (http://creativecommons.org/licenses/by-sa/3.0/igo/). By using the content of this publication, the users accept to be bound by the terms of use of the UNESCO Open Access Repository (http://www.unesco.org/open-access/terms-use-ccbysa-en).
The designations employed and the presentation of material throughout this publication do not imply the expression of any opinion whatsoever on the part of UNESCO concerning the legal status of any country, territory, city or area or of its authorities or concerning the delimitation of its frontiers or boundaries.
The ideas and opinions expressed in this publication are those of the authors; they are not necessarily those of UNESCO and do not commit the Organization.

3 UIS Information Paper Nº37 | 2017
Acknowledgements
The UNESCO Institute for Statistics (UIS) would like to express its gratitude to the national experts for completing the UIS 2015 innovation data collection questionnaire. Additionally, the continued support and collaboration of the African Union – The New Partnership for Africa's Development (AU/NEPAD), the Network for Science and Technology Indicators – Ibero-American and Inter-American (RICYT), the Organisation of Economic Co-operation and Development (OECD) and Eurostat are sincerely appreciated.

4 UIS Information Paper Nº37 | 2017
Country and region codes
ARG Argentina AUS Australia AUT Austria AZE Azerbaijan BLR Belarus BEL Belgium BRA Brazil BUL Bulgaria CAN Canada CHL Chile CHN China HKG China, Hong Kong Special Administrative Region COL Colombia CRI Costa Rica CRO Croatia CUB Cuba CYP Cyprus CZE Czechia DNK Denmark ECU Ecuador EGY Egypt SLV El Salvador EST Estonia ETH Ethiopia FIN Finland FRA France DEU Germany GHA Ghana GRC Greece HUN Hungary ISL Iceland IND India IDN Indonesia IRL Ireland ISR Israel ITA Italy JPN Japan KAZ Kazakhstan KEN Kenya
5 UIS Information Paper Nº37 | 2017
LVA Latvia LTU Lithuania LUX Luxembourg MYS Malaysia MLT Malta MEX Mexico MAR Morocco NLD Netherlands NZL New Zealand NIG Nigeria NOR Norway PAN Panama PHL Philippines POL Poland PRT Portugal KOR Republic of Korea ROM Romania RUS Russian Federation SRB Serbia SVK Slovakia SVN Slovenia ZAF South Africa ESP Spain SWE Sweden MKD The former Yugoslav Republic of Macedonia TUR Turkey UGA Uganda UKR Ukraine
GBR United Kingdom of Great Britain and Northern Ireland
TZA United Republic of Tanzania URY Uruguay USA United States of America

6

7 UIS Information Paper Nº37 | 2017
Table of contents
Page
Acknowledgements .......................................................................................................................... 3
Country and region codes ................................................................................................................. 4
Section 1. The 2015 UIS innovation data collection ........................................................................ 9
Section 2. Innovation rates ........................................................................................................ 10 2.1 Types of innovators ....................................................................................... 10 2.2 Innovation-active and innovative firms ............................................................ 13
Section 3. Innovation activities .................................................................................................. 16
Section 4. Linkages ................................................................................................................... 19 4.1 Sources of information ................................................................................... 20 4.2 Cooperation .................................................................................................. 23
Section 5. Hampering factors ..................................................................................................... 27 5.1 Hampering factors for innovation-active firms .................................................. 27 5.2 Hampering factors for non-innovative firms ..................................................... 30
Section 6. Final remarks ............................................................................................................ 33
Annex I. Notes ....................................................................................................................... 35
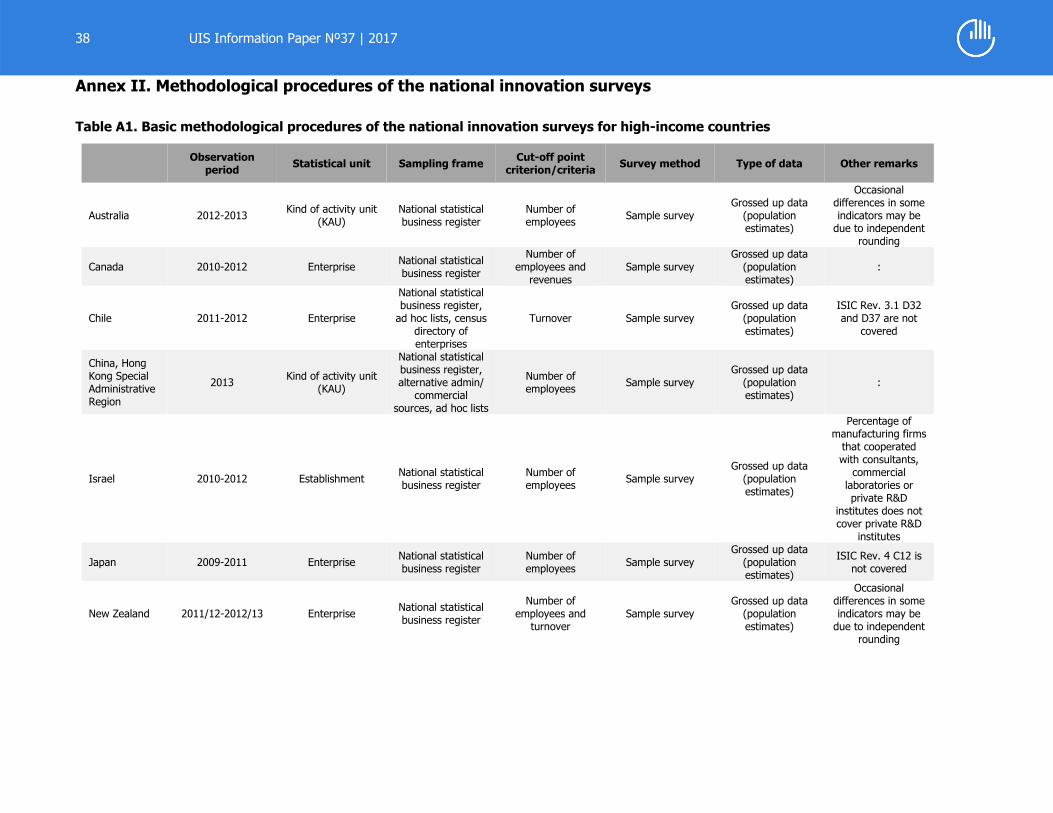
Annex II. Methodological procedures of the national innovation surveys ....................................... 38 Table A1. Basic methodological procedures of the national innovation surveys for high-income countries .......................................................................................... 38 Table A2. Basic methodological procedures of the national innovation surveys for low- and middle-income countries ......................................................................... 40 Table A3. Size classes for high-income countries .......................................................... 44 Table A4. Size classes for low- and middle-income countries ......................................... 45
Annex III. Basic innovation indicators ......................................................................................... 47
Annex IV. Statistical tables ........................................................................................................ 50 Table A5. Innovators in high-income countries (as a percentage of manufacturing firms) ....................................................................................................................... 50 Table A6. Innovators in low- and middle-income countries (as a percentage of manufacturing firms) ................................................................................................. 51

8 UIS Information Paper Nº37 | 2017
Table A7. Innovation-active and innovative firms in high-income countries (as a percentage of manufacturing firms) ............................................................................ 52 Table A8. Innovation-active and innovative firms in low- and middle-income countries (as a percentage of manufacturing firms) .................................................................... 53 Table A9. Innovative firms in high-income countries by size class (as a percentage of manufacturing firms in each size class) ....................................................................... 54 Table A10. Innovative firms in low- and middle-income countries by size class (as a percentage of manufacturing firms in each size class) .................................................. 55
List of figures Figure 1. Innovators in high-income countries (as a percentage of manufacturing firms) ................. 12 Figure 2. Innovators in low- and middle-income countries (as a percentage of manufacturing firms) 12 Figure 3. Product or process innovation-active and innovative firms in high-income countries (as
a percentage of manufacturing firms) ........................................................................... 14 Figure 4. Product or process innovation-active and innovative firms in low- and middle-income
countries (as a percentage of manufacturing firms) ........................................................ 14 Figure 5. Product or process innovative firms in high-income countries by size class (as
a percentage of manufacturing firms in each size class) .................................................. 15 Figure 6. Product or process innovative firms in low- and middle-income countries by size class
(as a percentage of manufacturing firms in each size class) ............................................ 16 Figure 7. Firms that had linkages with universities or other higher education institutions (as a
percentage of innovation-active manufacturing firms) ..................................................... 26
List of boxes Box 1. Revision of the Oslo Manual ........................................................................................... 9 Box 2. Linkages with institutional sources and partners ............................................................. 26
List of tables Table 1. Firms that engaged in innovation activities (as a percentage of innovation-active
manufacturing firms) ................................................................................................... 17 Table 2. Firms that rated sources of information as highly important (as a percentage of
innovation-active manufacturing firms) .......................................................................... 21 Table 3. Firms that cooperated with partners (as a percentage of innovation-active manufacturing
firms) ......................................................................................................................... 24 Table 4. Innovation-active firms that rated hampering factors as highly important (as a
percentage of innovation-active manufacturing firms) ..................................................... 28 Table 5. Non-innovative firms that rated hampering factors as highly important (as a
percentage of non-innovative manufacturing firms) ........................................................ 31

9 UIS Information Paper Nº37 | 2017
Section 1. The 2015 UIS innovation data collection Committed to increase the availability of timely, accurate and policy-relevant science, technology and innovation statistics, the UNESCO Institute for Statistics (UIS) has been formally engaged in the production of innovation indicators since 2010. To date, one pilot data collection and two global data collections have been carried out. The first global innovation data collection was carried out by the UIS in 2013. Since then, the gathering of innovation data has become a regular activity of the Institute, taking place biennially. The UIS innovation dataset currently covers a total of 71 countries at different stages of development.
Box 1. Revision of the Oslo Manual
UIS work on innovation statistics relies heavily on the Oslo Manual’s recommendations. At present in its third edition, the Oslo Manual (OECD and Eurostat, 2005) provides methodological guidelines for the collection and interpretation of innovation data in the business sector with the aim to foster international comparability.
The first edition of the Oslo Manual was published in 1992 and, in spite of its existence for 25 years, innovation statistics have not yet reached full international harmonisation. The Oslo Manual is currently undergoing a revision process and its fourth edition is expected to be finalised in December 2017.
Reviewing the Manual is an important step towards the production of more consistent and comparable innovation data. Nonetheless, the harmonisation of international innovation statistics is not feasible without the commitment of countries carrying out innovation surveys to truly comply with Oslo Manual guidelines.
This report presents the main results of the 2015 UIS innovation data collection, which gathered country-level data for innovation in manufacturing1. This report does not intend to compare countries in a ‘most or least, best or worst’ ranking fashion. Instead, it seeks to identify trends, common features or dissimilarities presented by firms in countries with different levels of income when undertaking innovative efforts. The basic innovation indicators presented refer to the types of innovation implemented by firms, innovation activities and linkages used, as well as obstacles they faced when trying to innovate. For analytical purposes, countries are arranged into two groups according to their income levels2, namely: 38 high-income countries and 33 low- and middle-income countries.
1 Detailed information about methodological procedures adopted by countries in their national innovation surveys
can be found in Annexes I and II. 2 Based on the classification of the World Bank: http://data.worldbank.org/about/country-and-lending-groups

10 UIS Information Paper Nº37 | 2017
Section 2. Innovation rates Product and process innovations have been part of the scope of the Oslo Manual since its very first edition. Organizational and marketing innovations, however, only became part of the formal Oslo Manual’s measurement framework in its third version.
Definition An innovation is the implementation of a new or significantly improved product (good or service), or process, a new marketing method, or a new organizational method in business practices, workplace organization or external relations. A common feature of an innovation is that it must have been implemented (Oslo Manual §146). A new or improved product is implemented when it is introduced on the market. New processes, marketing methods or organizational methods are implemented when they are brought into actual use in the firm’s operations (Oslo Manual §150). An innovation does not need to be commercially successful: a new product may not sell as much as expected and can turn out to be a commercial failure.
The changes to definitions presented in the third edition of the Oslo Manual led to the redesign of national innovation surveys, in order to include two new types of innovation. This redesign mostly comprised the creation of additional modules to national questionnaires without amending modules that were already in place, mainly to avoid the loss of time series data. In other words, in many countries previously existing survey modules – for instance on innovation activities – were not modified to cover organizational and marketing innovations in addition to product and process innovations. Bearing this in mind, one could well claim that these two new types of innovation were not completely integrated into innovation surveys and innovation statistics. This section presents innovation rates of countries. The innovation rates are firstly presented for the four types of innovation currently covered by the Oslo Manual: product innovation, process innovation, organizational innovation and marketing innovation. Subsequently, due to aforementioned reasons, the discussion focuses on indicators related to product and process innovations. 2.1 Types of innovators Figure 1 shows the shares of manufacturing firms that implemented the four types of innovation in the high-income group for which data are available.

11 UIS Information Paper Nº37 | 2017
Marketing innovation has the highest shares of innovators in 11 high-income countries – including Ireland (38.7%) and Greece (38.2%). Product innovation and process innovation tie for second place, each prevailing in 10 high-income countries as the type of innovation that was implemented by most firms. This was, for instance, observed in Germany, where 43.8% of manufacturing firms were product innovators.
Definitions Product innovation is the implementation of a good or service that is new or significantly improved with respect to its characteristics or intended uses. This includes significant improvements in technical specifications, components and materials, incorporated software, user friendliness, or other functional characteristics (Oslo Manual §156). Firms that implemented at least one product innovation are product innovators. Process innovation is the implementation of a new or significantly improved production or delivery method. This includes significant changes in techniques, equipment and/or software (Oslo Manual §163). Firms that implemented at least one process innovation are process innovators. Organizational innovation is the implementation of a new organizational method in the firm’s business practices, workplace organization or external relations (Oslo Manual §177). Firms that implemented at least one organizational innovation are organizational innovators. Marketing innovation is the implementation of a new marketing method involving significant changes in product design or packaging, product placement, product promotion, or pricing (Oslo Manual §169). Firms that implemented at least one marketing innovation are marketing innovators.
The lowest share of innovators are found in marketing innovation in 11 of these countries. For example, in Uruguay 5% of firms are marketing innovators. Figure 2 illustrates the shares of innovators in low- and middle-income countries for which data are available. In this group, process and organizational innovations prevail in nine countries. For instance, process innovations were implemented by 63.1% of firms in Uganda and organizational innovations were implemented by 64.8% of firms in Cuba. Product innovation, on the other hand, is the least prominent type of innovation in almost 45% of low- and middle-income countries.

12 UIS Information Paper Nº37 | 2017
Figure 1. Innovators in high-income countries (as a percentage of manufacturing firms)
Notes: Please consult Annexes I and II. Source: 2015 UIS innovation data collection and Eurostat
Figure 2. Innovators in low- and middle-income countries (as a percentage of manufacturing firms)
Notes: Please consult Annexes I and II. Source: 2015 UIS innovation data collection, Eurostat and AU/NEPAD
0
25
50
75
CAN DEU ISL NLD FIN BEL IRL LUX ITA NZL AUS SWE CZE AUT MLT GBR FRA DNK PRT ISR EST CYP NOR USA GRC JPN CHL CRO KOR SVK LTU LVA ESP URY POL HUN HKG SVN
Product innovators Process innovators Organizational innovators Marketing innovators
0
25
50
75
CRI TZA UGA NIG MYS KEN ECU CUB PHL SRB ETH ARG CHN EGY SLV IDN TUR BLR BRA ZAF MKD BUL PAN IND COL UKR KAZ RUS MEX ROM AZE
Product innovators Process innovators Organizational innovators Marketing innovators

13 UIS Information Paper Nº37 | 2017
2.2 Innovation-active and innovative firms There are a few basic indicators on innovation that are often used along with the indicators on the share of innovators. Mainly, they refer to the combination of firms that implemented more than one type of innovation or had abandoned or ongoing innovation activities.
Definition Innovation-active firms are those that implemented product or process innovations or had abandoned or ongoing innovation activities to develop product or process innovations, regardless of organizational or marketing innovations.
In this report, two basic indicators are examined: the percentage of innovative firms and the percentage of innovation-active firms.3 At times, these indicators, in particular the latter, can cover the four types of innovation. However, it is common practice to cover only product or process innovation. Henceforth, this report will focus on product or process innovations, regardless of organizational or marketing innovation. Figures 3 and 4 present the shares of product or process innovation-active and innovative firms in high- and low- and middle-income countries, respectively. In these figures, the difference between the darker and lighter bars represents the share of firms that only had abandoned or ongoing innovation activities. In the group of high-income countries, not many gaps are observed between the two bars. Germany is the only country where the percentage of innovation-active firms is composed by a share of firms that only had abandoned or ongoing innovation activities above 10 percentage points. The share of 63.3% innovation-active firms is the sum of the 11.2% firms that only had abandoned or ongoing innovation activities and the 52.1% of firms that were de facto product or process innovators. Other high-income countries where the gap between the two bars nears 10 percentage points are: Norway (8%) and New Zealand (7.7%). In low- and middle-income countries, there are three cases where the participation of firms with only abandoned or ongoing innovation activities in the composition of the rate of innovation-active firms is higher than 10 percentage points. In India, the share of 35.6% of innovation-active firms covers 17.1% of firms with only abandoned or ongoing innovation activities, which leaves the country with a share of 18.5% firms that were actually innovative in terms of product or process innovations. Additionally, a gap of more than 10 percentage points is observed in Cuba (12.8%) and Panama (11.6%).
3 Innovation-active firms are frequently used as a denominator in the production of innovation indicators, including in this report. In the absence of data on innovation-active firms, the number of innovative firms was used as denominator. Details can be found in Annexes I, II and III.

14 UIS Information Paper Nº37 | 2017
Figure 3. Product or process innovation-active and innovative firms in high-income countries (as a percentage of manufacturing firms)
Notes: Please consult Annexes I and II. Source: 2015 UIS innovation data collection and Eurostat
Figure 4. Product or process innovation-active and innovative firms in low- and middle-income countries (as a percentage of manufacturing firms)
Notes: Please consult Annexes I and II. Source: 2015 UIS innovation data collection and Eurostat
0
25
50
75
100
DEU LUX BEL IRL FIN ISL NLD NZL SWE ITA AUS AUT EST MLT FRA DNK CZE PRT GBR ISR GRC NOR JPN CYP ESP CRO KOR LTU LVA SVK POL HUN HKG
Innovation-active firms Innovative firms
0
25
50
75
100
CUB MYS ECU PHL PAN ETH BRA EGY SRB IND CHN TUR MKD COL BUL UKR MEX ROM
Innovation-active firms Innovative firms

15 UIS Information Paper Nº37 | 2017
It is important to note that data on innovation-active firms are not available for a number of countries. In high-income countries, the lack of data is mainly due to the non-coverage of abandoned or ongoing innovation activities in national innovation surveys. In low- and middle-income countries, data quality issues are an additional cause for missing data. The size of firms is important in innovation, thus disaggregating data by size breakdowns is key in innovation indicators. Product or process innovative firms are broken down by size class for high- and low- and middle-income countries in Figures 5 and 6. Overall, larger manufacturing firms tend to present higher rates of innovation. In high-income countries, the share of large innovative firms is above 50% in 30 out of 35 countries for which this breakdown is available, varying from 8.3% in Hong Kong Special Administrative Region of China to 92% in Luxembourg. In low- and middle-income countries, the share of innovators in large firms is above 50% in 11 out of 18 countries for which data are available. The shares of large innovative firms vary from 20.6% in South Africa to 89.7% in Costa Rica. Overall, there are four countries where the observed shares of product or process innovative firms do not follow the trend that higher shares of innovators are found in larger size classes. In Cyprus, India, Panama and South Africa this is not observed; such cases require further investigation. Figure 5. Product or process innovative firms in high-income countries by size class (as a percentage of manufacturing firms in each size class)
Notes: Please consult Annexes I and II. Source: 2015 UIS innovation data collection and Eurostat
0
25
50
75
100
CAN AUS LUX DEU ISL BEL FIN NZL ITA SWE IRL PRT MLT FRA EST DNK GRC AUT GBR CYP CZE KOR JPN ISR NOR CRO ESP LVA CHL LTU SVK URY POL HUN HKG
Small firms Medium-sized firms Large firms

16 UIS Information Paper Nº37 | 2017
Figure 6. Product or process innovative firms in low- and middle-income countries by size class (as a percentage of manufacturing firms in each size class)
Notes: Please consult Annexes I and II. Source: 2015 UIS innovation data collection and Eurostat
Section 3. Innovation activities When attempting to innovate, firms engage in a set of efforts which are defined as innovation activities. Innovation activities can be of three kinds: abandoned, ongoing or successful. Ongoing innovation activities represent work in progress and have not yet resulted in the implementation of an innovation. Abandoned innovation activities were terminated before the implementation of an innovation. Successful innovation activities in turn refer to activities that resulted in the implementation of an innovation. Contrary to assumptions, success here does not imply commercial success. It basically refers to the ability of a firm to implement innovations. Firms that engaged in any kind of innovation activity – ongoing, abandoned or successful – are innovation-active firms. In national innovation surveys, questions about innovation activities are usually addressed to product or process innovation-active firms. In some countries, however, all innovators respond to the questions4. Table 1 presents the percentage of innovation-active manufacturing firms that engaged in different types of innovation activities in both groups of countries.
4 Further information on methodological issues, including the variations on the definition of innovation-active
firms, can be found in Annexes I and II.
0
25
50
75
100
CRI ECU PHL ETH PAN EGY ARG SRB CHN MKD TUR IND ZAF COL BLR UKR KAZ ROM
Small firms Medium-sized firms Large firms

17 UIS Information Paper Nº37 | 2017
The predominant innovation activity in 55% of high-income countries is the acquisition of machinery, equipment and software. The share of innovation-active firms that engaged in such activity varies from 8% in Hong Kong Special Administrative Region of China to 91.5% in Cyprus. In about 80% of these countries, the shares of firms that engaged in this innovation activity lies above 50%.
Table 1. Firms that engaged in innovation activities (as a percentage of innovation-active manufacturing firms)
In-house R&D
Contracted-out
(external) R&D
Acquisition of
machinery, equipment
and software
Acquisition of external knowledge
Training Market
introduction of
innovations
Other preparations
High-income countries Australia 20.9 8.8 36.2 8.9 27.7 26.8 0.4 Austria 63.1 31.6 76.9 30.1 61.2 43.7 45.4 Belgium 64.1 39.5 67.8 18.0 49.9 34.9 29.0 Chile 31.3 10.1 64.5 6.5 28.2 14.1 30.3 China, Hong Kong SAR 90.4 2.7 8.0 : 7.1 5.5 10.0 Croatia 59.5 27.3 79.6 29.1 55.8 40.1 38.3 Cyprus 25.9 18.9 91.5 41.5 80.7 72.6 99.1 Czechia 53.6 24.0 72.6 13.2 50.0 37.9 41.0 Denmark 59.9 22.3 49.3 45.9 25.8 : : Estonia 55.7 26.8 83.7 83.7 44.2 44.0 36.2 Finland 83.3 58.0 72.5 44.9 40.7 46.2 41.1 France 71.2 34.8 66.1 21.4 55.8 45.7 40.6 Germany 59.4 23.9 67.9 20.3 55.1 34.3 82.4 Greece 34.4 19.1 73.7 28.1 39.9 32.7 41.3 Hungary 52.6 18.0 74.3 12.5 39.6 31.6 40.5 Ireland 77.6 34.2 66.0 24.5 : : : Israel 43.0 28.0 61.4 10.0 37.4 41.7 44.2 Italy 42.3 12.3 72.1 14.3 32.1 29.7 18.2 Japan 55.9 23.2 49.1 52.2 53.7 37.0 38.3 Latvia 27.1 13.2 50.4 20.9 23.3 21.4 52.5 Lithuania 42.7 17.3 70.7 17.5 45.1 30.4 23.6 Luxembourg 66.9 30.9 61.1 14.9 66.3 32.6 40.6 Malta 48.1 5.8 50.0 9.6 34.6 27.9 26.0 Netherlands 81.3 45.6 60.5 23.6 48.7 40.8 56.4 New Zealand 34.5 : 48.8 15.8 31.4 32.9 57.2 Norway 78.9 40.1 55.4 26.6 58.9 40.6 47.2 Poland 33.1 20.1 73.2 17.6 48.0 32.6 40.0 Portugal 34.0 18.7 64.8 16.6 51.2 27.5 31.2 Republic of Korea 81.9 14.3 42.5 11.6 41.2 36.8 45.9 Slovakia 47.4 24.1 81.4 21.0 41.1 35.7 40.5 Spain 45.9 23.3 25.2 1.7 21.2 18.5 7.5 Sweden 71.5 31.6 78.6 51.1 24.9 31.3 29.1

18 UIS Information Paper Nº37 | 2017
Uruguay 38.6 9.3 85.2 12.2 35.9 10.1 27.1 Low- and middle-income countries Argentina 66.1 16.8 80.3 14.7 51.8 : 51.4 Azerbaijan 88.9 : 66.7 : : : : Belarus 12.7 16.0 58.5 2.2 10.8 10.3 62.9
In-house R&D
Contracted-out
(external) R&D
Acquisition of
machinery, equipment
and software
Acquisition of external knowledge
Training
Market introduction
of innovations
Other preparations
Brazil 17.3 7.1 84.9 15.6 62.8 33.7 33.8 Bulgaria : 6.4 66.8 15.8 32.9 23.3 31.4 China 58.9 12.2 57.8 4.8 43.5 23.4 27.7 Colombia 23.6 6.3 70.7 27.6 17.7 18.9 16.9 Costa Rica 76.2 28.3 82.6 38.9 81.2 : 75.9 Cuba 9.8 41.3 90.2 36.6 22.1 83.8 11.9 Ecuador 34.8 10.6 74.5 27.0 33.7 10.6 10.1 Egypt 29.7 6.7 80.8 35.0 74.9 47.2 94.4 El Salvador 41.6 6.7 : : : 82.7 : Ethiopia 19.2 8.8 94.8 31.7 44.9 38.6 17.1 Ghana 49.6 23.7 75.9 36.6 80.4 59.8 45.5 India 35.5 11.4 67.6 16.1 39.2 16.7 14.8 Indonesia 58.4 6.2 47.8 27.0 46.5 59.3 94.2 Kazakhstan 37.1 13.3 62.1 17.1 21.2 26.1 48.6 Kenya 57.9 31.4 69.3 41.4 82.1 61.4 55.7 Malaysia 44.6 - 52.2 23.0 48.6 42.0 67.6 Mexico 74.5 25.5 : : : 69.0 : Morocco 60.3 39.7 : : : : : Nigeria 48.8 30.7 82.9 51.7 81.2 61.0 40.5 Panama 69.6 17.4 56.5 : 15.2 : 26.1 Romania 23.0 : 70.9 8.7 23.0 21.2 30.3 Russian Federation 50.1 22.6 94.6 10.7 19.3 74.5 24.4 Serbia 42.9 19.8 64.3 15.7 47.8 52.0 34.0 South Africa 54.1 22.4 71.2 24.8 69.6 42.6 47.7 TFYR of Macedonia 34.1 13.4 74.0 28.6 49.9 37.0 54.2 Turkey 44.4 18.5 76.5 26.6 34.3 43.9 41.3 Uganda 60.1 34.5 68.5 39.9 73.7 56.0 41.5 Ukraine 16.7 7.6 73.1 8.2 21.4 12.1 24.3 UR Tanzania 39.3 27.4 79.8 51.2 96.4 64.3 53.6
Notes: Please consult Annexes I and II. “:” Not available. "-" Nil. Source: 2015 UIS innovation data collection, Eurostat and AU/NEPAD

19 UIS Information Paper Nº37 | 2017
Definition Innovation activities are all scientific, technological, organizational, financial and commercial steps which actually lead, or are intended to lead, to the implementation of innovations. Some innovation activities are themselves innovative, others are not novel activities but are necessary for the implementation of innovations. Innovation activities also include research and development (R&D) that is not directly related to the development of a specific innovation (Oslo Manual §149).
Innovation activities include: intramural R&D; extramural R&D; acquisition of machinery, equipment and software; acquisition of other external knowledge; training; market introduction of innovations; and other preparations.
In 33% of high-income countries, internal R&D is the predominant innovation activity. In Hong Kong Special Administrative Region of China, for instance, 90.4% of firms were internal R&D performers. In contrast, the acquisition of other external knowledge presents the lowest shares of engagement in 55% of high-income countries. In Spain, for instance, only 1.7% of innovation-active firms engaged in such activity. In low- and middle-income countries, the acquisition of machinery, equipment and software is also predominant, with 62% of countries having the highest shares of firms engaged in this activity. The smallest share of innovation-active firms that engaged in this specific innovation activity is observed in Indonesia: 47.8%, a percentage that in fact should not be regarded as low. External R&D, conversely, is the activity that presents the lowest shares of engagement in 72% of low- and middle-income countries. Overall, Cuba is the only exception where there is a higher share of firms that contracted out R&D (41.3%) than those that performed it internally (9.8%). Lastly, the fact that many innovation-active firms were not R&D performers indicates that innovation is broader than R&D. Evidence shows that firms can and indeed do innovate without engaging in research and development activities, particularly in low- and middle-income countries. Section 4. Linkages Firms are the main focus of the innovation process. This however does not mean that they develop innovations single-handedly. When innovating, firms recurrently interact with other agents – such as government laboratories, universities, policy departments, regulators, competitors, suppliers and customers. Hence, understanding these linkages is crucial in order to effectively promote innovation in firms. Two types of linkages are usually measured in innovation surveys: sources of information and cooperation. They are both discussed in this section.

20 UIS Information Paper Nº37 | 2017
4.1 Sources of information Table 2 presents the sources of information that are rated as ‘highly important’ for innovation by innovation-active firms. Internal sources of information are most frequently rated as highly important by firms from both groups of countries.
Definition The innovative activities of a firm partly depend on the variety and structure of its links to sources of information, knowledge, technologies, practices, and human and financial resources (Oslo Manual §252). Sources of information are the sources that provide information for new innovation projects or contribute to the completion of existing innovation projects.
The enterprise or enterprise group is the source of information most frequently rated as highly important for 96% of high-income countries. Only in one country the predominance of a market source of information is observed: in Italy, 22.3% of firms rated suppliers as highly important sources. Internal sources prevail as highly important sources of information for innovation in low- and middle-income countries. Market sources, particularly clients or customers, appear as runner-up, being the information source most frequently classified as highly important by firms in around 40% of countries. Moreover, the government or public research institutes – institutional sources of information – prevail as highly important source of information in Cuba (24.7%) and professional and industry associations – other type of information source – prevail in Romania (30.5%).

21 UIS Information Paper Nº37 | 2017
Table 2. Firms that rated sources of information as highly important (as a percentage of innovation-active manufacturing firms)
Internal Market Institutional Other
With
in y
our
ente
rpris
e or
en
terp
rise
grou
p
Supp
liers
of
equi
pmen
t, m
ater
ials
, co
mpo
nent
s,
or s
oftw
are
Clie
nts
or
cust
omer
s
Com
petit
ors
or o
ther
en
terp
rises
in
you
r se
ctor
Cons
ulta
nts,
co
mm
erci
al
labs
, or
priv
ate
R&D
in
stitu
tes
Univ
ersi
ties
or o
ther
hi
gher
ed
ucat
ion
inst
itutio
ns
Gov
ernm
ent
or p
ublic
re
sear
ch
inst
itute
s
Conf
eren
ces,
tr
ade
fairs
, ex
hibi
tions
Scie
ntifi
c jo
urna
ls a
nd
trad
e/
tech
nica
l pu
blic
atio
ns
Prof
essi
onal
an
d in
dust
ry
asso
ciat
ions
High-income countries Australia 65.8 25.4 40.9 15.5 11.5 : : 13.1 : 14.4 Austria 63.2 31.1 41.2 18.3 6.3 11.6 7.2 25.0 13.5 8.0 Belgium 58.0 32.2 27.0 10.6 4.5 6.3 3.8 11.8 7.5 5.4 Chile 43.4 19.1 25.2 11.2 8.1 2.8 2.1 14.1 7.5 3.6 Croatia 49.9 23.8 22.7 11.8 3.0 3.6 0.8 14.9 7.4 1.7 Cyprus 95.8 70.8 49.1 34.0 28.3 6.6 4.7 42.5 33.5 15.6 Estonia 33.3 22.5 8.8 6.1 5.6 4.0 2.0 10.8 2.7 2.6 Finland 66.6 20.4 24.6 9.7 3.5 7.0 7.0 12.4 4.4 3.3 Germany 51.7 13.5 38.2 14.9 5.8 7.0 2.5 16.7 7.4 4.0 Greece 28.8 24.9 18.9 12.0 7.0 5.2 2.0 15.1 7.8 4.1 Hungary 48.7 28.5 37.5 20.7 15.4 10.5 2.5 18.6 12.9 8.1 Israel 69.7 14.5 13.1 6.7 7.5 3.0 2.2 13.6 6.8 2.1 Italy 18.9 22.3 14.8 5.3 10.4 2.8 2.0 10.2 2.8 3.0 Japan 33.7 20.7 30.5 7.5 6.2 5.1 4.8 4.6 2.0 2.9 Lithuania 45.6 24.3 11.6 11.1 6.3 5.3 4.6 17.5 8.7 3.1 Luxembourg 45.7 19.4 23.4 5.7 6.9 2.9 2.3 14.9 8.0 4.0 Malta 54.8 42.3 40.4 19.2 14.4 5.8 4.8 22.1 9.6 6.7 Netherlands 52.9 29.3 30.5 10.9 6.0 5.1 2.6 8.4 4.0 6.8 New Zealand 86.4 51.0 76.3 43.1 43.4 10.2 16.0 45.9 48.3 21.4 Norway 64.8 36.6 43.3 19.4 13.7 8.4 10.2 22.8 11.3 12.1 Poland 46.3 21.9 10.1 8.3 7.2 8.0 8.6 15.2 9.0 5.1 Portugal 43.2 25.6 30.5 12.2 6.5 6.0 3.3 14.8 7.3 7.3 Republic of Korea 52.4 12.3 25.1 11.5 2.8 4.5 6.0 6.8 3.2 3.1 Slovakia 56.5 30.0 29.5 14.5 3.5 5.4 1.3 18.8 9.1 3.7 Spain 51.6 24.3 23.8 11.0 9.6 6.0 8.6 8.3 4.7 4.1 Sweden 38.0 22.5 28.9 : : : : 7.8 : : Uruguay 44.5 20.6 33.3 10.9 : : : 26.6 17.6 :

22 UIS Information Paper Nº37 | 2017
Internal Market Institutional Other
With
in y
our
ente
rpris
e or
en
terp
rise
grou
p
Supp
liers
of
equi
pmen
t, m
ater
ials
, co
mpo
nent
s,
or s
oftw
are
Clie
nts
or
cust
omer
s
Com
petit
ors
or
oth
er
ente
rpris
es in
yo
ur s
ecto
r
Cons
ulta
nts,
co
mm
erci
al
labs
, or
priv
ate
R&D
in
stitu
tes
Univ
ersi
ties
or
oth
er
high
er
educ
atio
n in
stitu
tions
Gov
ernm
ent
or p
ublic
re
sear
ch
inst
itute
s
Conf
eren
ces,
tr
ade
fairs
, ex
hibi
tions
Scie
ntifi
c jo
urna
ls a
nd
trad
e/
tech
nica
l pu
blic
atio
ns
Prof
essi
onal
an
d in
dust
ry
asso
ciat
ions
Low- and middle-income countries Argentina 25.0 51.8 35.0 17.9 27.9 37.9 39.7 : : : Azerbaijan 66.7 33.3 44.4 55.6 11.1 11.1 22.2 11.1 11.1 11.1 Brazil 41.3 41.9 43.1 23.8 10.2 7.0 : : : : Bulgaria 30.0 22.0 22.7 : 5.9 3.3 : : 9.7 5.0 China 46.9 19.6 48.3 24.8 6.9 7.5 20.6 20.7 3.9 18.0 Colombia 98.6 38.0 50.4 28.2 23.6 12.1 8.3 38.1 54.3 13.0 Cuba 13.6 : 11.5 5.1 : 19.6 24.7 : : : Ecuador 67.0 34.9 59.0 27.1 10.7 2.0 2.2 22.2 42.5 6.3 Egypt 63.5 38.1 29.9 18.8 4.3 2.4 2.2 12.5 9.4 3.4 El Salvador : 26.4 40.3 5.4 15.2 3.8 1.8 13.9 10.3 : Ethiopia 61.8 33.6 58.9 26.8 7.9 4.9 4.4 17.1 6.6 4.3 India 58.5 43.3 59.0 32.6 16.8 7.9 11.0 29.7 15.1 24.5 Indonesia 4.4 35.4 58.8 35.8 13.3 5.3 5.3 15.5 13.3 14.6 Kazakhstan 47.3 40.4 16.6 11.3 6.9 3.6 3.1 13.0 9.0 4.6 Kenya 65.0 45.0 55.7 32.9 18.6 13.6 16.4 34.3 16.4 27.9 Malaysia 32.8 51.8 51.4 37.7 22.4 11.1 16.6 28.1 12.6 15.8 Morocco : 51.3 56.4 15.4 17.9 6.4 12.8 43.6 34.6 25.6 Nigeria 51.7 39.3 51.7 30.0 14.6 6.8 4.1 11.5 7.1 20.2 Panama 47.8 19.6 76.1 43.5 23.9 37.0 : 4.3 2.2 4.3 Philippines 70.7 49.5 66.2 37.9 21.2 10.1 7.1 21.7 16.7 15.7 Romania 6.4 8.9 13.8 24.9 21.0 18.8 16.5 20.3 23.1 30.5 Russian Federation 34.2 15.4 36.4 13.2 3.1 2.0 8.8 26.3 14.6 10.2 Serbia 33.5 15.6 22.3 6.9 7.6 4.1 4.5 13.9 7.6 4.9 South Africa 44.0 17.9 41.8 11.6 6.9 3.1 2.3 12.9 16.7 8.4 TFYR of Macedonia 39.4 22.2 17.4 7.6 5.3 3.6 2.1 23.4 15.5 7.2 Turkey 29.0 26.8 31.2 14.8 5.4 4.1 2.8 18.3 7.6 6.4 Uganda 60.9 24.8 49.0 23.0 12.2 3.2 5.0 16.4 8.3 11.3 UR Tanzania 61.9 32.1 66.7 27.4 16.7 7.1 11.9 16.7 9.5 20.2
Notes: Please consult Annexes I and II. “:” Not available. Source: 2015 UIS innovation data collection, Eurostat and AU/NEPAD
23 UIS Information Paper Nº37 | 2017
4.2 Cooperation In contract to the use of sources of information, innovation cooperation requires that collaborating parties play an active role in the work being undertaken. The percentage of innovation-active manufacturing firms that cooperated with partners in order to develop their innovation activities is presented in Table 3.
Definition
Cooperation is the active participation in joint innovation projects with other organizations. These may either be other firms or non-commercial institutions. The partners need not derive immediate commercial benefit from the venture. Pure contracting out of work, where there is no active collaboration, is not regarded as cooperation (Oslo Manual §271). Innovation cooperation allows enterprises to access knowledge and technology that they would be unable to utilise on their own. There is also great potential for synergies in cooperation as partners learn from each other (Oslo Manual §271).
Evidence indicates that linkages with the market are more incident when it comes to the active collaboration in innovation projects in both groups of countries. In high-income countries, market-related linkages chiefly refer to the cooperation with suppliers, which prevail as cooperation partners in almost 80% of countries. Clients or customers also appear as the most frequent cooperation partners of firms in a few countries – for instance, Iceland (23.7%) and New Zealand (18.7%). Opposite to the indicator on sources of information, the enterprise or enterprise group prevails as a partner in only one high-income country: Hong Kong Special Administrative Region of China at 36.2%. In more than 75% of high-income countries, suppliers predominate as innovation partners. This is also observed in 40% of low- and middle-income countries, followed by clients or customers, which prevail as partners in 28% of countries from this group. Moreover, competitors or other enterprises from the same industrial sector are the leading cooperation partners of firms in Ethiopia (16.1%) and Kenya (85%), while consultants prevail in Malaysia (29%).

24 UIS Information Paper Nº37 | 2017
Table 3. Firms that cooperated with partners (as a percentage of innovation-active manufacturing firms)
Internal Market Other Other
enterprises within your enterprise
group
Suppliers of equipment, materials,
components, or software
Clients or customers
Competitors or other
enterprises in your sector
Consultants, commercial
labs, or private R&D
institutes
Universities or other higher
education institutions
Government or public research institutes
High-income countries Australia 5.6 10.5 13.7 0.8 5.2 0.05 1.2 Austria 21.9 26.1 23.3 12.1 17.7 24.7 15.6 Belgium 24.6 37.5 24.2 12.9 19.3 21.9 16.2 Chile 5.9 8.5 6.7 3.5 6.1 5.4 4.0 China, Hong Kong SAR 36.2 : : : : 1.1 6.2 Croatia 11.6 29.3 22.9 16.7 15.8 16.0 12.2 Cyprus 6.6 44.8 33.5 29.2 23.6 5.2 3.8 Czechia 13.2 28.3 17.0 7.9 11.6 16.6 6.4 Denmark 19.0 34.1 23.2 11.2 28.2 18.5 11.7 Estonia 22.7 25.5 15.3 10.5 10.2 9.7 4.5 Finland 23.5 37.6 35.1 29.6 28.6 32.3 29.6 France 14.1 21.5 11.5 5.6 13.6 11.8 8.5 Germany 8.3 12.0 9.8 4.0 6.8 16.3 11.7 Greece 14.4 25.6 20.8 12.9 18.0 18.7 18.3 Hungary 18.1 25.6 19.5 11.7 20.7 18.8 5.2 Iceland 6.2 9.5 23.7 3.8 1.9 10.4 15.6 Ireland 17.9 20.9 17.8 4.9 16.0 17.0 7.7 Israel 8.2 10.2 9.6 6.1 8.9 7.6 5.3 Italy 2.3 5.7 4.1 3.0 5.0 5.2 2.3 Japan : 31.7 31.5 19.9 16.9 15.7 14.4 Latvia 10.6 18.6 8.5 11.6 12.1 5.9 5.9 Lithuania 17.3 29.1 17.9 14.3 15.0 13.9 10.7 Luxembourg 10.9 17.7 16.0 11.4 12.6 8.6 9.1 Malta 8.7 9.6 9.6 3.8 5.8 7.7 1.0 Netherlands 16.8 26.4 19.0 9.7 14.1 12.7 8.5 New Zealand : 18.2 18.7 16.6 : 7.2 5.9 Norway 16.6 21.5 20.2 10.4 19.6 15.5 17.0 Poland 12.2 21.6 : 7.6 9.3 11.6 10.7 Portugal 5.4 11.2 9.9 4.2 6.4 8.6 5.6

25 UIS Information Paper Nº37 | 2017
Internal Market Other Other
enterprises within your enterprise
group
Suppliers of equipment, materials,
components, or software
Clients or customers
Competitors or other
enterprises in your sector
Consultants, commercial
labs, or private R&D
institutes
Universities or other higher
education institutions
Government or public research institutes
Republic of Korea 6.2 11.9 14.3 8.9 5.1 12.5 11.1 Slovakia 21.9 35.4 28.0 15.7 15.0 12.3 6.3 Spain 8.5 12.8 8.4 5.1 7.5 8.7 11.8 Sweden 16.7 28.4 27.0 18.2 18.2 16.9 12.2 United Kingdom & Northern Ireland 27.8 39.1 45.4 15.0 21.3 17.2 8.4 Low- and middle-income countries Argentina 8.0 7.8 3.8 3.8 4.9 11.2 9.2 Brazil : 10.0 12.8 5.2 6.2 6.3 : Bulgaria : 9.7 : 4.7 : : : China 19.4 27.2 34.3 13.3 7.1 24.6 16.1 Colombia 7.9 23.2 17.4 2.8 15.2 8.7 0.6 Costa Rica : 63.9 61.1 16.5 49.6 35.3 8.1 Cuba : 15.3 28.5 22.1 : 14.9 26.4 Ecuador : 62.4 70.2 24.1 22.1 5.7 3.0 Egypt 2.0 4.6 1.3 2.0 1.0 1.2 1.1 El Salvador : 36.9 42.1 1.3 15.3 5.5 3.4 Ethiopia 13.3 15.1 15.1 16.1 5.8 7.8 5.7 Indonesia : 25.7 15.9 8.0 10.2 8.4 4.9 Kazakhstan 17.4 90.5 43.7 34.5 22.3 11.0 10.2 Kenya 42.1 32.9 61.4 85.0 66.4 61.4 75.7 Malaysia 14.5 18.8 19.0 17.1 29.0 13.9 13.6 Morocco : 25.6 : : 19.2 3.8 : Panama : : : : 39.1 56.5 84.8 Philippines 91.2 92.6 94.1 67.6 64.7 47.1 50.0 Romania 7.3 20.9 12.3 2.8 10.6 5.0 7.5 Russian Federation 11.7 14.0 10.1 3.5 4.7 9.3 15.0 Serbia 18.8 0.1 0.1 - 0.1 - - South Africa 14.2 30.3 31.8 18.6 21.1 16.2 16.2 TFYR of Macedonia 15.0 17.7 14.1 11.0 8.8 5.0 6.0 Turkey 9.3 8.2 7.8 5.8 6.1 5.6 4.1 Ukraine 3.2 11.2 5.4 2.4 2.2 2.7 4.8
Notes: Please consult Annexes I and II. “:” Not available. "-" Nil. Source: 2015 UIS innovation data collection, Eurostat and AU/NEPAD

26 UIS Information Paper Nº37 | 2017
Box 2. Linkages with institutional sources and partners
In this report, the term ‘institutional’ covers interactions with two types of agents: i) universities or other higher education institutions; and ii) the government or public research institutes. Overall, linkages, particularly regarding active collaboration, with these institutions are relatively low, with just a few exceptions.
Cuba is the only country where an institutional source of information prevails: 24.7% of Cuban firms rated the government or public research institutes as a highly important source of information. Regarding cooperation, the government or public research institutes prevail as partners in Panama (84.8%) and the Russian Federation (15%). Moreover, universities and other higher educational institutions are the predominant innovation partners in two countries only, namely: Germany (16.3%) and Argentina (11.2%).
Figure 7 illustrates the percentages of firms that had linkages with universities or other higher education institutions. Except for New Zealand and Cyprus, high-income countries have higher shares of firms cooperating with these agents than rating them as highly important information sources. This is observed in 67% of low- and middle-income countries.
Figure 7. Firms that had linkages with universities or other higher education institutions (as a percentage of innovation-active manufacturing firms)
Notes: Please consult Annexes I and II. Source: 2015 UIS innovation data collection and Eurostat
0
15
30
45
60
75
Cooperation partners, high-income Cooperation partners, low- and middle-incomeHighly important sources of information, high-income Highly important sources of information, low- and middle-income
27 UIS Information Paper Nº37 | 2017
Section 5. Hampering factors The obstacles that hinder innovation in firms, known as hampering factors, are discussed in this section. For this report, hampering factors have been divided into four categories: cost factors, knowledge factors, market factors and reasons not to innovate. The results are presented for innovation-active firms and non-innovative firms.
Definition Innovation activity may be hampered by a number of factors. There may be reasons for not starting innovation activities at all; there may be factors that slow innovation activity or have a negative effect on expected results (Oslo Manual §410). These hampering factors include: economic factors, such as high costs or lack of demand; knowledge factors, such as lack of skilled personnel; market factors, such as uncertainty in the demand for innovative products; and other factors, such as regulations.
5.1 Hampering factors for innovation-active firms Table 4 presents the hampering factors which were highly important for innovation-active firms. Cost factors are the prevailing obstacles in both groups of countries. In the high-income group, the lack of funds within the enterprise or enterprise group was the cost factor rated as highly important by most of the firms in 45% of countries, followed by the high costs of innovation, which prevailed in 38% of countries. In addition, the lack of financing from outer sources was a problem for firms in Australia (34.7%). Altogether cost factors are the obstacles that were most frequently rated as highly important by innovation-active firms in 86% of high-income countries. Moreover, in a few high-income countries the predominance of hampering factors of a different nature – in particular knowledge and institutional factors – is observed. The lack of qualified personnel was the knowledge hampering factor most frequently rated as highly important by the innovation-active firms in Japan (14.2%) and Uruguay (26.1%). Moreover, the difficulty in finding cooperation partners was the prevailing knowledge hampering factor for firms in Canada (27.4%). Additionally, the uncertain demand for innovative goods or services, a market hampering factor, prevailed in Luxembourg (16.8%).

28 UIS Information Paper Nº37 | 2017
Table 4. Innovation-active firms that rated hampering factors as highly important (as a percentage of innovation-active manufacturing firms)
Cost factors Knowledge factors Market factors Reasons not to innovate
Lack
of f
unds
w
ithin
you
r en
terp
rise
or
ente
rpris
e gr
oup
Lack
of
finan
cing
from
so
urce
s ou
tsid
e th
e en
terp
rise
Inno
vatio
n co
sts
are
too
high
Lack
of
qual
ified
pe
rson
nel
Lack
of
info
rmat
ion
on
tech
nolo
gy
Lack
of
info
rmat
ion
on
mar
kets
Diff
icul
ty in
fin
ding
co
oper
atio
n pa
rtne
rs fo
r in
nova
tion
Mar
ket
dom
inat
ed b
y es
tabl
ishe
d en
terp
rises
Unce
rtai
n de
man
d fo
r in
nova
tive
good
s or
se
rvic
es
No
need
due
to
prio
r in
nova
tions
by
your
ent
erpr
ise
No
dem
and
for
inno
vatio
ns
High-income countries Australia : 34.7 23.7 32.6 - : : : 23.3 : : Belgium 16.8 10.7 19.2 16.2 5.6 5.0 6.2 14.0 10.2 1.9 3.1 Canada 21.5 12.9 : 25.8 : : 27.4 : 22.5 : : Chile 23.2 16.4 30.3 21.0 11.4 12.4 18.4 20.7 21.9 5.6 4.9 China, Hong Kong SAR 5.5 4.3 69.7 3.4 1.8 : : 2.5 3.0 : : Croatia 46.3 33.0 38.5 18.1 5.5 6.5 12.6 17.9 13.5 1.2 2.4 Cyprus 28.5 28.9 33.6 11.5 8.9 1.7 9.4 14.5 14.9 : : Czechia 35.7 20.0 24.8 11.9 2.5 2.5 4.1 19.4 12.7 2.9 4.4 Estonia 23.4 18.8 15.4 15.2 3.8 3.0 4.7 11.3 9.3 5.5 3.9 Finland 22.5 14.6 16.4 9.2 2.9 5.3 3.9 7.1 10.8 3.5 3.7 France 33.6 20.3 29.0 15.1 5.8 7.0 9.7 15.7 21.8 3.2 4.6 Hungary 31.1 20.4 29.3 14.2 4.0 4.2 7.0 13.4 22.5 2.3 4.9 Iceland 23.7 19.9 15.6 4.3 2.4 2.4 5.7 2.8 8.1 2.4 2.8 Ireland 27.6 22.9 18.8 10.9 3.6 5.8 7.8 15.7 18.8 3.4 5.1 Italy 27.6 28.4 32.0 9.2 3.6 4.7 12.5 16.9 23.0 0.1 1.9 Japan 11.0 5.2 12.0 14.2 9.0 7.6 6.4 5.3 8.8 3.8 6.9 Latvia 25.8 17.7 28.9 15.2 4.3 9.3 16.8 20.8 14.6 7.8 7.8 Lithuania 27.1 20.1 26.6 14.1 4.5 5.7 8.8 18.2 8.8 1.4 : Luxembourg 10.2 4.8 9.6 10.2 3.0 5.4 10.8 15.6 16.8 1.8 4.2 Malta 23.0 22.0 31.0 8.0 4.0 12.0 10.0 24.0 25.0 4.0 5.0 New Zealand : : 30.3 12.1 : : 2.4 : : : : Norway 19.8 18.3 27.7 14.2 3.4 4.1 6.9 9.5 11.5 1.3 3.5 Poland 32.0 26.0 34.5 8.2 6.2 6.1 9.6 17.9 17.0 5.0 6.3 Portugal 39.6 34.9 42.9 15.2 7.6 7.4 15.3 18.2 21.7 4.2 8.2 Republic of Korea 29.8 9.0 12.1 26.1 14.8 11.6 6.7 7.5 15.8 2.8 3.8 Slovakia 33.2 : 26.1 13.6 5.5 5.5 5.1 15.5 10.5 - -

29 UIS Information Paper Nº37 | 2017
Cost factors Knowledge factors Market factors Reasons not to innovate
Lack
of f
unds
w
ithin
you
r en
terp
rise
or
ente
rpris
e gr
oup
Lack
of
finan
cing
from
so
urce
s ou
tsid
e th
e en
terp
rise
Inno
vatio
n co
sts
are
too
high
Lack
of
qual
ified
pe
rson
nel
Lack
of
info
rmat
ion
on
tech
nolo
gy
Lack
of
info
rmat
ion
on
mar
kets
Diff
icul
ty in
fin
ding
co
oper
atio
n pa
rtne
rs fo
r in
nova
tion
Mar
ket
dom
inat
ed b
y es
tabl
ishe
d en
terp
rises
Unce
rtai
n de
man
d fo
r in
nova
tive
good
s or
se
rvic
es
No
need
due
to
prio
r in
nova
tions
by
your
ent
erpr
ise
No
dem
and
for
inno
vatio
ns
Spain 40.0 37.9 39.0 10.9 8.1 8.9 11.7 18.6 29.4 5.8 7.5 Sweden 21.2 11.8 12.4 12.0 2.3 4.2 3.4 12.6 8.3 1.3 2.6 Uruguay : : : 26.1 6.2 9.9 : : : : : Low- and middle-income countries Azerbaijan 22.2 22.2 22.2 11.1 66.7 22.2 - : 22.2 22.2 : Belarus 43.4 10.6 22.8 7.6 2.4 3.5 1.4 : 2.4 : 7.0 Brazil : 20.1 25.0 23.7 8.1 6.5 10.6 : : : : Bulgaria 40.1 31.2 40.6 18.1 : : 21.4 21.4 27.9 : 7.8 China 29.8 60.8 55.8 71.6 47.7 26.5 18.5 7.4 37.5 39.4 : Colombia 27.3 16.1 13.7 10.6 7.1 8.7 14.7 : 19.9 : : Costa Rica : 27.2 17.6 26.9 9.2 12.9 23.2 23.8 : : : Cuba 55.3 39.1 10.6 26.8 54.0 33.2 : : 27.2 : : Ecuador 28.2 23.9 37.9 23.8 22.5 17.8 15.5 20.9 16.7 : : Egypt 30.6 35.5 48.9 24.4 16.0 15.9 24.0 26.0 24.1 22.8 14.8 El Salvador 55.6 : : 50.7 28.9 : : : 41.4 : 34.7 Ethiopia 46.3 39.2 34.4 25.9 23.4 15.8 21.4 22.2 17.9 3.1 1.5 India 58.7 32.0 36.0 53.3 31.2 34.8 : 24.3 19.7 : : Indonesia 38.9 13.7 5.3 33.6 13.3 4.4 1.8 36.3 13.3 : : Kenya 40.7 32.1 42.9 17.9 8.6 11.4 14.3 32.9 22.9 8.6 7.1 Malaysia 46.7 42.4 54.8 31.3 33.3 29.4 29.6 36.0 31.3 8.7 9.2 Nigeria 51.0 45.9 48.5 13.7 15.6 14.4 23.4 22.7 22.0 11.5 9.3 Panama : : : : 89.1 87.0 67.4 21.7 : : : Philippines 19.1 10.2 20.9 11.7 8.2 10.0 5.6 14.7 9.9 : : Romania 39.3 26.4 30.4 8.5 2.4 4.7 7.1 22.2 19.6 5.8 5.7 Russian Federation 37.4 17.1 29.0 6.6 2.6 3.5 2.1 : : : 8.3 Serbia 56.4 38.3 45.1 9.7 5.7 5.4 16.6 22.0 21.7 5.4 6.6 South Africa 38.1 23.5 33.5 23.0 11.9 11.7 13.1 17.5 15.5 3.0 2.9 Uganda 50.3 40.2 51.1 13.3 19.7 15.2 26.3 28.3 26.1 5.8 7.6 UR Tanzania 52.4 48.8 42.9 33.3 20.2 13.1 16.7 21.4 19.0 7.1 3.6
Notes: Please consult Annexes I and II. “:” Not available. “-” Nil. Source: 2015 UIS innovation data collection, Eurostat and AU/NEPAD

30 UIS Information Paper Nº37 | 2017
The predominance of hampering factors that are cost-related is also observed is the group of low- and middle-income countries. Cost factors are the obstacles most frequently rated as highly important by innovation-active firms in 88% of countries from this group, a proportion that is similar to the one of high-income countries. The lack of internal funds is the prevailing obstacle for innovation-active firms in 52% of low- and middle-income countries, while the high costs of innovation and the lack of external funds prevail in 32% and 4% of countries, respectively. Knowledge factors are the predominant obstacles for innovation-active firms in three low- and middle-income countries. The lack of information on technology was a highly important hampering factor for 66.7% of firms in Azerbaijan and for 89.1% of firms in Panama. In China, 71.6% of innovation-active firms rated the lack of qualified personnel as a highly important barrier to innovation. 5.2 Hampering factors for non-innovative firms Table 5 presents the hampering factors which were highly important for non-innovative firms. Similar to what was observed in the case of innovation-active firms, cost factors are the obstacles that hinder innovation most in non-innovative firms. In 46% of high-income countries, high costs of innovation are the hampering factor most frequently rated as highly important by firms that did not innovate. The lack of demand for innovations prevailed as an important barrier in more than 20% of countries. In Hong Kong Special Administrative Region of China, for instance, 90.9% of firms rated this factor as highly important. In the group of low- and middle-income countries, the lack of funds within the enterprise or enterprise group was the factor most frequently rated as highly important by firms in half of these countries. In India, for instance, 67.2% of non-innovative firms classified the lack of internal funds as a highly important obstacle to innovation. As observed in the case of innovation-active firms, high costs of innovation appear in second place for non-innovative firms, being the predominant hampering factor in 32% of the low- and middle-income countries. The knowledge factors lack of qualified personnel and lack of information on markets are the obstacles that prevailed in Serbia (29.7%) and Cuba (66.7%), respectively. Another remark worth mentioning is that in four countries most non-innovative firms claimed that there was no need to innovate due to prior innovations. These countries are: Brazil (13.6%), China (19.1%), Ecuador (20.6%) and Panama (57.1%).

31 UIS Information Paper Nº37 | 2017
Table 5. Non-innovative firms that rated hampering factors as highly important (as a percentage of non-innovative manufacturing firms)
Cost factors Knowledge factors Market factors Reasons not to innovate
Lack
of f
unds
w
ithin
you
r en
terp
rise
or
ente
rpris
e gr
oup
Lack
of
finan
cing
from
so
urce
s ou
tsid
e th
e en
terp
rise
Inno
vatio
n co
sts
are
too
high
Lack
of
qual
ified
pe
rson
nel
Lack
of
info
rmat
ion
on
tech
nolo
gy
Lack
of
info
rmat
ion
on
mar
kets
Diff
icul
ty in
fin
ding
co
oper
atio
n pa
rtne
rs fo
r in
nova
tion
Mar
ket
dom
inat
ed b
y es
tabl
ishe
d en
terp
rises
Unce
rtai
n de
man
d fo
r in
nova
tive
good
s or
se
rvic
es
No
need
due
to
prio
r in
nova
tions
by
your
ent
erpr
ise
No
dem
and
for
inno
vatio
ns
High-income countries Australia : 10.5 7.9 17.0 - : : : 18.1 : : Belgium 13.4 10.3 19.0 12.4 4.4 4.3 6.8 13.9 14.8 12.1 22.9 Chile 39.9 32.9 52.6 35.9 23.2 22.6 36.7 37.2 38.9 16.3 17.5 China, Hong Kong SAR 4.2 2.5 10.6 5.0 4.4 0.3 : 3.0 7.4 0.5 90.9 Croatia 28.3 21.4 29.2 9.8 3.8 3.3 8.4 13.1 11.5 4.0 5.6 Cyprus 63.3 56.0 64.2 19.3 13.0 8.9 13.9 42.1 52.2 43.0 43.7 Czechia 27.3 15.8 23.7 7.1 2.5 2.5 6.0 16.5 12.9 10.2 29.1 Estonia 23.7 21.2 16.6 8.6 2.2 2.1 5.2 13.6 9.7 6.4 7.8 Finland 15.1 8.8 14.0 7.3 5.4 5.0 7.6 8.9 13.5 8.2 7.4 France 21.2 12.2 21.5 11.3 4.8 5.1 7.7 12.9 17.4 12.9 24.5 Hungary 26.2 18.4 28.0 11.0 5.0 5.1 8.7 16.1 22.8 5.3 11.9 Iceland 7.0 12.4 4.3 : : : : 2.7 : 5.4 2.7 Ireland 25.9 22.4 24.8 7.0 2.7 3.6 4.8 13.0 16.0 14.7 17.2 Italy 36.4 27.5 35.1 8.8 4.0 4.7 12.9 19.1 24.3 2.1 15.1 Japan 10.8 4.1 9.0 11.1 7.8 6.5 5.7 5.3 7.1 4.0 7.6 Latvia 28.4 23.8 35.7 13.3 7.1 8.4 18.2 25.9 21.4 9.6 16.3 Lithuania 34.6 28.2 35.3 14.5 9.2 9.9 15.5 26.6 22.0 25.3 21.8 Luxembourg 2.8 - 3.7 1.9 - - 0.9 0.9 1.9 6.5 24.3 Malta 8.5 3.5 12.7 4.9 2.8 2.1 2.1 8.5 5.6 3.5 7.0 New Zealand : : 17.4 7.2 : : 2.0 : : : : Norway 6.8 6.7 7.7 3.8 1.5 1.7 2.7 3.5 6.5 1.2 2.2 Poland 31.4 26.6 33.4 16.4 14.0 13.5 18.4 21.7 22.7 16.7 16.8 Portugal 34.7 30.8 45.0 11.2 7.6 9.2 18.3 23.6 34.1 10.3 19.4 Republic of Korea 14.1 4.3 4.3 7.2 4.5 3.2 1.7 2.4 8.2 1.7 19.3 Slovakia 23.9 : 31.6 9.7 4.5 4.6 12.8 12.4 16.9 11.8 16.8 Spain 36.7 31.0 38.1 18.3 14.3 13.1 15.2 18.8 28.5 11.2 24.5 Sweden 8.5 4.9 7.5 4.7 2.7 1.7 2.4 7.1 6.1 3.9 7.9

32 UIS Information Paper Nº37 | 2017
Cost factors Knowledge factors Market factors Reasons not to innovate
Lack
of f
unds
w
ithin
you
r en
terp
rise
or
ente
rpris
e
grou
p
Lack
of
finan
cing
from
so
urce
s ou
tsid
e th
e en
terp
rise
Inno
vatio
n co
sts
are
too
hi
gh
Lack
of
qual
ified
pe
rson
nel
Lack
of
info
rmat
ion
on
tech
nolo
gy
Lack
of
info
rmat
ion
on
mar
kets
Diff
icul
ty in
fin
ding
co
oper
atio
n pa
rtne
rs fo
r in
nova
tion
Mar
ket
dom
inat
ed b
y es
tabl
ishe
d en
terp
rises
Unce
rtai
n
dem
and
for
inno
vativ
e
good
s or
se
rvic
es
No
need
due
to
prio
r in
nova
tions
by
your
ent
erpr
ise
No
dem
and
for
inno
vatio
ns
Uruguay : : : 18.1 6.1 11.0 : : : : : Low- and middle-income countries Azerbaijan 25.1 13.3 9.5 6.1 6.9 3.2 0.9 : 2.3 1.2 : Belarus 41.0 12.4 28.1 10.5 4.5 4.8 4.3 : 4.5 : 6.2 Brazil : 7.9 11.5 8.4 2.8 2.1 2.6 : : 13.6 2.1 Bulgaria 39.6 28.1 36.4 14.4 8.9 8.9 18.7 20.7 23.9 5.5 10.4 China 9.8 18.3 14.4 18.6 13.3 7.6 6.0 2.3 11.6 19.1 : Colombia 2.6 1.6 1.0 0.7 0.5 0.6 1.2 : 1.6 : : Costa Rica : 37.7 26.4 34.0 15.1 26.4 22.6 37.7 : : : Cuba 60.0 26.7 : 33.3 53.3 66.7 : : 40.0 : : Ecuador 6.8 5.9 11.5 10.3 7.0 6.2 5.0 7.1 4.7 20.6 14.9 Egypt 45.8 41.4 57.0 36.3 27.3 15.1 28.7 35.3 26.1 9.2 20.9 Ethiopia 34.3 29.0 28.8 24.2 20.5 15.4 15.3 18.0 11.8 6.9 5.0 India 67.2 43.8 28.5 44.2 32.1 35.0 : 23.7 20.3 : : Indonesia 39.3 38.3 40.3 34.1 35.6 33.3 36.2 36.2 35.3 : : Kazakhstan 45.3 3.3 3.8 2.1 1.2 0.6 1.8 1.6 5.2 7.5 27.6 Kenya 40.4 28.1 42.1 15.8 7.0 8.8 12.3 31.6 19.3 7.0 5.3 Nigeria 55.2 47.1 41.6 20.8 22.6 18.6 21.7 20.4 18.6 9.5 12.2 Panama : 42.9 42.9 : : : : : : 57.1 : Philippines 23.9 14.5 26.0 9.5 13.3 8.2 8.6 16.0 12.1 7.4 13.0 Romania 39.2 26.3 34.6 12.9 7.0 6.6 14.5 19.9 19.0 : : Russian Federation 28.7 14.8 22.9 7.7 3.8 4.0 3.2 : : : 7.5 Serbia 11.5 15.2 22.9 29.7 26.5 18.0 22.2 24.8 24.9 23.0 27.6 South Africa 31.0 20.2 24.6 16.7 8.8 3.9 8.8 28.3 19.1 11.0 54.6 Turkey 26.0 19.3 38.5 14.7 9.1 6.6 11.0 19.0 19.6 10.0 23.6 Uganda 41.7 25.5 29.8 11.9 14.9 10.6 19.3 40.5 22.3 13.6 8.8 Ukraine 28.1 17.7 : 4.2 : : 4.7 17.9 5.2 9.5 15.1 URTanzania 30.2 26.4 26.4 20.8 15.1 11.3 13.2 20.8 9.4 3.8 1.9
Notes: Please consult Annexes I and II. “:” Not available. “-” Nil. Source: 2015 UIS innovation data collection, Eurostat and AU/NEPAD

33 UIS Information Paper Nº37 | 2017
Section 6. Final remarks This report describes the main findings of the 2015 UIS innovation data collection and examines key features of the innovation process in high- and low- and middle-income countries. The idea was to identify commonalities and variations in their innovation processes between these two groups of countries. First, all countries had high shares of manufacturing firms which introduced innovations. Marketing was the type of innovation most frequently implemented by firms in high-income countries, while process and organizational innovations prevailed amongst firms in low- and middle-income countries. The extensiveness of innovation was also observed size-wise. The results showed that firms from all size classes were innovative in terms of product or process innovations and that – with few exceptions that call for further research – larger classes had higher shares of innovators. Furthermore, when looking at the level of innovativeness, the role of abandoned and ongoing innovation activities in the shares of innovation-active firms should not be disregarded. In terms of innovation activities, the acquisition of machinery, equipment and software was the activity performed by most firms in both groups of countries. In addition, evidence pointed to higher shares of firms performing R&D activities in high-income countries than in low- and middle-income countries. The fact that not all innovation-active firms engage in research and development is an indication that innovation can and does take place without R&D. Evidence showed that most of the innovation-active firms in both groups mostly relied on internal sources of information – meaning, the enterprise or enterprise group – to develop their innovation activities or projects. Italy was an exception amongst high-income countries, with the predominance of suppliers – a market-related source of information – as being highly important. Market sources, chiefly clients or customers, played a relevant role as a source of information for firms in low- and middle-income countries. The situation is different when it comes to cooperation for innovation. Overall, internal linkages prevailed only in Hong Kong Special Administrative Region of China. In addition, linkages with the market are more common when it comes to active participation in innovation activities. Suppliers were the predominant cooperation partners of innovation-active firms in both groups of countries.
Lastly, regarding hampering factors for innovation activities, cost factors – in particular the lack of funds within the enterprise or enterprise group – were the main obstacle faced by innovation-active firms. This was observed in high- as well as low- and middle-income countries. Cost factors also prevailed as an obstacle for non-innovative firms. However, a different cost factor stood out in high-income countries, namely the high costs of innovation. Moreover, in this same group of countries, the lack of demand for innovations was regarded as an important barrier to innovation by non-innovative firms.

34 UIS Information Paper Nº37 | 2017
Official international guidelines for measuring innovation were defined in 1992, with the publication of the first edition of the Oslo Manual. More than two decades later, international innovation statistics are still maturing. The production of reliable innovation statistics for international appraisals remains a challenge, mainly due to variations in methodological procedures applied by countries in their national innovation surveys. Therefore, caution is required when using the indicators presented in this report – in particular for comparisons. This is especially important when dealing with countries that do not have grossed up results. Likewise, the drafting of policy recommendations should not be based uniquely on the results presented here.

35 UIS Information Paper Nº37 | 2017
Annex I. Notes
Abandoned or ongoing innovation activities include activities that were abandoned before the implementation of an innovation or activities that were in progress during the survey observation period and had not yet resulted in the implementation of an innovation. Unless otherwise specified, the term covers product or process innovations, regardless of organizational or marketing innovations. Differences are observed in the following countries:
- Argentina, Azerbaijan, Belarus, Canada, Chile, Costa Rica, Indonesia, Kazakhstan, Morocco, Russian Federation, Uruguay, United States of America: firms with abandoned or ongoing innovation activities are not covered in the national innovation survey – no data available; and
- Australia, Colombia, Cuba, Malaysia, Panama: coverage refers to product, process, organizational or
marketing innovations. Innovation-active firms include firms that implemented product or process innovations or had abandoned or ongoing innovation activities to develop product or process innovations, regardless of organizational or marketing innovations. Differences are observed in the following countries:
- Colombia, Kenya (as denominator for indicators for innovation activities, sources of information, cooperation and hampering factors), Malaysia, Panama: coverage refers to firms that implemented product or process innovations, regardless of organizational or marketing innovations or had abandoned or ongoing innovation activities for product, process, organizational or marketing innovations;
- Australia, Cuba, El Salvador (as denominator for indicators for innovation activities, sources of information,
cooperation and hampering factors): coverage refers to firms that implemented product, process, organizational or marketing innovation or had abandoned or ongoing innovation activities for product, process, organizational or marketing innovations;
- Nigeria, United Republic of Tanzania: coverage is not specified; and - Argentina, Azerbaijan, Belarus, Canada, Chile, Costa Rica, Indonesia, Kazakhstan, Morocco, Russian
Federation, United States of America, Uruguay: innovation-active firms are not identified, as firms with abandoned or ongoing innovation activities are not covered in the national innovation survey. Where applicable, innovative firms are used as denominator instead.
Innovative firms include all firms that have implemented product or process innovations during the observation period covered by the national innovation survey. Unless otherwise specified, the term covers product or process innovations, regardless of organizational or marketing innovations.

36 UIS Information Paper Nº37 | 2017
Differences are observed in the following countries:
- Canada: data cover firms that implemented product, process, organizational or marketing innovations; and
- United States of America: data cover firms that implemented only product or process innovations.
The degree of importance of sources of information for innovation is measured differently across countries, which is generally but not uniquely done with the use of a scale of importance – high, medium, low, not used. The indicators about sources of information presented in this report cover sources rated as highly important. Differences are observed in the following countries:
- Argentina, Australia, Colombia, El Salvador, New Zealand: use of a dichotomous (“Yes/No”) question; - Azerbaijan: data cover main and decisive as well as significant degrees of importance; - China: data cover the highest, second highest and third highest degrees of importance; - Morocco: data cover good and excellent degrees of importance; and - Indonesia, Nigeria, United Republic of Tanzania: the degree of importance, which data refer to, is not
identified. Cooperation covers the active participation with other firms or public institutions in innovation activities, as well as non-active collaboration in Cuba, El Salvador and Republic of Korea.
The degree of importance of factors hampering innovation is measured differently across countries which is generally but not uniquely done with the use of a scale of importance – high, medium, low, not important. The indicators about hampering factors presented in this report cover factors rated as highly important. Differences are observed in the following countries:
- Australia, Canada, El Salvador, Kazakhstan: use of a dichotomous (“Yes/No”) question; - China: data cover the highest, second highest and third highest degrees of importance; - Panama: data for hampering factors for innovation-active firms cover high and irrelevant degrees of
importance, while for non-innovative firms data cover the lowest and second lowest degrees of importance; and
- Indonesia, Nigeria, United Republic of Tanzania: the degree of importance, which data refer to, is not
identified.
37 UIS Information Paper Nº37 | 2017
Data are population estimates, except for the following countries that submitted survey data: Argentina, Costa Rica, Cuba, Ghana, India, Indonesia, Kenya, Malaysia, Morocco, Nigeria, Panama, Philippines and United Republic of Tanzania. Use of survey data in comparisons is not recommended. Eurostat countries (Community Innovation Survey 2012, 2010-2012): Austria, Belgium, Bulgaria, Croatia, Cyprus, Czechia, Denmark, Estonia, Finland, France, Germany, Greece, Hungary, Iceland, Ireland, Italy, Latvia, Lithuania, Luxembourg, Malta, Netherlands, Norway, Poland, Portugal, Romania, Serbia, Slovakia, Slovenia, Spain, Sweden, Turkey, United Kingdom of Great Britain and Northern Ireland. Metadata information is available at: http://ec.europa.eu/eurostat/cache/metadata/en/inn_cis8_esms.htm
38 UIS Information Paper Nº37 | 2017
Annex II. Methodological procedures of the national innovation surveys
Table A1. Basic methodological procedures of the national innovation surveys for high-income countries
Observation
period Statistical unit Sampling frame Cut-off point criterion/criteria Survey method Type of data Other remarks
Australia 2012-2013 Kind of activity unit (KAU)
National statistical business register
Number of employees Sample survey
Grossed up data (population estimates)
Occasional differences in some indicators may be
due to independent rounding
Canada 2010-2012 Enterprise National statistical business register
Number of employees and
revenues Sample survey
Grossed up data (population estimates)
:
Chile 2011-2012 Enterprise
National statistical business register,
ad hoc lists, census directory of enterprises
Turnover Sample survey Grossed up data
(population estimates)
ISIC Rev. 3.1 D32 and D37 are not
covered
China, Hong Kong Special Administrative Region
2013 Kind of activity unit (KAU)
National statistical business register, alternative admin/
commercial sources, ad hoc lists
Number of employees Sample survey
Grossed up data (population estimates)
:
Israel 2010-2012 Establishment National statistical business register
Number of employees Sample survey
Grossed up data (population estimates)
Percentage of manufacturing firms
that cooperated with consultants,
commercial laboratories or private R&D
institutes does not cover private R&D
institutes
Japan 2009-2011 Enterprise National statistical business register
Number of employees Sample survey
Grossed up data (population estimates)
ISIC Rev. 4 C12 is not covered
New Zealand 2011/12-2012/13 Enterprise National statistical business register
Number of employees and
turnover Sample survey
Grossed up data (population estimates)
Occasional differences in some indicators may be
due to independent rounding

39 UIS Information Paper Nº37 | 2017
Observation
period Statistical unit Sampling frame Cut-off point criterion/criteria Survey method Type of data Other remarks
Republic of Korea 2011-2013 Enterprise National statistical
business register Number of employees Sample survey
Grossed up data (population estimates)
ISIC Rev. 4 C12 is not covered; ISIC
Rev. 4 C33 is dispersed into a couple of other
categories; Occasional
differences in some indicators may be
due to independent rounding
United States of America 2009-2011 Enterprise group National statistical
business register Number of employees Sample survey
Grossed up data (population estimates)
:
Uruguay 2010-2012 Enterprise
National statistical business register,
alternative administrative/com
mercial sources
Number of employees Sample survey
Grossed up data (population estimates)
:
Notes: ":" Not available. For information on Eurostat countries please visit the Community Innovation Survey database at http://ec.europa.eu/eurostat/data/database. Source: 2015 UIS innovation data collection

40 UIS Information Paper Nº37 | 2017
Table A2. Basic methodological procedures of the national innovation surveys for low- and middle-income countries
Observation
period Statistical unit Sampling frame Cut-off point criterion/criteria Survey method Type of data Other remarks
Argentina 2008 Enterprise National statistical business register Turnover Sample survey
Survey data (use in comparisons is not
recommended)
ISIC Rev. 3.1 D37 is not covered;
Occasional differences in some indicators may be
due to independent rounding
Azerbaijan 2014 Enterprise National statistical business register
Number of employees and
turnover Census Survey data Data cover only
large enterprises
Belarus 2014 Enterprise National statistical business register
Number of employees Census Survey data :
Brazil 2009-2011 Enterprise National statistical business register
Number of employees
Combined (Sample survey: firms with 10-499 employees; Census: firms with
500 or more employees)
Grossed up data (population estimates)
Occasional differences in some indicators may be
due to independent rounding; Cut off point: at least 10
employees
China 2013-2014 Enterprise National statistical business register
Number of employees and
turnover
Combined (Census: mining,
manufacturing, electricity and construction
enterprises; Sample survey: service
enterprises)
Grossed up data (population estimates)
:
Colombia 2011-2012 Enterprise National statistical business register
Number of employees Census Survey data ISIC Rev. 3.1 D37
is not covered
Costa Rica 2010-2011 Enterprise National statistical business register
Number of employees Sample survey
Survey data (use in comparisons is not
recommended) :
Cuba 2003-2005 Enterprise National statistical business register
Number of employees Sample survey
Survey data (use in comparisons is not
recommended) Data cover only large enterprises
Ecuador 2009-2011 Enterprise National statistical business register
Number of employees and
turnover Sample survey
Grossed up data (population estimates)
:
Egypt 2012-2014 Enterprise
A random sample of enterprises was
selected by using the Egypt Economic
Census
Number of employees Sample survey
Grossed up data (population estimates)
ISIC Rev. 4 C12 is not covered

41 UIS Information Paper Nº37 | 2017
Observation
period Statistical unit Sampling frame Cut-off point criterion/criteria Survey method Type of data Other remarks
El Salvador 2010-2012 Enterprise
National statistical business register,
alternative admin/commercial sources and ad hoc
lists
Number of employees and
turnover Sample survey
Grossed up data (population estimates)
ISIC Rev. 4 C12 and C33 are not
covered
Ethiopia 2012-2014 Enterprise group and Enterprise
List of observation units from Central Statistics Agency,
Ministry of Industry, Ministry of Trade, and Federal Micro
and Small Enterprises
Development Agency
Number of employees
Combined (Sample survey: small and
medium-sized enterprises;
Census: large enterprises)
Grossed up data (population estimates)
:
Ghana 2008-2010 Enterprise
List of registered enterprises of the
Association of Ghana Industries
(AGI) and list of the Ghana Chamber of
Commerce
Number of employees Sample survey
Survey data (use in comparisons is not
recommended)
Industries covered: Material
engineering, Other engineering and
technologies, Economic and business, Basic medicine, Media
and communication, Environmental
engineering, etc.; Source: AU/NEPAD
India 2007/08-2009/10 Enterprise National statistical business register
Number of employees Sample survey
Survey data (use in comparisons is not
recommended) :
Indonesia 2009-2010 Establishment National statistical business register
Number of employees Sample survey
Survey data (use in comparisons is not
recommended)
Data cover only medium-sized and large enterprises
Kazakhstan 2014 Enterprise National statistical business register
Number of employees
Combined (Sample survey: small enterprises;
Census: medium-sized and large
enterprises)
Grossed up data (population estimates)
:
Kenya 2012-2014 Enterprise National statistical business register
Number of employees Sample survey
Survey data (use in comparisons is not
recommended)
Occasional differences in some indicators may be
due to independent rounding
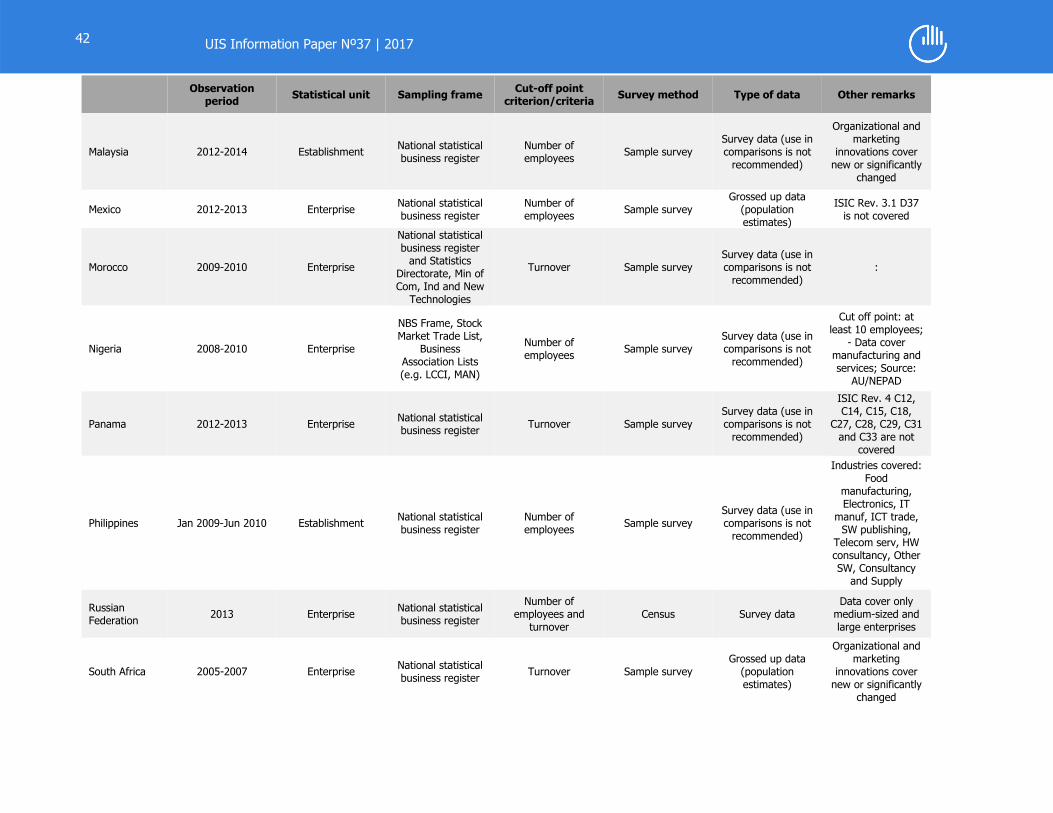
42 UIS Information Paper Nº37 | 2017
Observation period Statistical unit Sampling frame Cut-off point
criterion/criteria Survey method Type of data Other remarks
Malaysia 2012-2014 Establishment National statistical business register
Number of employees Sample survey
Survey data (use in comparisons is not
recommended)
Organizational and marketing
innovations cover new or significantly
changed
Mexico 2012-2013 Enterprise National statistical business register
Number of employees Sample survey
Grossed up data (population estimates)
ISIC Rev. 3.1 D37 is not covered
Morocco 2009-2010 Enterprise
National statistical business register
and Statistics Directorate, Min of Com, Ind and New
Technologies
Turnover Sample survey Survey data (use in comparisons is not
recommended) :
Nigeria 2008-2010 Enterprise
NBS Frame, Stock Market Trade List,
Business Association Lists (e.g. LCCI, MAN)
Number of employees Sample survey
Survey data (use in comparisons is not
recommended)
Cut off point: at least 10 employees;
- Data cover manufacturing and services; Source:
AU/NEPAD
Panama 2012-2013 Enterprise National statistical business register Turnover Sample survey
Survey data (use in comparisons is not
recommended)
ISIC Rev. 4 C12, C14, C15, C18,
C27, C28, C29, C31 and C33 are not
covered
Philippines Jan 2009-Jun 2010 Establishment National statistical business register
Number of employees Sample survey
Survey data (use in comparisons is not
recommended)
Industries covered: Food
manufacturing, Electronics, IT
manuf, ICT trade, SW publishing,
Telecom serv, HW consultancy, Other SW, Consultancy
and Supply
Russian Federation 2013 Enterprise National statistical
business register
Number of employees and
turnover Census Survey data
Data cover only medium-sized and large enterprises
South Africa 2005-2007 Enterprise National statistical business register Turnover Sample survey
Grossed up data (population estimates)
Organizational and marketing
innovations cover new or significantly
changed

43 UIS Information Paper Nº37 | 2017
Observation period Statistical unit Sampling frame Cut-off point
criterion/criteria Survey method Type of data Other remarks
The former Yugoslav Republic of Macedonia
2010-2012 Enterprise National statistical business register
Number of employees
Combined (Sample survey: small enterprises;
Census: large and medium-sized enterprises)
Grossed up data (population estimates)
:
Uganda 2008-2010 Enterprise National statistical business register
Number of employees and
turnover Sample survey
Grossed up data (population estimates)
Cut off point: at least 5 employees and turnover of at
least 10 million Shillings; Data cover mining,
manufacturing and services; Source:
AU/NEPAD
Ukraine 2012-2014 Enterprise National statistical business register
Number of employees Census Survey data
Occasional differences in some indicators may be
due to independent rounding
United Republic of Tanzania
2008-2010 Enterprise : Number of employees Sample survey
Survey data (use in comparisons is not
recommended)
Cut off point: at least 5 employees; Industrial coverage:
manufacturing, processing, engineering, services and
printing; Source: AU/NEPAD
Notes: ":" Not available. For information on Eurostat countries please visit the Community Innovation Survey database at http://ec.europa.eu/eurostat/data/database. Source: 2015 UIS innovation data collection

44 UIS Information Paper Nº37 | 2017
Table A3. Size classes for high-income countries
Micro firms Small firms Medium-sized firms Large firms
Australia 0-4 employees 5-19 employees 20-199 employees 200 or more employees
Canada Not covered 20-99 employees and revenues of at least $250,000 Canadian dollars
(CAD) 100-249 employees and revenues
of at least CAD $250,000 250 employees or more and
revenues of at least CAD $250,000
Chile Not covered 2,400.1-25,000.0 Chilean Pesos (CP) 25,000.1-100,000.0 CP 100,000.1 CP or more
China, Hong Kong Special Administrative Region
Not applicable 0-9 employees 10-99 employees 100 or more employees
Israel Not covered 10-49 employees 50-249 employees 250 or more employees
Japan Not covered 10-49 employees 50-249 employees 250 or more employees
New Zealand 6-19 employees and a turnover of at least 30,000 NZ dollars
20-49 employees and a turnover of at least 30,000 NZ dollars
50-99 employees and a turnover of at least 30,000 NZ dollars
100 or more employees and a turnover of at least 30,000 NZ
dollars
Republic of Korea 10-49 employees 50-99 employees 100-299 employees 300 or more employees
United States of America Not covered 5-499 employees 500-24,999 employees 25,000 or more employees
Uruguay Not covered 5-19 employees 20-99 employees 100 or more employees
Notes: For information on Eurostat countries please visit the Community Innovation Survey database at http://ec.europa.eu/eurostat/data/database. Source: 2015 UIS innovation data collection
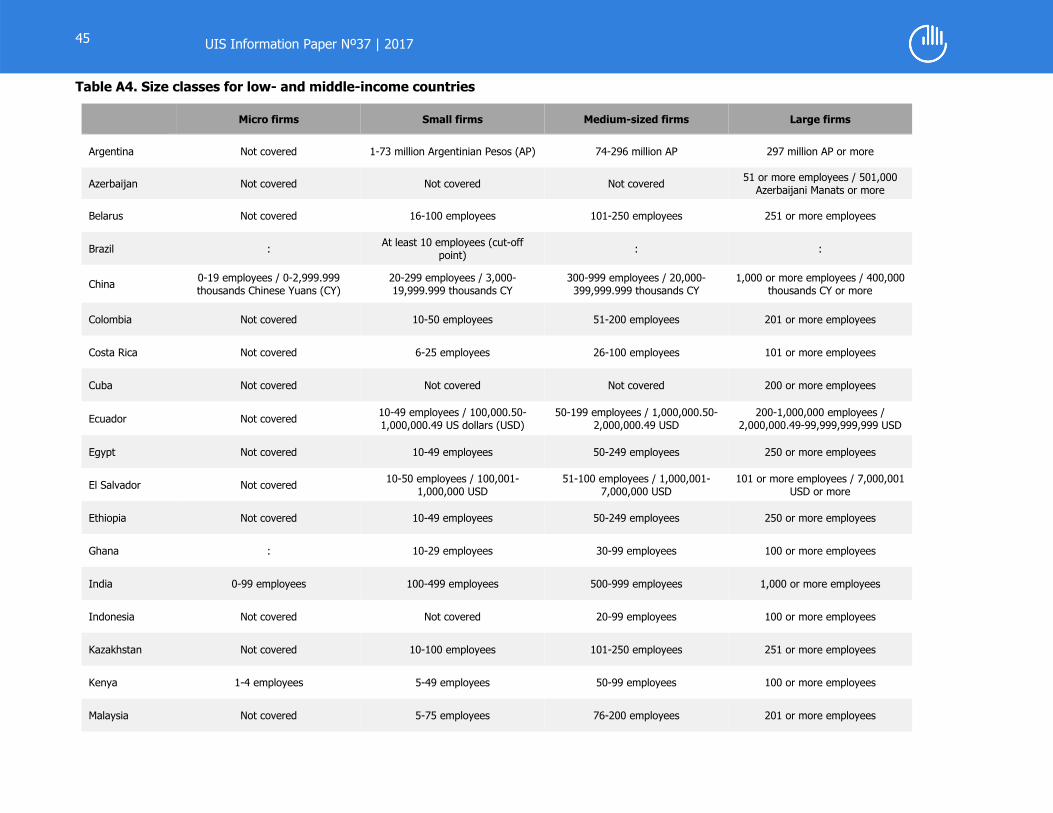
45 UIS Information Paper Nº37 | 2017
Table A4. Size classes for low- and middle-income countries
Micro firms Small firms Medium-sized firms Large firms
Argentina Not covered 1-73 million Argentinian Pesos (AP) 74-296 million AP 297 million AP or more
Azerbaijan Not covered Not covered Not covered 51 or more employees / 501,000 Azerbaijani Manats or more
Belarus Not covered 16-100 employees 101-250 employees 251 or more employees
Brazil : At least 10 employees (cut-off point) : :
China 0-19 employees / 0-2,999.999 thousands Chinese Yuans (CY)
20-299 employees / 3,000-19,999.999 thousands CY
300-999 employees / 20,000-399,999.999 thousands CY
1,000 or more employees / 400,000 thousands CY or more
Colombia Not covered 10-50 employees 51-200 employees 201 or more employees
Costa Rica Not covered 6-25 employees 26-100 employees 101 or more employees
Cuba Not covered Not covered Not covered 200 or more employees
Ecuador Not covered 10-49 employees / 100,000.50-1,000,000.49 US dollars (USD)
50-199 employees / 1,000,000.50-2,000,000.49 USD
200-1,000,000 employees / 2,000,000.49-99,999,999,999 USD
Egypt Not covered 10-49 employees 50-249 employees 250 or more employees
El Salvador Not covered 10-50 employees / 100,001-1,000,000 USD
51-100 employees / 1,000,001-7,000,000 USD
101 or more employees / 7,000,001 USD or more
Ethiopia Not covered 10-49 employees 50-249 employees 250 or more employees
Ghana : 10-29 employees 30-99 employees 100 or more employees
India 0-99 employees 100-499 employees 500-999 employees 1,000 or more employees
Indonesia Not covered Not covered 20-99 employees 100 or more employees
Kazakhstan Not covered 10-100 employees 101-250 employees 251 or more employees
Kenya 1-4 employees 5-49 employees 50-99 employees 100 or more employees
Malaysia Not covered 5-75 employees 76-200 employees 201 or more employees

46 UIS Information Paper Nº37 | 2017
Micro firms Small firms Medium-sized firms Large firms
Mexico Not covered 20-50 employees 51-250 employees 251 or more employees
Morocco 1-3 million Dirhams 3-10 million Dirhams 10-175 million Dirhams More than 175 million Dirhams
Nigeria : At least 10 employees (cut-off point) : :
Panama 0-150,000 US Dollars 150,001-1,000,000 US Dollars 1,000,001-2,500,000 US Dollars 2,500,001 US Dollars or more
Philippines 1-9 employees 10-99 employees 100-199 employees 200 or more employees
Russian Federation Not covered Not covered 101-250 employees /
401-1,000 million Roubles 251 or more employees / More
than 1,000 million Roubles
South Africa Less than 5 million South African Rands (ZAR) 5-13 million ZAR 13-51 million ZAR More than 51 million ZAR
The former Yugoslav Republic of Macedonia
Not covered 10-49 employees 50-249 employees 250 or more employees
Uganda : At least 10 employees and a turnover of at least 10 million
Shillings (cut-off point) : :
Ukraine Not covered 10-49 employees 50-249 employees 250 or more employees
United Republic of Tanzania : At least 5 employees (cut-off point) : :
Notes: ":" Not available. For information on Eurostat countries please visit the Community Innovation Survey database at http://ec.europa.eu/eurostat/data/database. Source: 2015 UIS innovation data collection

47 UIS Information Paper Nº37 | 2017
Annex III. Basic innovation indicators 1. Percentage of product innovators in manufacturing
(N) = Number of manufacturing firms that implemented product innovation *100
(D) = Total number of manufacturing firms
2. Percentage of process innovators in manufacturing
(N) = Number of manufacturing firms that implemented process innovation *100
(D) = Total number of manufacturing firms
3. Percentage of innovative firms in manufacturing by size class
(N) = Number of manufacturing firms that implemented product or process innovation (in each size class)
*100(D) = Total number of manufacturing firms (in each size class)
4. Percentage of innovation-active firms in manufacturing
(N) = Number of manufacturing firms that implemented or had abandoned or ongoing innovation activities for product or process innovation, regardless of organizational or marketing innovation
*100
(D) = Total number of manufacturing firms

48 UIS Information Paper Nº37 | 2017
5. Percentage of non-innovative firms in manufacturing
(N) = Number of manufacturing firms that did not implement nor have abandoned or ongoing innovation activities for product or process innovation, regardless of organizational or marketing innovation
*100
(D) = Total number of manufacturing firms
6. Percentage of manufacturing firms with only abandoned or ongoing innovation activities
(N) = Number of manufacturing firms with only abandoned or ongoing innovation activities for product or process innovation, regardless of organizational or marketing innovation
*100
(D) = Total number of manufacturing firms
7. Percentage of manufacturing firms that engaged in innovation activities
(N) = Number of innovation-active manufacturing firms that engaged in a specific innovation activity *100
(D) = Total number of innovation-active manufacturing firms
8. Percentage of manufacturing firms for which sources of information were highly important
(N) = Number of innovation-active manufacturing firms for which a specific source of information was highly important
*100(D) = Total number of innovation-active manufacturing firms

49 UIS Information Paper Nº37 | 2017
9. Percentage of manufacturing firms that cooperated with partners
(N) = Number of innovation-active manufacturing firms that cooperated with a specific partner *100
(D) = Total number of innovation-active manufacturing firms
10. Percentage of innovation-active manufacturing firms for which hampering factors were highly important
(N) = Number of innovation-active manufacturing firms for which a specific hampering factor was highly important
*100(D) = Total number of innovation-active manufacturing firms
11. Percentage of non-innovative manufacturing firms for which hampering factors were highly important
(N) = Number of non-innovative manufacturing firms for which a specific hampering factor was highly important
*100(D) = Total number of non-innovative manufacturing firms
12. Percentage of organizational innovators in manufacturing
(N) = Number of manufacturing firms that implemented organizational innovation
*100(D) = Total number of manufacturing firms
13. Percentage of marketing innovators in manufacturing
(N) = Number of manufacturing firms that implemented marketing innovation *100
(D) = Total number of manufacturing firms

50 UIS Information Paper Nº37 | 2017
Annex IV. Statistical tables Table A5. Innovators in high-income countries (as a percentage of manufacturing firms)
Product innovators
Process innovators
Organizational innovators
Marketing innovators
Australia 31.5 23.9 21.1 22.2 Austria 29.4 33.2 33.2 29.0 Belgium 36.1 36.9 31.9 24.2 Canada 46.0 48.0 46.9 32.8 Chile 19.3 22.8 18.4 17.1 China, Hong Kong SAR 0.6 0.5 2.0 5.9 Croatia 19.3 20.4 22.8 23.7 Cyprus 23.7 28.6 19.9 29.0 Czechia 30.0 26.6 21.6 24.4 Denmark 26.1 25.0 33.3 30.1 Estonia 23.8 27.4 20.3 21.3 Finland 36.5 35.1 29.2 28.1 France 28.3 27.9 34.0 23.8 Germany 43.8 31.0 34.4 35.2 Greece 20.8 27.3 29.2 38.2 Hungary 11.5 9.3 14.7 19.3 Iceland 40.6 36.1 31.3 26.0 Ireland 35.2 33.4 25.9 38.7 Israel 24.1 23.8 35.5 36.2 Italy 32.0 35.0 32.4 31.5 Japan 19.6 20.2 28.8 22.9 Latvia 13.9 14.1 12.4 16.9 Lithuania 14.4 14.9 13.9 21.9 Luxembourg 32.8 42.1 46.9 36.3 Malta 28.6 36.9 34.9 34.9 Netherlands 36.9 28.5 28.9 22.0 New Zealand 31.6 23.2 25.6 25.2 Norway 22.0 14.2 22.7 23.3 Poland 11.9 12.3 10.3 10.6 Portugal 24.9 32.6 27.1 27.9 Republic of Korea 17.1 7.4 16.4 12.1 Slovakia 15.5 13.6 17.5 17.2 Slovenia : : 28.1 30.1 Spain 13.8 18.6 19.5 14.4 Sweden 31.4 28.8 23.4 27.7 United Kingdom of Great Britain and Northern Ireland
28.4 17.2 35.8 14.4
United States of America 21.7 20.6 : : Uruguay 13.0 15.8 8.0 5.0
Notes: ":" Not available. Source: 2015 UIS innovation data collection and Eurostat

51 UIS Information Paper Nº37 | 2017
Table A6. Innovators in low- and middle-income countries (as a percentage of manufacturing firms)
Product innovators
Process innovators
Organizational innovators
Marketing innovators
Argentina 28.4 29.6 12.7 8.4 Azerbaijan 1.1 1.4 : : Belarus 19.1 7.0 2.8 4.7 Brazil 17.5 32.0 57.8 42.9 Bulgaria 14.6 11.1 12.0 14.4 China 26.1 26.1 30.7 29.1 Colombia 11.9 12.4 6.5 5.4 Costa Rica 67.5 62.1 40.4 43.0 Cuba 44.0 48.4 64.8 23.2 Ecuador 45.8 47.1 21.0 29.0 Egypt 25.9 33.4 20.6 25.5 El Salvador 23.3 18.9 9.6 10.7 Ethiopia 29.2 36.7 41.1 55.4 India 12.1 12.1 38.0 35.5 Indonesia 20.2 18.1 39.0 55.0 Kazakhstan 8.0 6.6 2.7 3.0 Kenya 47.2 52.8 66.5 67.0 Malaysia 47.3 56.8 40.2 46.0 Mexico 6.3 3.9 2.4 1.3 Nigeria 50.1 58.6 : : Panama 13.7 34.7 45.3 48.4 Philippines 37.6 43.9 57.8 50.4 Romania 3.9 5.6 15.6 15.3 Russian Federation 8.0 6.5 3.7 3.0 Serbia 30.4 24.8 35.6 33.9 South Africa 16.8 13.1 52.6 23.3 TFYR of Macedonia 15.6 22.7 28.2 21.5 Turkey 19.5 22.2 31.5 38.1 Uganda 61.1 63.1 : : Ukraine 9.3 10.5 4.8 8.2 UR Tanzania 61.3 27.0 : :
Notes: ":" Not available. Source: 2015 UIS innovation data collection, Eurostat and AU/NEPAD

52 UIS Information Paper Nº37 | 2017
Table A7. Innovation-active and innovative firms in high-income countries (as a percentage of manufacturing firms)
Innovation-active firms
Innovative firms
Australia 45.2 39.0 Austria 43.9 41.6 Belgium 53.4 50.0 China, Hong Kong SAR 4.3 0.8 Croatia 27.9 26.0 Cyprus 31.4 31.4 Czechia 40.4 37.6 Denmark 41.5 38.0 Estonia 43.3 39.7 Finland 52.3 48.8 France 42.7 39.1 Germany 63.3 52.1 Greece 35.5 32.2 Hungary 17.6 15.1 Iceland 50.7 50.7 Ireland 52.4 46.1 Israel 36.6 33.0 Italy 45.9 43.6 Japan 33.0 28.5 Latvia 20.9 19.6 Lithuania 21.2 19.7 Luxembourg 56.3 52.1 Malta 43.2 41.5 Netherlands 50.3 46.5 New Zealand 49.4 41.7 Norway 35.0 27.0 Poland 17.8 16.6 Portugal 39.8 37.6 Republic of Korea 25.3 19.4 Slovakia 20.3 19.5 Spain 28.5 24.1 Sweden 49.3 44.1 United Kingdom of Great Britain and Northern Ireland 39.3 33.6
Source: 2015 UIS innovation data collection and Eurostat

53 UIS Information Paper Nº37 | 2017
Table A8. Innovation-active and innovative firms in low- and middle-income countries (as a percentage of manufacturing firms)
Innovation-active firms
Innovative firms
Brazil 38.2 35.9 Bulgaria 22.1 18.9 China 35.4 32.3 Colombia 24.7 19.2 Cuba 94.0 81.2 Ecuador 62.7 58.6 Egypt 36.7 35.5 Ethiopia 46.0 44.0 India 35.6 18.5 Malaysia 68.9 64.0 Mexico 9.8 6.8 Panama 48.4 36.8 Philippines 54.4 50.2 Romania 7.6 7.0 Serbia 35.9 34.9 TFYR of Macedonia 27.5 26.4 Turkey 29.8 26.9 Ukraine 14.7 13.6
Source: 2015 UIS innovation data collection and Eurostat

54 UIS Information Paper Nº37 | 2017
Table A9. Innovative firms in high-income countries by size class (as a percentage of manufacturing firms in each size class)
Small Medium-sized Large
Australia 47.5 52.4 72.5 Austria 30.6 63.9 86.1 Belgium 44.1 62.1 75.8 Canada 73.6 78.7 80.4 Chile 13.7 30.3 43.4 China, Hong Kong SAR 0.4 1.4 8.3 Croatia 20.5 36.9 69.3 Cyprus 29.9 44.6 37.5 Czechia 29.7 50.3 75.0 Denmark 31.4 51.1 84.7 Estonia 32.0 57.1 71.2 Finland 43.6 56.4 83.5 France 32.1 58.0 78.9 Germany 45.9 63.0 82.3 Greece 30.6 39.9 58.0 Hungary 9.5 25.7 51.9 Iceland 44.7 67.1 78.3 Ireland 37.5 64.5 78.6 Israel 23.9 52.7 75.0 Italy 39.9 64.7 80.7 Japan 24.1 38.0 56.3 Latvia 14.8 31.5 47.3 Lithuania 13.6 30.2 58.8 Luxembourg 47.1 52.4 92.0 Malta 32.6 61.2 85.7 New Zealand 43.5 54.5 58.6 Norway 21.7 40.7 61.7 Poland 9.7 30.4 56.8 Portugal 32.8 53.2 83.2 Republic of Korea 26.0 31.2 54.6 Slovakia 12.8 27.4 47.8 Spain 18.5 49.1 75.4 Sweden 39.5 56.5 70.6 United Kingdom of Great Britain and Northern Ireland 30.0 43.3 50.0 Uruguay 12.7 33.5 52.8
Source: 2015 UIS innovation data collection and Eurostat
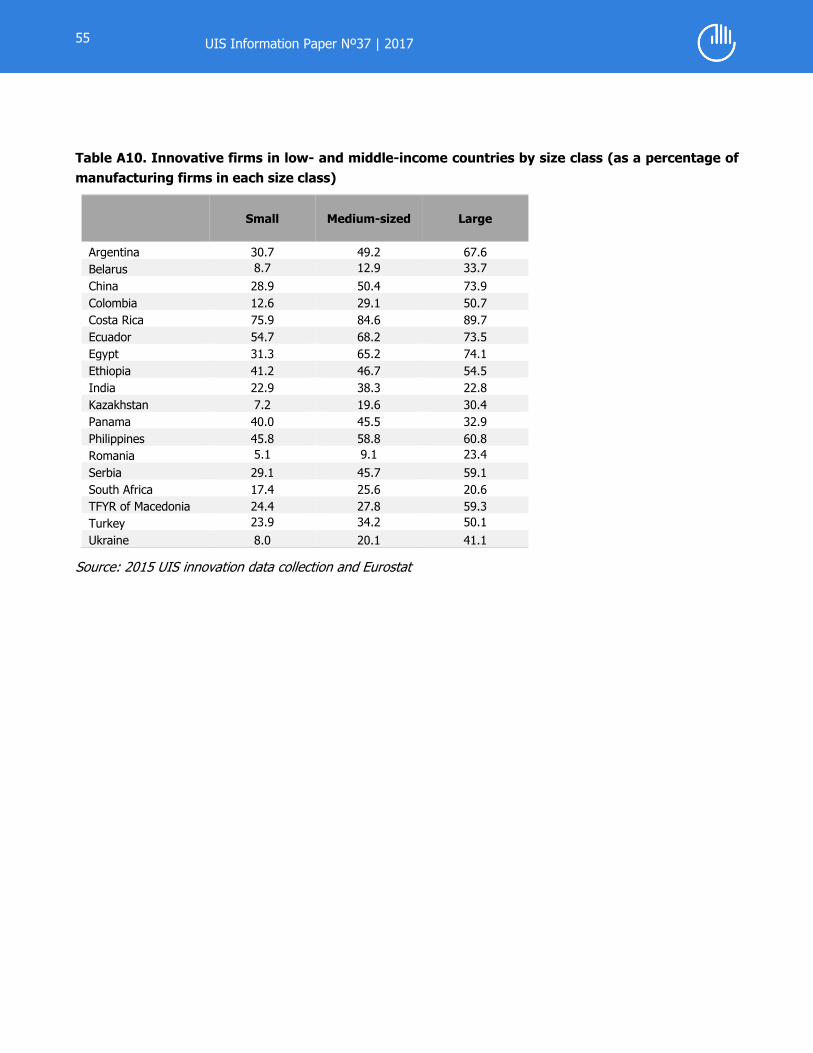
55 UIS Information Paper Nº37 | 2017
Table A10. Innovative firms in low- and middle-income countries by size class (as a percentage of manufacturing firms in each size class)
Small Medium-sized Large
Argentina 30.7 49.2 67.6 Belarus 8.7 12.9 33.7 China 28.9 50.4 73.9 Colombia 12.6 29.1 50.7 Costa Rica 75.9 84.6 89.7 Ecuador 54.7 68.2 73.5 Egypt 31.3 65.2 74.1 Ethiopia 41.2 46.7 54.5 India 22.9 38.3 22.8 Kazakhstan 7.2 19.6 30.4 Panama 40.0 45.5 32.9 Philippines 45.8 58.8 60.8 Romania 5.1 9.1 23.4 Serbia 29.1 45.7 59.1 South Africa 17.4 25.6 20.6 TFYR of Macedonia 24.4 27.8 59.3 Turkey 23.9 34.2 50.1 Ukraine 8.0 20.1 41.1
Source: 2015 UIS innovation data collection and Eurostat