summary of illegal immigration data - defend colorado no · pages 9 through 16 (summary of illegal...
TRANSCRIPT
A Compendium of Illegal Immigration Data
Presented by
Defend Colorado Now
March 28, 2006
www.DefendColoradoNow.org
A Compendium of Illegal Immigration Data
Donald Rice
March 28, 2006
Author’s Note: The purpose of this paper is to briefly summarize and update data concerning illegal immigration from a variety of reputable sources. In this regard:
Page 2 (Colorado Illegal Immigration Fact Sheet) briefly summarizes information for the State of Colorado
Pages 3 and 4 (United States Illegal Immigration Fact Sheet) summarize information for the country as a whole
Pages 5 and 6 (Other State and Local Government Illegal Immigration Fact Sheet) summarize information for a array of state and local governments
Page 7 lists all sources of data utilized in this paper
Page 8 provides calculation methodologies concerning the cost of illegal aliens on Colorado taxpayers
Pages 9 through 16 (Summary of Illegal Immigration Data) provide a more complete listing of facts relating to illegal immigration, which is summarized by source
Page 17 provides a critique of the Bell Policy Center’s December 29, 2005 immigration paper
It should be emphasized that this document does not contain any original research, but instead serves to collect pertinent data on illegal immigration that may be relevant to those interested in policy issues surrounding this subject. In this regard, it is hoped that the information contained herein will be of use to all concerned who may have a need for updated illegal immigration information, without having to dissect the 27 sources utilized in preparing this report.
-1-
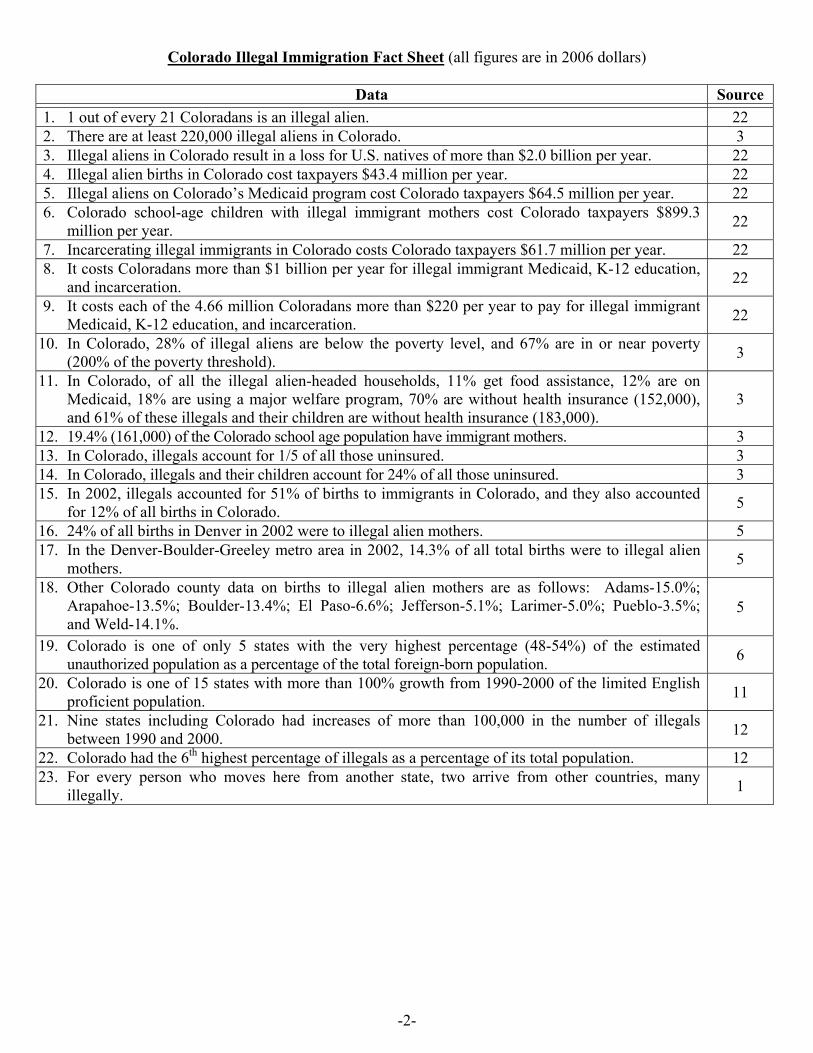
Colorado Illegal Immigration Fact Sheet (all figures are in 2006 dollars)
Data Source
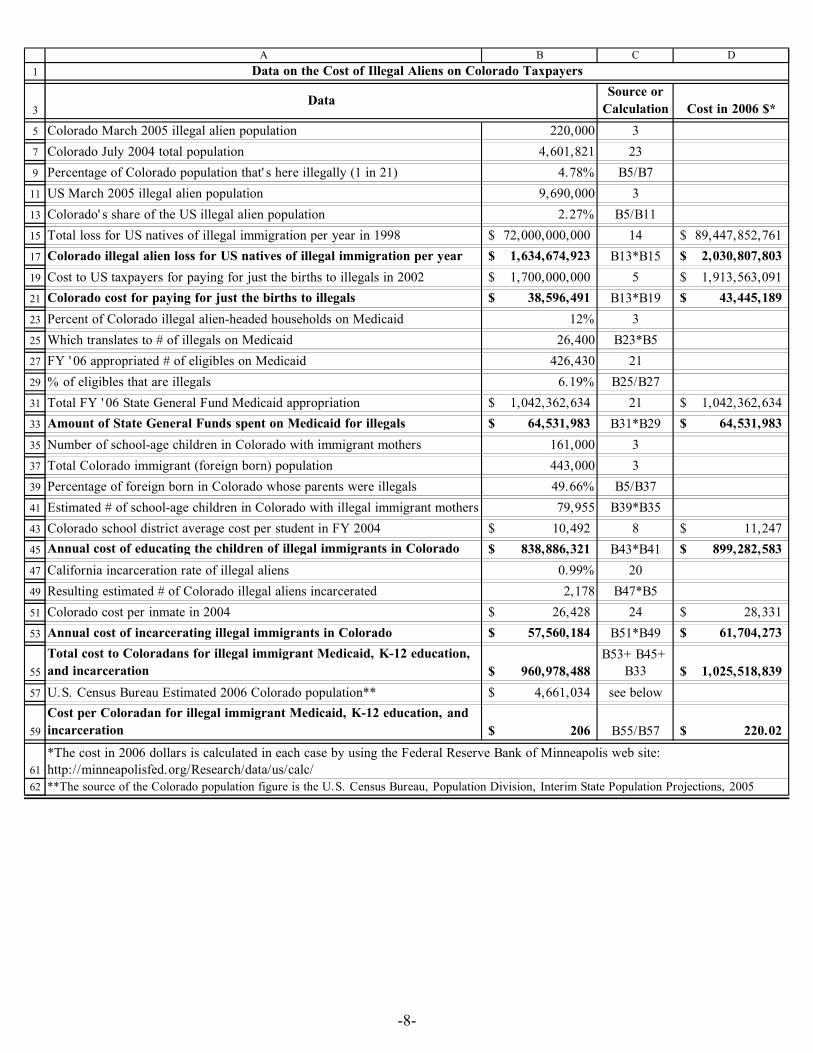
1. 1 out of every 21 Coloradans is an illegal alien. 22 2. There are at least 220,000 illegal aliens in Colorado. 3 3. Illegal aliens in Colorado result in a loss for U.S. natives of more than $2.0 billion per year. 22 4. Illegal alien births in Colorado cost taxpayers $43.4 million per year. 22 5. Illegal aliens on Colorado’s Medicaid program cost Colorado taxpayers $64.5 million per year. 22 6. Colorado school-age children with illegal immigrant mothers cost Colorado taxpayers $899.3
million per year. 22
7. Incarcerating illegal immigrants in Colorado costs Colorado taxpayers $61.7 million per year. 22 8. It costs Coloradans more than $1 billion per year for illegal immigrant Medicaid, K-12 education,
and incarceration. 22
9. It costs each of the 4.66 million Coloradans more than $220 per year to pay for illegal immigrant Medicaid, K-12 education, and incarceration. 22
10. In Colorado, 28% of illegal aliens are below the poverty level, and 67% are in or near poverty (200% of the poverty threshold). 3
11. In Colorado, of all the illegal alien-headed households, 11% get food assistance, 12% are on Medicaid, 18% are using a major welfare program, 70% are without health insurance (152,000), and 61% of these illegals and their children are without health insurance (183,000).
3
12. 19.4% (161,000) of the Colorado school age population have immigrant mothers. 3 13. In Colorado, illegals account for 1/5 of all those uninsured. 3 14. In Colorado, illegals and their children account for 24% of all those uninsured. 3 15. In 2002, illegals accounted for 51% of births to immigrants in Colorado, and they also accounted
for 12% of all births in Colorado. 5
16. 24% of all births in Denver in 2002 were to illegal alien mothers. 5 17. In the Denver-Boulder-Greeley metro area in 2002, 14.3% of all total births were to illegal alien
mothers. 5
18. Other Colorado county data on births to illegal alien mothers are as follows: Adams-15.0%; Arapahoe-13.5%; Boulder-13.4%; El Paso-6.6%; Jefferson-5.1%; Larimer-5.0%; Pueblo-3.5%; and Weld-14.1%.
5
19. Colorado is one of only 5 states with the very highest percentage (48-54%) of the estimated unauthorized population as a percentage of the total foreign-born population. 6
20. Colorado is one of 15 states with more than 100% growth from 1990-2000 of the limited English proficient population. 11
21. Nine states including Colorado had increases of more than 100,000 in the number of illegals between 1990 and 2000. 12
22. Colorado had the 6th highest percentage of illegals as a percentage of its total population. 12 23. For every person who moves here from another state, two arrive from other countries, many
illegally. 1
-2-
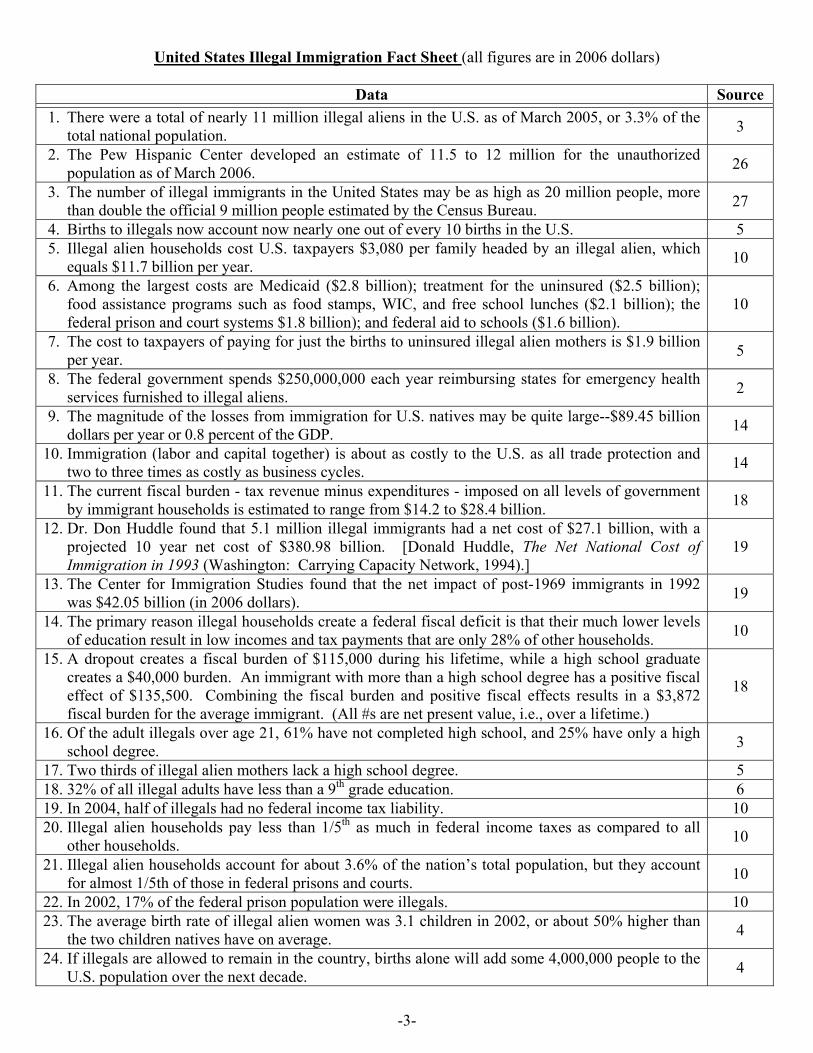
United States Illegal Immigration Fact Sheet (all figures are in 2006 dollars)
Data Source
1. There were a total of nearly 11 million illegal aliens in the U.S. as of March 2005, or 3.3% of the total national population. 3
2. The Pew Hispanic Center developed an estimate of 11.5 to 12 million for the unauthorized population as of March 2006. 26
3. The number of illegal immigrants in the United States may be as high as 20 million people, more than double the official 9 million people estimated by the Census Bureau. 27
4. Births to illegals now account now nearly one out of every 10 births in the U.S. 5 5. Illegal alien households cost U.S. taxpayers $3,080 per family headed by an illegal alien, which
equals $11.7 billion per year. 10
6. Among the largest costs are Medicaid ($2.8 billion); treatment for the uninsured ($2.5 billion); food assistance programs such as food stamps, WIC, and free school lunches ($2.1 billion); the federal prison and court systems $1.8 billion); and federal aid to schools ($1.6 billion).
10
7. The cost to taxpayers of paying for just the births to uninsured illegal alien mothers is $1.9 billion per year. 5
8. The federal government spends $250,000,000 each year reimbursing states for emergency health services furnished to illegal aliens. 2
9. The magnitude of the losses from immigration for U.S. natives may be quite large--$89.45 billion dollars per year or 0.8 percent of the GDP. 14
10. Immigration (labor and capital together) is about as costly to the U.S. as all trade protection and two to three times as costly as business cycles. 14
11. The current fiscal burden - tax revenue minus expenditures - imposed on all levels of government by immigrant households is estimated to range from $14.2 to $28.4 billion. 18
12. Dr. Don Huddle found that 5.1 million illegal immigrants had a net cost of $27.1 billion, with a projected 10 year net cost of $380.98 billion. [Donald Huddle, The Net National Cost of Immigration in 1993 (Washington: Carrying Capacity Network, 1994).]
19
13. The Center for Immigration Studies found that the net impact of post-1969 immigrants in 1992 was $42.05 billion (in 2006 dollars). 19
14. The primary reason illegal households create a federal fiscal deficit is that their much lower levels of education result in low incomes and tax payments that are only 28% of other households. 10
15. A dropout creates a fiscal burden of $115,000 during his lifetime, while a high school graduate creates a $40,000 burden. An immigrant with more than a high school degree has a positive fiscal effect of $135,500. Combining the fiscal burden and positive fiscal effects results in a $3,872 fiscal burden for the average immigrant. (All #s are net present value, i.e., over a lifetime.)
18
16. Of the adult illegals over age 21, 61% have not completed high school, and 25% have only a high school degree. 3
17. Two thirds of illegal alien mothers lack a high school degree. 5 18. 32% of all illegal adults have less than a 9th grade education. 6 19. In 2004, half of illegals had no federal income tax liability. 10 20. Illegal alien households pay less than 1/5th as much in federal income taxes as compared to all
other households. 10
21. Illegal alien households account for about 3.6% of the nation’s total population, but they account for almost 1/5th of those in federal prisons and courts. 10
22. In 2002, 17% of the federal prison population were illegals. 10 23. The average birth rate of illegal alien women was 3.1 children in 2002, or about 50% higher than
the two children natives have on average. 4
24. If illegals are allowed to remain in the country, births alone will add some 4,000,000 people to the U.S. population over the next decade. 4
-3-
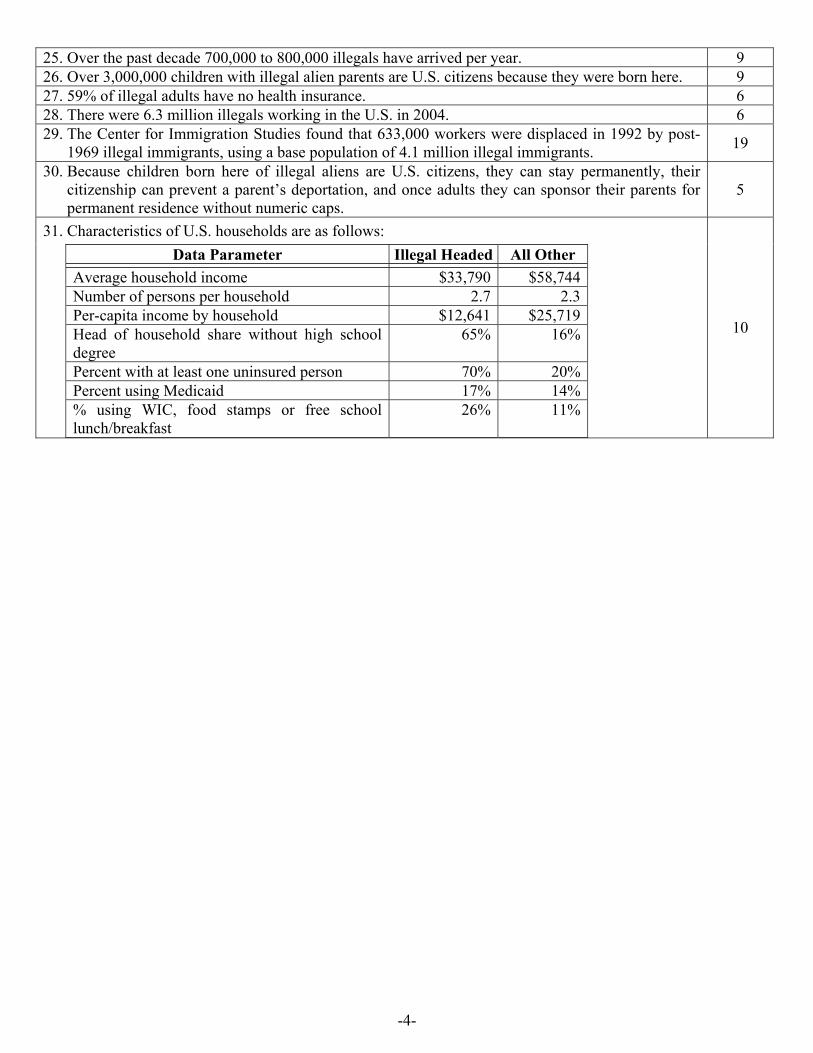
25. Over the past decade 700,000 to 800,000 illegals have arrived per year. 9 26. Over 3,000,000 children with illegal alien parents are U.S. citizens because they were born here. 9 27. 59% of illegal adults have no health insurance. 6 28. There were 6.3 million illegals working in the U.S. in 2004. 6 29. The Center for Immigration Studies found that 633,000 workers were displaced in 1992 by post-
1969 illegal immigrants, using a base population of 4.1 million illegal immigrants. 19
30. Because children born here of illegal aliens are U.S. citizens, they can stay permanently, their citizenship can prevent a parent’s deportation, and once adults they can sponsor their parents for permanent residence without numeric caps.
5
31. Characteristics of U.S. households are as follows: Data Parameter Illegal Headed All Other
Average household income $33,790 $58,744 Number of persons per household 2.7 2.3 Per-capita income by household $12,641 $25,719 Head of household share without high school degree
65% 16%
Percent with at least one uninsured person 70% 20% Percent using Medicaid 17% 14% % using WIC, food stamps or free school lunch/breakfast
26% 11%
10
-4-
Other State and Local Government Illegal Immigration Fact Sheet (all figures are in 2006 dollars)
Data Source
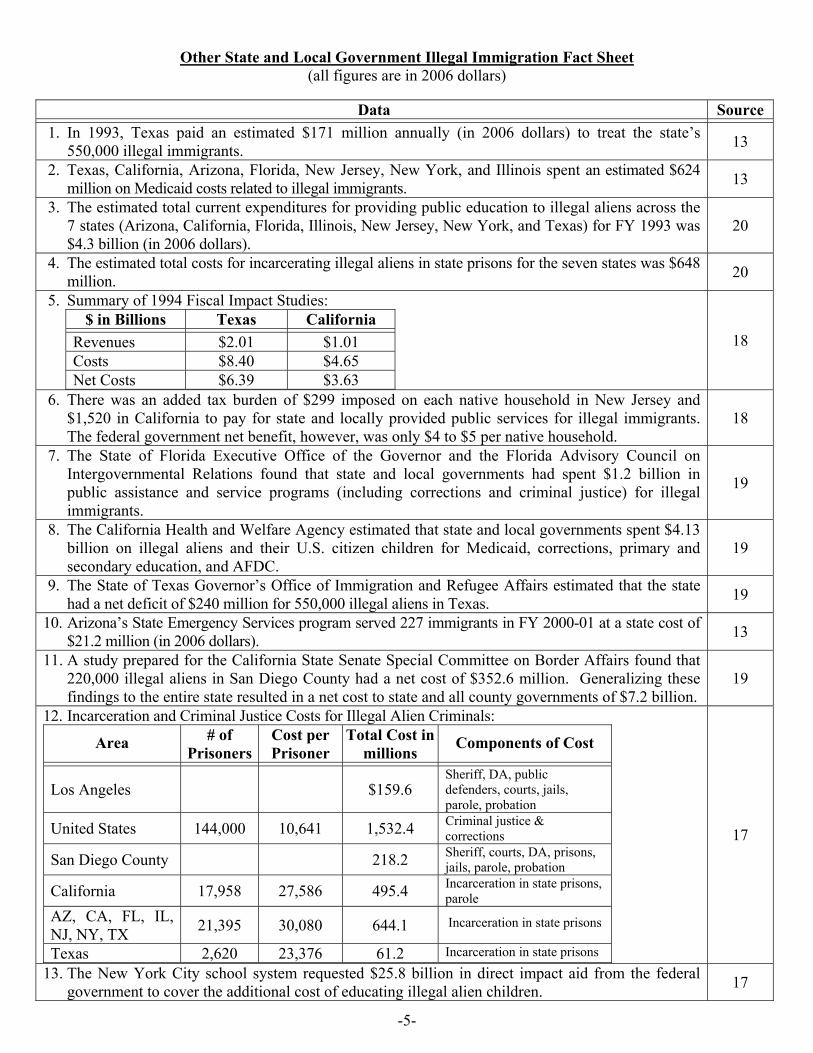
1. In 1993, Texas paid an estimated $171 million annually (in 2006 dollars) to treat the state’s 550,000 illegal immigrants. 13
2. Texas, California, Arizona, Florida, New Jersey, New York, and Illinois spent an estimated $624 million on Medicaid costs related to illegal immigrants. 13
3. The estimated total current expenditures for providing public education to illegal aliens across the 7 states (Arizona, California, Florida, Illinois, New Jersey, New York, and Texas) for FY 1993 was $4.3 billion (in 2006 dollars).
20
4. The estimated total costs for incarcerating illegal aliens in state prisons for the seven states was $648 million. 20
5. Summary of 1994 Fiscal Impact Studies: $ in Billions Texas California
Revenues $2.01 $1.01 Costs $8.40 $4.65 Net Costs $6.39 $3.63
18
6. There was an added tax burden of $299 imposed on each native household in New Jersey and $1,520 in California to pay for state and locally provided public services for illegal immigrants. The federal government net benefit, however, was only $4 to $5 per native household.
18
7. The State of Florida Executive Office of the Governor and the Florida Advisory Council on Intergovernmental Relations found that state and local governments had spent $1.2 billion in public assistance and service programs (including corrections and criminal justice) for illegal immigrants.
19
8. The California Health and Welfare Agency estimated that state and local governments spent $4.13 billion on illegal aliens and their U.S. citizen children for Medicaid, corrections, primary and secondary education, and AFDC.
19
9. The State of Texas Governor’s Office of Immigration and Refugee Affairs estimated that the state had a net deficit of $240 million for 550,000 illegal aliens in Texas. 19
10. Arizona’s State Emergency Services program served 227 immigrants in FY 2000-01 at a state cost of $21.2 million (in 2006 dollars). 13
11. A study prepared for the California State Senate Special Committee on Border Affairs found that 220,000 illegal aliens in San Diego County had a net cost of $352.6 million. Generalizing these findings to the entire state resulted in a net cost to state and all county governments of $7.2 billion.
19
12. Incarceration and Criminal Justice Costs for Illegal Alien Criminals:
Area # of Prisoners
Cost per Prisoner
Total Cost in millions Components of Cost
Los Angeles $159.6 Sheriff, DA, public defenders, courts, jails, parole, probation
United States 144,000 10,641 1,532.4 Criminal justice & corrections
San Diego County 218.2 Sheriff, courts, DA, prisons, jails, parole, probation
California 17,958 27,586 495.4 Incarceration in state prisons, parole
AZ, CA, FL, IL, NJ, NY, TX 21,395 30,080 644.1 Incarceration in state prisons
Texas 2,620 23,376 61.2 Incarceration in state prisons
17
13. The New York City school system requested $25.8 billion in direct impact aid from the federal government to cover the additional cost of educating illegal alien children. 17
-5-
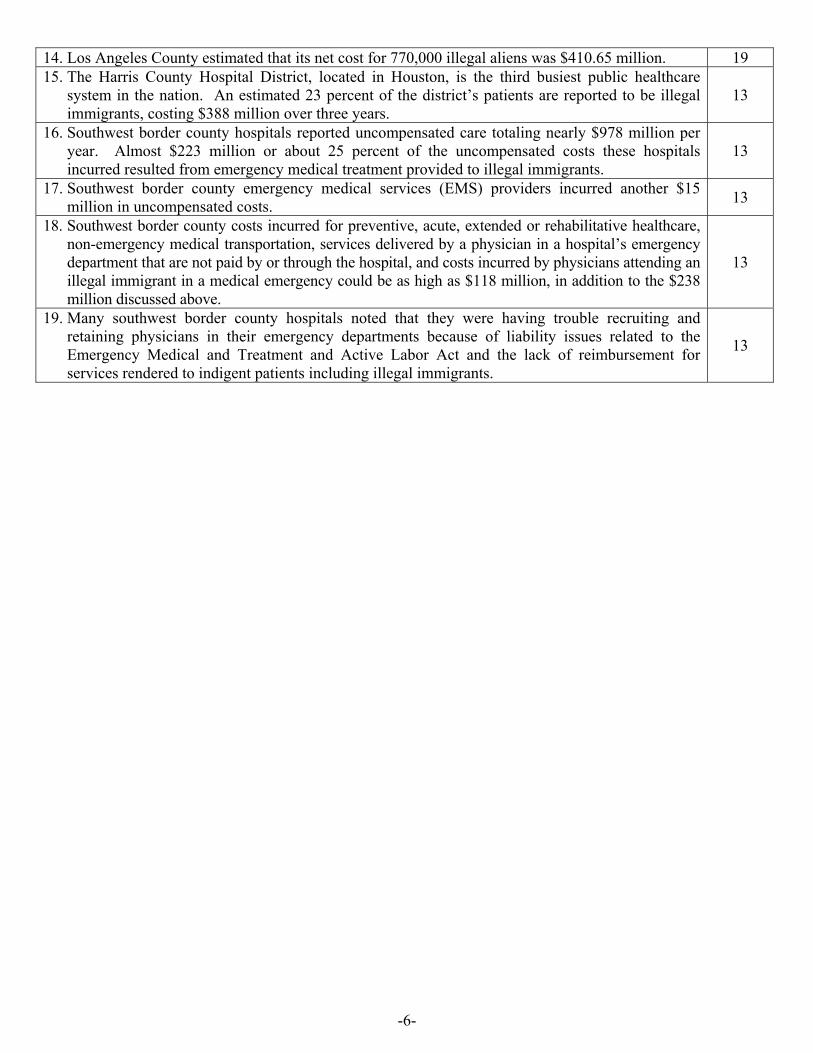
14. Los Angeles County estimated that its net cost for 770,000 illegal aliens was $410.65 million. 19 15. The Harris County Hospital District, located in Houston, is the third busiest public healthcare
system in the nation. An estimated 23 percent of the district’s patients are reported to be illegal immigrants, costing $388 million over three years.
13
16. Southwest border county hospitals reported uncompensated care totaling nearly $978 million per year. Almost $223 million or about 25 percent of the uncompensated costs these hospitals incurred resulted from emergency medical treatment provided to illegal immigrants.
13
17. Southwest border county emergency medical services (EMS) providers incurred another $15 million in uncompensated costs. 13
18. Southwest border county costs incurred for preventive, acute, extended or rehabilitative healthcare, non-emergency medical transportation, services delivered by a physician in a hospital’s emergency department that are not paid by or through the hospital, and costs incurred by physicians attending an illegal immigrant in a medical emergency could be as high as $118 million, in addition to the $238 million discussed above.
13
19. Many southwest border county hospitals noted that they were having trouble recruiting and retaining physicians in their emergency departments because of liability issues related to the Emergency Medical and Treatment and Active Labor Act and the lack of reimbursement for services rendered to indigent patients including illegal immigrants.
13
-6-
Sources
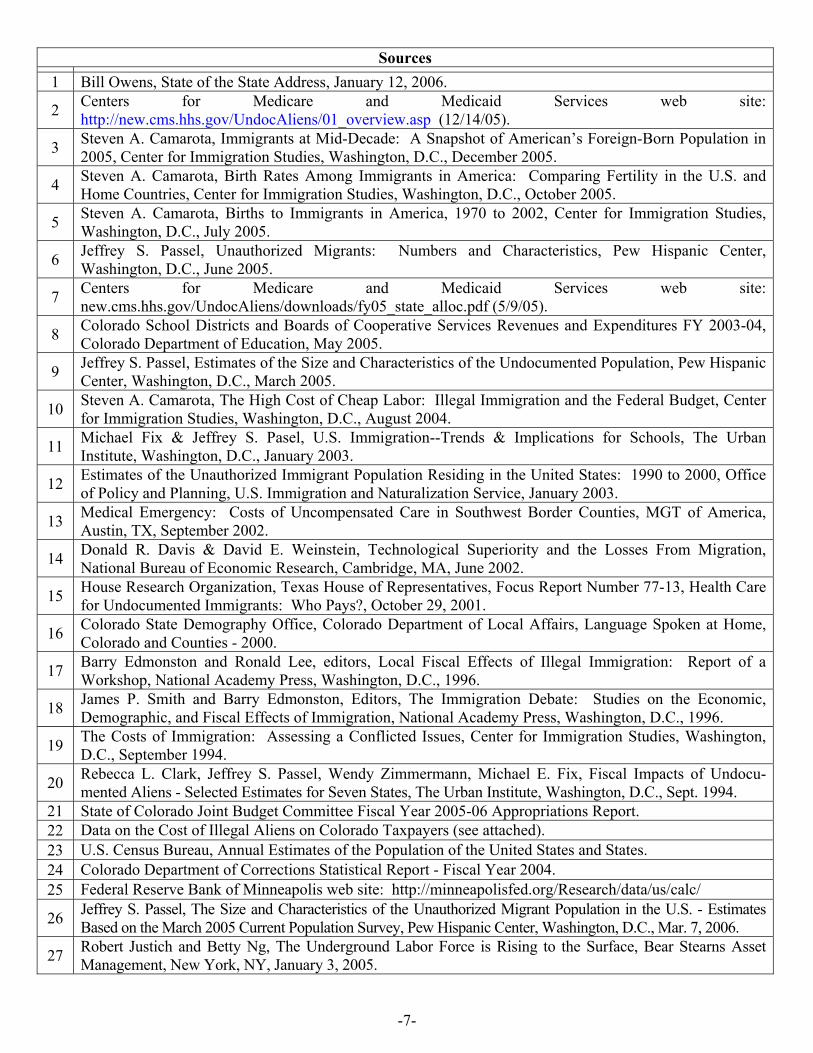
1 Bill Owens, State of the State Address, January 12, 2006.
2 Centers for Medicare and Medicaid Services web site: http://new.cms.hhs.gov/UndocAliens/01_overview.asp (12/14/05).
3 Steven A. Camarota, Immigrants at Mid-Decade: A Snapshot of American’s Foreign-Born Population in 2005, Center for Immigration Studies, Washington, D.C., December 2005.
4 Steven A. Camarota, Birth Rates Among Immigrants in America: Comparing Fertility in the U.S. and Home Countries, Center for Immigration Studies, Washington, D.C., October 2005.
5 Steven A. Camarota, Births to Immigrants in America, 1970 to 2002, Center for Immigration Studies, Washington, D.C., July 2005.
6 Jeffrey S. Passel, Unauthorized Migrants: Numbers and Characteristics, Pew Hispanic Center, Washington, D.C., June 2005.
7 Centers for Medicare and Medicaid Services web site: new.cms.hhs.gov/UndocAliens/downloads/fy05_state_alloc.pdf (5/9/05).
8 Colorado School Districts and Boards of Cooperative Services Revenues and Expenditures FY 2003-04, Colorado Department of Education, May 2005.
9 Jeffrey S. Passel, Estimates of the Size and Characteristics of the Undocumented Population, Pew Hispanic Center, Washington, D.C., March 2005.
10 Steven A. Camarota, The High Cost of Cheap Labor: Illegal Immigration and the Federal Budget, Center for Immigration Studies, Washington, D.C., August 2004.
11 Michael Fix & Jeffrey S. Pasel, U.S. Immigration--Trends & Implications for Schools, The Urban Institute, Washington, D.C., January 2003.
12 Estimates of the Unauthorized Immigrant Population Residing in the United States: 1990 to 2000, Office of Policy and Planning, U.S. Immigration and Naturalization Service, January 2003.
13 Medical Emergency: Costs of Uncompensated Care in Southwest Border Counties, MGT of America, Austin, TX, September 2002.
14 Donald R. Davis & David E. Weinstein, Technological Superiority and the Losses From Migration, National Bureau of Economic Research, Cambridge, MA, June 2002.
15 House Research Organization, Texas House of Representatives, Focus Report Number 77-13, Health Care for Undocumented Immigrants: Who Pays?, October 29, 2001.
16 Colorado State Demography Office, Colorado Department of Local Affairs, Language Spoken at Home, Colorado and Counties - 2000.
17 Barry Edmonston and Ronald Lee, editors, Local Fiscal Effects of Illegal Immigration: Report of a Workshop, National Academy Press, Washington, D.C., 1996.
18 James P. Smith and Barry Edmonston, Editors, The Immigration Debate: Studies on the Economic, Demographic, and Fiscal Effects of Immigration, National Academy Press, Washington, D.C., 1996.
19 The Costs of Immigration: Assessing a Conflicted Issues, Center for Immigration Studies, Washington, D.C., September 1994.
20 Rebecca L. Clark, Jeffrey S. Passel, Wendy Zimmermann, Michael E. Fix, Fiscal Impacts of Undocu-mented Aliens - Selected Estimates for Seven States, The Urban Institute, Washington, D.C., Sept. 1994.
21 State of Colorado Joint Budget Committee Fiscal Year 2005-06 Appropriations Report. 22 Data on the Cost of Illegal Aliens on Colorado Taxpayers (see attached). 23 U.S. Census Bureau, Annual Estimates of the Population of the United States and States. 24 Colorado Department of Corrections Statistical Report - Fiscal Year 2004. 25 Federal Reserve Bank of Minneapolis web site: http://minneapolisfed.org/Research/data/us/calc/
26 Jeffrey S. Passel, The Size and Characteristics of the Unauthorized Migrant Population in the U.S. - Estimates Based on the March 2005 Current Population Survey, Pew Hispanic Center, Washington, D.C., Mar. 7, 2006.
27 Robert Justich and Betty Ng, The Underground Labor Force is Rising to the Surface, Bear Stearns Asset Management, New York, NY, January 3, 2005.
-7-
1
3
5
7
9
11
13
15
17
19
21
23
25
27
29
31
33
35
37
39
41
43
45
47
49
51
53
55
57
59
6162
A B C
Source or Calculation Cost in 2006 $*
Colorado March 2005 illegal alien population 220,000 3Colorado July 2004 total population 4,601,821 23Percentage of Colorado population that' s here illegally (1 in 21) 4.78% B5/B7US March 2005 illegal alien population 9,690,000 3Colorado' s share of the US illegal alien population 2.27% B5/B11Total loss for US natives of illegal immigration per year in 1998 72,000,000,000$ 14 89,447,852,761$ Colorado ille
D
gal alien loss for US natives of illegal immigration per year 1,634,674,923$ B13*B15 2,030,807,803$ Cost to US taxpayers for paying for just the births to illegals in 2002 1,700,000,000$ 5 1,913,563,091$ Colorado cost for paying for just the births to illegals 38,596,491$ B13*B19 43,445,189$ Percent of Colorado illegal alien-headed households on Medicaid 12% 3Which translates to # of illegals on Medicaid 26,400 B23*B5FY ' 06 appropriated # of eligibles on Medicaid 426,430 21% of eligibles that are illegals 6.19% B25/B27Total FY ' 06 State General Fund Medicaid appropriation 1,042,362,634$ 21 1,042,362,634$ Amount of State General Funds spent on Medicaid for illegals 64,531,983$ B31*B29 64,531,983$ Number of school-age children in Colorado with immigrant mothers 161,000 3Total Colorado immigrant (foreign born) population 443,000 3Percentage of foreign born in Colorado whose parents were illegals 49.66% B5/B37Estimated # of school-age children in Colorado with illegal immigrant mothers 79,955 B39*B35Colorado school district average cost per student in FY 2004 10,492$ 8 11,247$ Annual cost of educating the children of illegal immigrants in Colorado 838,886,321$ B43*B41 899,282,583$ California incarceration rate of illegal aliens 0.99% 20Resulting estimated # of Colorado illegal aliens incarcerated 2,178 B47*B5Colorado cost per inmate in 2004 26,428$ 24 28,331$ Annual cost of incarcerating illegal immigrants in Colorado 57,560,184$ B51*B49 61,704,273$ Total cost to Coloradans for illegal immigrant Medicaid, K-12 education, and incarceration 960,978,488$
B53+ B45+B33 1,025,518,839$
U.S. Census Bureau Estimated 2006 Colorado population** 4,661,034$ see belowCost per Coloradan for illegal immigrant Medicaid, K-12 education, and incarceration 206$ B55/B57 220.02$
**The source of the Colorado population figure is the U.S. Census Bureau, Population Division, Interim State Population Projections, 2005
*The cost in 2006 dollars is calculated in each case by using the Federal Reserve Bank of Minneapolis web site: http://minneapolisfed.org/Research/data/us/calc/
Data on the Cost of Illegal Aliens on Colorado Taxpayers
Data
-8-
Summary of Illegal Immigration Data
Data Source
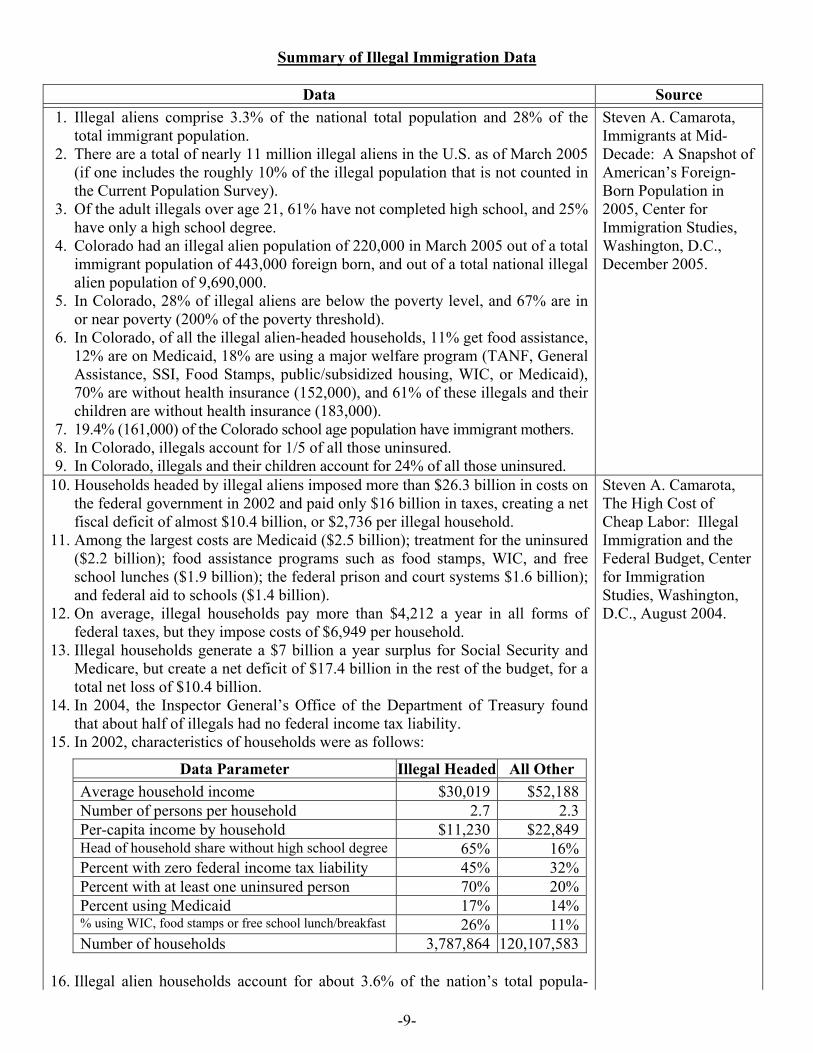
1. Illegal aliens comprise 3.3% of the national total population and 28% of the total immigrant population.
2. There are a total of nearly 11 million illegal aliens in the U.S. as of March 2005 (if one includes the roughly 10% of the illegal population that is not counted in the Current Population Survey).
3. Of the adult illegals over age 21, 61% have not completed high school, and 25% have only a high school degree.
4. Colorado had an illegal alien population of 220,000 in March 2005 out of a total immigrant population of 443,000 foreign born, and out of a total national illegal alien population of 9,690,000.
5. In Colorado, 28% of illegal aliens are below the poverty level, and 67% are in or near poverty (200% of the poverty threshold).
6. In Colorado, of all the illegal alien-headed households, 11% get food assistance, 12% are on Medicaid, 18% are using a major welfare program (TANF, General Assistance, SSI, Food Stamps, public/subsidized housing, WIC, or Medicaid), 70% are without health insurance (152,000), and 61% of these illegals and their children are without health insurance (183,000).
7. 19.4% (161,000) of the Colorado school age population have immigrant mothers. 8. In Colorado, illegals account for 1/5 of all those uninsured. 9. In Colorado, illegals and their children account for 24% of all those uninsured.
Steven A. Camarota, Immigrants at Mid-Decade: A Snapshot of American’s Foreign-Born Population in 2005, Center for Immigration Studies, Washington, D.C., December 2005.
10. Households headed by illegal aliens imposed more than $26.3 billion in costs on the federal government in 2002 and paid only $16 billion in taxes, creating a net fiscal deficit of almost $10.4 billion, or $2,736 per illegal household.
11. Among the largest costs are Medicaid ($2.5 billion); treatment for the uninsured ($2.2 billion); food assistance programs such as food stamps, WIC, and free school lunches ($1.9 billion); the federal prison and court systems $1.6 billion); and federal aid to schools ($1.4 billion).
12. On average, illegal households pay more than $4,212 a year in all forms of federal taxes, but they impose costs of $6,949 per household.
13. Illegal households generate a $7 billion a year surplus for Social Security and Medicare, but create a net deficit of $17.4 billion in the rest of the budget, for a total net loss of $10.4 billion.
14. In 2004, the Inspector General’s Office of the Department of Treasury found that about half of illegals had no federal income tax liability.
15. In 2002, characteristics of households were as follows:
Data Parameter Illegal Headed All Other
Average household income $30,019 $52,188 Number of persons per household 2.7 2.3 Per-capita income by household $11,230 $22,849 Head of household share without high school degree 65% 16% Percent with zero federal income tax liability 45% 32% Percent with at least one uninsured person 70% 20% Percent using Medicaid 17% 14% % using WIC, food stamps or free school lunch/breakfast 26% 11% Number of households 3,787,864 120,107,583
16. Illegal alien households account for about 3.6% of the nation’s total popula-
Steven A. Camarota, The High Cost of Cheap Labor: Illegal Immigration and the Federal Budget, Center for Immigration Studies, Washington, D.C., August 2004.
-9-
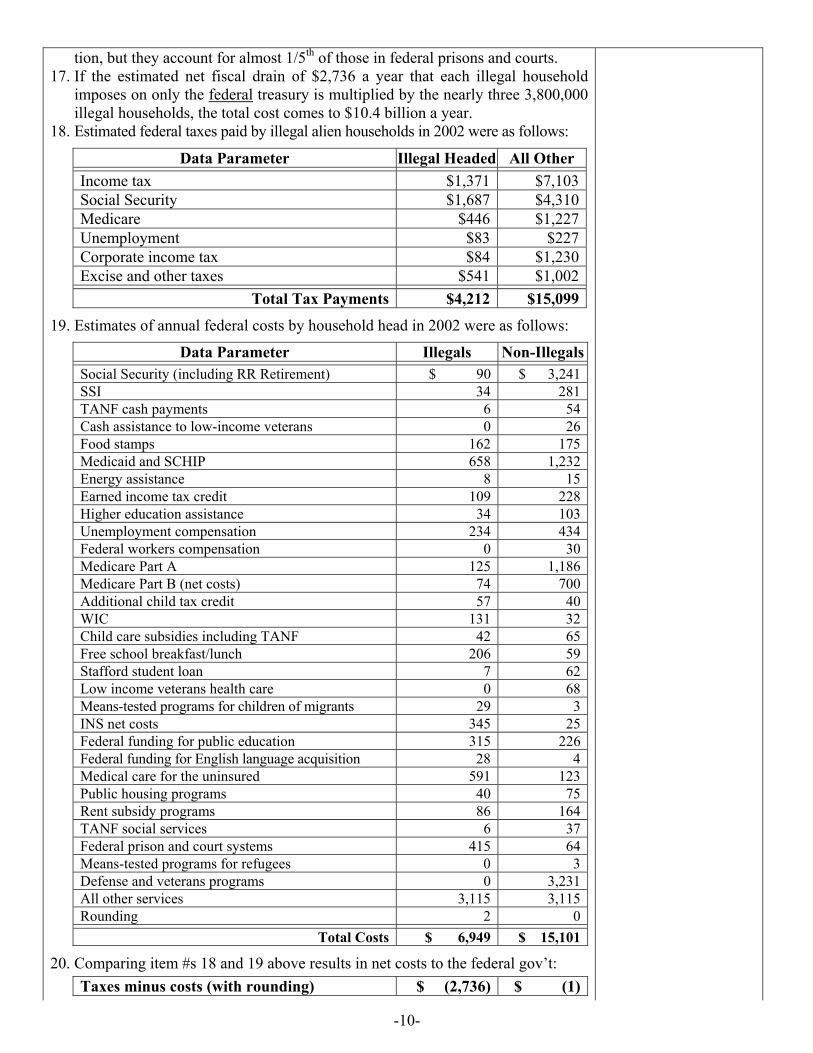
tion, but they account for almost 1/5th of those in federal prisons and courts. 17. If the estimated net fiscal drain of $2,736 a year that each illegal household
imposes on only the federal treasury is multiplied by the nearly three 3,800,000 illegal households, the total cost comes to $10.4 billion a year.
18. Estimated federal taxes paid by illegal alien households in 2002 were as follows:
Data Parameter Illegal Headed All Other
Income tax $1,371 $7,103 Social Security $1,687 $4,310 Medicare $446 $1,227 Unemployment $83 $227 Corporate income tax $84 $1,230 Excise and other taxes $541 $1,002
Total Tax Payments $4,212 $15,099
19. Estimates of annual federal costs by household head in 2002 were as follows:
Data Parameter Illegals Non-Illegals
Social Security (including RR Retirement) $ 90 $ 3,241 SSI 34 281 TANF cash payments 6 54 Cash assistance to low-income veterans 0 26 Food stamps 162 175 Medicaid and SCHIP 658 1,232 Energy assistance 8 15 Earned income tax credit 109 228 Higher education assistance 34 103 Unemployment compensation 234 434 Federal workers compensation 0 30 Medicare Part A 125 1,186 Medicare Part B (net costs) 74 700 Additional child tax credit 57 40 WIC 131 32 Child care subsidies including TANF 42 65 Free school breakfast/lunch 206 59 Stafford student loan 7 62 Low income veterans health care 0 68 Means-tested programs for children of migrants 29 3 INS net costs 345 25 Federal funding for public education 315 226 Federal funding for English language acquisition 28 4 Medical care for the uninsured 591 123 Public housing programs 40 75 Rent subsidy programs 86 164 TANF social services 6 37 Federal prison and court systems 415 64 Means-tested programs for refugees 0 3 Defense and veterans programs 0 3,231 All other services 3,115 3,115 Rounding 2 0
Total Costs $ 6,949 $ 15,101
20. Comparing item #s 18 and 19 above results in net costs to the federal gov’t: Taxes minus costs (with rounding) $ (2,736) $ (1)
-10-
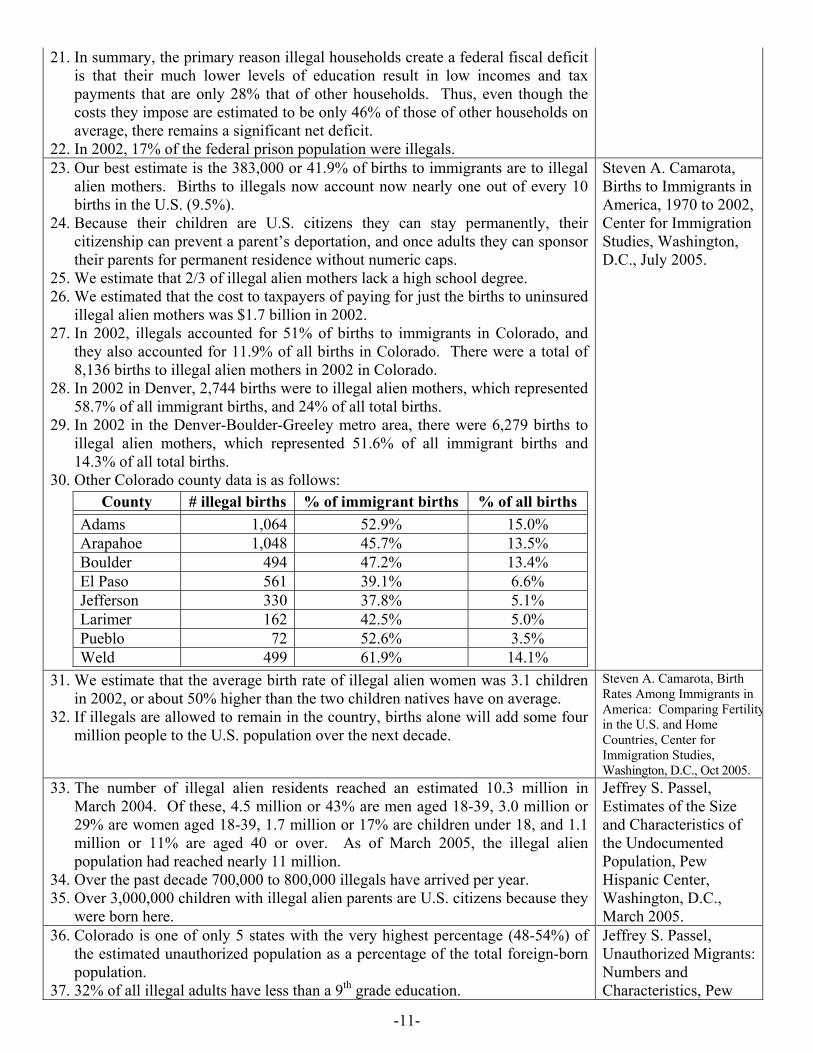
21. In summary, the primary reason illegal households create a federal fiscal deficit is that their much lower levels of education result in low incomes and tax payments that are only 28% that of other households. Thus, even though the costs they impose are estimated to be only 46% of those of other households on average, there remains a significant net deficit.
22. In 2002, 17% of the federal prison population were illegals.
23. Our best estimate is the 383,000 or 41.9% of births to immigrants are to illegal alien mothers. Births to illegals now account now nearly one out of every 10 births in the U.S. (9.5%).
24. Because their children are U.S. citizens they can stay permanently, their citizenship can prevent a parent’s deportation, and once adults they can sponsor their parents for permanent residence without numeric caps.
25. We estimate that 2/3 of illegal alien mothers lack a high school degree. 26. We estimated that the cost to taxpayers of paying for just the births to uninsured
illegal alien mothers was $1.7 billion in 2002. 27. In 2002, illegals accounted for 51% of births to immigrants in Colorado, and
they also accounted for 11.9% of all births in Colorado. There were a total of 8,136 births to illegal alien mothers in 2002 in Colorado.
28. In 2002 in Denver, 2,744 births were to illegal alien mothers, which represented 58.7% of all immigrant births, and 24% of all total births.
29. In 2002 in the Denver-Boulder-Greeley metro area, there were 6,279 births to illegal alien mothers, which represented 51.6% of all immigrant births and 14.3% of all total births.
30. Other Colorado county data is as follows: County # illegal births % of immigrant births % of all births
Adams 1,064 52.9% 15.0% Arapahoe 1,048 45.7% 13.5% Boulder 494 47.2% 13.4% El Paso 561 39.1% 6.6% Jefferson 330 37.8% 5.1% Larimer 162 42.5% 5.0% Pueblo 72 52.6% 3.5% Weld 499 61.9% 14.1%
Steven A. Camarota, Births to Immigrants in America, 1970 to 2002, Center for Immigration Studies, Washington, D.C., July 2005.
31. We estimate that the average birth rate of illegal alien women was 3.1 children in 2002, or about 50% higher than the two children natives have on average.
32. If illegals are allowed to remain in the country, births alone will add some four million people to the U.S. population over the next decade.
Steven A. Camarota, Birth Rates Among Immigrants in America: Comparing Fertilityin the U.S. and Home Countries, Center for Immigration Studies, Washington, D.C., Oct 2005.
33. The number of illegal alien residents reached an estimated 10.3 million in March 2004. Of these, 4.5 million or 43% are men aged 18-39, 3.0 million or 29% are women aged 18-39, 1.7 million or 17% are children under 18, and 1.1 million or 11% are aged 40 or over. As of March 2005, the illegal alien population had reached nearly 11 million.
34. Over the past decade 700,000 to 800,000 illegals have arrived per year. 35. Over 3,000,000 children with illegal alien parents are U.S. citizens because they
were born here.
Jeffrey S. Passel, Estimates of the Size and Characteristics of the Undocumented Population, Pew Hispanic Center, Washington, D.C., March 2005.
36. Colorado is one of only 5 states with the very highest percentage (48-54%) of the estimated unauthorized population as a percentage of the total foreign-born population.
37. 32% of all illegal adults have less than a 9th grade education.
Jeffrey S. Passel, Unauthorized Migrants: Numbers and Characteristics, Pew
-11-
38. There were 6.3 million illegals working in the U.S. in 2004. 39. 59% of illegal adults have no health insurance.
Hispanic Center, Washington, D.C., June 2005.
40. Colorado is one of 15 states with more than 100% growth from 1990-2000 of the limited English proficient population.
Michael Fix & Jeffrey S. Pasel, U.S. Immigration--Trends & Implications for Schools, The Urban Institute, Washington, D.C., January 2003.
41. Nine states including Colorado had increases of more than 100,000 in the number of illegals between 1990 and 2000.
42. Colorado had the 6th highest percentage of illegals as a percentage of its total population.
Estimates of the Unauthorized Immigrant Population Residing in the United States: 1990 to 2000, Office of Policy and Planning, U.S. Immi-gration & Naturalization Service, January 2003.
43. Colorado’s FY 2005 allocation for Section 1011 of the Medicare Modernization Act (federal reimbursement of emergency health services furnished to illegal aliens) was $3,433,957 out of a total national allocation of $250,000,000, which is the annual appropriation for FYs 2005-8.
Centers for Medicare and Medicaid Services web pages.
44. This study undertook systematic measurement of the problem and determined that illegal aliens cost border hospitals $189.6 million in uncompensated emergency medical costs during 2000. To put this figure in context, total reported uncompensated costs at border hospitals were $831.6 million, meaning that costs attributable to illegal immigrants comprised almost 23 percent of the unpaid care provided. In addition, we estimate that emergency medical service (EMS) providers had $13 million in uncompensated costs during 2000.
45. According to the American Hospital Association annual survey, southwest border county hospitals reported uncompensated care totaling nearly $832 million in 2000. Using an advanced statistical modeling approach, MGT determined that almost $190 million or about 25 percent of the uncompensated costs these hospitals incurred resulted from emergency medical treatment provided to illegal immigrants.
46. Using a separate methodology, MGT estimated that emergency medical services (EMS) providers incurred another $13 million in uncompensated costs in 2000.
47. Together the costs of emergency hospital and transportation services exceeded $200 million. Yet, this figure does not represent the total costs borne by southwest border counties and local medical providers. Costs incurred for preventive, acute, extended or rehabilitative healthcare, and non-emergency medical transportation are not included in our estimate since these services fall outside the federal definition of an “emergency” and were therefore beyond the scope of our analysis. Furthermore, services delivered by a physician in a hospital’s emergency department that are not paid by or through the hospital are billed separately and cannot be captured by examining uncompensated hospital costs. As such, costs incurred by physicians attending an illegal immigrant in a medical emergency also are not included in our cost estimate. The total for all these unestimated categories of expenditures could be as high as $100 million in 2000, in addition to the $200+ million discussed above.
48. A state-specific study was conducted in 1993 by the Texas Governor’s Office that concluded that Texas pays an estimated $122 million annually to treat the
Medical Emergency: Costs of Uncompensated Care in Southwest Border Counties, MGT of America, Austin, TX, September 2002.
-12-
state’s 550,000 illegal immigrants. 49. A 1994 study by the Urban Institute, entitled “Fiscal Impacts of Undocumented
Aliens: Selected Estimates for the Seven States,” was the federal government’s first attempt to estimate the Medicaid, education, and corrections costs imposed on states through illegal immigration. The study focused on fiscal impacts in seven states including Texas, California, Arizona, Florida, New Jersey, New York, and Illinois. The study concluded that these seven states spent an estimated $422 million on Medicaid costs related to illegal immigrants.
50. According to Arizona Health Futures, Arizona’s State Emergency Services program served 227 immigrants in FY 2000-01 at a state cost of $18.5 million.
51. According to Arizona Health Futures, in FY 2000-01, the federal government paid Arizona $7.99 million for emergency services provided to 7,705 immigrants.
52. The Harris County Hospital District, located in Houston, is the third busiest public healthcare system in the nation. An estimated 23 percent of the district’s patients are reported to be illegal immigrants, costing $330 million over the past three years.
53. Many hospitals noted that they were having trouble recruiting and retaining physicians in their emergency departments because of liability issues related to the Emergency Medical and Treatment and Active Labor Act (EMTALA) and the lack of reimbursement for services rendered to indigent patients including illegal immigrants.
54. On average, school districts spend $10,492 per student, which translates to $7,585,796,486 in FY ’04.
Colorado School Districts and Boards of Cooperative Services Revenues and Expenditures FY 2003-04, Colorado Department of Education, May 2005.
55. “ . . . one-third of all foreign-born Colorado residents are here illegally, and for every person who moves here from another state, two arrive from other countries, many illegally.”
Bill Owens, State of the State Address, January 12, 2006.
56. Students who are residents of a Colorado school district may not be denied admis-sion to the public schools based on their lawful or unlawful immigration status.
Colorado Department of Education.
57. Of Colorado’s population 5 years old and over (4,006,285), 604,019 (15.1%) speak a language other than English at home. Of these individuals, 267,504 speak English less than “very well.”
Colorado State Demography Office, Colorado Department of Local Affairs, Language Spoken at Home, Colorado and Counties - 2000.
58. “Two facts motivate this study. (1) The United States is the world’s most productive economy. (2) The U.S. is the destination for a broad range of net factor inflows: unskilled labor, skilled labor, and capital. Indeed, these two facts may be strongly related: All factors seek to enter the U.S. because of the U.S. technological superiority. The literature on international factor flows rarely links these two phenomena, instead considering one-at-a-time analyses that stress issues of relative factor abundance. This is unfortunate, since the welfare calculations differ markedly. In a simple Ricardian framework, a country that experiences immigration of factors motivated by technological differences always loses from this migration relative to a free trade baseline, while the other country gains. We provide simple calculations suggesting that the magnitude of the losses for U.S. natives may be quite large--$72 billion
Donald R. Davis & David E. Weinstein, Technological Superiority and the Losses From Migration, National Bureau of Economic Research, Cambridge, MA, June 2002.
-13-
dollars per year or 0.8 percent of GDP.” (These figures are for the year 1998.) 59. “These are big numbers. These losses to U.S. natives from factor immigration
are approximately equivalent to Feenstra’s (1992) estimate of the annual deadweight loss to the U.S. from all trade protection. It is approximately two to three times Alvarez and Jermann’s (2000) estimate of the average annual cost of business cycles to consumers in the postwar period. In other words, immigration (labor and capital together) is about as costly to the U.S. as all trade protection and two to three times as costly as business cycles!”
60. According to the Harris County Hospital District, illegal immigrants account for about 23 percent of visits to its facilities. The district estimates that it spent $330 million on health care for illegal immigrants over the past 3 years, $105 million of which was reimbursed with federal funds. Taxpayers, insurers, and patients paid the remaining $225 million.
House Research Organization, Texas House of Representatives, Focus Report Number 77-13, Health Care for Undocumented Immigrants: Who Pays?, October 29, 2001.
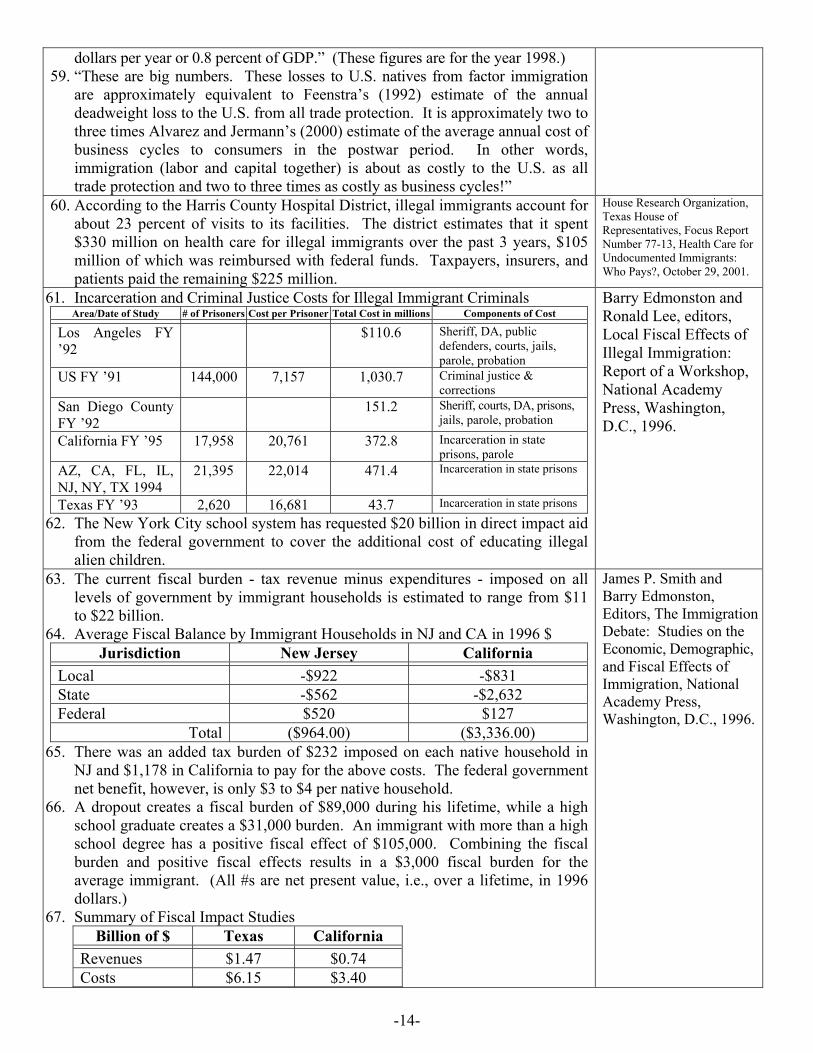
61. Incarceration and Criminal Justice Costs for Illegal Immigrant Criminals Area/Date of Study # of Prisoners Cost per Prisoner Total Cost in millions Components of Cost
Los Angeles FY ’92
$110.6 Sheriff, DA, public defenders, courts, jails, parole, probation
US FY ’91 144,000 7,157 1,030.7 Criminal justice & corrections
San Diego County FY ’92
151.2 Sheriff, courts, DA, prisons, jails, parole, probation
California FY ’95 17,958 20,761 372.8 Incarceration in state prisons, parole
AZ, CA, FL, IL, NJ, NY, TX 1994
21,395 22,014 471.4 Incarceration in state prisons
Texas FY ’93 2,620 16,681 43.7 Incarceration in state prisons
62. The New York City school system has requested $20 billion in direct impact aid from the federal government to cover the additional cost of educating illegal alien children.
Barry Edmonston and Ronald Lee, editors, Local Fiscal Effects of Illegal Immigration: Report of a Workshop, National Academy Press, Washington, D.C., 1996.
63. The current fiscal burden - tax revenue minus expenditures - imposed on all levels of government by immigrant households is estimated to range from $11 to $22 billion.
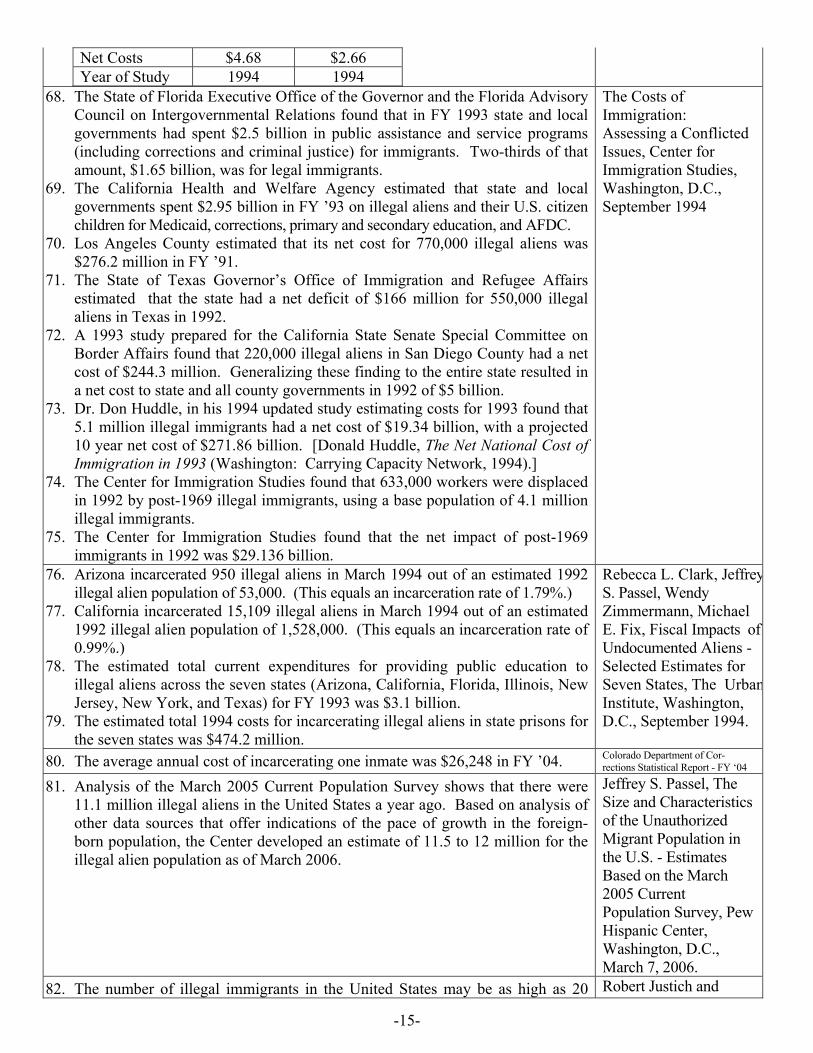
64. Average Fiscal Balance by Immigrant Households in NJ and CA in 1996 $ Jurisdiction New Jersey California
Local -$922 -$831 State -$562 -$2,632 Federal $520 $127
Total ($964.00) ($3,336.00)
James P. Smith and Barry Edmonston, Editors, The Immigration Debate: Studies on the Economic, Demographic, and Fiscal Effects of Immigration, National Academy Press, Washington, D.C., 1996.
65. There was an added tax burden of $232 imposed on each native household in NJ and $1,178 in California to pay for the above costs. The federal government net benefit, however, is only $3 to $4 per native household.
66. A dropout creates a fiscal burden of $89,000 during his lifetime, while a high school graduate creates a $31,000 burden. An immigrant with more than a high school degree has a positive fiscal effect of $105,000. Combining the fiscal burden and positive fiscal effects results in a $3,000 fiscal burden for the average immigrant. (All #s are net present value, i.e., over a lifetime, in 1996 dollars.)
67. Summary of Fiscal Impact Studies Billion of $ Texas California
Revenues $1.47 $0.74 Costs $6.15 $3.40
-14-
Net Costs $4.68 $2.66 Year of Study 1994 1994
68. The State of Florida Executive Office of the Governor and the Florida Advisory Council on Intergovernmental Relations found that in FY 1993 state and local governments had spent $2.5 billion in public assistance and service programs (including corrections and criminal justice) for immigrants. Two-thirds of that amount, $1.65 billion, was for legal immigrants.
69. The California Health and Welfare Agency estimated that state and local governments spent $2.95 billion in FY ’93 on illegal aliens and their U.S. citizen children for Medicaid, corrections, primary and secondary education, and AFDC.
70. Los Angeles County estimated that its net cost for 770,000 illegal aliens was $276.2 million in FY ’91.
71. The State of Texas Governor’s Office of Immigration and Refugee Affairs estimated that the state had a net deficit of $166 million for 550,000 illegal aliens in Texas in 1992.
72. A 1993 study prepared for the California State Senate Special Committee on Border Affairs found that 220,000 illegal aliens in San Diego County had a net cost of $244.3 million. Generalizing these finding to the entire state resulted in a net cost to state and all county governments in 1992 of $5 billion.
73. Dr. Don Huddle, in his 1994 updated study estimating costs for 1993 found that 5.1 million illegal immigrants had a net cost of $19.34 billion, with a projected 10 year net cost of $271.86 billion. [Donald Huddle, The Net National Cost of Immigration in 1993 (Washington: Carrying Capacity Network, 1994).]
74. The Center for Immigration Studies found that 633,000 workers were displaced in 1992 by post-1969 illegal immigrants, using a base population of 4.1 million illegal immigrants.
75. The Center for Immigration Studies found that the net impact of post-1969 immigrants in 1992 was $29.136 billion.
The Costs of Immigration: Assessing a Conflicted Issues, Center for Immigration Studies, Washington, D.C., September 1994
76. Arizona incarcerated 950 illegal aliens in March 1994 out of an estimated 1992 illegal alien population of 53,000. (This equals an incarceration rate of 1.79%.)
77. California incarcerated 15,109 illegal aliens in March 1994 out of an estimated 1992 illegal alien population of 1,528,000. (This equals an incarceration rate of 0.99%.)
78. The estimated total current expenditures for providing public education to illegal aliens across the seven states (Arizona, California, Florida, Illinois, New Jersey, New York, and Texas) for FY 1993 was $3.1 billion.
79. The estimated total 1994 costs for incarcerating illegal aliens in state prisons for the seven states was $474.2 million.
Rebecca L. Clark, JeffreyS. Passel, Wendy Zimmermann, Michael E. Fix, Fiscal Impacts of Undocumented Aliens - Selected Estimates for Seven States, The UrbanInstitute, Washington, D.C., September 1994.
80. The average annual cost of incarcerating one inmate was $26,248 in FY ’04. Colorado Department of Cor-rections Statistical Report - FY ‘04
81. Analysis of the March 2005 Current Population Survey shows that there were 11.1 million illegal aliens in the United States a year ago. Based on analysis of other data sources that offer indications of the pace of growth in the foreign-born population, the Center developed an estimate of 11.5 to 12 million for the illegal alien population as of March 2006.
Jeffrey S. Passel, The Size and Characteristics of the Unauthorized Migrant Population in the U.S. - Estimates Based on the March 2005 Current Population Survey, Pew Hispanic Center, Washington, D.C., March 7, 2006.
82. The number of illegal immigrants in the United States may be as high as 20 Robert Justich and
-15-

million people, more than double the official 9 million people estimated by the Census Bureau.
Betty Ng, The Underground Labor Force is Rising to the Surface, Bear Stearns Asset Management, New York, NY, January 3, 2005.
-16-
What’s Wrong With The Bell Policy Center’s December 29, 2005 Immigration Paper The Bell’s paper seems to have been driven through an advocacy position, rather than representing anything vaguely resembling academic research. Here are some reasons why: It relies almost exclusively on one very dated study. The Bell’s paper stated the following: “The National Research Council conducted a thorough assessment of the economic impact of immigrants. The New Americans was published in 1997, followed by a companion report containing more detail in 1998. Although they are somewhat dated, the findings from this study are still considered relevant. This study considered all immigrants, both documented and undocumented. . . . Again, the National Research Council study serves as the most comprehensive to date assessing the fiscal balance for immigrants.” In this regard, two key points merit emphasis. First, the NRC study is very dated, especially in light of the fact that it was based on 1994 data. Given the changing demographics of inmigration over the past decade, this represents a questionable choice by The Bell in that its paper bases its conclusion that immigration results in a positive fiscal balance for the country solely on this study. More importantly, numerous studies have been done since the NRC study providing far more up to date data that better reflects the current characteristics of immigration to the U.S. Second, The Bell mistakenly used the NRC study for its paper dealing with arguments against a state constitutional amendment dealing with illegal immigration. Again, the NRC study’s results were for all immigrants, both legal and illegal. As stated by Steven A. Camarota concerning his August 2004 study: “This report has focused on only the fiscal impact of illegal aliens at the federal level. It is almost certain that they also create a large fiscal deficit at the state and local levels. Thus, the results in this report only deal with part of the costs of illegal immigration. On the other hand, it must be remembered that this report says nothing about the overall fiscal impact of households headed by legal immigrants. The fact that unskilled immigrants who are legal residents impose large fiscal costs on federal coffers does not mean that legal immigrants overall are a drain on federal coffers.” In other words, relying on the NRC study that deals with the economic impacts of all immigration in a discussion about illegal immigration is specious at best, and purposely misleading at worst. This is demonstrated by the following quote from the NRC study: “In principle, these surveys cover illegal immigrants as well as legal immigrants and nonimmigrants (foreign students and foreign business travelers). To the extent that these are included in the CPS (the Current Population Survey), they distort the information about immigrants, particularly those who don’t stay very long. The problem may not be trivial, since the number of nonimmigrants in the United States at any time is comparable to the annual inflow of immigrants. At shorter durations in the United States, our calculations could most accurately be said to apply to the foreign-born, rather than to immigrants per se. In practice, we do not know the coverage of illegal immigrants, but we suspect that it is incomplete. In our analysis we cannot distinguish between legal and illegal immigrants. Presumably, illegal immigrants both pay less in taxes and receive less in benefits than other immigrants do.” As stated by Camarota, “By using Census Bureau data that include both illegals and legals, their fiscal analysis is really a combined estimate of the entire foreign-born population both legal and illegal.” Failure by The Bell to acknowledge this key difference in what was being considered in all the various studies represents what would seem to be a purposeful error of omission.
-17-