suburban transit network, inc. (transnet) fy 2011-12 current financial position current operations...
TRANSCRIPT

Suburban Transit Network, Inc. (TransNet)
FY 2011-12Current Financial Position
Current Operations
Service Statistics/Trends
Funding Statistics/Trends
Other Information/Assumptions
Capital Status Review
1

Current Financial Position:Reserves/Retained Earnings
Source Balance
Lottery
MATP
MH/MR
Area Agency on Aging
Other State $
Other Local $
2

Current Financial Position:
Level of Short-Term Debt/Loans—Identify each line of credit (excludes long-term bond financing)Name of Financial
InstitutionAmount of Available
Credit
Interest Rate
Current Credit in Use
TD Bank $700,000 .5% above prime
-0-
3

Current Financial Position:Accounts Payable – Past due 90 days and
over
Accounts Receivable – Past due 90 days and over
Vendor Amount Past Due Estimated Pay Date
None
Program/Agency
Amount Past Due
Date Requisitione
d
Estimated Pay Date
Ken Crest Services
$2,254 10/23/11 03/31/12
PA ODP $900 09/25/11 Never 4

Current Operations:Staffing LevelContract ProvisionsHealthcarePensionFuelFaresOther major factors producing cost increases
above inflationCost Savings Initiatives
5

Staffing Level/Org ChartProvide a current organization chart with
vacant and new positions. Include a justification for new planned positions.
New positions include 2 FT schedulers, 1FT Scheduler/Trainer and 3 Reservation Agents. This is necessary due to the centralizing of scheduling and reservations.
6

Suburban Transit Network, Inc.Organization Chart
S u sa n K o p yste ckiIS D ire c to r
M a ria C h u rchO p s /Tra in ing M a na g er
C a ro l S te rlingD ire c to r o f O p e ra tio ns
B o a rd o f D ire c to rs
O p e n P os it ion S ch ed u le r
B rian n e B e nn er A ss t. F isca l M a n ag er
P h yllis H a tch P rog ram C oo rd ina to r
W e n d y R a d leyH e le n M ag lio neT a ra F la n n e ryH e len e S p en cerD e b ra D u ffyR e serva tio n A g e n ts
M e la n ie M an s fie ld R isk M g m t. C oo rd ina to r
K e llie G ra m lichF isca l M a n a g er
N ico le L e w a nd o w ski O ff ice A ssis ta n t
R o se a nn S tra ng P w D M a n a g er
D a m onT u rn erS che d u lingC o o rd .
Jo se ph P a trickT ra in ing&S che d .A ss is t.
K a re nS ch w em m erP ro gra m M a na g er
M e g a n K ru si IS M a na g er
P a tric ia M o irE xe cu tive D ire c to r

Labor ProvisionsTerm of current union contract – no union
Drivers Current 2012-13
Starting wage $9.50-$10/$10.50 WC
same
Top wage $14.50 same
Average wage $11 same
Contract wage increase
N/AJob Classification Number- Full
TimeNumber-Part Time
Drivers 163 133
Mechanics 12
4
Dispatchers 9 3
Clerical 18 6
Other Positions-aides 38 8

Important Labor ProvisionsUse of part-time employees
Average 35%
Number/percent of “split shift” driversAverage 50%
OvertimeAverage 10% of total hours
Outsourcing Some mechanical work
Other
9

Healthcare
Describe any proposed changes and the estimated financial impacts. We adjust our plan each year to avoid large premium increases.
Union Non-Union
Basic Coverage
Current $533/mo-ee only
FY 2012-13 $540/mo-ee only
Employee Contributions
Current -0-
FY 2012-13 -0-
Co-PaymentCurrent
FY 2012-13
10

PensionUnion Non-Union
Employee Contributions
Current Salary deferrals-2%-25%
FY 2012-13 same
Minimum Age to Qualify for Retirement
Current 59 1/2
FY 2012-13 59 1/2
Minimum Number of Years to Qualify for Retirement
Current n/a
FY 2012-13
Minimum Number of Years to be Vested
Current 2 yrs – 20%3 yrs – 50%4yrs - 75%5 yrs – 100%
FY 2012-13 same11

Pension:Describe any proposed changes and the
estimated financial impacts.Board has discretionary contribution option at end of FY.
Provide a status of the degree to which the pension funding is funded. If not fully funded please provide your strategy to fully fund pension.Not applicable
12

Fuel:Current Cost per Gallon - $3.60 wholesale/
$3.80 retail
Contract rate or market rate? Market rate
Terms of contract (if applicable)Two subcontractors purchase fuel wholesale.
Projected Cost per Gallon and Basis for ProjectionContract rate or market rate? – Market rate – who
knows?Terms of contract (if applicable)
See above
13

Shared Ride Fares: Date of Last Fare Increase
March 2007 – PUCMarch 2012 – PaDOT Zone mileage rate - pending
Current Average fare - $21.90 Sponsorship arrangements
OAAS – 15% for sponsored programs, 25% for 60-64Other 3rd party sponsors – 15% for their programs only (100% for 60-64)
Planned Changes Date of planned increase - June 1, 2012 Estimated average fare – $22.00 Sponsorship arrangements – no change Describe Fare Policy
Passengers pay 15% cash to driver. TN invoices 15% to 3rd party sponsors.
Cash will be deducted from carrier payments. MATP – possible $2 copay. 60-64 trips – 25% cash unless sponsored by OAAS
14
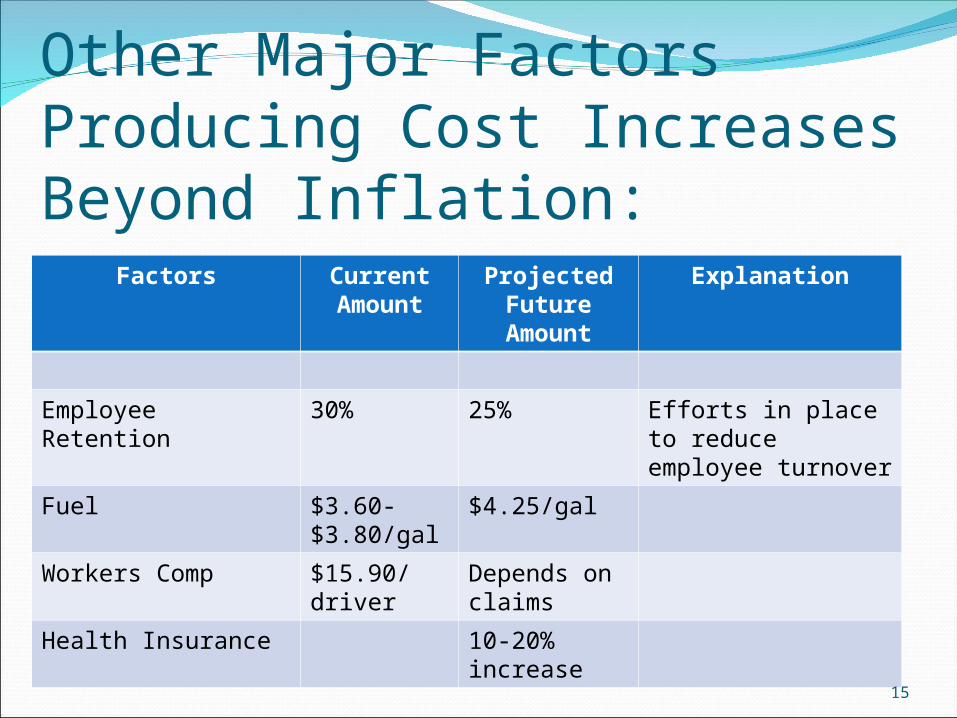
Other Major Factors Producing Cost Increases Beyond Inflation:
Factors Current Amount
Projected Future Amount
Explanation
Employee Retention 30% 25% Efforts in place to reduce employee turnover
Fuel $3.60-$3.80/gal
$4.25/gal
Workers Comp $15.90/driver
Depends on claims
Health Insurance 10-20% increase
15

Cost Savings Initiatives:Initiative Current
CostPlanned Action and
Implementation DateProjecte
d Savings
Centralization of Scheduling/Reservations
6/1/12 $80,000
New Transportation Software
6/1/12
16

Shared Ride Funding
FY 2010-
11
FY 2011-12
FY 2012-13
FY 2013-14
FY 2014-15
Operating Expense
$7,630,342
$7,773,736
$7,975,935
$8,135,453
$8,298,162
Passenger Revenue
$ 535,305
$ 530,576
$ 541,188
$ 552,011
$ 563,051
Lottery $4,281,912
$4,320,000
$4,500,000
$4,590,000
$4,861,800
MATP $1,848,413
$1,930,890
$2,003,326
$2,023,269
$2,046,150
Other $ 909,416
$ 848,139
$ 823,319
$ 841,832
$ 869,974
Balance ($ 55,296)
($ 144,131)
($ 108,192)
($128,341)
($137,187)
17

Shared Ride Statistics/Trends
18
Shared-Ride FY 2010-11
FY 2011-12
FY 2012-13
FY 2013-14
FY 2014-15
Total Veh. Miles
2,209,661 2,237,083
2,281,825 2,327,462 2,374,011
Cost per Mile $3.45 $3.48 $3.50 $3.30 $3.21
Total Veh. Hours
231,658 236,291 241,017 245,837 250,754
Cost per Hour $32.94 $32.90 $33.10 $33.10 $33.10
Total Pass. Trips
356,397 355,000 362,100 369,342 376,729
Cost per Trip $21.41 $21.90 $22.03 $22.03 $22.03
Rev. per Trip $21.25 $21.50 $21.73 $21.68 $21.67
Trips per Hour
1.54 1.49 1.5 1.5 1.5

Other Information:Quality Assurance ProceduresRisk ManagementDriver TrainingPerformance Measures
Accidents/Incidents Complaints/Compliments Maintenance Violations Driver Turnover Billing/Reporting On Time Performance (future) On Board Travel Time (future)
19

Capital Status Review
20