study on the forming and sensing properties of laser
TRANSCRIPT

ORIGINAL ARTICLE
Study on the forming and sensing properties of laser-sinteredTPU/CNT composites for plantar pressure sensors
Yu Zhuang1& Yanling Guo1
& Jian Li1 & Yueqiang Yu2& Kaiyi Jiang3
& Hui Zhang1& Shuai Guo1
Received: 12 September 2020 /Accepted: 21 December 2020# The Author(s) 2021
AbstractConductive polymer composites (CPCs) combining with specific microstructures (micropores, microcracks, etc.) can exhibitunique resistance response changes, which can be widely regarded as an effective way to improve sensing performance. Thisstudy takes advantage of the characteristics of the formation of tiny pores between crystal grains during selective laser sintering(SLS) processing to introduce a microporous structure into the thermoplastic polyurethane (TPU)/carbon nanotube (CNT)sensing element to prepare a three-dimensional porous conductive structure. The effect of the SLS process on sensing sensitivity,accuracy, and density was studied, and its sensing and forming mechanism were discussed. By adjusting SLS process parametersto control the performance of porous structure sensor elements, a final TPU/CNT sensor element with a wide pressure detectionrange, high sensitivity, a fast response time, and good stability and durability was developed. Finally, the optimal performance ofthe developed flexible pressure sensor was successfully used to detect the pressure distribution of the human foot. This studyprovided a simple and effective research method to develop high-performance flexible pressure sensors.
Keywords Selective laser sintering . Pressure-sensing element . Thermoplastic polyurethane . Carbon nanotubes . Conductivepolymer composites
1 Introduction
Recently, novel resistive-type conductive polymer composite(CPC)–based strain sensors have attracted attention based ontheir merits of light weight, flexibility, stretchability, and easyprocessing, thus showing great potential applications in thefields of software robots [1], electronic skins [2], smart wear-able devices [3], human movement detection [2, 4, 5], etc.Owing to the flexibility and stretchability of the polymer ma-trix, CPCs also have great potentials for the detection of var-ious external stimuli (tensile, compression, organic vapor,temperature, etc.) based on the reconstruction of conductive
networks, which induced significant resistance variation[6–8]. Generally, CPCs are fabricated through combining con-ductive fillers (Ag nanowire, carbon nanotube [9], graphene[10], etc.) and insulating polymers with proper processingtechnology (melt mixing, solution mixing, dip-coating, spraycoating, etc.).
Carbon nanotubes (CNTs) are often used as conductivefiller materials and are good materials for preparing CPC-based strain sensors because of their large specific surfacearea, aspect ratio, high specific strength and modulus, andhardness and toughness [11, 12]. Michelis et al. [13] built ahighly reproducible and hysteresis-free flexible strain sensorusing inkjet printing CNTs on ethylene tetrafluoroethylenesheets. Liu et al. [14] prepared a lightweight porous thermo-plastic polyurethane (TPU)/CNT sensor using the thermallyinduced phase separation (TIPS) technology, which has ultra-high compressibility and fast sensing capacity over a widestrain range (up to 90%). Lee et al. [15] applied silicone rubberto polyurethane foam and further dip-coated it withmultiwalled carbon nanotube (MWCNT) dispersed TPU inkto produce a sensor that has good repeatability, high durabil-ity, and fast response speed, and the sensor can measure pres-sures of less than 100 Pa andmore than 200 kPa. However, the
* Yanling [email protected]
1 School of Mechatronics Engineering, Northeast Forestry University,Harbin 150040, China
2 College of Mechanical Science and Engineering, NortheastPetroleum University, Daqing 163318, China
3 School of Engineering and Technology, Northeast ForestryUniversity, Harbin 150040, China
https://doi.org/10.1007/s00170-020-06560-8
/ Published online: 6 January 2021
The International Journal of Advanced Manufacturing Technology (2021) 112:2211–2222

surfaces of these CPC-based strain sensors are generally pla-nar, as they are formed by hot compression and casting in aspecific mold, which means that these pressure sensors cannotcompletely fit objects with complex curved surfaces, resultingin measurement errors.
Additive manufacturing (AM) is currently the fastest-growing manufacturing method. It allows the manufacturingof products with complex geometry and high dimensional ac-curacy, as well as high strength [16]. Following the increasinginteres t in AM, some AM technologies such asstereolithography, fused filament fabrication, and fused depo-sition modeling technologies are gradually popularized.Nevertheless, this approach has a limited range of applicationsdue to the relatively low mechanical strength of applied poly-mer materials and several technological restrictions [17–20].Recent development of AM methods, i.e., selective laser melt-ing, electron beam melting, selective laser sintering (SLS), andlaser engineering net shaping (LENS), offers new possibilitiesto conduct investigations on complex surfaces and lattice struc-tures. Selective laser melting and LENS technologies use ahigh-power fiber laser with a wavelength of 1.064 μm as theenergy source; these technologies are more suitable for theabsorption and melting of metal alloy powders. Selective lasersintering uses a CO2 laser with a wavelength of 10.64 μm,which is more suitable for sintering thermoplastic polymers,coated sand, and ceramic powder. Additionally, SLS is a widerange of processing materials and no support material is needed[21, 22], which make it more suitable for preparing flexiblepressure-sensing elements with a complex curved surface struc-ture. Among the commonly used polymer materials for lasersintering, TPU is an excellent electrical insulator that exhibitshigh elasticity, flexibility, and environmental stability. It iswidely used in textile, medical, automotive, aerospace, avia-tion, and other fields, and it is an ideal base material for devel-oping CPCs. Additionally, due to the unique forming processmechanism of laser sintering, it is possible to produce inherent-ly porous objects. These pressure-sensing elements with a po-rous structure can greatly improve the sensitivity and gaugecoefficient of the sensing element [23].
Laser sintering is a very complex thermophysical process,which depends not only on the accuracy of the SLS equipmentand the thermophysical parameters of the material but also onthe process parameters of the SLS [24, 25]. For commercialSLS equipment, only a few process parameters, such as laserpower (P), layer thickness (h), scanning speed (v), and scanspacing (b), are relatively easy to control and adjust. The threeparameters (P, v, and b) need to cooperate to achieve theenergy (E = P/(v · b)) required for powder sintering.Additionally, the sensitivity of the pressure sensor elementstudied in this paper is affected not only by the material butalso by the porosity of the sensor element. The scan spacingaffects the density in the horizontal direction (XY plane), andthe layer thickness affects the density in building direction (Z).
Therefore, this study uses laser power, layer thickness, andscan spacing as input parameters for experiments. In the re-search of laser processing and molding optimization, manyscholars adopted different experimental methods. Floreset al. [26] used the topology optimization method to optimizethe parameters of the lattice structure of the parts, which re-duced the manufacturing cost by 53.7% and the productiontime by 54.3% and increased the output. Arısoy et al. [27]used the surface response regression method to study the in-fluence of the cooling rate and thermal gradient during laserprocessing of nickel alloy (IN625) material, which improvedproduction efficiency.
In this study, TPU was used as the flexible polymer matrixmaterial and CNTs as the conductive filler to print CPC-basedpressure-sensing elements using SLS. First, CNT powder wasdispersed in TPU powder using a strong acid oxidation meth-od combined with a ball mill dispersion method, and the dis-persion of the CNT powder was observed by combining withscanning electronic microscopy (SEM). A three-factor four-level orthogonal experimental design was performed, and theinfluence of the SLS process on the molding quality and sens-ing performance of the TPU/CNT sensing element wasdiscussed. The optimized TPU/CNT sensing element was test-ed for its sensing performance (such as piezoresistive sensi-tivity, pressure measurement range, response time, and stabil-ity under cyclic load).
2 Materials and methods
2.1 SLS experimental equipment
Fabrication of the TPU/CNT sensing element and moldingprocessing were mainly achieved using SLS equipment(AFS-360, Beijing Long Yuan Technology Ltd.) equippedwith a CO2 laser generator (laser power of 55 W and laserspot diameter of 0.20 mm). The dimensions of the formingbox were 360mm× 360mm× 500mm, with a layer thicknessrange of 0.1 to 0.3 mm.
2.2 Materials
Carbon nanotube powder with an average diameter of 5–15nm and an average length of 0.5–1.5 μm was supplied byShenzhen Turing Evolution Technology Co., Ltd., China.Thermoplastic polyurethane powder with an average graindiameter of 80 μm (LUVOSINT X92A-1) was purchasedfrom Luvocom, Germany, as shown in Fig. 1a. Concentratedsulfuric acid (H2SO4, 96–98%) and concentrated nitric acid(HNO3, 68%) were supplied by Sinopharm Chemical ReagentCo., Ltd., China.
2212 Int J Adv Manuf Technol (2021) 112:2211–2222

2.3 Preparation of TPU/CNT composites
The properties of the TPU/CNT sensing elements depend onthe dispersion of the CNTs in the TPU matrix and on theinterfacial binding force between the CNTs and TPU.Therefore, they were pre-treated using a strong acid oxidationmethod to directly modify the surface of the CNTs and im-prove their dispersion in the TPU matrix [28].
The TPU/CNT composites were prepared as follows: mixconcentrated H2SO4 and HNO3 in a beaker at a ratio of 3:1with CNTs and magnetically stir them at 80 °C for 2 h. Afterstanding and stratification, the CNTs were filtered out andwashed with deionized water until the pH was neutral. Then,the CNTs were dried and put into a planetary ball mill with agrinding speed of 240 r/min and a grinding time of 2 h. Thecrushed CNT powder and TPU were put into an SHR50Ahigh-speed mixer at a ratio of 0.25 wt% and stirred for2 min at a speed of 700 r/min to obtain TPU/CNT compositepowder. As shown in Fig. 1b, the CNTs are still slightly ag-gregated after strong acid oxidation and crushing, but they areevenly distributed on the surface of the TPU.
2.4 Methods
2.4.1 Orthogonal experiment design
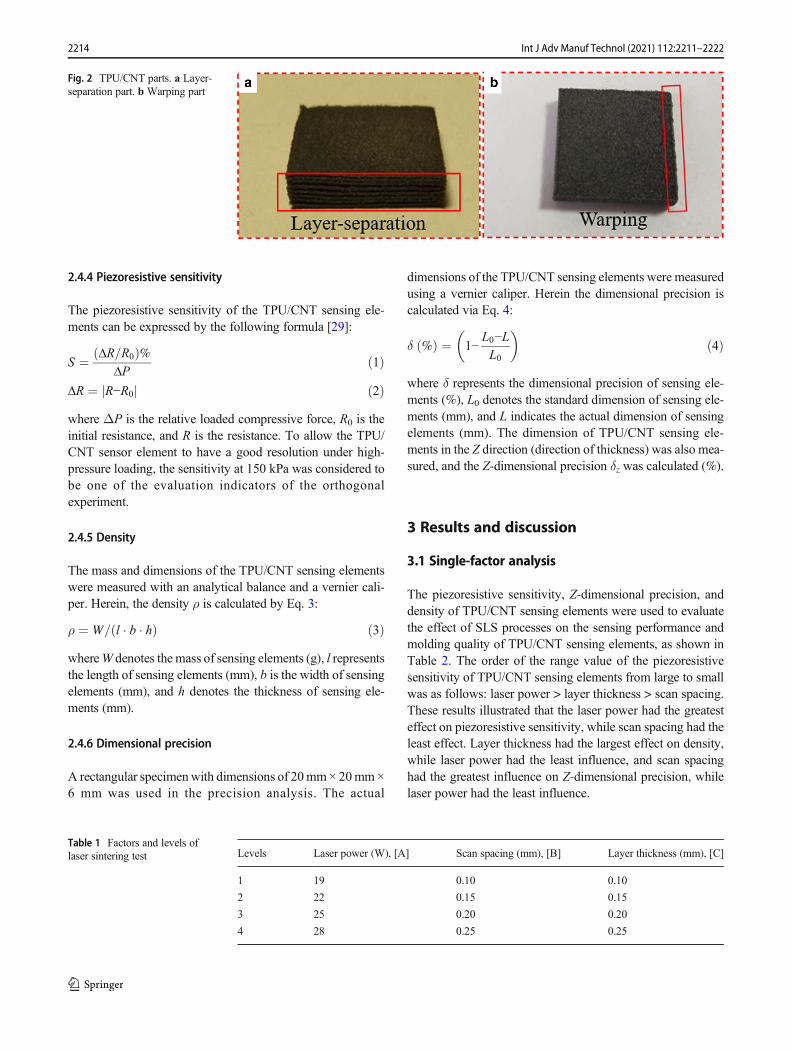
The piezoresistive sensitivity, density, and dimensional preci-sion of TPU/CNT sensing elements are important factors toevaluate sensing performance and formability. These factorsmainly depend on main SLS process parameters such as laserpower, layer thickness, and scan spacing. To determine therange of processing parameters, we conducted some experi-ments in advance. The experiments showed that both largelayer thickness (0.3 mm) and low laser power (17 W) led todelamination of the part (Fig. 2a), and no resistance change canbe detected. Furthermore, due to the limitation of the SLSequipment’s accuracy, the minimum layer thickness was spec-ified as 0.1 mm. High laser power (30 W) caused excessivesintering, resulting in warping and degrading of parts (Fig. 2b).
Hence, the laser power was set at a range of 19–28 W and thelayer thickness range was 0.1–0.25 mm. Additionally, since thelaser is a Gaussian heat source, the scan spacing has a greatinfluence on the heat absorption of the material. When the scanspacing is large, a continuous sintered surface cannot be formedbetween the scanning lines. If the scan spacing is too small, thesintered powder will absorb too much heat, and the scanninglines will overlap considerably, resulting in excessive sintering.The sintering efficiency and quality will be unsatisfactory, sothe scan spacing was set at a range of 0.1–0.25 mm. An SLSexperiment was performed using an orthogonal experiment de-sign scheme of three factors and four levels. The test scheme isshown in Table 1.
2.4.2 Scanning electronic microscopy
Scanning electronic microscopy (FEI Quanta 200microscope,Hewlett-Packard Company, Netherlands) was used to observethe morphologies of the TPU/CNT powders and TPU/CNTsensing elements. Since the materials are non-conductive, thespecimens were first sputtered with gold using SEMspecimen-coating equipment.
2.4.3 Piezoresistive response tests
The piezoresistive response experiment equipment was main-ly composed of two parts: a mechanical testing machine and ahigh-precision multimeter, as shown in Fig. 3. The electronicuniversal testing machine (Byes-3003, Bangyi PrecisionMeter Co., Ltd.) was used to provide external pressure, andthe high-precision multimeter (Victor 8165A) was used torecord the resistance change of the TPU/CNT sensing ele-ments under pressure. The upper and lower sides of the SLSTPU/CNT sensing element samples (Φ25 × 3 mm3) wereglued with a pair of copper electrodes with conductive silverglue to ensure good contact between the samples and the elec-trodes. The sensing elements were compressed by jogging,and a high-precision multimeter was used to record changesin their resistance.
Fig. 1 aMicromorphology of theTPU powder. bMicromorphology of the TPU/CNT powder
2213Int J Adv Manuf Technol (2021) 112:2211–2222
2.4.4 Piezoresistive sensitivity
The piezoresistive sensitivity of the TPU/CNT sensing ele-ments can be expressed by the following formula [29]:
S ¼ ΔR=R0ð Þ%ΔP
ð1Þ
ΔR ¼ R−R0j j ð2Þwhere ΔP is the relative loaded compressive force, R0 is theinitial resistance, and R is the resistance. To allow the TPU/CNT sensor element to have a good resolution under high-pressure loading, the sensitivity at 150 kPa was considered tobe one of the evaluation indicators of the orthogonalexperiment.
2.4.5 Density
The mass and dimensions of the TPU/CNT sensing elementswere measured with an analytical balance and a vernier cali-per. Herein, the density ρ is calculated by Eq. 3:
ρ ¼ W= l � b � hð Þ ð3ÞwhereW denotes the mass of sensing elements (g), l representsthe length of sensing elements (mm), b is the width of sensingelements (mm), and h denotes the thickness of sensing ele-ments (mm).
2.4.6 Dimensional precision
A rectangular specimenwith dimensions of 20mm× 20mm×6 mm was used in the precision analysis. The actual
dimensions of the TPU/CNT sensing elements were measuredusing a vernier caliper. Herein the dimensional precision iscalculated via Eq. 4:
δ %ð Þ ¼ 1−L0−LL0
� �ð4Þ
where δ represents the dimensional precision of sensing ele-ments (%), L0 denotes the standard dimension of sensing ele-ments (mm), and L indicates the actual dimension of sensingelements (mm). The dimension of TPU/CNT sensing ele-ments in the Z direction (direction of thickness) was also mea-sured, and the Z-dimensional precision δz was calculated (%).
3 Results and discussion
3.1 Single-factor analysis
The piezoresistive sensitivity, Z-dimensional precision, anddensity of TPU/CNT sensing elements were used to evaluatethe effect of SLS processes on the sensing performance andmolding quality of TPU/CNT sensing elements, as shown inTable 2. The order of the range value of the piezoresistivesensitivity of TPU/CNT sensing elements from large to smallwas as follows: laser power > layer thickness > scan spacing.These results illustrated that the laser power had the greatesteffect on piezoresistive sensitivity, while scan spacing had theleast effect. Layer thickness had the largest effect on density,while laser power had the least influence, and scan spacinghad the greatest influence on Z-dimensional precision, whilelaser power had the least influence.
Table 1 Factors and levels oflaser sintering test Levels Laser power (W), [A] Scan spacing (mm), [B] Layer thickness (mm), [C]
1 19 0.10 0.10
2 22 0.15 0.15
3 25 0.20 0.20
4 28 0.25 0.25
Fig. 2 TPU/CNT parts. a Layer-separation part. b Warping part
2214 Int J Adv Manuf Technol (2021) 112:2211–2222

3.1.1 Analysis of the effect of process parameterson piezoresistive sensitivity
Through the orthogonal experiment, the effects of the SLSprocess on the piezoresistive sensitivity of TPU/CNT sensingelements were obtained, as shown in Fig. 4. Figure 4a showsthat with increasing laser power, the sensitivity of TPU/CNTsensing elements was increased. Owing to low laser power,the internal pores of the TPU/CNT sensing elements were toolarge, and the distance between the CNTs distributed in theTPU particles was too wide (Fig. 5a, b). It was not easy toform a conductive path. As the pressure increased, the numberof conductive paths to be constructed was less than the num-ber to be destroyed, resulting in smaller changes inpiezoresistive sensitivity. As the laser power increased, theTPU particles inside the sensing element melted more (Fig.5c), the conductive particle spacing was reduced, and it waseasier to form a conductive path during loading. Additionally,it can be seen from Fig. 5c and d that when the laser powerwas 25 W, the inside of the sensing element was alreadydense, and when the power was increased to 28 W, sphericalholes appeared inside the sensing element. This was becausehigher power causes the materials to overburn, and the gener-ated gas could not be discharged and formed smaller closedholes, which led to a continued increase in sensitivity.Research by scholars such as Chen et al. [10] and Jung et al.[30] has shown that the micropores and porous structure may,
to some extent, increase the sensitivity of sensing elements,which also confirms the phenomenon produced in this study.
Figure 4b shows that as the scan spacing increased, thesensitivity first decreased and then increased. For TPU/CNTsensing elements with different scan spacings, the differencein internal pores mainly occurred in every single layer of thesensors. Through the transverse deformation of the TPU parti-cles, the pores of the sensing element were reduced and thesensitivity was improved. As shown in Fig. 6a, when the scanspacing was small (0.10 mm), the internal pore spacing wassmall, and conductive paths were easily formed under pressure.The pores in the single layer became larger with an increase ofthe scan spacing (0.15–0.20 mm), and the distance caused bythe increase of the scan spacing was longer, and the damagedconductive path was larger than the constructed conductivepath, resulting in a decrease in sensitivity. Since the laser spotdiameter is 0.20 mm, when the scanning distance increased to0.25 mm, the powder inside the TPU/CNT sensing elementwas not completely fused, and there were fewer conductivepaths formed in the lateral direction. As the pressure increased,the TPU particles were deformed laterally, the distance betweenthe conductive particles was shortened, more conductive pathswere constructed, and the sensitivity increased.
Figure 4c shows that as the layer thickness increased, thesensing element sensitivity first increased and then decreased.When the layer thickness was 0.1 mm, the inside of the sens-ing element was dense (Fig. 6b), and the polyurethane
Fig. 3 A schematic diagram ofthe test setup
Table 2 Range values of theeffect of process parameters onthe quality of TPU/CNT sensingelements
Levels Laser power (W), [A] Scan spacing (mm), [B] Layer thickness (mm), [C]
Sensitivity (%/kPa) 5.5 1.138 5.229
Density (g/cm3) 0.102 0.173 0.219
Z-dimensional precision (%) 2.188 8.646 4.438
2215Int J Adv Manuf Technol (2021) 112:2211–2222

particles moved less under applied pressure. The transitionwas mainly caused by the change of the internal conductionparticle spacing, and the resistance change was not obvious,so the sensitivity was small. As the thickness of the layerincreased, pores were generated inside (Fig. 6c). The possibil-ity of contact between internal conductive particles graduallyincreased under applied pressure, thus increasing sensitivity.However, when the layer thickness increased to 0.25 mm, itwas difficult to form a conductive path. When pressure wasapplied, the number of conductive paths constructed wassmaller than the number destroyed, resulting in smaller chang-es in piezoresistive sensitivity.
3.1.2 Analysis of the effects of process parameters on density
The effects of the process parameters on the density of TPU/CNT sensing elements are shown in Fig. 7. Figure 7a showsthat with an increase in laser power, the laser energy absorbedby TPU/CNT powder increased, the powder was completelyfused, and the quantities of the internal pores of TPU/CNT
sensing elements decreased. Thus, the density of TPU/CNTsensing elements increased. When the input power of the laserremained constant, Fig. 7b and c show that with the increase inscan spacing, the re-sintering zone was reduced, the powerabsorbed by the TPU/CNT powder gradually decreased, thepowder was not fully fused, and the amounts of internal poresgradually increased. Thus, the densities of TPU/CNT sensingelements decreased. With increasing layer thickness, the pow-er absorbed by the combination zone between layers de-creased, and the number of internal pores of TPU/CNT sens-ing elements increased. Therefore, the density of sensing ele-ments decreased.
3.1.3 Analysis of the effect of process parameterson Z-dimensional precision
The effects of the process parameters on the Z-dimensionalprecision of TPU/CNT sensing elements are shown in Fig. 8.Figure 8a–c show that with increased laser power, the powerabsorbed by TPU/CNT powder increased. The power diffused
19 22 25 28
2
4
6
8
aP
k%(
ytivitis
neS
-1)
Laser power (W)0.10 0.15 0.20 0.25
2
4
6
8
aP
k%(
ytivitis
n eS
-1)
Scan spacing (mm)0.10 0.15 0.20 0.25
2
4
6
8
%(yti
vitisne
Sa
Pk
-1)
Layer thickness (mm)
a b c
Fig. 4 Effects of process parameters on the piezoresistive sensitivity of TPU/CNT sensing elements. a Laser power. b Scan spacing. c Layer thickness
Fig 5 Micromorphology of thecross sections of the TPU/CNTsensing element with different la-ser power values. a Laser power19 W. b A magnified image of a.c Laser power 25 W. d Laserpower 28 W
2216 Int J Adv Manuf Technol (2021) 112:2211–2222

along the laser sintering path and the sintered depth was in-creased, which increased the dimension of TPU/CNT sensingelements in the Z direction, decreasing the Z-dimensional pre-cision. Following an increase in scan spacing, the re-sinteringzone was reduced, and the sintered depth decreased, resultingin increased Z-dimensional precision. When the input powerof the laser remained constant, with increasing layer thickness,the sintered depth decreased, and thus, the Z-dimensional di-rection of TPU/CNT sensing elements decreased. Therefore,Z-dimensional precision improved.
3.2 Multi-index synthetic analysis
3.2.1 Synthetic weighted evaluation
Multi-index test results were evaluated using a syntheticweighted scoring method. The synthetic weighted scoringmethod is a method by which multi-index weights were de-termined based on the importance of each test index in thewhole test. The piezoresistive sensitivity, density, and Z-di-mensional precision test results were transformed into thesingle-index test results, and then the test scheme was opti-mized according to a single-index analysis method.
The piezoresistive sensitivity, density, and Z-dimen-sional precision were transformed into dimensionlessforms. The transformations were performed followingEqs. 5–7:
Z1 ¼ S−Sminð Þ= Smax−Sminð Þ ð5ÞZ2 ¼ ρ−ρminð Þ=ρmax−ρmin ð6ÞZ3 ¼ δ−δminð Þ= δmax−δminð Þ ð7Þ
3.2.2 Synthetic weights of test index
Sensitivity affects the sensing performance and measurementrange of the pressure-sensing element. When the measure-ment range is sufficient, the higher the sensitivity, the betterthe resolution of pressure detection. The density of TPU/CNTsensing elements was higher, indicating that the inner struc-ture of the sensing element was denser and that the internalconductive network structure was not easily destroyed. Thehigher Z-dimensional precision revealed better forming preci-sion. The test indexes were given weights based on the impor-tance of the test indexes. In general, higher weights were givento indexes of more subjective importance.
a b
c
Fig 6 a Schematic diagram of theconductive path formed by TPU/CNT sensing elements with dif-ferent scan spacings after com-pression. b Micromorphology ofthe cross sections of the TPU/CNT sensing element with a layerthickness of 0.10 mm. cMicromorphology of the crosssections of the TPU/CNT sensingelement with a layer thickness of0.15 mm
19 22 25 280.75
0.80
0.85
0.90
0.95
1.00
mc/g(
ytisne
D3)
Laser power (W)0.10 0.15 0.20 0.25
0.75
0.80
0.85
0.90
0.95
1.00
mc/g(
ytisne
D3)
mc/g(
y ti sne
D3)
Scan spacing (mm)0.10 0.15 0.20 0.25
0.75
0.80
0.85
0.90
0.95
1.00
Layer thickness (mm)
a b c
Fig 7 Effect of process parameters on the density of TPU/CNT sensing elements. a Laser power. b Scan spacing. c Layer thickness
2217Int J Adv Manuf Technol (2021) 112:2211–2222

The effect of piezoresistive sensitivity was the key consid-eration, and the density and Z-dimensional precision weresecondary considerations. The weights of piezoresistive sen-sitivity, density, and Z-dimensional precision were λ1 = 0.5,λ2 = 0.3, and λ3 = 0.2, respectively. Therefore, the syntheticweighted scoring values are shown by Eq. 8:
Z ¼ λ1Z1 þ λ2Z2 þ λ3Z3 ð8Þ
3.2.3 Results and analysis of the test
Test data were processed using the synthetic weighted scoringmethod. The range analysis results of piezoresistive
sensitivity, density, and Z-dimensional precision were obtain-ed, as shown in Table 3.
Scan spacing and layer thickness were large because thelaser power of the fourth group of orthogonal experiments wastoo small, resulting in a slight layering phenomenon in thelaser sintering sensing elements. Hence, so the resistance sig-nal could not be detected, and the sensitivity was set to 0.Table 3 shows that the range of laser power (A) was the larg-est, which had the greatest effect on the test index. Level 4 wassuitable for A. The range of layer thickness (C) was smallerthan that of A, implying its effect was less. Level 3 was suit-able for C. The range of scan spacing (B) was the smallest;hence, its influence was the least. Level 2 was suitable for C.
19 22 25 2888
90
92
94
96
98
100
)%(
noisicer
pla
nois
nemi
D
Laser power (W)0.10 0.15 0.20 0.25
88
90
92
94
96
98
100
)%(
noisicer
pl a
nois
nemi
D
Scan spacing (mm)0.10 0.15 0.20 0.25
88
90
92
94
96
98
100
)%(
noisicer
pla
nois
nemi
D
Layer thickness (mm)
a b c
Fig. 8 Effect of process parameters on Z-dimensional precision of TPU/CNT sensing elements. a Laser power. b Scan spacing. c Layer thickness
Table 3 Laser sintering process scheme and experimental results of TPU/CNT sensing elements
Serialnumber
Laser power (W)[A]
Scan spacing (mm)[B]
Layer thickness (mm)[C]
Test index
Sensitivity(%/kPa)
Density(g/cm3)
Dimensional precision(%)
Syntheticweight
1 19 0.1 0.1 2.378 1.018 86.33 0.353
2 19 0.15 0.15 5.192 0.893 94.94 0.482
3 19 0.2 0.2 2.811 0.725 97.94 0.330
4 19 0.25 0.25 0 0.631 99.83 0.200
5 22 0.1 0.15 5.405 0.989 87.89 0.454
6 22 0.15 0.1 8 0.875 94.56 0.554
7 22 0.2 0.25 11.243 0.733 97.92 0.607
8 22 0.25 0.2 2.605 0.902 96.00 0.421
9 25 0.1 0.2 6.706 0.941 90.00 0.492
10 25 0.15 0.25 7.351 0.834 96.28 0.529
11 25 0.2 0.1 5.4 1.012 94.78 0.572
12 25 0.25 0.15 7.783 0.824 96.94 0.546
13 28 0.1 0.25 12.325 0.910 90.22 0.654
14 28 0.15 0.1 1.73 1.050 89.39 0.401
15 28 0.2 0.15 2.815 0.904 94.44 0.406
16 28 0.25 0.2 15.51 0.812 96.25 0.776
K1 0.341 0.488 0.437 Optimum combination: A4C3B2K2 0.509 0.492 0.472
K3 0.535 0.479 0.538
K4 0.559 0.486 0.498
R 0.218 0.013 0.101
2218 Int J Adv Manuf Technol (2021) 112:2211–2222

Thus, A4C3B2 was the optimum combination of various fac-tors, namely, the laser power was 28 W, the scan spacing was0.15 mm, and the layer thickness was 0.2 mm.
The optimized process parameters were compared with theoptimum combination of comprehensive weighted scores(Table 3), and the analysis results are presented in Table 4.Table 4 shows that using the optimized SLS process parame-ters, the density of the TPU/CNT sensing elements was 12.8%higher than that of the optimum combination, and the Z-di-mensional precision was reduced by 1.94%. To further under-stand the changes of the optimum process parameters and theoptimized sensing performance of the TPU/CNT sensing ele-ments, the piezoresistive sensitivity of the TPU/CNT sensingelements are plotted in Fig. 9a for comparison. Figure 9ashows that when high loading was applied, although theTPU/CNT sensing elements prepared with the optimum pro-cess parameters were more sensitive than the optimized sens-ing element, they were more sensitive to detecting large pres-sure loads. However, due to large internal pores in the TPU/CNT sensors, no internal conductive network was formed inthe initial stage of pressure loading, and the resistance signal
could not be detected until the load reached 30 kPa.Additionally, during the pressure unloading process, the opti-mum parameter sensing elements had a certain hysteresis, andwhen unloaded to 40 kPa, the resistance could not be detectedwhen unloaded to 40 kPa. It may be because there were manypores in the TPU/CNT sensing elements. When high loadingis applied, the internal conductive network structure wasdestroyed and could not be restored to its initial resistance.
A wide pressure detection range (3–240 kPa) and no obvi-ous hysteresis during pressure loading and unloading wereseen because the optimized TPU/CNT sensing elements coulddetect small pressures. Although sensitivity was low underlarge pressure loads, it was almost the same as that of theflexible pressure-sensing elements reported by He et al. [31]and Yang et al. [32]; thus, the optimized TPU/CNT sensingelements were used for subsequent research on their sensingperformance.
In addition to sensitivity and pressure detection range, theresponse time and reproductivity during cyclic testing werealso important indicators for identifying important sensors.Therefore, we conducted a follow-up experimental test on
Table 4 Contrast data of testresults Test
contrastLow loading High loading Density
(g/cm3)Z-dimensionalprecision(%)
Pressure(kPa)
Sensitivity(/kPa)
Pressure(kPa)
Sensitivity(/kPa)
Optimized 3–70 1.357 70-240 0.0328 0.916 94.38
Optimum 30–70 0.991 70-240 0.162 0.812 96.25
Fig. 9 a Comparison ofresistance change (ΔR/R0) curvesof the optimized TPU/CNT sens-ing elements and optimum TPU/CNT sensing elements. b The re-sistance changes after a suddenincrease in pressure from 22 to 30kPa. c Long-term stability of theTPU/CNT sensing elements over500 cycles at a compression strainof 10%
2219Int J Adv Manuf Technol (2021) 112:2211–2222

the sensing performance of the optimized TPU/CNT sensingelements. As shown in Fig. 9b, the response time to a suddenpressure input of 30 kPa was 33 ms. Compared with the re-sponse times of other sensors, this response time was almostidentical to the value from other sensors [15, 33]. Meanwhile,the durability and stability of the TPU/CNT sensing elementswere further evaluated over 500 cycles at a compression strainof 10% (Fig. 9c). The resistance changed periodically, and noobvious fluctuation of the sensing signal was observed. After500 compression cycles, the strain sensing pattern remainedstable, and the repeatability error was less than 3.58%, indi-cating that the conductive network was very stable, which wasbeneficial for stable sensing. All of these indicate that theoptimized TPU/CNT sensing elements have high repeatabili-ty, fast response, stability, and durability. To compare theoptimized TPU/CNT sensing elements with flexible pressure
sensors prepared by other processing technologies, the com-parison report of the main parameters of the latest pressuresensor is presented in Table 5. The report shows that theSLS TPU/CNT sensor has the advantages of high sensitivity,good stability, and fast response time, but with a small pres-sure, it has no resistance response. In a future work, we willcontinue to explore post-processing and broaden the pressuremeasurement range.
3.3 Application
To illustrate the applicability of the sensing performance ofTPU/CNT sensing elements, we used a three-dimensional scan-ner to scan and model the human foot and used laser-sinteredTPU/CNT composites to prepare pressure-sensing insoles todetect the distribution of plantar pressure (Fig. 10a). The upper
Table 5 Contrast data of test results
Materials Sensitivity: /kPa Pressure range: kPa Responsetime: ms
Processing technology Ref. number
TPU/CNT composites 0.162–0.991 3–240 33 SLS technology This manuscript
MWCNT and TPU foam 0.013–0.032 0–200 29 Direct attachment method [15]
MWCNT/PU composites 0.0428 0–63 – Casting technology [31]
Graphene foam 0.36 0–5 80 Chemical and thermal reduction processes [32]
MWCNT and rGO loaded PU foam 0.034–0.088 0–48.8 30 Drying directly after soaking [33]
Fig. 10 a The TPU/CNT sensing insole preparation process. b Resistance change (ΔR/R0) of four sensing positions under single-point pressure-loadingexperiment. c Fitting values of pressure distribution and resistance changes at four sensing positions of the sole
2220 Int J Adv Manuf Technol (2021) 112:2211–2222

and lower sides of the four main positions of the sensing insolewere, respectively, bonded with a pair of copper electrodes andconductive silver glue to ensure good contact between the in-sole and the electrodes. The four groups of electrodes wereconnected to a high-precision multimeter to collect the resis-tance signal of the plantar pressure. The four pressure-sensingpositions were the first metatarsal bone, the second and thirdmetatarsal bones, the fourth and fifth metatarsal bones, and theheel (Fig. 10a).
Before the test, the pressure-sensing insole was placed onthe pressure-loading platform, and the single-point pressure-loading experiment was carried out on the four test points. Tocalibrate the pressure load of each test point, control thechange of the loading force through the controller and recordthe resistance change of each sensing position. During the test,the subject took off his shoes, with feet shoulder-width apartand stood on the sensing insole. The test time was 9–10 s, andthe test was performed five times, and the results were input-ted into a computer; the data were fitted to measure the pres-sure experienced by each test point.
Figure 9b shows the resistance changes of the four pressuredetection positions. Since the sensing insoles were modeledaccording to the human foot, the generated complex three-dimensional curved surface had a slight impact on the resis-tance changes of each test point (Fig. 10b). Figure 10c showsthe fitting values of pressure distribution and resistance chang-es at four sensing positions of the insole. The highest pressurewas detected at the fourth and fifth metatarsal bones, at ap-proximately 191.22 kPa, followed by the second and thirdmetatarsal bones and the heel, and the first metatarsal boneexperienced the least stress. The detected pressure range wasconsistent with the normal adult plantar pressure range report-ed by Zhang [34] and Veves et al. [35]. Therefore, it has beendemonstrated that the optimized TPU/CNT sensing elementscan be used to measure biological and motion signals, andsensing elements can be installed according to demand, pro-viding new technical solutions for human movement detec-tion, smart wearable devices, medical rehabilitation, and otherfields.
4 Conclusions
The orthogonal experiment design method and the compre-hensive weight method were used to optimize the multi-objectives and prepare the TPU/CNT pressure sensor elementwith good flexible sensing performance. The optimized SLSTPU/CNT sensing element density was increased by 12.8%;the Z-direction accuracy was reduced by 1.94%, and the sens-ing element has a wide pressure detection range (3–240 kPa)and high sensitivity (1.357/kPa for 3–70 kPa, 0.0328/kPa for70–240 kPa); its response time can reach 33ms, and it still hasgood stability and durability after 500 loads (10% strain).
Finally, the flexible pressure-sensing element was successful-ly applied to detect human foot pressure. This work provides agood research foundation for smart wearable devices and hu-man motion detection and presents a simple and effectivemethod to develop flexible pressure sensors.
Author contributions Methodology and data curation, Y.Z. and K.J.;formal analysis, Y.Y.; design and performance of the experiments, S.G.and H.Z.; writing—original draft preparation, Y.Z.; writing—review andediting, J.L.; project administration, Y.G. and J.L.; funding acquisitionand resources, Y.G. All authors have read and agreed to the publishedversion of the manuscript.
Funding This research was funded by National Natural ScienceFoundation of China, grant number 52075090; the key projects of pro-vincial fund, grant number ZD2017009; Fundamental Research Fundsfor the Central Universities, grant number 2572019AB20; the KeyNational Research and Development Programs, grant number2017YFD0601004; and Double First-Class Fund of Northeast ForestryUniversity, grant number 41113253.
Compliance with ethical standards
Conflict of interest The authors declare that they have no conflict ofinterest.
Open Access This article is licensed under a Creative CommonsAttribution 4.0 International License, which permits use, sharing, adap-tation, distribution and reproduction in any medium or format, as long asyou give appropriate credit to the original author(s) and the source, pro-vide a link to the Creative Commons licence, and indicate if changes weremade. The images or other third party material in this article are includedin the article's Creative Commons licence, unless indicated otherwise in acredit line to the material. If material is not included in the article'sCreative Commons licence and your intended use is not permitted bystatutory regulation or exceeds the permitted use, you will need to obtainpermission directly from the copyright holder. To view a copy of thislicence, visit http://creativecommons.org/licenses/by/4.0/.
References
1. Hu W, Lum GZ, Mastrangeli M, Sitti M (2018) Small-scale soft-bodied robot with multimodal locomotion. Nature 554:81–85.https://doi.org/10.1038/nature25443
2. Lipomi DJ, VosgueritchianM, Tee BC, Hellstrom SL, Lee JA, FoxCH, Bao Z (2011) Skin-like pressure and strain sensors based ontransparent elastic films of carbon nanotubes. Nat Nanotechnol 6:788–792. https://doi.org/10.1038/nnano.2011.184
3. Wang Z, Hao Z, Yu S, Huang C, Pan Y, Zhao X (2020) A wearableand deformable graphene-based affinity nanosensor for monitoringof cytokines in biofluids. Nanomaterials 10:1503–1512. https://doi.org/10.3390/nano10081503
4. Zhuang Y, Guo Y, Li J, Jiang K, Yu Y, Zhang H, Liu D (2020)Preparation and laser sintering of a thermoplastic polyurethane car-bon nanotube composite-based pressure sensor. RSC Adv 10:23644–23652. https://doi.org/10.1039/D0RA04479B
5. Lu H, Zhang M, Yang Y, Huang Q, Fukuda T, Wang Z, Shen Y(2018) A bioinspired multilegged soft millirobot that functions inboth dry and wet conditions. Nat Commun 9:3944–3952. https://doi.org/10.1038/s41467-018-06491-9
2221Int J Adv Manuf Technol (2021) 112:2211–2222

6. Liu H, Li Q, Zhang S, Yin R, Liu X, He Y, Dai K, Shan C, Guo J,Liu C, Shen C, Wang X, Wang N, Wang Z, Wei R, Guo Z (2018)Electrically conductive polymer composites for smart flexible strainsensors: a critical review. J Mater Chem C 6:12121–12141. https://doi.org/10.1039/C8TC04079F
7. Liu H, HuangW, Yang X, Dai K, Zheng G, Liu C, Shen C, Yan X,Guo J, Guo Z (2016) Organic vapor sensing behaviors of conduc-tive thermoplastic polyurethane-graphene nanocomposites. J MaterChem 4:4459–4469. https://doi.org/10.1039/C6TC00987E
8. Yin R, Yang S, Li Q, Zhang S, Shen C (2020) Flexible conductiveAg nanowire/cellulose nanofibril hybrid nanopaper for strain andtemperature sensing applications. Sci Bull 65:899–908. https://doi.org/10.1016/j.scib.2020.02.020
9. Liu H, Li Q, Bu Y, Zhang N, Shen C (2019) Stretchable conductivenonwoven fabrics with self-cleaning capability for tunable wearablestrain sensor. Nano Energy 2019:104143–104152. https://doi.org/10.1016/j.nanoen.2019.104143
10. Chen XY, Liu H, Zheng YJ, Zhai Y, Liu X, Liu C, Mi L, Guo Z,Shen C (2019) Highly compressible and robust polyimide/carbonnanotube composite aerogel for high-performance wearable pres-sure sensor. ACS Appl Mater Interfaces 11:42594–42606. https://doi.org/10.1021/acsami.9b14688
11. Small WR, Panhuis MIH (2007) Inkjet printing of transparent, elec-trically conducting single-waited carbon-nanotube composites.Small 3:1500–1503. https://doi.org/10.1002/smll.200700110
12. Pargoletti E, Cappelletti G (2020) Breakthroughs in the design ofnovel carbon-based metal oxides nanocomposites for VOCs gassensing. Nanomaterials 10:1485. https://doi.org/10.3390/nano10081485
13. Michelis F, Bodelot L, Bonnassieux Y, Lebental B (2015) Highlyreproducible, hysteresis-free, flexible strain sensors by inkjet print-ing of carbon nanotubes. Carbon 95:1020–1026. https://doi.org/10.1016/j.carbon.2015.08.103
14. Liu H, Huang W, Gao J, Dai K, Zheng G, Liu C, Shen C, Yan X,Guo J, Guo Z (2016) Piezoresistive behavior of porous carbonnanotube-thermoplastic polyurethane conductive nanocompositeswith ultrahigh compressibility. Appl Phys Lett 108:011904.https://doi.org/10.1063/1.4939265
15. Lee J, Kim J, Shin Y, Jung I (2019) Ultra-robust wide-range pres-sure sensor with fast response based on polyurethane foam doublycoated with conformal silicone rubber and CNT/TPU nanocompos-ites islands. Compos Part B 177:107364.1–107364.10. https://doi.org/10.1016/j.compositesb.2019.107364
16. Zhai Y, Lados DA, LaGoy JL (2014) Additive manufacturing:making imagination the major limitation. JOM 66:808–816.https://doi.org/10.1007/s11837-014-0886-2
17. Ling Z,Wu J,Wang X, Li XF, Zheng JJ (2019) Experimental studyon the variance of mechanical properties of polyamide 6 duringmulti-layer sintering process in selective laser sintering. Int J AdvManuf Technol 101:1227–1234. https://doi.org/10.1007/s00170-018-3004-8
18. KucewiczM, Baranowski P,Malachowski J, Poplawski A, Platek P(2018) Modelling, and characterization of 3D printed cellular struc-tures. Mater Des 142:177–189. https://doi.org/10.1016/j.matdes.2018.01.028
19. Abbott AC, Tandon GP, Bradford RL, Koerner H, Baur JW (2018)Process-structure-property effects on ABS bond strength in fusedfilament fabrication. Addit Manuf 19:29–38. https://doi.org/10.1016/j.addma.2017.11.002
20. Mohsenizadeh M, Gasbarri F, Munther M, Beheshti A, Davami K(2018) Additively-manufactured lightweight Metamaterials for en-ergy absorption. Mater Des 139:521–530. https://doi.org/10.1016/j.matdes.2017.11.037
21. Yu Y, Guo Y, Jiang T, Jiang K, Li J, Guo S (2017) Laser sinteringand post-processing of a walnut shell/Co-PES composite. RSCAdv7:23176–23181. https://doi.org/10.1039/C7RA00775B
22. Fayed EM, Elmesalamy AS, Sobih M, Elshaer Y (2018)Characterization of direct selective laser sintering of alumina. IntJ Adv Manuf Technol 94:2333–2341. https://doi.org/10.1007/s00170-017-0981-y
23. Li Y, Luo SD, Yang MC, Liang R, Zeng CC (2016) Poisson ratioand piezoresistive sensing: a new route to high-performance 3Dflexible and stretchable sensors of multimodal sensing capability.Adv Funct Mater 26:2900–2908. https://doi.org/10.1002/adfm.201505070
24. Shirazi SFS, Gharehkhani S, Mehrali M, Yarmand H, MetselaarHSC, Adib Kadri N, Osman NAA (2015) A review on powder-based additive manufacturing for tissue engineering: selective lasersintering and inkjet 3D printing. Sci Technol Adv Mater 16:033502. https://doi.org/10.1088/1468-6996/16/3/033502
25. Dizon JRC, Espera AH, Chen Q, Advincula RC (2018)Mechanicalcharacterization of 3D-printed polymers. Addit Manuf 20:44–67.https://doi.org/10.1016/j.addma.2017.12.002
26. Flores I, Kretzschmar N, Azman AH, Chekurov S, Pedersen DB,Chaudhuri A (2020) Implications of lattice structures on economicsand productivity of metal powder bed fusion. Addit Manuf 31:100947. https://doi.org/10.1016/j.addma.2019.100947
27. Arısoy YM, Criales LE, Özel T, Lane B, Moylan S, Donmez A(2017) Influence of scan strategy and process parameters on micro-structure and its optimization in additively manufactured nickelalloy 625 via laser powder bed fusion. Int J Adv Manuf Technol90:1393–1417. https://doi.org/10.1007/s00170-016-9429-z
28. Luo RP (2013) Research on synthesis and performance of carbonnanotubes/ graphene/ epoxy resin composites, Master Dissertation,East China University of Science and Technology, Shanghai,China.
29. He Y, Li W, Yang G, Liu H, Lu J, Zheng T, Li X (2017) A Novelmethod for fabricating wearable, piezoresistive, and pressure sen-sors based on modified-graphite/polyurethane composite films.Materials (Basel) 10:684–699. https://doi.org/10.3390/ma10070684
30. Jung S, Kim JH, Kim J, Choi S, Lee J, Park I, Hyeon T, Kim D(2014) Reverse-micelle-induced porous pressure-sensitive rubberfor wearable human-machine interfaces. Adv Mater 26:4825–4830. https://doi.org/10.1002/adma.201401364
31. He Y, Ming Y, Li W, Li Y, Wu M, Song J, Li X, Liu H (2018)Highly stable and flexible pressure sensors with modified multi-walled carbon nanotube/polymer composites for human monitor-ing. Sensors (Basel) 18:1338. https://doi.org/10.3390/s18051338
32. Yang J, Ye Y, Li X, Lu X, Chen R (2018) Flexible, conductive, andhighly pressure-sensitive graphene-polyimide foam for pressuresensor application. Compos Sci Technol 164:187–194. https://doi.org/10.1016/j.compscitech.2018.05.044
33. Tewari A, Gandla S, Bohm S,McNeill CR, Gupta D (2018) Highlyexfoliated MWNT-rGO ink wrapped polyurethane foam forpiezoresistive pressure sensor applications. ACS Appl MaterInterfaces 10:5185–5195. https://doi.org/10.1021/acsami.7b15252
34. Zhang SL (2006) The investigation of plantar pressure parametersand its distribution, and influencing factors in normal Chinese.Master Dissertation, Sun Yat-sen University, Guangdong, China.
35. Veves A, Fernando DJS, Walewski P, Boulton AJM (1991) Astudy of plantar pressures in a diabetic clinic population. Foot 1:89–92. https://doi.org/10.1016/0958-2592(91)90036-B
Publisher’s note Springer Nature remains neutral with regard to jurisdic-tional claims in published maps and institutional affiliations.
2222 Int J Adv Manuf Technol (2021) 112:2211–2222