study of traffic management on congested intersections, by
TRANSCRIPT

Copyright: © the author(s), publisher and licensee Technoscience Academy. This is an open-access article distributed under the
terms of the Creative Commons Attribution Non-Commercial License, which permits unrestricted non-commercial use,
distribution, and reproduction in any medium, provided the original work is properly cited
International Journal of Scientific Research in Science and Technology
Print ISSN: 2395-6011 | Online ISSN: 2395-602X (www.ijsrst.com)
doi : https://doi.org/10.32628/IJSRST1218247
301
Study of Traffic Management on Congested Intersections, By Redesign of Signal
Saurabh Sayre *1, Dr. Prafull Wadhai2, Dr. B. V. Khode3
*1 MTech Scholar, Transportation Engineering, G H Raisoni College of Engineering, Nagpur, Maharashtra, India 2 Associate Professor, Department of Civil Engineering, G H Raisoni College of Engineering, Nagpur,
Maharashtra, India 3Professor, Department of Civil Engineering, G H Raisoni College of Engineering, Maharashtra, India
Article Info
Volume 8, Issue 2
Page Number : 301-311
Publication Issue
March-April-2021
Article History
Accepted : 01 April 2021
Published : 03 April 2021
ABSTRACT
The use of traffic signals is the common practice in every cities having heavy
traffic volume that is on clogged intersection. The signal phases are different at
various intersections. The cycle time also differs as per traffic density at each
intersection. Out somewhere it happens that there is green signal & no vehicle
on the route and despite that somewhere there is long queue although there is
red signal. The proposed system first targets scattering any queue that was
developed during red span and reduction in travel time. This study leads to the
change in phases and redesign of present signal system, which not only gives a
reduction in the queue length but also reduces travel time and decrease in fuel
consumption. This change will positively results in improving traffic efficiency.
Keywords : Traffic, Intersection, Congestion, Queue, Signal
I. INTRODUCTION
In India traffic is a troublesome issue in such urban
zones. Road traffic is one of the major concerns in
transportation. It has been seen that introducing
impelled control methods from framework
speculation into metropolitan activity, which is
worthy over the development of the establishment in
the city, is the valuable and gainful way to deal with
improve the viability of metropolitan traffic running.
Without a doubt, traffic blockages can have genuine
unfavourable effects on people prosperity, step by
step activities and individual fulfilment, coming to
fruition into productive, regular and prosperity
inconvenience for the Governments and affiliations.
Intersection focuses are convergences of in any event
two movement streams. They have a high centrality
on account of the speed of incident event.
Accordingly, the streaming representation of activity
through them ought to be fittingly sorted out to
guarantee a made sure about drive for street clients.
Control over traffic on congested intersection has
been huge issue in crowded zone. Congestion of
traffic is paying extra time for the void roads in lights
of red signal. Once in a while it happens that on a
couple of roads straight going traffic is more than
right turning yet the signal isn't giving honest to
goodness value to that traffic, green signal grants both

International Journal of Scientific Research in Science and Technology (www.ijsrst.com) | Volume 8 | Issue 2
Saurabh Sayre et al Int J Sci Res Sci & Technol. March-April-2021, 8 (2) : 301-311
302
right and straight going together, in any case it
exhausts time for straight going traffic. [1] Mahindra
Deshmukh, et al. (2019) studied the passenger car
unit (PCU) at different traffic densities ranging from
somewhat low to clogged conditions. He found that
there is no huge distinction between the field noticed
qualities and those acquired from the model. He
further states that ‘the proposed methodology and
simulation model is authentic’.[2]Chandan K, et al.
(2017) Authors proposed a unique algorithm for
traffic state data estimation from GPS data and using
fuzzy switching linear models. The employment of
fluffy switches permits the portrayal of halfway traffic
states, which provides more precise estimation of
activity information contrasted with the traditional
hard exchanging models, and so gives the capacity to
propose better proactive and in-time choices.
[3]This paper gives the possibility of supplanting
existing traffic lights with a framework to screen the
traffic stream consequently in traffic lights where
sensors are fixed in which the time feed is made
dynamic and programmed by handling the live
recognitions.[6] The proposed calculation is
unsupervised and performs in sensible time, which
inspires its convenience in. The calculation has been
tried on open activity datasets gathered in England,
2014. The results of the trials are promising, with a
most extreme supreme relative mistake of around 9%.
Be that because it’s going to, more analyses are
required to assess the execution of the calculation
with versatile tests, either utilizing end-clients' cell
phones or GPS-prepared vehicles.
II. METHODOLOGY
According to goals and objectives, step by step
procedure adopted for this research work. The
methodology adopted will come closer to the required
results. The overall methodology is taken on the basis
of literature review.
1. Site Description
The study was conducted on the busy intersections of
Nagpur- Amravati highway, at Nagpur. Three
intersections are taken for the study which is very
congested in every peak hours. These intersections
use traffic signal located and having fixed cycle time
for each. During peak hours there is rush and suffer
from traffic jams. The image below shows the study
area. This study area is of total 2 km span. The public
transports are more on it. As it is highway connected
to the city the heavy vehicles are more and personal
cars are also the part of the traffic. This highway is
made up of flexible pavement and is of 6 lane
highway having lane width 3 meters each. The traffic
on the highway is heterogeneous like all over the
India.
Fig -1: Google Earth Image Shows Study Area
2. Work Flow Chart
The following work flow chart is referred for the
study of this particular work.

International Journal of Scientific Research in Science and Technology (www.ijsrst.com) | Volume 8 | Issue 2
Saurabh Sayre et al Int J Sci Res Sci & Technol. March-April-2021, 8 (2) : 301-311
303
Chart -1: Work Flow Chart
3. Study of Present Signal System
The use of traffic signals of incompatible streams of
vehicular and pedestrian traffic is vast in most of
towns and cities. In Nagpur particularly in this study
area the signal is fixed time signal. The Indian method
is to have an amber period of 3 seconds as and
transition interval between closing of related green
movement and display of a red and indication or
within termination of a red indication and initiation
of related green movement. Here in this study area
the green session and hence the cycle lengths are
predetermined and of fixed duration. These types of
signals are known of fixed time signals. The signal
designs of these squares are dependent on the basis of
the traffic volume count. The signal is four phase
signal and green intervals are designed by considering
the traffic volume on that particular intersection.
Fig -2: Existing Signal Phases
The phase system is shown in the figure. The left
turning in this signal is always green that is allowed.
The figure, it shows that the signal when turned into
green it allows vehicles to go towards right and
straight. The tables below shows the actual signalized
system, the present signal system is fixed time signal
time, with amber time 3 sec., at various intersections
and the phases of those signals are as shown in above
figure.
Table -1 : Existing Signal Intervals in Seconds
4. Data Collection
The traffic using a road is composed of variety of
vehicles ranging from simple peddles cycles to the
motorcar and heavy commercial vehicles. Each type
having an influence all the performance of the road in
its own way, a simple volume count, without
classifying the vehicles into distinct types is of limited
International Journal of Scientific Research in Science and Technology (www.ijsrst.com) | Volume 8 | Issue 2
Saurabh Sayre et al Int J Sci Res Sci & Technol. March-April-2021, 8 (2) : 301-311
304
use it is therefore the normal practice to classify the
vehicles into distinct types when doing the volume
counting.
There are various types or methods of volume count
such as
• Manual methods
• Combination of Manual and Mechanical methods
• Automatic devices
• Moving Observer method
• Photographic methods
After studying all the types of data collection method
the data collected for this work is by manual method,
this method is preferred because it gives vehicle
classification details with number of occupants; the
data can be collected giving the details of traffic
movement in each direction; specific vehicular
moment such as left turns, right turns, straight ahead
at a junction can be noted and recorded. Manual
method enables any unusual conditions obtaining at
the time of count to be recorded. This will help in
understanding and analysing the traffic characteristics.
Such unusual conditions can be adverse weather
conditions traffic breakdown, temporary closer of any
length of the highway for maintenance operations etc.
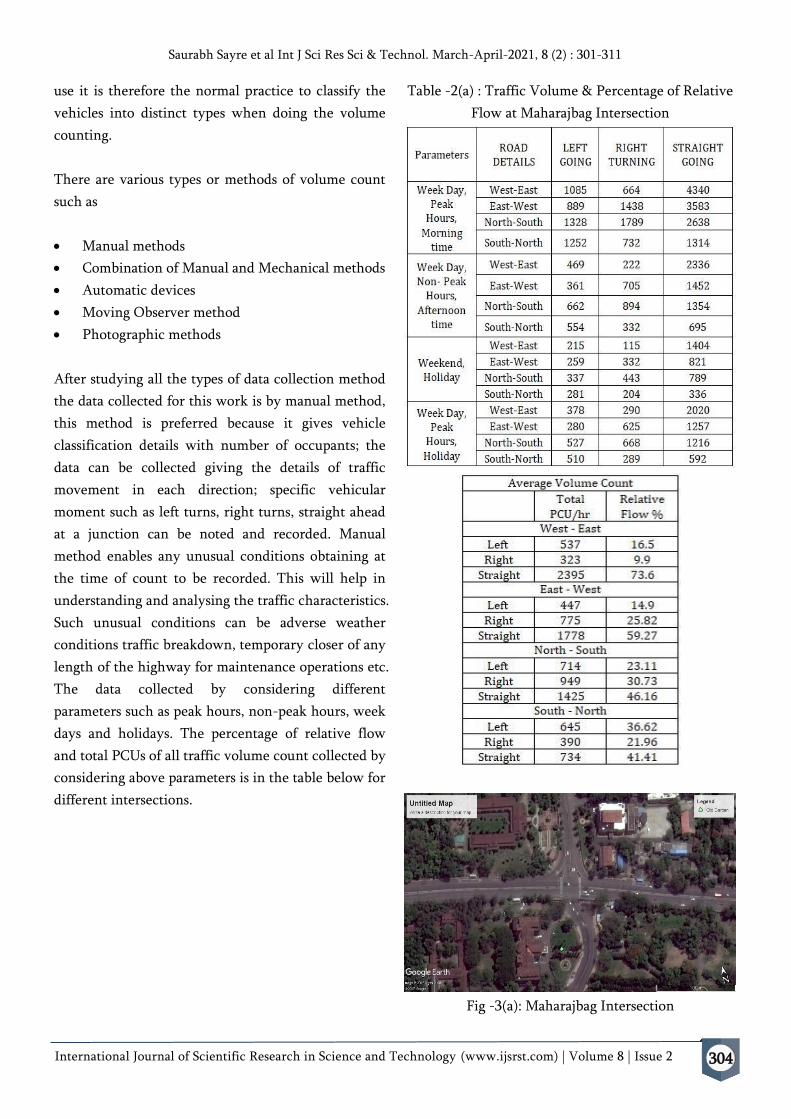
The data collected by considering different
parameters such as peak hours, non-peak hours, week
days and holidays. The percentage of relative flow
and total PCUs of all traffic volume count collected by
considering above parameters is in the table below for
different intersections.
Table -2(a) : Traffic Volume & Percentage of Relative
Flow at Maharajbag Intersection
Fig -3(a): Maharajbag Intersection
International Journal of Scientific Research in Science and Technology (www.ijsrst.com) | Volume 8 | Issue 2
Saurabh Sayre et al Int J Sci Res Sci & Technol. March-April-2021, 8 (2) : 301-311
305
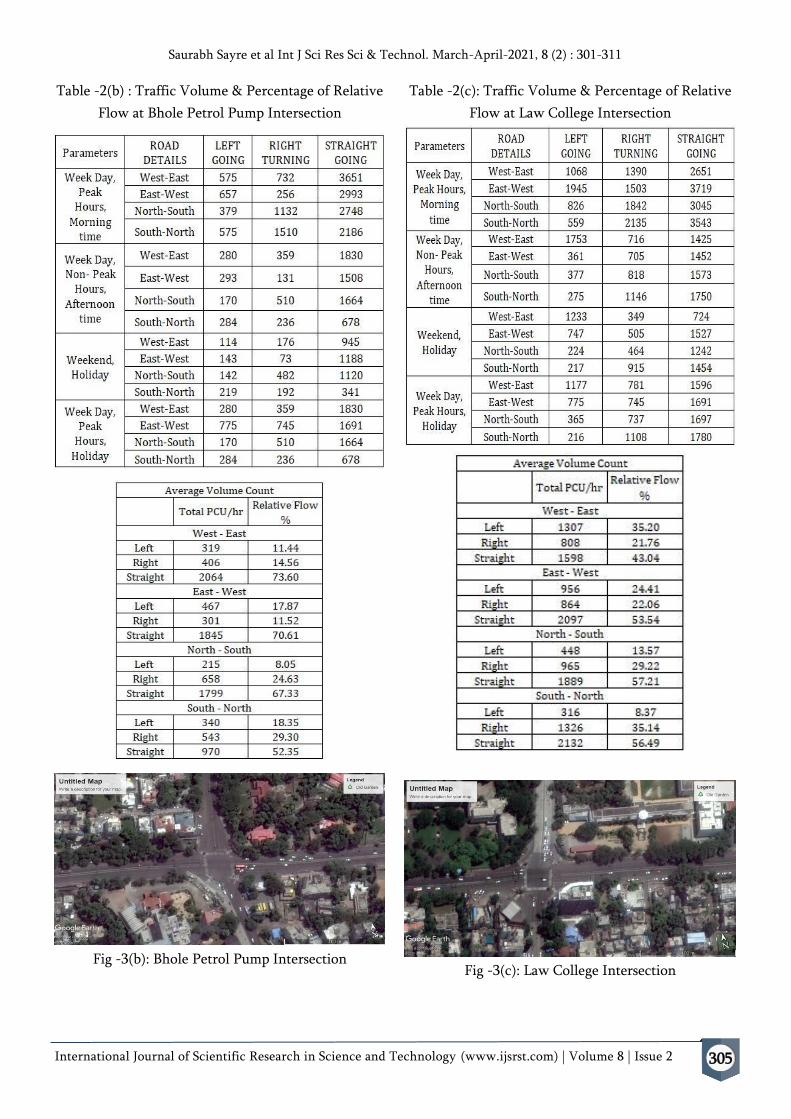
Table -2(b) : Traffic Volume & Percentage of Relative
Flow at Bhole Petrol Pump Intersection
Fig -3(b): Bhole Petrol Pump Intersection
Table -2(c): Traffic Volume & Percentage of Relative
Flow at Law College Intersection
Fig -3(c): Law College Intersection
International Journal of Scientific Research in Science and Technology (www.ijsrst.com) | Volume 8 | Issue 2
Saurabh Sayre et al Int J Sci Res Sci & Technol. March-April-2021, 8 (2) : 301-311
306
5. Need for Re-Design
The above traffic volume count gives information
about the volume per hour in PCU’s and it is clear
from data collection is that the straight going traffic is
more at all the intersections and as compared to that
the right going traffic is very less. Because of less
volume of right going traffic and that signal phases it
causes delay for the straight going traffic. The delay is
occurring for the every straight going traffic at every
intersection. To avoid this delay it is necessary to
redesign those signals as per current requirements.
The change in the phases is also needed. The present
signal system is causing the avoidable delay. For the
fixed time signals we have to require careful settings.
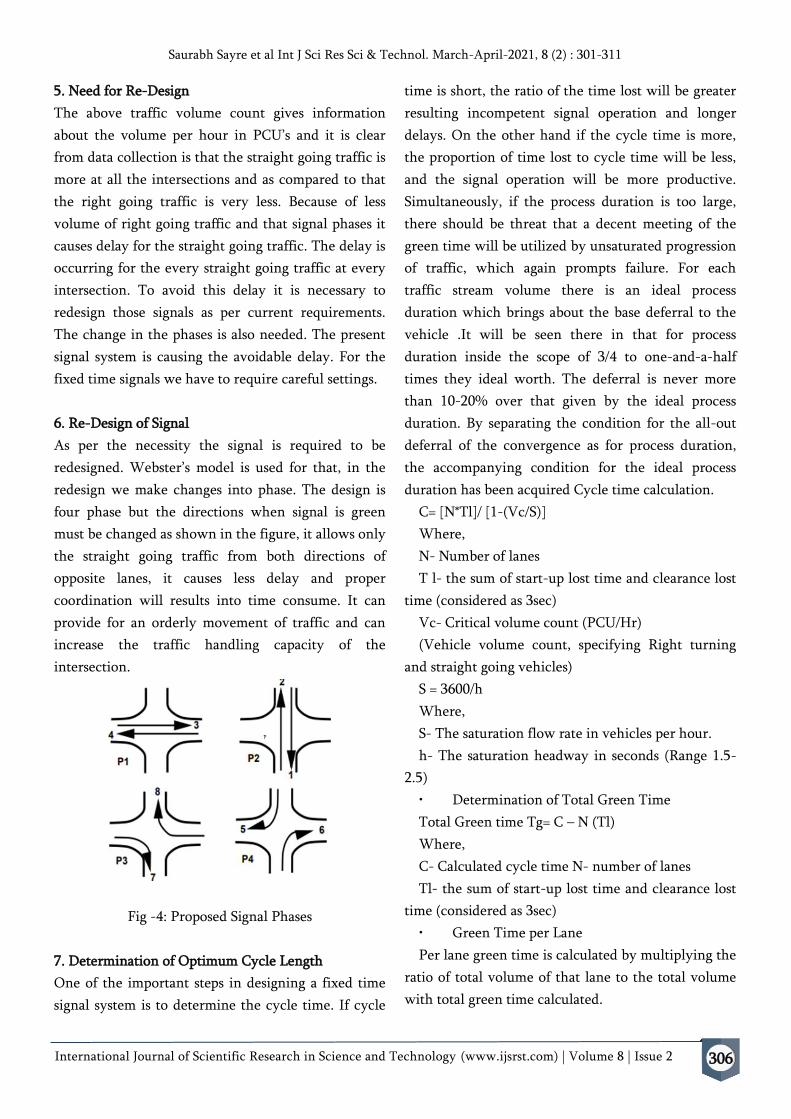
6. Re-Design of Signal
As per the necessity the signal is required to be
redesigned. Webster’s model is used for that, in the
redesign we make changes into phase. The design is
four phase but the directions when signal is green
must be changed as shown in the figure, it allows only
the straight going traffic from both directions of
opposite lanes, it causes less delay and proper
coordination will results into time consume. It can
provide for an orderly movement of traffic and can
increase the traffic handling capacity of the
intersection.
Fig -4: Proposed Signal Phases
7. Determination of Optimum Cycle Length
One of the important steps in designing a fixed time
signal system is to determine the cycle time. If cycle
time is short, the ratio of the time lost will be greater
resulting incompetent signal operation and longer
delays. On the other hand if the cycle time is more,
the proportion of time lost to cycle time will be less,
and the signal operation will be more productive.
Simultaneously, if the process duration is too large,
there should be threat that a decent meeting of the
green time will be utilized by unsaturated progression
of traffic, which again prompts failure. For each
traffic stream volume there is an ideal process
duration which brings about the base deferral to the
vehicle .It will be seen there in that for process
duration inside the scope of 3/4 to one-and-a-half
times they ideal worth. The deferral is never more
than 10-20% over that given by the ideal process
duration. By separating the condition for the all-out
deferral of the convergence as for process duration,
the accompanying condition for the ideal process
duration has been acquired Cycle time calculation.
C= [N*Tl]/ [1-(Vc/S)]
Where,
N- Number of lanes
T l- the sum of start-up lost time and clearance lost
time (considered as 3sec)
Vc- Critical volume count (PCU/Hr)
(Vehicle volume count, specifying Right turning
and straight going vehicles)
S = 3600/h
Where,
S- The saturation flow rate in vehicles per hour.
h- The saturation headway in seconds (Range 1.5-
2.5)
• Determination of Total Green Time
Total Green time Tg= C – N (Tl)
Where,
C- Calculated cycle time N- number of lanes
Tl- the sum of start-up lost time and clearance lost
time (considered as 3sec)
• Green Time per Lane
Per lane green time is calculated by multiplying the
ratio of total volume of that lane to the total volume
with total green time calculated.

International Journal of Scientific Research in Science and Technology (www.ijsrst.com) | Volume 8 | Issue 2
Saurabh Sayre et al Int J Sci Res Sci & Technol. March-April-2021, 8 (2) : 301-311
307
G1= (Vc1/Vc)*Tg
By following the above steps the signals are
redesigned, as shown in the table below for the
particular intersections.
Table -3: Re-designed Signal Intervals in Seconds
8. Modeling And Simulation
According to our study we have examined that PTV
VISSIM is an ideal tool and we have used it for our
work. The ‘Google Earth’ software is also used for the
background image of the particular intersection. The
following steps are followed for the modelling of the
signals at these intersections for the present signal
system and the proposed signal system.
8.1 Background Image
Using “Google Earth” software from Google, the
background image of the intersection and overall
study area is presented in the image format. These
images are used for the VISSIM simulations. The
image below is showing the study with span 2 km.
Fig -5(a): Study Area, ‘Google Earth’ Image
8.2 Link Formation
After inserting the background image on the VISSIM
software, the links which are shown on that
particular image are dragged by using the tool “link”
on the tool bar option. The roads are dragged with the
measured lane width and number of lanes. At
intersection all the four lanes are connected by the
connections and links are formed with all the details.
Fig -5(b): Links Formed on VISSIM Software
8.3 Vehicle Inputs and Routing
The vehicle input is given at the left side roads,
according to the data collected in the format of
Relative flow. The relative flow will differ from the
vehicle routes and vehicle types. All the vehicle input
is in PCUs/hr. After the vehicle input the routes are
specified on the drawn links accordingly. Relative
Flow for the vehicle routes is the ration of left going
or straight going or right turning vehicles to the total
vehicles in PCUs. In the same way the relative flow
for the types of vehicle is also the ratio of type of
vehicle to the total number of vehicles. The relative
flow is the ratio, has no unit but also can be
considered in percentage.
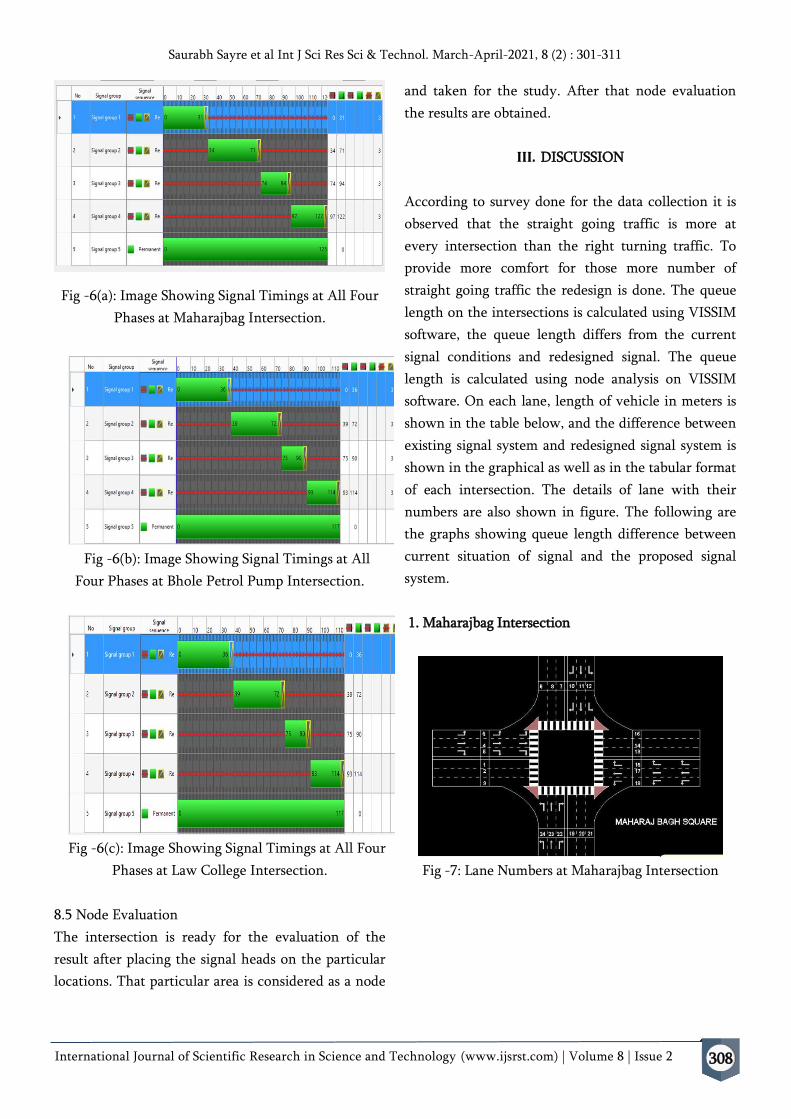
8.4 Signal Program
The signal is designed manually and implemented on
VISSIM software, the phases are considered in the
given format. The signal design is mainly depend
upon the cycle time and the green intervals. The
amber time is 3 sec for all the intersection. Following
are the images showing the signal phase design.
International Journal of Scientific Research in Science and Technology (www.ijsrst.com) | Volume 8 | Issue 2
Saurabh Sayre et al Int J Sci Res Sci & Technol. March-April-2021, 8 (2) : 301-311
308
Fig -6(a): Image Showing Signal Timings at All Four
Phases at Maharajbag Intersection.
Fig -6(b): Image Showing Signal Timings at All
Four Phases at Bhole Petrol Pump Intersection.
Fig -6(c): Image Showing Signal Timings at All Four
Phases at Law College Intersection.
8.5 Node Evaluation
The intersection is ready for the evaluation of the
result after placing the signal heads on the particular
locations. That particular area is considered as a node
and taken for the study. After that node evaluation
the results are obtained.
III. DISCUSSION
According to survey done for the data collection it is
observed that the straight going traffic is more at
every intersection than the right turning traffic. To
provide more comfort for those more number of
straight going traffic the redesign is done. The queue
length on the intersections is calculated using VISSIM
software, the queue length differs from the current
signal conditions and redesigned signal. The queue
length is calculated using node analysis on VISSIM
software. On each lane, length of vehicle in meters is
shown in the table below, and the difference between
existing signal system and redesigned signal system is
shown in the graphical as well as in the tabular format
of each intersection. The details of lane with their
numbers are also shown in figure. The following are
the graphs showing queue length difference between
current situation of signal and the proposed signal
system.
1. Maharajbag Intersection
Fig -7: Lane Numbers at Maharajbag Intersection
International Journal of Scientific Research in Science and Technology (www.ijsrst.com) | Volume 8 | Issue 2
Saurabh Sayre et al Int J Sci Res Sci & Technol. March-April-2021, 8 (2) : 301-311
309
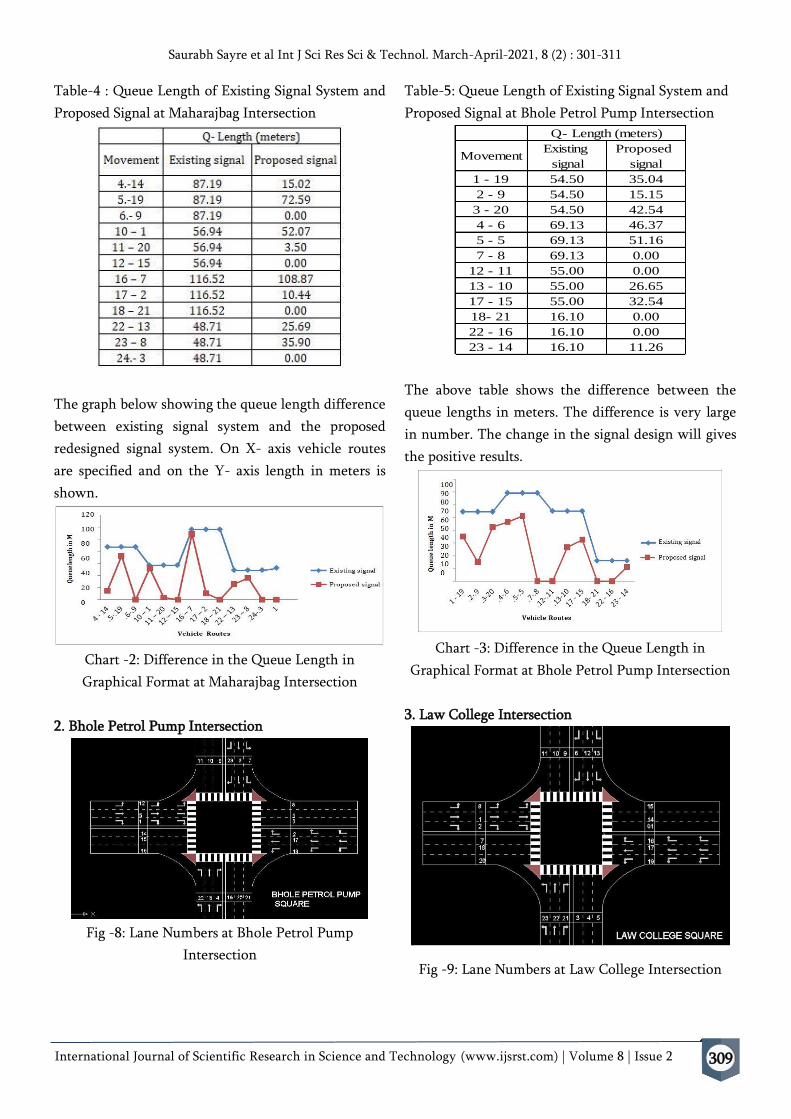
Table-4 : Queue Length of Existing Signal System and
Proposed Signal at Maharajbag Intersection
The graph below showing the queue length difference
between existing signal system and the proposed
redesigned signal system. On X- axis vehicle routes
are specified and on the Y- axis length in meters is
shown.
Chart -2: Difference in the Queue Length in
Graphical Format at Maharajbag Intersection
2. Bhole Petrol Pump Intersection
Fig -8: Lane Numbers at Bhole Petrol Pump
Intersection
Table-5: Queue Length of Existing Signal System and
Proposed Signal at Bhole Petrol Pump Intersection
The above table shows the difference between the
queue lengths in meters. The difference is very large
in number. The change in the signal design will gives
the positive results.
Chart -3: Difference in the Queue Length in
Graphical Format at Bhole Petrol Pump Intersection
3. Law College Intersection
Fig -9: Lane Numbers at Law College Intersection
MovementExisting
signal
Proposed
signal
1 - 19 54.50 35.04
2 - 9 54.50 15.15
3 - 20 54.50 42.54
4 - 6 69.13 46.37
5 - 5 69.13 51.16
7 - 8 69.13 0.00
12 - 11 55.00 0.00
13 - 10 55.00 26.65
17 - 15 55.00 32.54
18- 21 16.10 0.00
22 - 16 16.10 0.00
23 - 14 16.10 11.26
Q- Length (meters)
International Journal of Scientific Research in Science and Technology (www.ijsrst.com) | Volume 8 | Issue 2
Saurabh Sayre et al Int J Sci Res Sci & Technol. March-April-2021, 8 (2) : 301-311
310
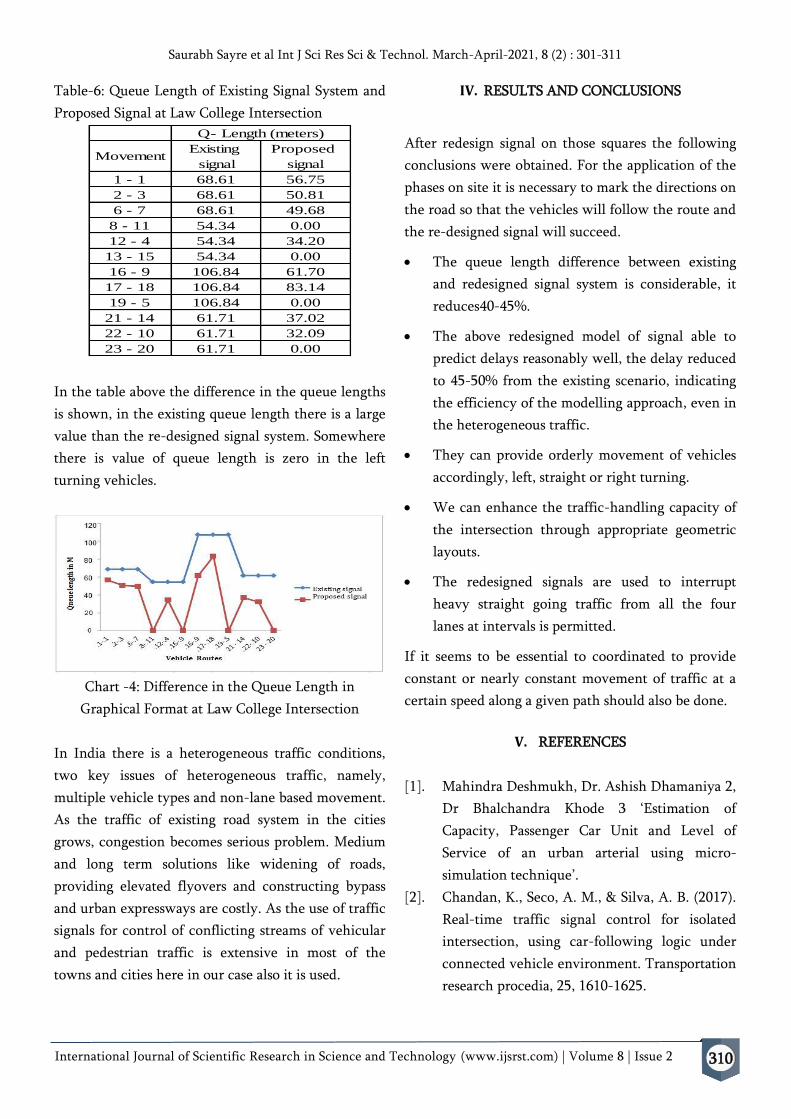
Table-6: Queue Length of Existing Signal System and
Proposed Signal at Law College Intersection
In the table above the difference in the queue lengths
is shown, in the existing queue length there is a large
value than the re-designed signal system. Somewhere
there is value of queue length is zero in the left
turning vehicles.
Chart -4: Difference in the Queue Length in
Graphical Format at Law College Intersection
In India there is a heterogeneous traffic conditions,
two key issues of heterogeneous traffic, namely,
multiple vehicle types and non-lane based movement.
As the traffic of existing road system in the cities
grows, congestion becomes serious problem. Medium
and long term solutions like widening of roads,
providing elevated flyovers and constructing bypass
and urban expressways are costly. As the use of traffic
signals for control of conflicting streams of vehicular
and pedestrian traffic is extensive in most of the
towns and cities here in our case also it is used.
IV. RESULTS AND CONCLUSIONS
After redesign signal on those squares the following
conclusions were obtained. For the application of the
phases on site it is necessary to mark the directions on
the road so that the vehicles will follow the route and
the re-designed signal will succeed.
• The queue length difference between existing
and redesigned signal system is considerable, it
reduces40-45%.
• The above redesigned model of signal able to
predict delays reasonably well, the delay reduced
to 45-50% from the existing scenario, indicating
the efficiency of the modelling approach, even in
the heterogeneous traffic.
• They can provide orderly movement of vehicles
accordingly, left, straight or right turning.
• We can enhance the traffic-handling capacity of
the intersection through appropriate geometric
layouts.
• The redesigned signals are used to interrupt
heavy straight going traffic from all the four
lanes at intervals is permitted.
If it seems to be essential to coordinated to provide
constant or nearly constant movement of traffic at a
certain speed along a given path should also be done.
V. REFERENCES
[1]. Mahindra Deshmukh, Dr. Ashish Dhamaniya 2,
Dr Bhalchandra Khode 3 ‘Estimation of
Capacity, Passenger Car Unit and Level of
Service of an urban arterial using micro-
simulation technique’.
[2]. Chandan, K., Seco, A. M., & Silva, A. B. (2017).
Real-time traffic signal control for isolated
intersection, using car-following logic under
connected vehicle environment. Transportation
research procedia, 25, 1610-1625.
MovementExisting
signal
Proposed
signal
1 - 1 68.61 56.75
2 - 3 68.61 50.81
6 - 7 68.61 49.68
8 - 11 54.34 0.00
12 - 4 54.34 34.20
13 - 15 54.34 0.00
16 - 9 106.84 61.70
17 - 18 106.84 83.14
19 - 5 106.84 0.00
21 - 14 61.71 37.02
22 - 10 61.71 32.09
23 - 20 61.71 0.00
Q- Length (meters)
International Journal of Scientific Research in Science and Technology (www.ijsrst.com) | Volume 8 | Issue 2
Saurabh Sayre et al Int J Sci Res Sci & Technol. March-April-2021, 8 (2) : 301-311
311
[3]. Sharma, I., & Pardeep, K. G. (2015). Study of
automatic traffic signal system for chandigarh.
[4]. Ali, M. H., Kurokawa, S., & Shafie, A. A. (2013).
Autonomous road surveillance system: A
proposed model for vehicle detection and traffic
signal control. Procedia Computer Science, 19,
963-970.
[5]. Siddharth, S. M. P., & Ramadurai, G. (2013).
Calibration of VISSIM for Indian heterogeneous
traffic conditions. Procedia-Social and
Behavioral Sciences, 104, 380-389.
[6]. Bhatkar, A. A., Patil, M. P., & Gulghane, M. A.
A. Comparative study of Traffic Management
using Traffic Signal Automations at Signalized
Intersections on Congested Highway.
[7]. IRC 93:1985 Guidelines for Design of Signalized
Road Intersections, Indian Roads Congress,
New Delhi, India, 1985
[8]. Specification for road traffic signals, IS: 7537-
1974, Indian Standard institution, New Delhi,
1975.
Cite this article as :
Saurabh Sayre, Dr. Prafull Wadhai, Dr. B. V. Khode,
"Study of Traffic Management on Congested
Intersections, By Redesign of Signal", International
Journal of Scientific Research in Science and
Technology (IJSRST), Online ISSN : 2395-602X, Print
ISSN : 2395-6011, Volume 8 Issue 2, pp. 301-311,
March-April 2021. Available at
doi : https://doi.org/10.32628/IJSRST1218247
Journal URL : https://ijsrst.com/IJSRST1218247